
zod_gojo
31 Публикации

zod_gojo
Jutt 🖤
Открытая сделка
Трейдер с регулярными сделками
1.6 г
38 подписок(и/а)
424 подписчиков(а)
582 понравилось
Посты
Портфель
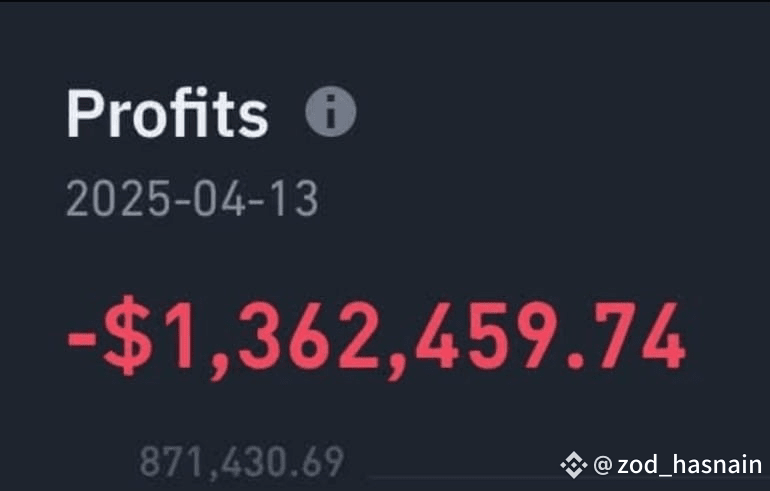
I JUST LOST ALL MY MONEY ON $OM
FULLY WIPED OUT. EVERYTHING GONE 😢
FULLY WIPED OUT. EVERYTHING GONE 😢
ETH – Watching the Falling Channel!
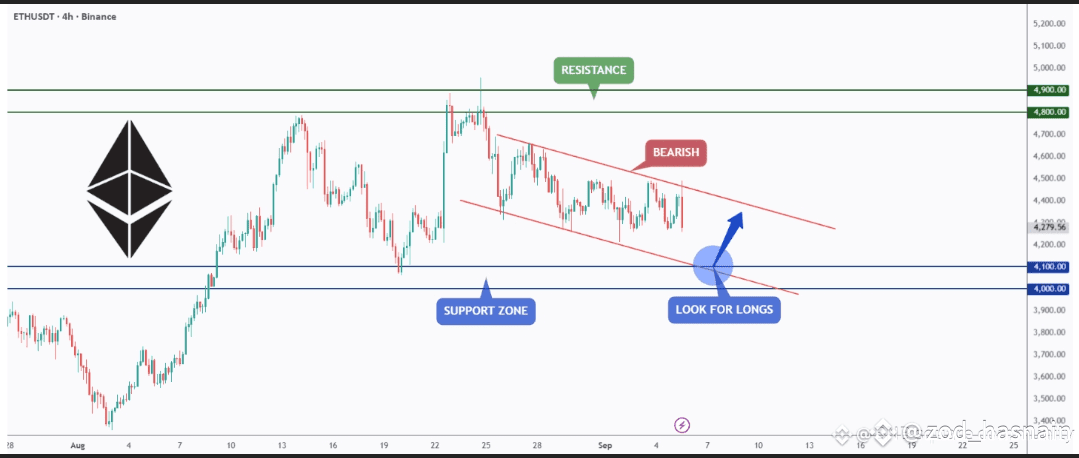
Ethereum is currently trading within a falling channel on the 4H timeframe, showing short-term bearish pressure.
Price is approaching the support zone around the $4,000–$4,100 area, which also aligns with the lower boundary of the channel.
As long as this zone holds, it could act as a springboard for bullish momentum, offering a potential long setup.
A breakout from the channel would further confirm buyer strength and open the way toward the resistance zone near $4,800–$4,900.
⚠️ Disclaimer: This is not financial advice. Always do your own research and manage risk properly.
Ethereum is currently trading within a falling channel on the 4H timeframe, showing short-term bearish pressure.
Price is approaching the support zone around the $4,000–$4,100 area, which also aligns with the lower boundary of the channel.
As long as this zone holds, it could act as a springboard for bullish momentum, offering a potential long setup.
A breakout from the channel would further confirm buyer strength and open the way toward the resistance zone near $4,800–$4,900.
⚠️ Disclaimer: This is not financial advice. Always do your own research and manage risk properly.
🚨 Market Update 🚨
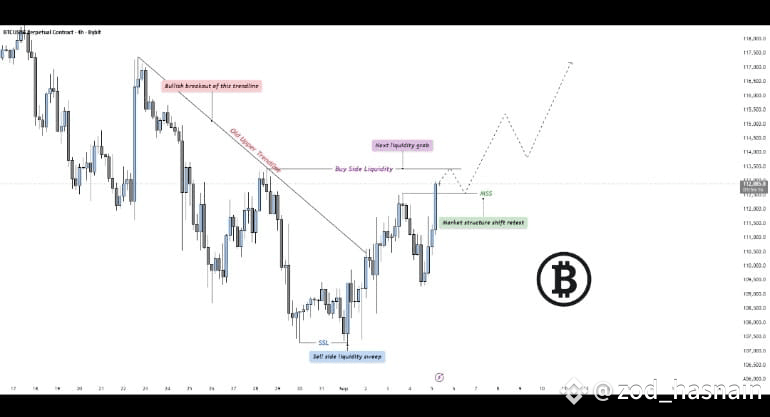
The crypto market is red today 🔻, but smart traders know this is not panic time — it’s opportunity time! 💎
When the market dips, it gives us the chance to pick quality coins at cheaper prices 🛒✨.
Red candles don’t mean danger — they mean discount! 🟥➡️🟩
History shows that after every dip, strong bounce backs follow 📈🔥.
Patience + strategy = profits in the long run 💰.
Don’t let fear control you ❌, let discipline guide you ✅.
Always buy wisely, set stop losses, and hold with confidence 🛡️.
This dip is not the end — it’s just the beginning of the next rally 🚀.
$BTC $ETH $BNB #BuyTheDip #CryptoMarket #hold #AltSeason
The crypto market is red today 🔻, but smart traders know this is not panic time — it’s opportunity time! 💎
When the market dips, it gives us the chance to pick quality coins at cheaper prices 🛒✨.
Red candles don’t mean danger — they mean discount! 🟥➡️🟩
History shows that after every dip, strong bounce backs follow 📈🔥.
Patience + strategy = profits in the long run 💰.
Don’t let fear control you ❌, let discipline guide you ✅.
Always buy wisely, set stop losses, and hold with confidence 🛡️.
This dip is not the end — it’s just the beginning of the next rally 🚀.
$BTC $ETH $BNB #BuyTheDip #CryptoMarket #hold #AltSeason

How to Read a Crypto Chart in 5 Minutes
When you first open a crypto chart, all the lines, candles, and indicators might look confusing. But the good news is you don’t need to be a professional trader to understand the basics. With just a few simple steps, you can learn to read a crypto chart in under 5 minutes and start making smarter trading decisions.
Step 1: Understand the Candlesticks
Most crypto charts use candlestick charts instead of plain lines.
Green candle (or white): Price went up during that time frame.
Red candle (or black): Price went down.
Candle body: Shows where the price opened and closed.
Wicks (shadows): Show the highest and lowest price reached in that time frame.
Example: If Bitcoin’s candle opens at $40,000 and closes at $42,000, the candle will be green.
Step 2: Time Frames Matter
Charts can be set to different time frames:
1 Minute / 5 Minute Charts: For day traders looking at quick moves.
1 Hour / 4 Hour Charts: Good for swing trading and short-term analysis.
Daily / Weekly Charts: Best for long-term investors.
Pro tip: The bigger the time frame, the more reliable the trend.
Step 3: Spot the Trend
Ask yourself one question: Is the price moving up, down, or sideways?
Uptrend: Higher highs and higher lows (bullish).
Downtrend: Lower highs and lower lows (bearish).
Sideways (consolidation): Price moves in a range without a clear direction.
Remember: “The trend is your friend.” Don’t fight it.
Step 4: Identify Key Levels (Support & Resistance)
Support: A price level where buyers step in (floor).
Resistance: A price level where sellers take profits (ceiling).
Example: If $ETH keeps bouncing around $2,500, that’s support. If it struggles to break $3,000, that’s resistance.
These levels often decide whether the price bounces back or breaks out.
Step 5: Use Simple Indicators
You don’t need 20 indicators. Start with the basics:
Moving Averages (MA): Shows average price over time (helps spot trends).
Relative Strength Index (RSI): Measures momentum. Above 70 = overbought (price may drop). Below 30 = oversold (price may rise).
When you first open a crypto chart, all the lines, candles, and indicators might look confusing. But the good news is you don’t need to be a professional trader to understand the basics. With just a few simple steps, you can learn to read a crypto chart in under 5 minutes and start making smarter trading decisions.
Step 1: Understand the Candlesticks
Most crypto charts use candlestick charts instead of plain lines.
Green candle (or white): Price went up during that time frame.
Red candle (or black): Price went down.
Candle body: Shows where the price opened and closed.
Wicks (shadows): Show the highest and lowest price reached in that time frame.
Example: If Bitcoin’s candle opens at $40,000 and closes at $42,000, the candle will be green.
Step 2: Time Frames Matter
Charts can be set to different time frames:
1 Minute / 5 Minute Charts: For day traders looking at quick moves.
1 Hour / 4 Hour Charts: Good for swing trading and short-term analysis.
Daily / Weekly Charts: Best for long-term investors.
Pro tip: The bigger the time frame, the more reliable the trend.
Step 3: Spot the Trend
Ask yourself one question: Is the price moving up, down, or sideways?
Uptrend: Higher highs and higher lows (bullish).
Downtrend: Lower highs and lower lows (bearish).
Sideways (consolidation): Price moves in a range without a clear direction.
Remember: “The trend is your friend.” Don’t fight it.
Step 4: Identify Key Levels (Support & Resistance)
Support: A price level where buyers step in (floor).
Resistance: A price level where sellers take profits (ceiling).
Example: If $ETH keeps bouncing around $2,500, that’s support. If it struggles to break $3,000, that’s resistance.
These levels often decide whether the price bounces back or breaks out.
Step 5: Use Simple Indicators
You don’t need 20 indicators. Start with the basics:
Moving Averages (MA): Shows average price over time (helps spot trends).
Relative Strength Index (RSI): Measures momentum. Above 70 = overbought (price may drop). Below 30 = oversold (price may rise).
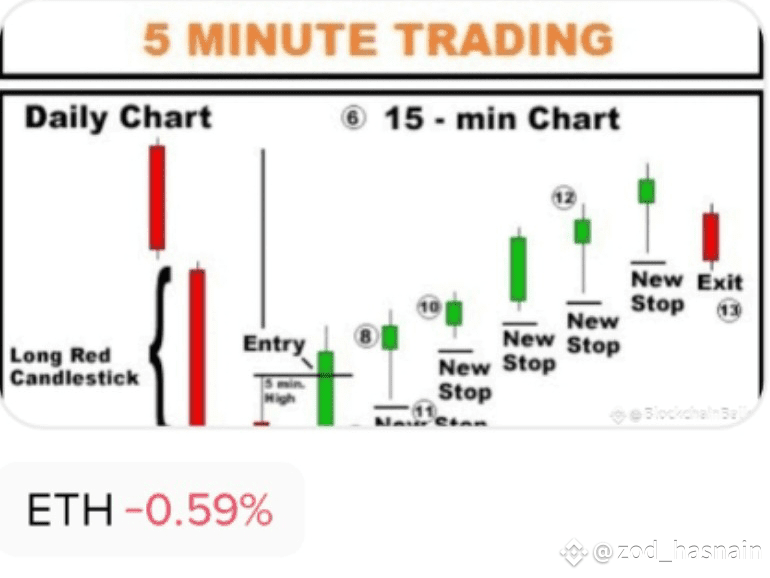
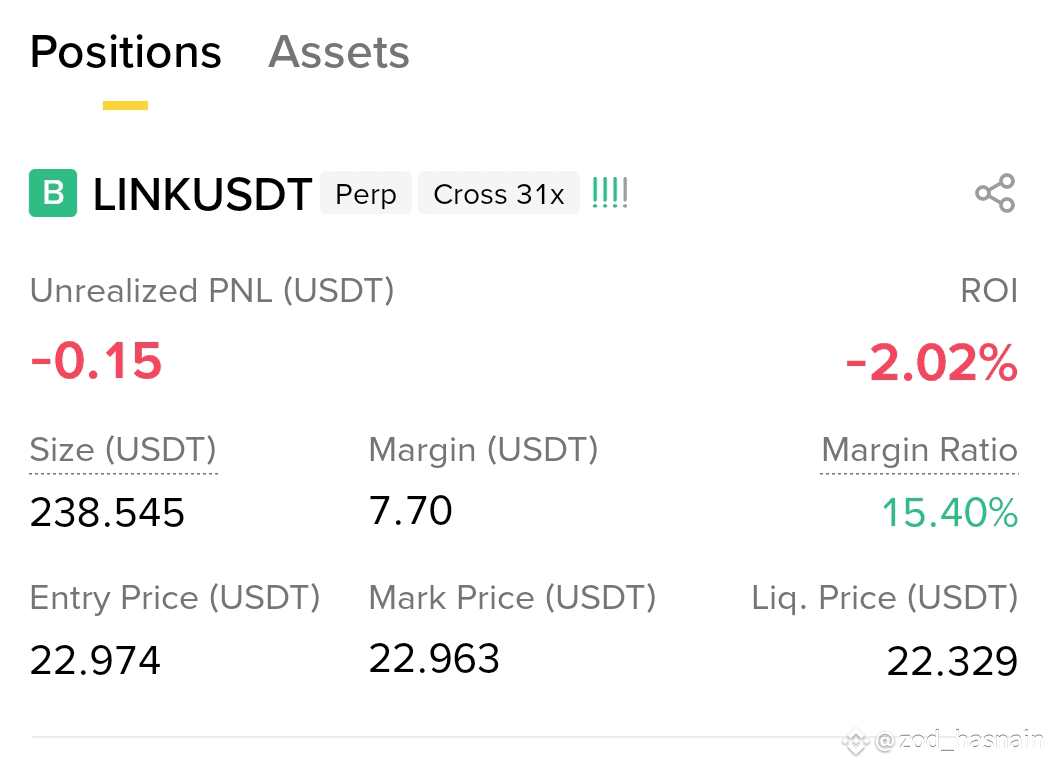
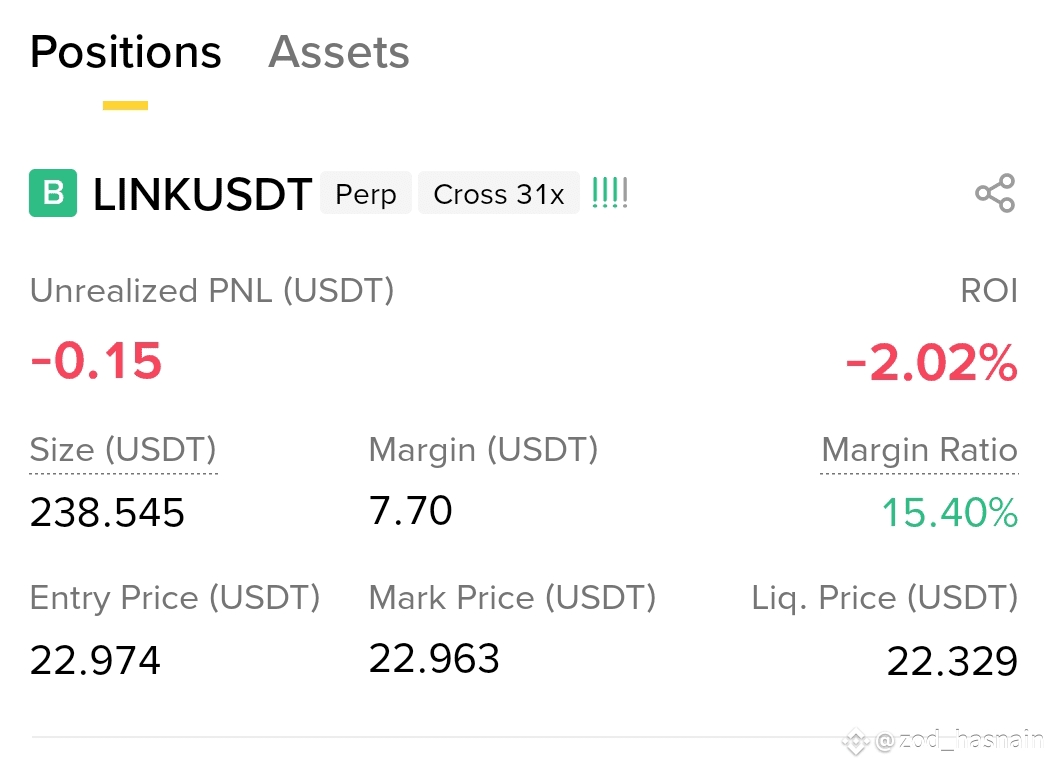
any one say its fake 🙂 chak my Profile and know its fake or real 💲🔥 $BTC $ETH $I Built $30–$50 Daily Income on Binance Without Spending Anything#Write2Earn
Many people think you need money to start earning on Binance. The truth is, I managed to create a steady income stream of $30–$50 every single day without any investment. The key is knowing which free features to use and staying consistent. Here’s exactly how I did it:
Step 1: Content Rewards on Binance Square
By sharing market updates, trading tips, and educational posts, Binance Square rewarded me with free USDT. Writing just 2 posts a day earned me between $15–$25.
Step 2: Learn and Earn Courses
Whenever a new campaign launched, I joined immediately. Each round gave me $8–$12 worth of tokens for completing short lessons and quizzes.
Step 3: Referral Income
Every time a friend signed up using my link, I received a share of their trading fees. Even a small network of referrals added another $6–$10 daily.
Step 4: Campaigns and Airdrops
Binance runs frequent quests and token promotions. Completing these pushed my daily income closer to $50 on many days.
The Bottom Line
With consistency, it’s possible to earn $900–$1,500 monthly on Binance with zero upfront money. Post, learn, refer, and join events—that’s the formula that worked for me.
Many people think you need money to start earning on Binance. The truth is, I managed to create a steady income stream of $30–$50 every single day without any investment. The key is knowing which free features to use and staying consistent. Here’s exactly how I did it:
Step 1: Content Rewards on Binance Square
By sharing market updates, trading tips, and educational posts, Binance Square rewarded me with free USDT. Writing just 2 posts a day earned me between $15–$25.
Step 2: Learn and Earn Courses
Whenever a new campaign launched, I joined immediately. Each round gave me $8–$12 worth of tokens for completing short lessons and quizzes.
Step 3: Referral Income
Every time a friend signed up using my link, I received a share of their trading fees. Even a small network of referrals added another $6–$10 daily.
Step 4: Campaigns and Airdrops
Binance runs frequent quests and token promotions. Completing these pushed my daily income closer to $50 on many days.
The Bottom Line
With consistency, it’s possible to earn $900–$1,500 monthly on Binance with zero upfront money. Post, learn, refer, and join events—that’s the formula that worked for me.

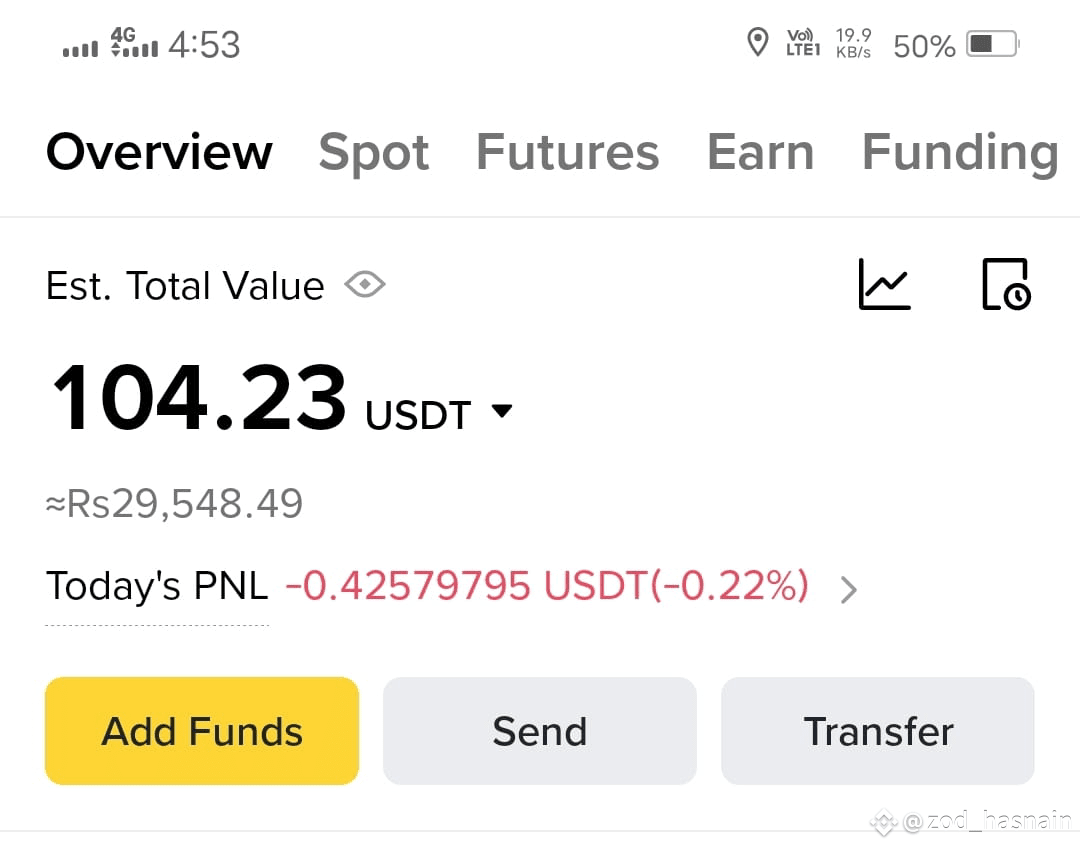
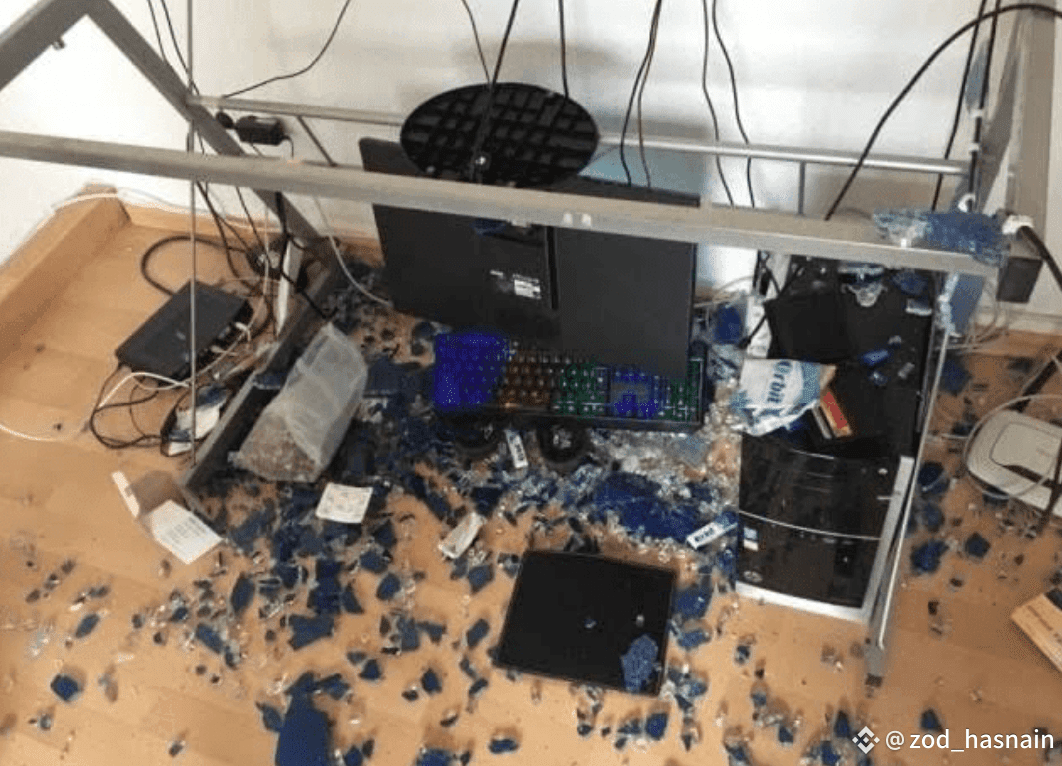
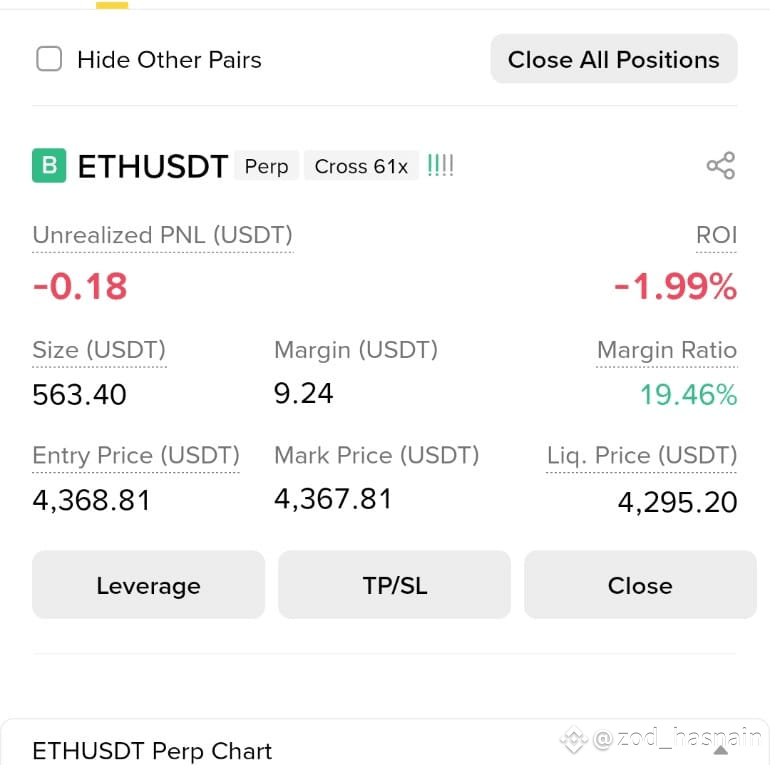
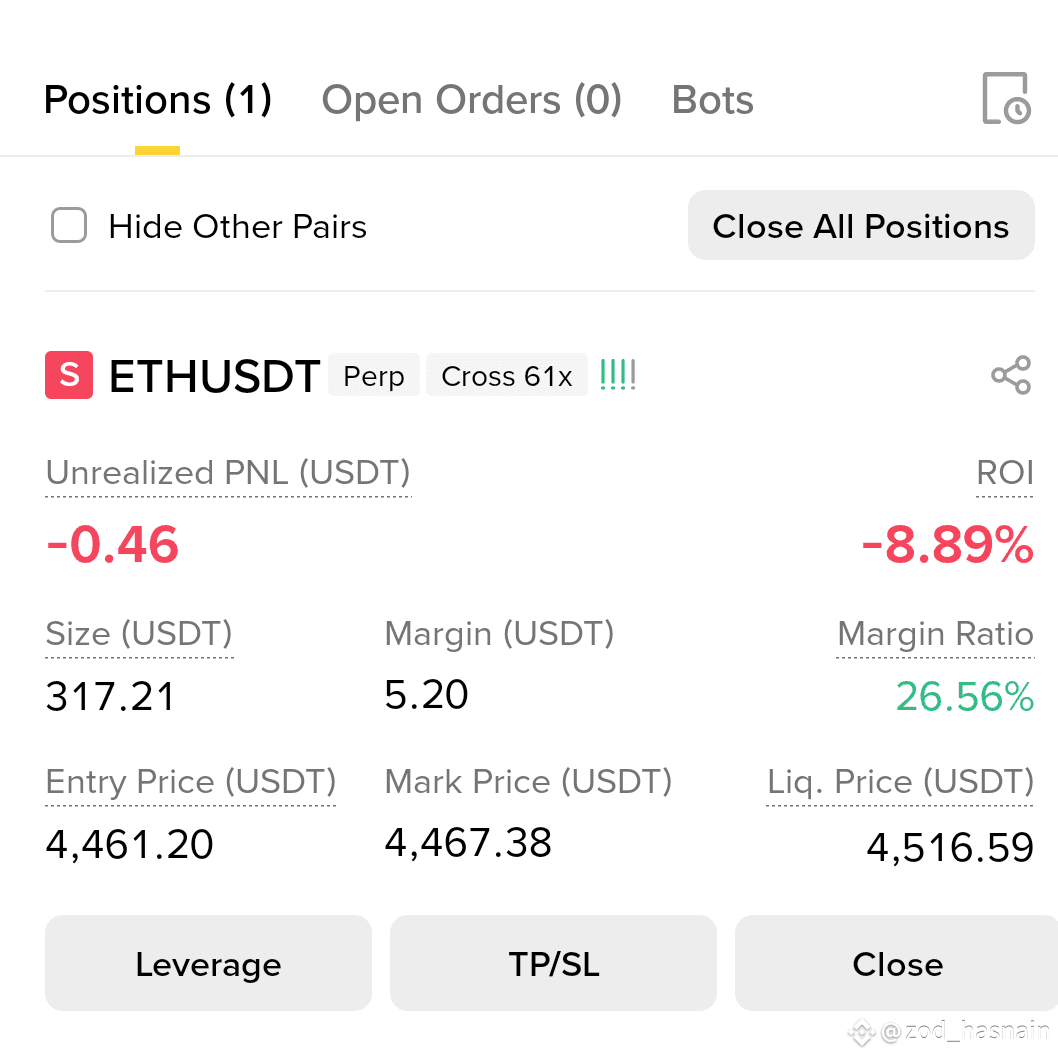
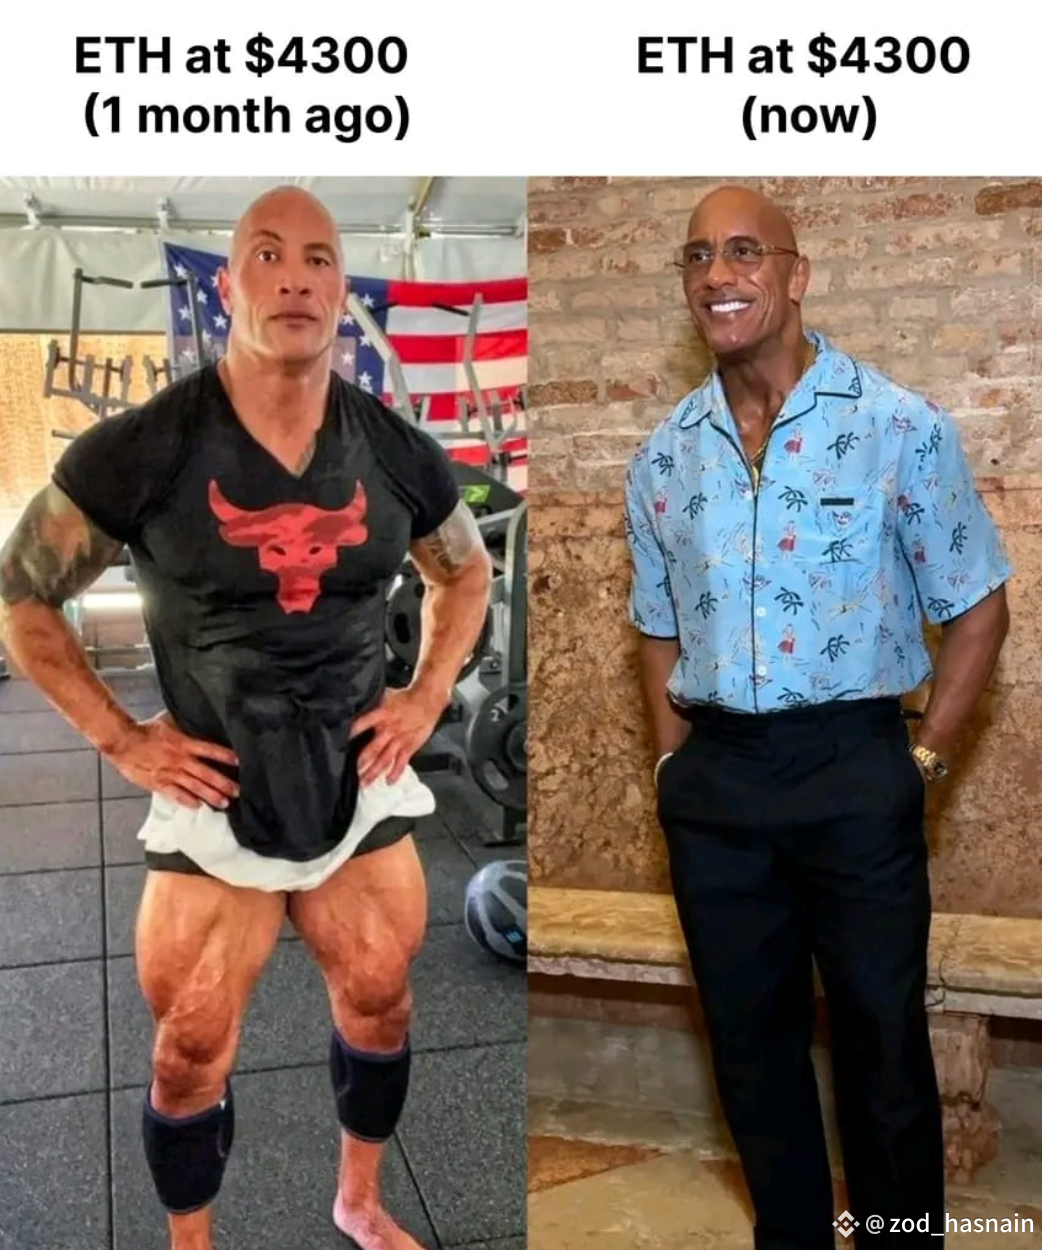
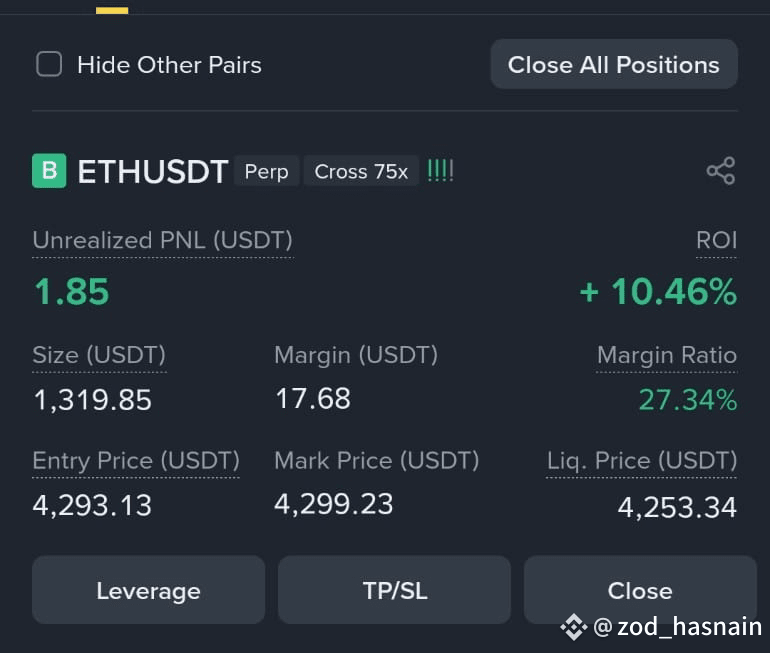
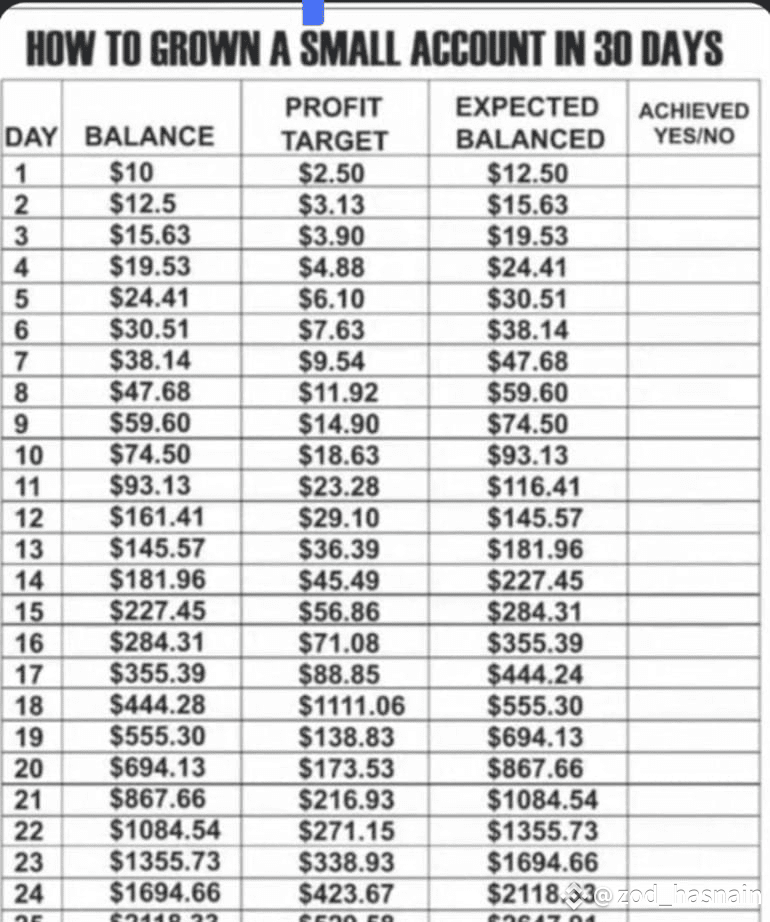
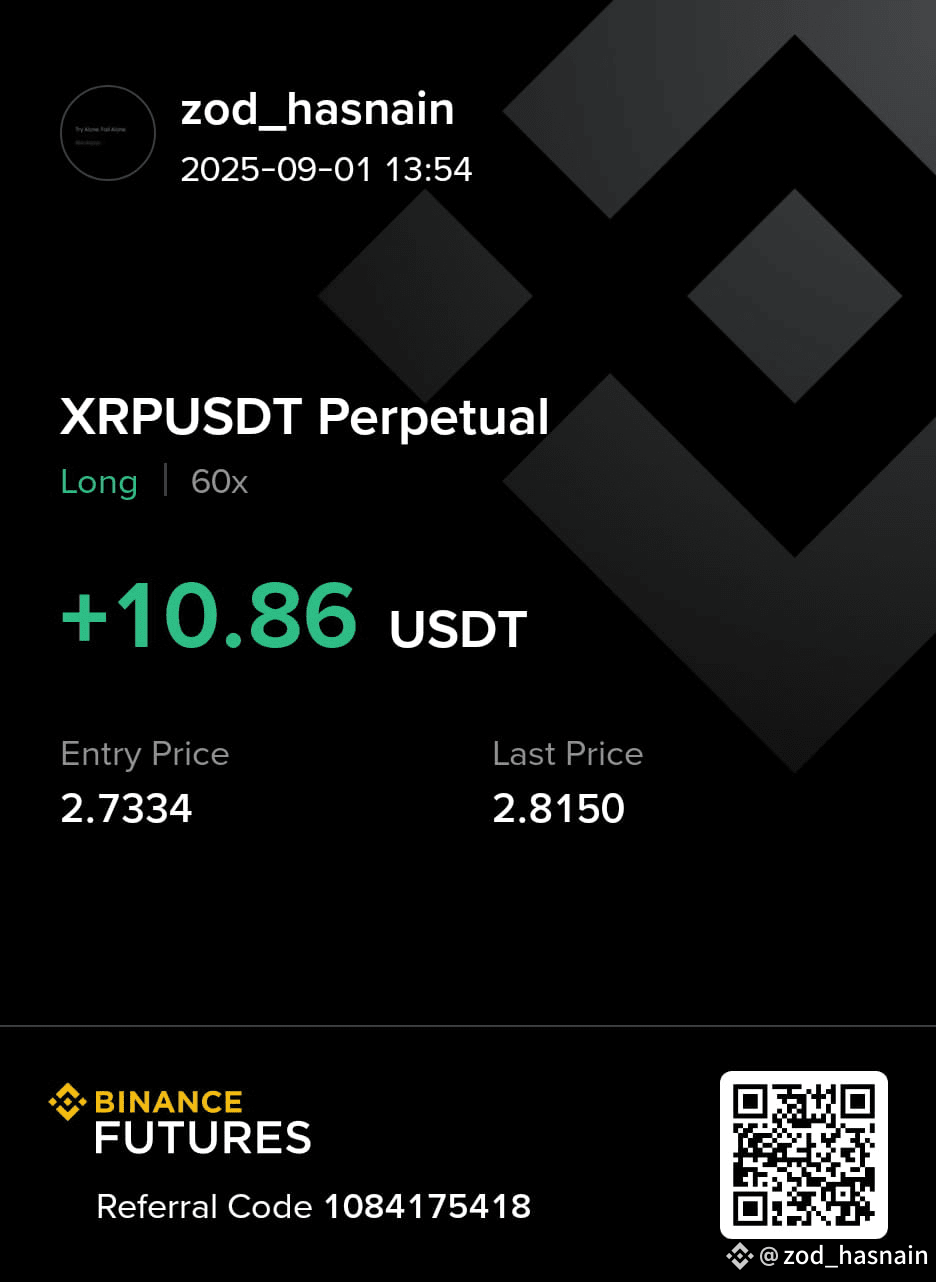
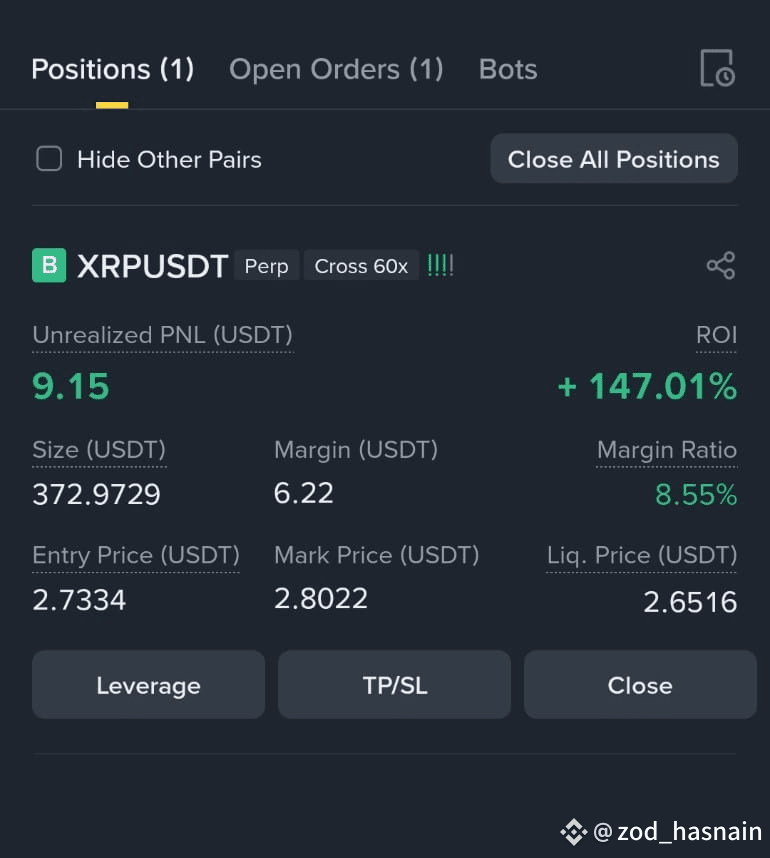
How I Turned $100 into $1,750 in Just 9 Days 🚀
I used to think this was impossible — until I pulled it off myself. 🤯
Most people believe you need big capital or years of trading experience to win in crypto. The truth? With the right strategy, mindset, and discipline, even $100 can change your journey. Here’s exactly what worked for me 👇
✅ Step 1: Start Small, Think Big
I only risked $100 — an amount I was okay losing. I treated it like a business move, not a gamble.
✅ Step 2: Pick the Right Coin at the Right Time
Instead of chasing hype, I focused on coins with:
⚡ Strong community support
⚡ Solid fundamentals
⚡ Upcoming catalysts/news
That’s how I caught my entry at the perfect moment.
✅ Step 3: Let Compounding Do the Magic 💎
I reinvested my gains strategically. Small wins stacked into bigger wins. In crypto, consistency and compounding create exponential growth.
✅ Step 4: Control the Emotions 🧠
No panic-selling on dips.
No chasing tops out of FOMO.
No fear of whales shaking me out.
I trusted my research and stayed calm — and it paid off.
🎯 The Result: $100 → $1,750 in just 9 days 🚀
The real win wasn’t just the profit. It was learning discipline, patience, and belief in the process.
✨ My Advice for You
Don’t underestimate small capital.
Knowledge > luck.
Control emotions and stay consistent.
Let compounding work for you.
If I did it, so can you. Crypto rewards the patient, prepared, and fearless.
#CryptoJourney #SmartInvesting #DisciplinePays #CryptoGrowth #RedSeptember #GoldPriceRecordHigh #USNonFarmPayrollReport #NewHighOfProfitableBTCWallets
I used to think this was impossible — until I pulled it off myself. 🤯
Most people believe you need big capital or years of trading experience to win in crypto. The truth? With the right strategy, mindset, and discipline, even $100 can change your journey. Here’s exactly what worked for me 👇
✅ Step 1: Start Small, Think Big
I only risked $100 — an amount I was okay losing. I treated it like a business move, not a gamble.
✅ Step 2: Pick the Right Coin at the Right Time
Instead of chasing hype, I focused on coins with:
⚡ Strong community support
⚡ Solid fundamentals
⚡ Upcoming catalysts/news
That’s how I caught my entry at the perfect moment.
✅ Step 3: Let Compounding Do the Magic 💎
I reinvested my gains strategically. Small wins stacked into bigger wins. In crypto, consistency and compounding create exponential growth.
✅ Step 4: Control the Emotions 🧠
No panic-selling on dips.
No chasing tops out of FOMO.
No fear of whales shaking me out.
I trusted my research and stayed calm — and it paid off.
🎯 The Result: $100 → $1,750 in just 9 days 🚀
The real win wasn’t just the profit. It was learning discipline, patience, and belief in the process.
✨ My Advice for You
Don’t underestimate small capital.
Knowledge > luck.
Control emotions and stay consistent.
Let compounding work for you.
If I did it, so can you. Crypto rewards the patient, prepared, and fearless.
#CryptoJourney #SmartInvesting #DisciplinePays #CryptoGrowth #RedSeptember #GoldPriceRecordHigh #USNonFarmPayrollReport #NewHighOfProfitableBTCWallets
Войдите, чтобы посмотреть больше материала