
EllySon85
520 Публикации

EllySon85
Digital currency advocacy & influencer / Crypto market analyst & Trader
Открытая сделка

Владелец ETH
Трейдер с частыми сделками
4 г
20 подписок(и/а)
1.2K+ подписчиков(а)
3.0K+ понравилось
Посты
Портфель
Все
Цитирования
Видео
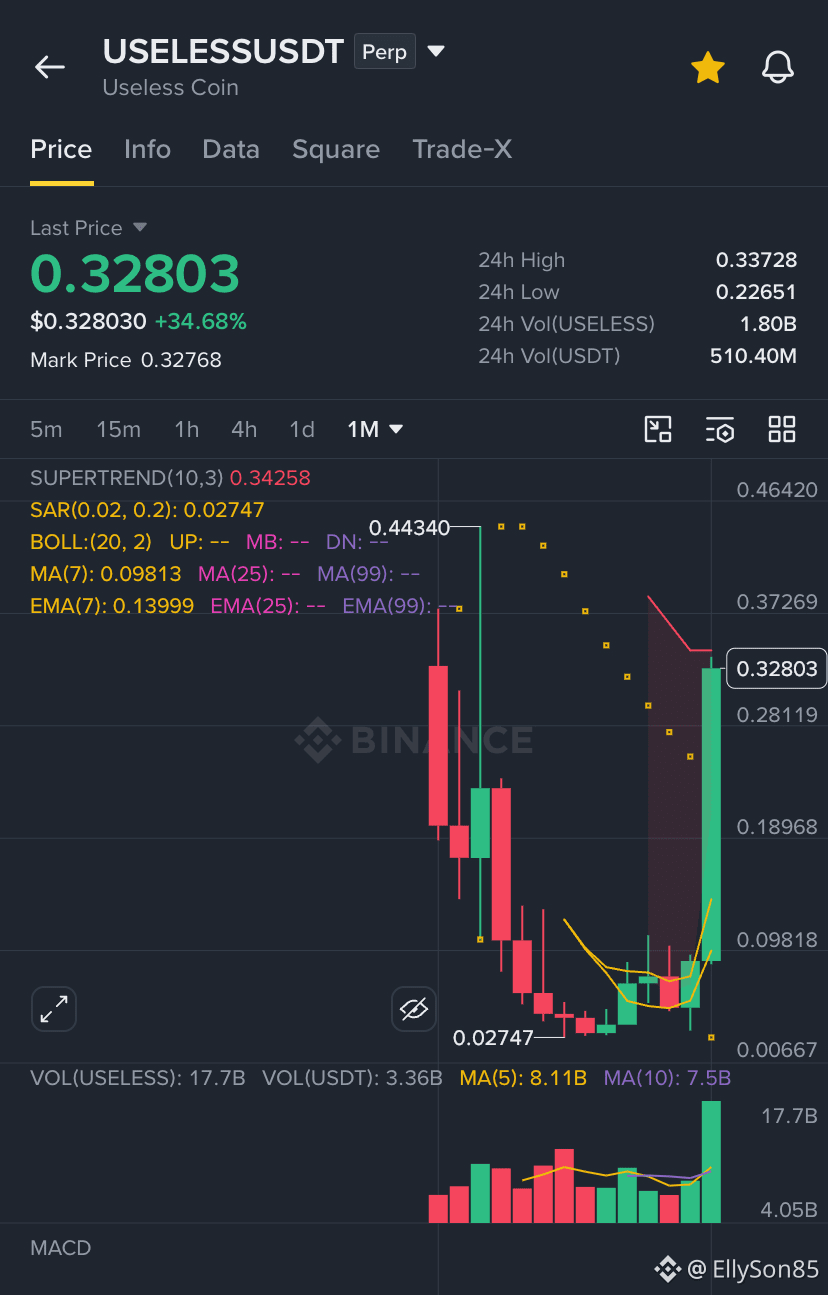
A whale who is behind this $USELESS Tokens deserves a guiness world record ✍🏾 the token as it is colled $USELESS it is pumping uselessly with no real utility ! Double Top is like nothing here🤣
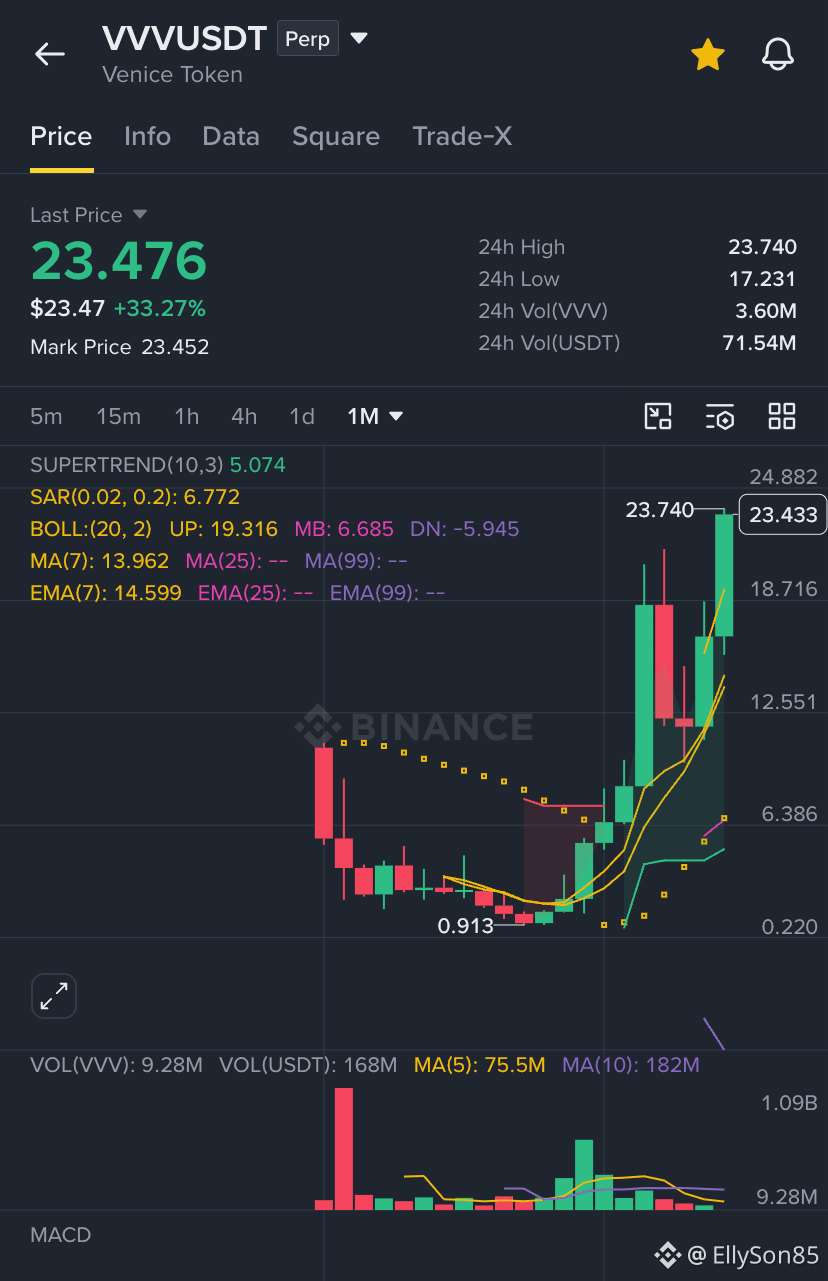
Guys , $VVV is doing what we’ve been all waiting for so lonhg , this kind of vertical lines are not known in our days ! Guys maybe there is something being prepared very soon for us !
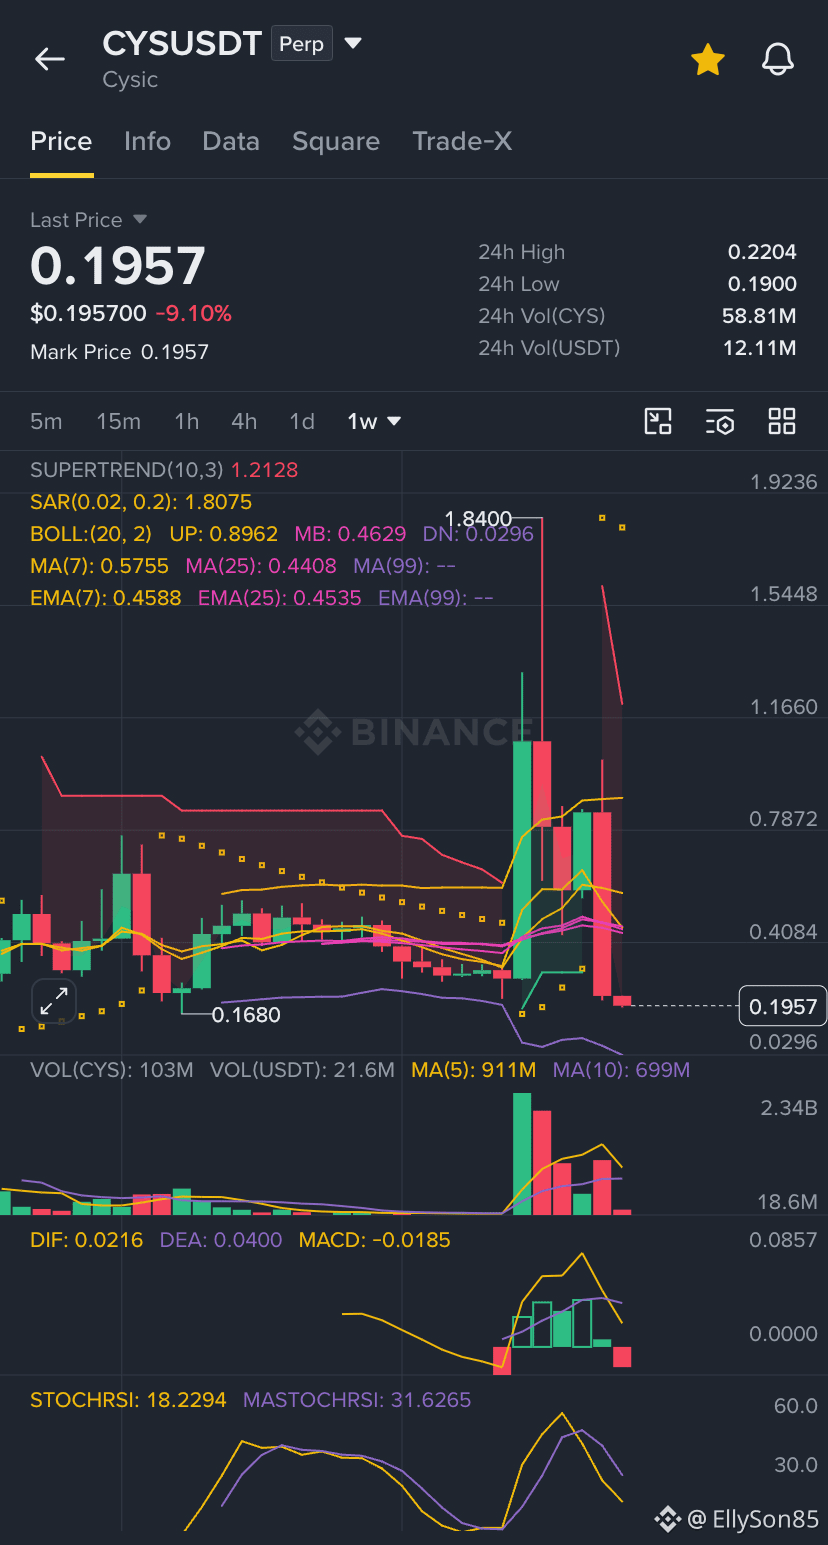
Guys , Did you know that among the tokens you are holding for more than 5 years have crashed at 99% , and on the top of that , many of them will not recover ! ☹️
What do you think when you see this?
In the coment section, send a clear message to those token owners . $MOVR
What do you think when you see this?
In the coment section, send a clear message to those token owners . $MOVR
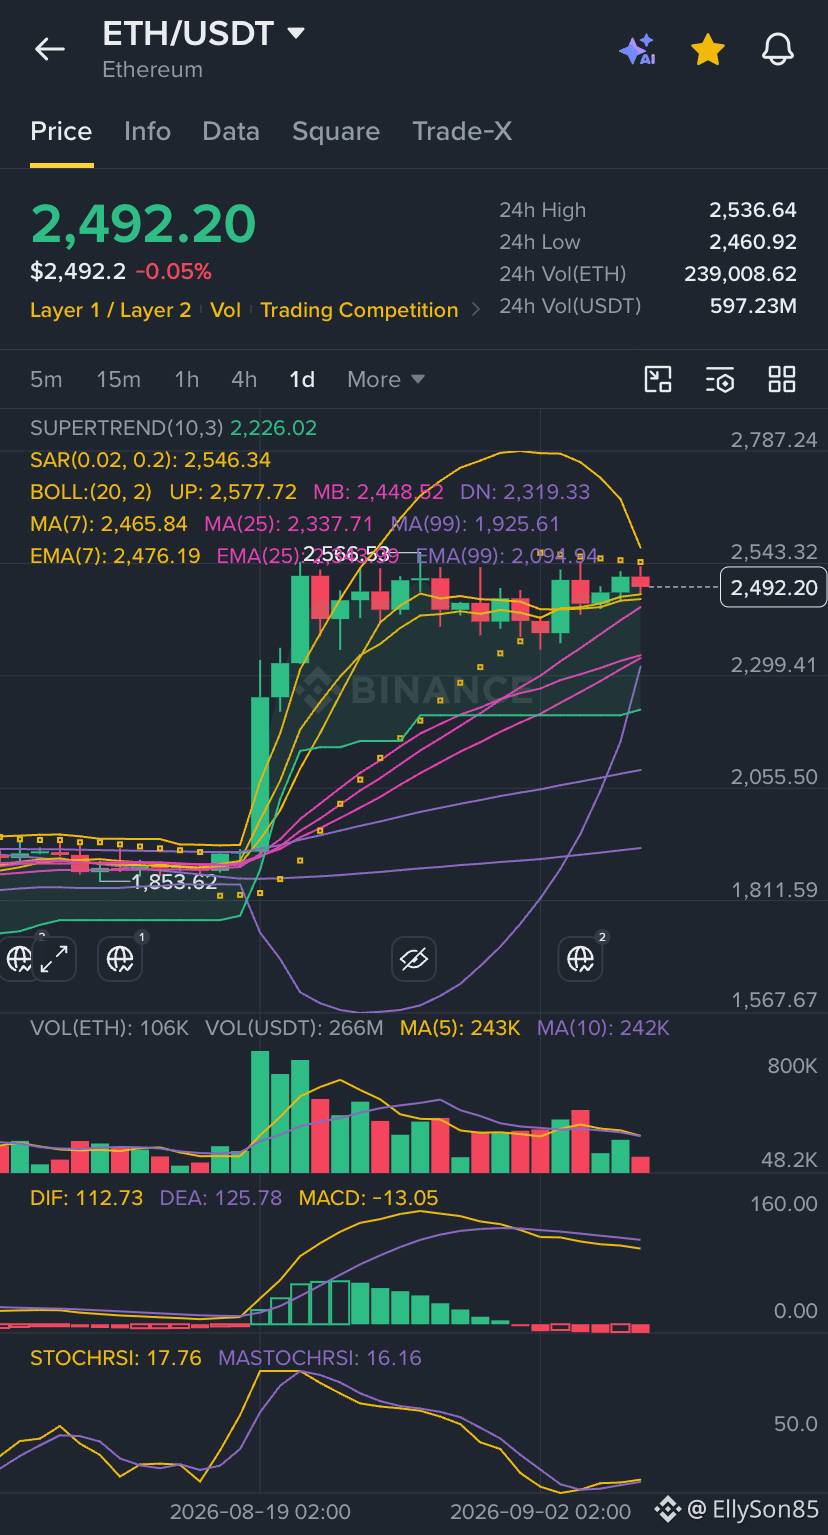
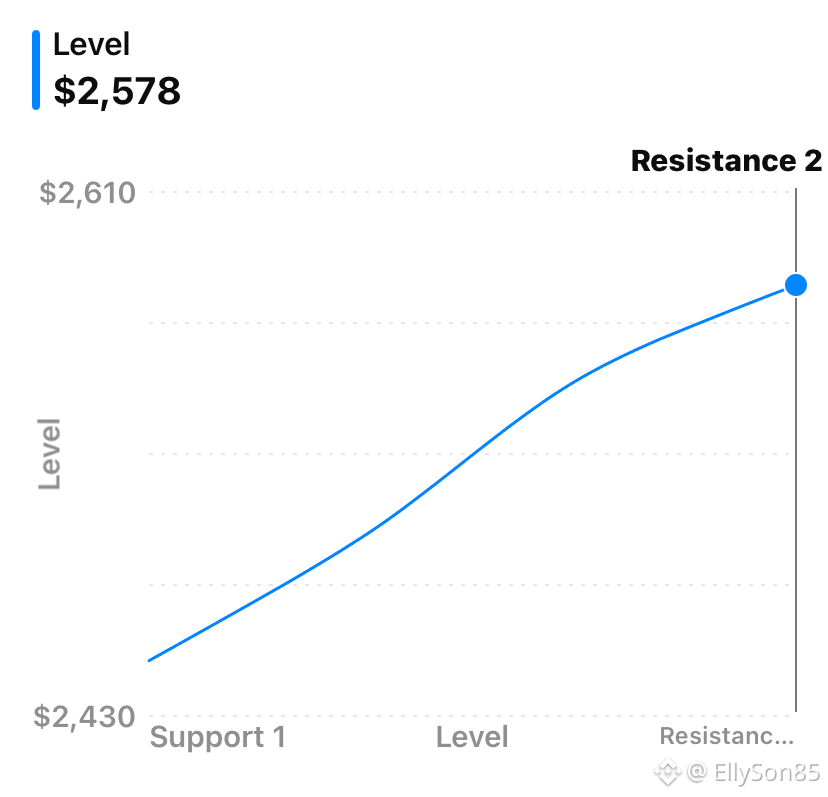
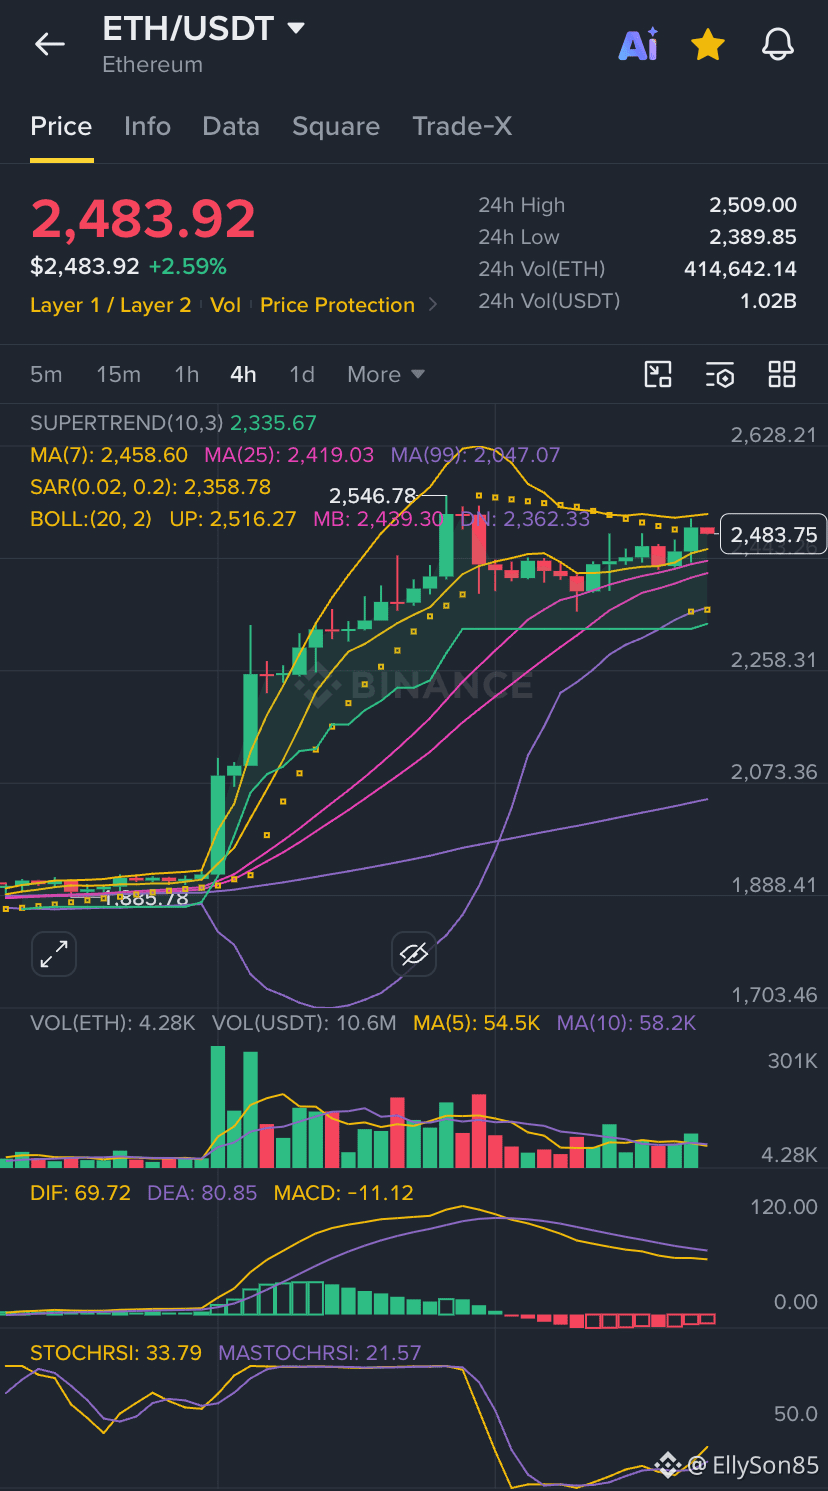
This is $ETH the most important structure
ETH appears to be consolidating after a strong upward move rather than reversing the entire trend.
The key range from my chart is approximately:
$2,450 → $2,550.
If ETH can reclaim and hold above ~$2,545–$2,580, that would be the first strong indication that buyers are overcoming the current resistance.
The next psychological area would then be around $2,600, followed by the higher resistance zone above it.
This is consistent with current market commentary identifying roughly $2,560–$2,600 as the important breakout area.
ETH appears to be consolidating after a strong upward move rather than reversing the entire trend.
The key range from my chart is approximately:
$2,450 → $2,550.
If ETH can reclaim and hold above ~$2,545–$2,580, that would be the first strong indication that buyers are overcoming the current resistance.
The next psychological area would then be around $2,600, followed by the higher resistance zone above it.
This is consistent with current market commentary identifying roughly $2,560–$2,600 as the important breakout area.
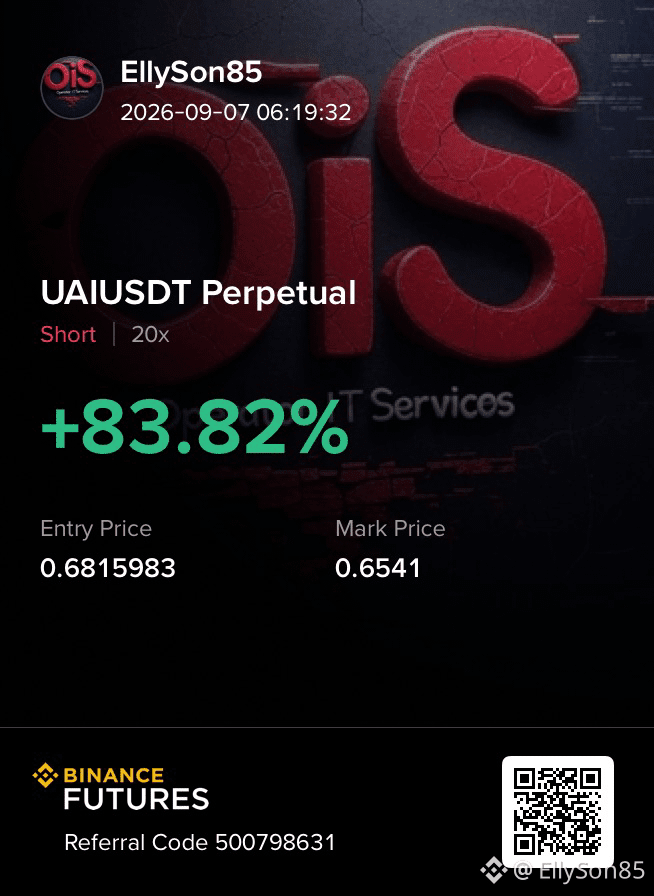
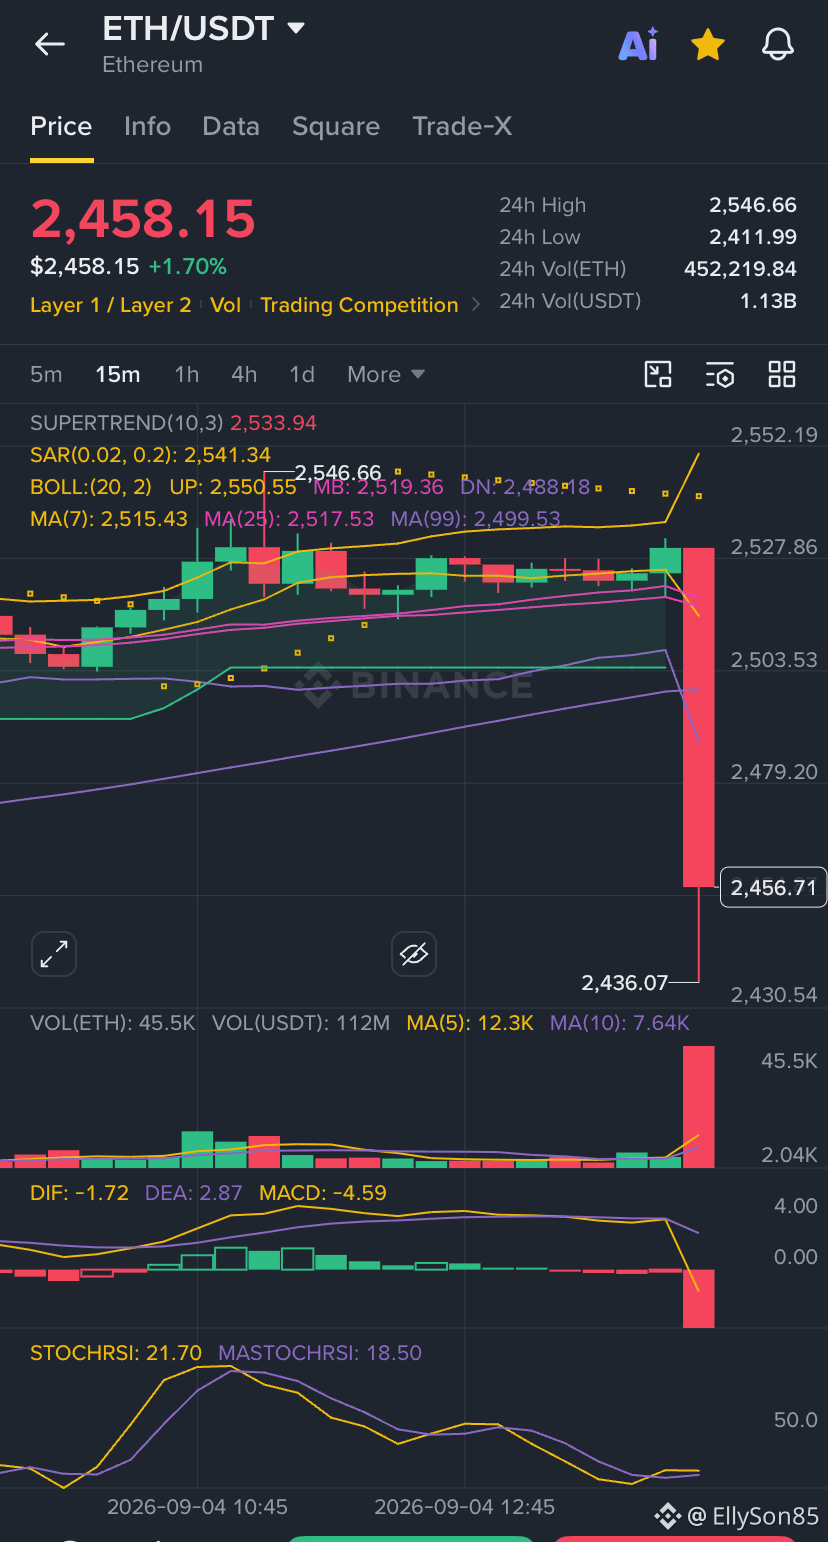
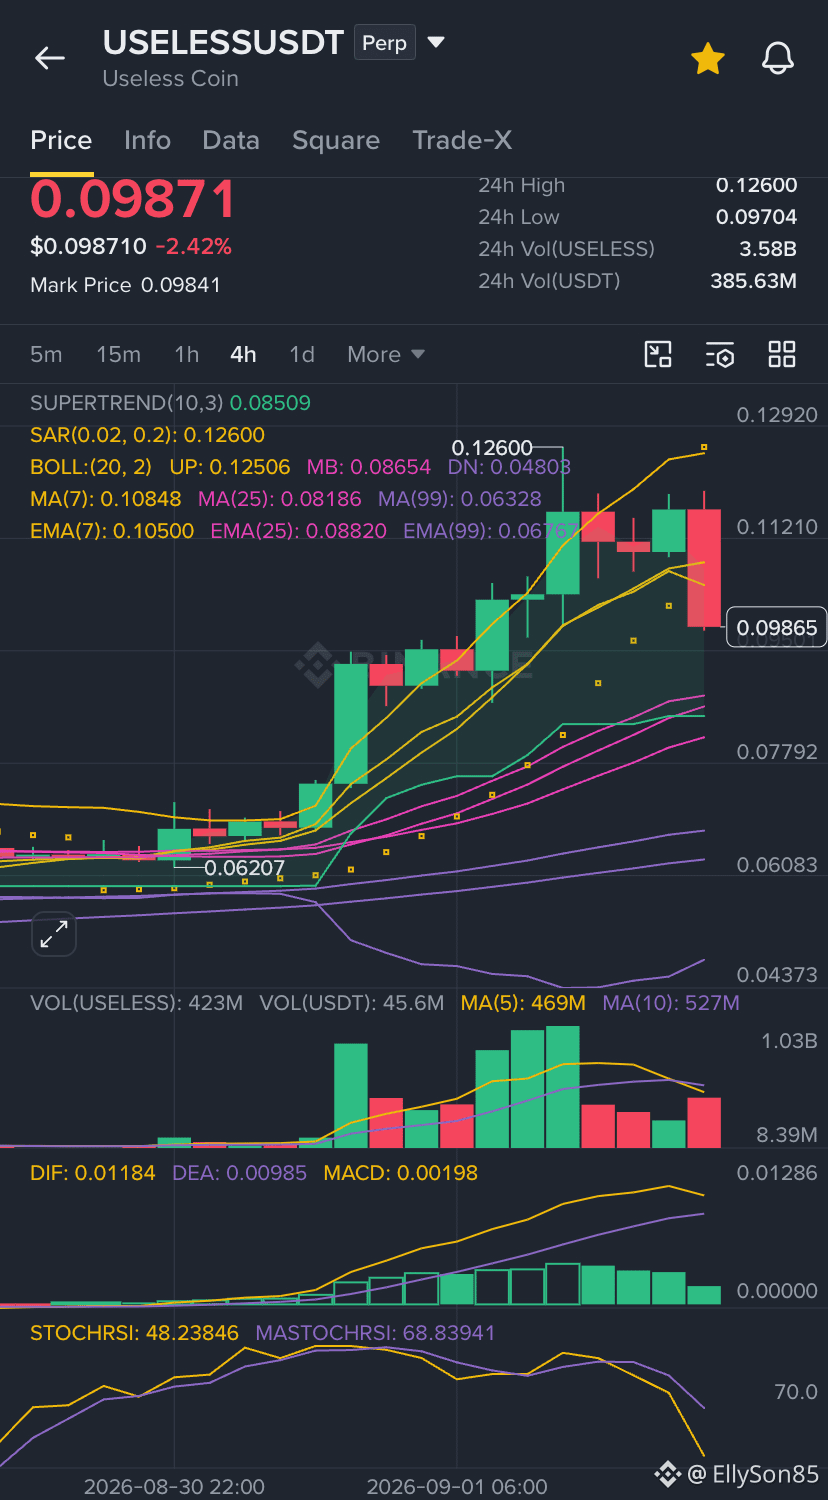
Today $USELESS is perfoming a sharp movement upward , probably $USELESS will wipeout all the liquidity around 0,3050 and start the journey to hell , plan your short position carefully because this shit token can liquidate you at anytime.
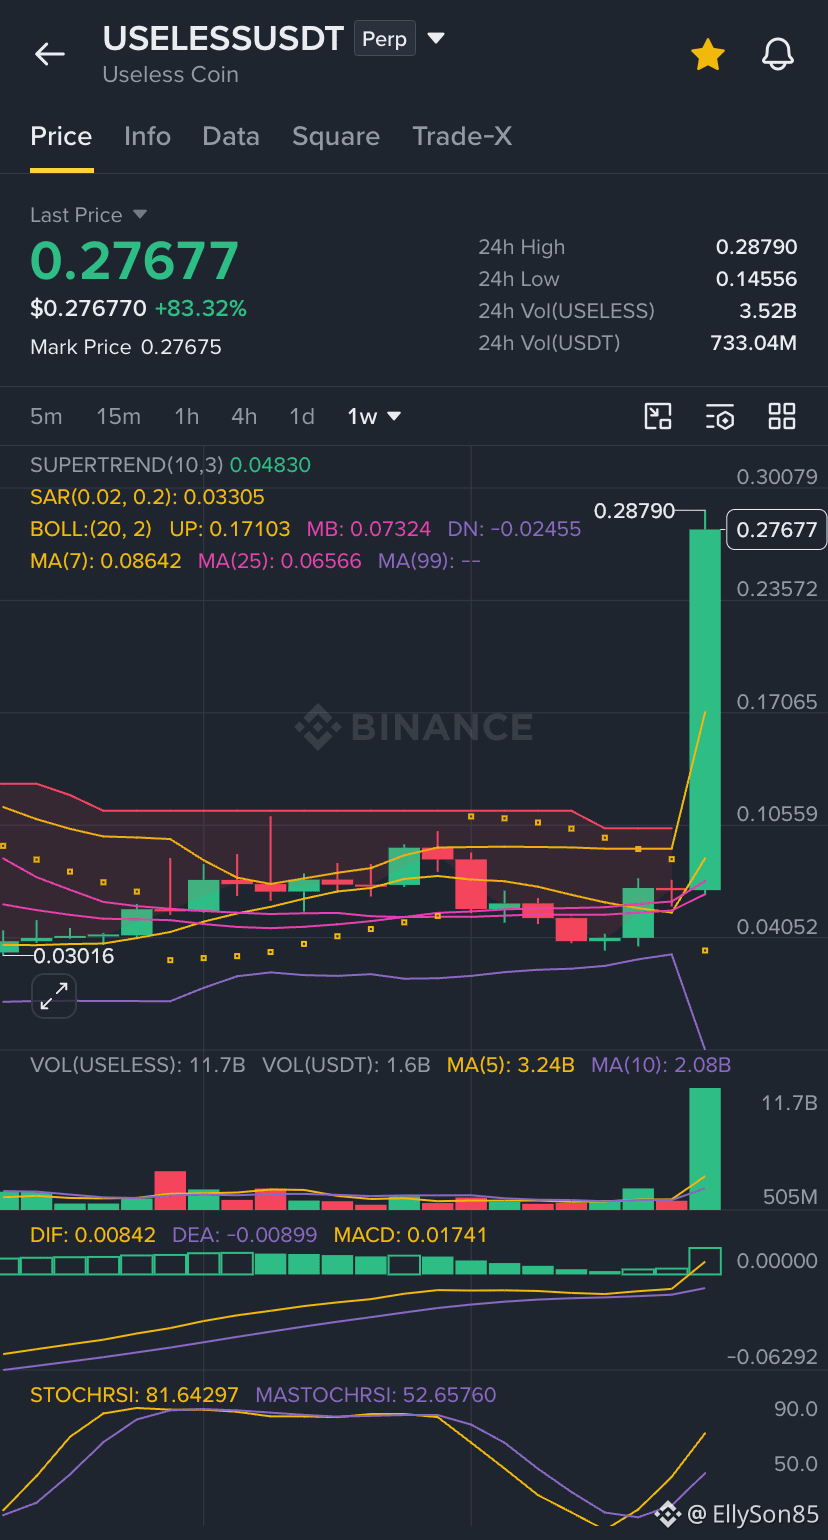
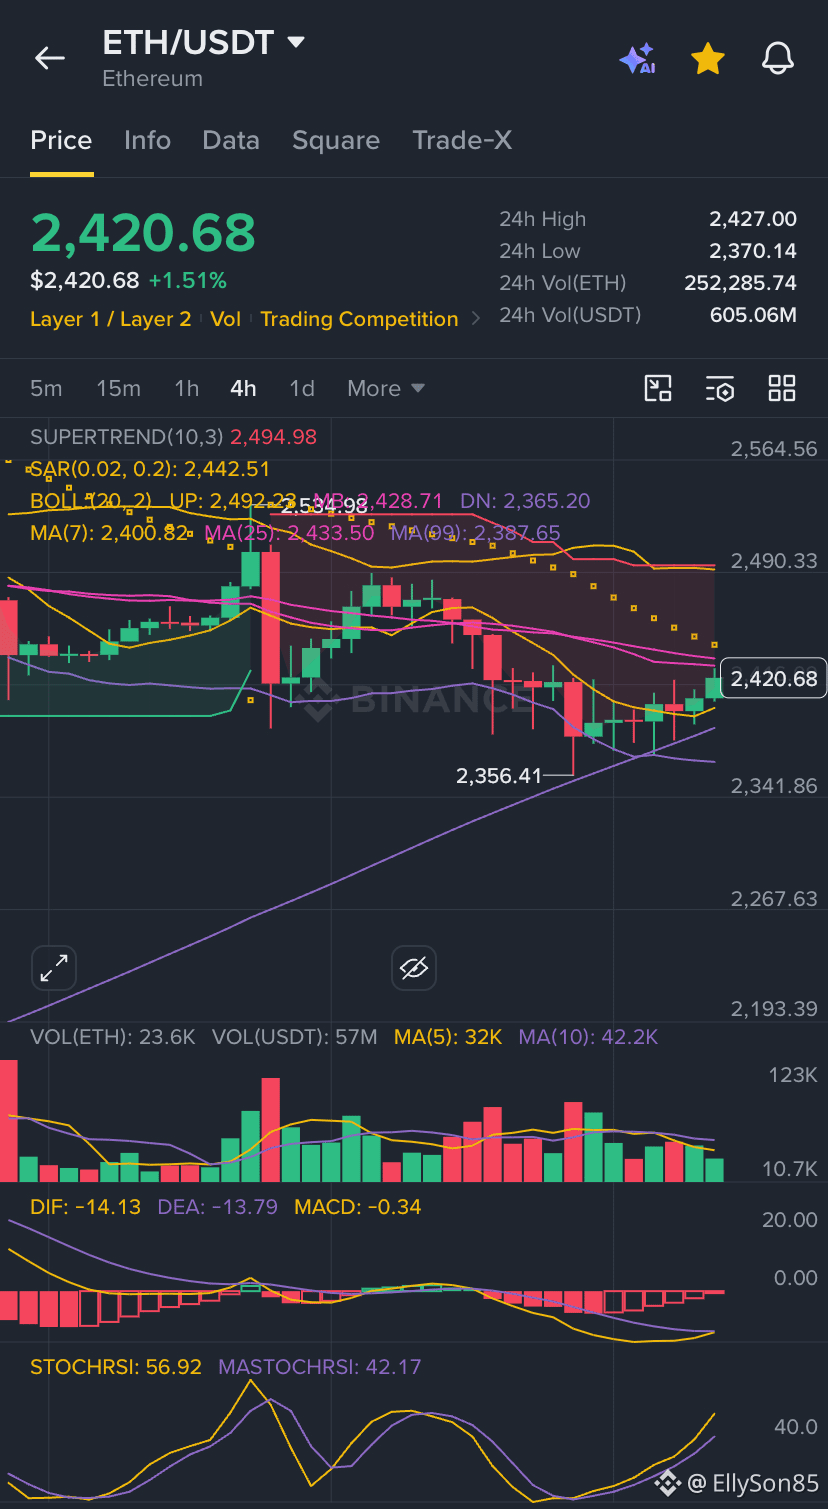
Guys, Bullish scenario detected to $ETH , but only if Ethereum follows this pathway !
ETH has bounced from around $2,356 and is now back above the 7-period MA (~$2,401). StochRSI is rising, while the MACD histogram is recovering toward zero.
If ETH gets a strong 4H close above $2,445, I would expect the next test to be around:
$2,490 → $2,500
A convincing break above $2,500 would significantly improve the bullish structure and could open the way toward $2,540–$2,565.
ETH has bounced from around $2,356 and is now back above the 7-period MA (~$2,401). StochRSI is rising, while the MACD histogram is recovering toward zero.
If ETH gets a strong 4H close above $2,445, I would expect the next test to be around:
$2,490 → $2,500
A convincing break above $2,500 would significantly improve the bullish structure and could open the way toward $2,540–$2,565.
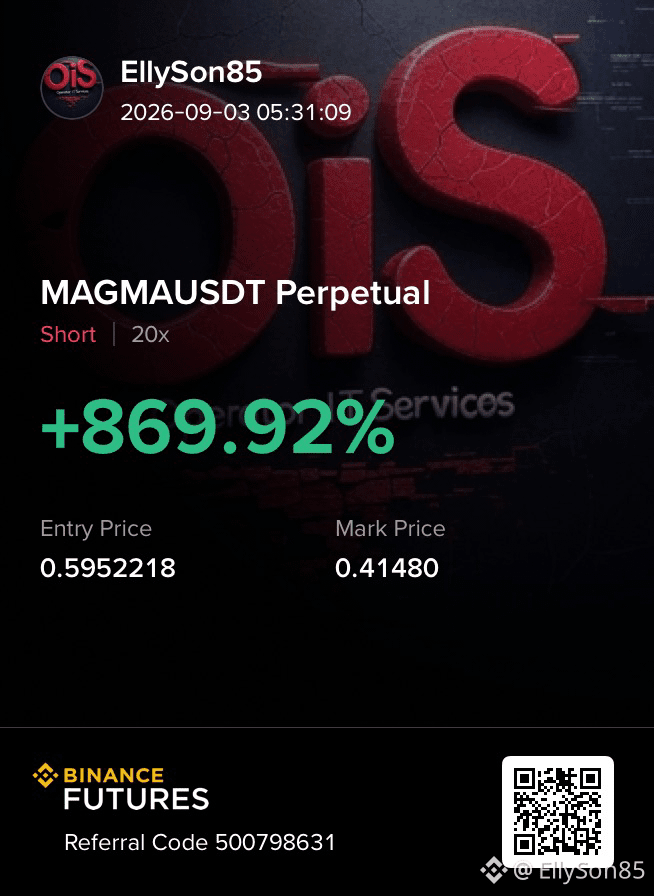
This $MAGMA Ended the game with an agresive pump and we responded with a big short. Now it is done.
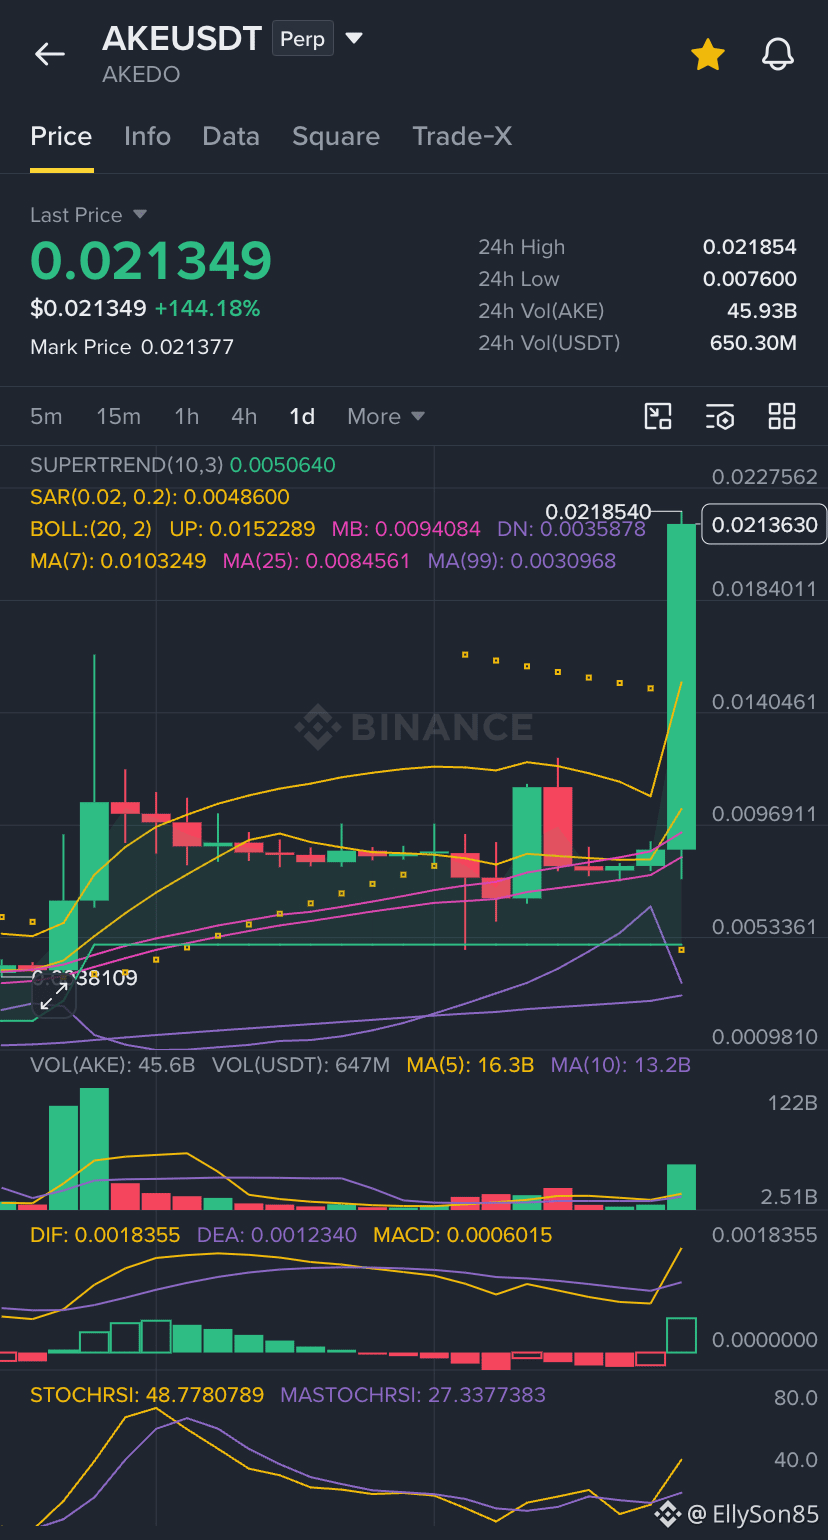
I can not advise anyone to open a long or short at $AKE at this time , this coin is higly volatile .
BREAKING: Binance founder CZ says $1,000,000 Bitcoin will happen sooner than most people think.
Do you Agree?
Do you Agree?

HOLD!
Войдите, чтобы посмотреть больше материала