

Decentralised News
524 Публикации

Decentralised News
Отправить жалобу
Заблокировать пользователя
X: @decentraliseda
Coinmarketcap @decentralisednews
0 подписок(и/а)
891 подписчиков(а)
1.6K+ понравилось
Посты
Crypto Venue Switching Cost Calculator 2027: Is a Better Fee Tier Worth Moving Your Trading Capital?
A better fee tier can look like an obvious reason to switch crypto exchanges.
But the advertised rate is only one part of the calculation.
Before moving trading capital, consider:
→ The cost of closing and reopening positions
→ Transfer costs and operational setup
→ How long it takes to qualify for the destination’s better fee tier
→ Differences in spreads, slippage and execution quality
→ Whether the savings still hold if your trading volume falls
Small fee differences can matter at scale. So can the friction involved in capturing them.
DN’s Venue Switching Cost Calculator brings these inputs into one model to estimate migration costs, monthly savings and the time needed to recover the cost of switching.
It also includes a half-volume sensitivity check—because a move that makes sense during a busy trading month may look very different when activity slows.
The key question: how much will you actually save, over the period you expect to trade?
Read the article and explore the calculator on Decentralised.News
All calculator defaults are illustrative. Confirm your actual fees, eligibility and operational conditions before making a decision.
#CryptoTrading #CryptoExchanges #TradingCosts #CapitalEfficiency #DecentralisedNews
Crypto Venue Switching Cost Calculator 2027: Is a Better Fee Tier Worth Moving Your Trading Capital?
A better fee tier can look like an obvious reason to switch crypto exchanges.
But the advertised rate is only one part of the calculation.
Before moving trading capital, consider:
→ The cost of closing and reopening positions
→ Transfer costs and operational setup
→ How long it takes to qualify for the destination’s better fee tier
→ Differences in spreads, slippage and execution quality
→ Whether the savings still hold if your trading volume falls
Small fee differences can matter at scale. So can the friction involved in capturing them.
DN’s Venue Switching Cost Calculator brings these inputs into one model to estimate migration costs, monthly savings and the time needed to recover the cost of switching.
It also includes a half-volume sensitivity check—because a move that makes sense during a busy trading month may look very different when activity slows.
The key question: how much will you actually save, over the period you expect to trade?
Read the article and explore the calculator on Decentralised.News
All calculator defaults are illustrative. Confirm your actual fees, eligibility and operational conditions before making a decision.
#CryptoTrading #CryptoExchanges #TradingCosts #CapitalEfficiency #DecentralisedNews
A better fee tier can look like an obvious reason to switch crypto exchanges.
But the advertised rate is only one part of the calculation.
Before moving trading capital, consider:
→ The cost of closing and reopening positions
→ Transfer costs and operational setup
→ How long it takes to qualify for the destination’s better fee tier
→ Differences in spreads, slippage and execution quality
→ Whether the savings still hold if your trading volume falls
Small fee differences can matter at scale. So can the friction involved in capturing them.
DN’s Venue Switching Cost Calculator brings these inputs into one model to estimate migration costs, monthly savings and the time needed to recover the cost of switching.
It also includes a half-volume sensitivity check—because a move that makes sense during a busy trading month may look very different when activity slows.
The key question: how much will you actually save, over the period you expect to trade?
Read the article and explore the calculator on Decentralised.News
All calculator defaults are illustrative. Confirm your actual fees, eligibility and operational conditions before making a decision.
#CryptoTrading #CryptoExchanges #TradingCosts #CapitalEfficiency #DecentralisedNews

70
The One-Person Agentic Company: Five Roles, One Human Bottleneck
Five AI-assisted roles can still share one bottleneck: the founder.
DN’s One-Person Agentic Company blueprint connects research, sales, delivery, finance and support through explicit work contracts, permissions and approval gates.
In the fictional 100-item Planning scenario, routine review, exception handling and fixed operations require 15.22 owner hours per week, slightly above a 15-hour allocation. Modeled software spending is 408.54 currency units per month, before assigning a value to the founder’s time.
These are conditional planning calculations, not measured business results or provider prices.
Explore 27 preset combinations of demand, workload profile and available owner time. The downloadable planner supports your own inputs, while the article explains retry limits, accepted outputs and recovery responsibilities.
Use it to identify where review capacity becomes the constraint before expanding the workflow.
Complete guide on Decentralised.News
#AIAgents #Solopreneurs #AgenticFinance
The One-Person Agentic Company: Five Roles, One Human Bottleneck
Five AI-assisted roles can still share one bottleneck: the founder.
DN’s One-Person Agentic Company blueprint connects research, sales, delivery, finance and support through explicit work contracts, permissions and approval gates.
In the fictional 100-item Planning scenario, routine review, exception handling and fixed operations require 15.22 owner hours per week, slightly above a 15-hour allocation. Modeled software spending is 408.54 currency units per month, before assigning a value to the founder’s time.
These are conditional planning calculations, not measured business results or provider prices.
Explore 27 preset combinations of demand, workload profile and available owner time. The downloadable planner supports your own inputs, while the article explains retry limits, accepted outputs and recovery responsibilities.
Use it to identify where review capacity becomes the constraint before expanding the workflow.
Complete guide on Decentralised.News
#AIAgents #Solopreneurs #AgenticFinance
Five AI-assisted roles can still share one bottleneck: the founder.
DN’s One-Person Agentic Company blueprint connects research, sales, delivery, finance and support through explicit work contracts, permissions and approval gates.
In the fictional 100-item Planning scenario, routine review, exception handling and fixed operations require 15.22 owner hours per week, slightly above a 15-hour allocation. Modeled software spending is 408.54 currency units per month, before assigning a value to the founder’s time.
These are conditional planning calculations, not measured business results or provider prices.
Explore 27 preset combinations of demand, workload profile and available owner time. The downloadable planner supports your own inputs, while the article explains retry limits, accepted outputs and recovery responsibilities.
Use it to identify where review capacity becomes the constraint before expanding the workflow.
Complete guide on Decentralised.News
#AIAgents #Solopreneurs #AgenticFinance

93
Best VPS & Cloud Regions for Crypto Trading Bots in 2027: London vs Frankfurt vs Singapore vs Tokyo vs Virginia
The closest server to your desk can be the wrong home for your crypto trading bot.
London, Frankfurt, Singapore, Tokyo and Northern Virginia all belong on a serious shortlist. Choosing between them requires testing the exact exchange API your account uses.
Our DN guide explains why a low ping alone cannot establish execution quality—and what to measure instead:
• P50/P95/P99 latency, including the slower tail.
• WebSocket continuity, reconnects and order acknowledgements.
• Failover readiness, with one controlled order writer.
It includes a 24-hour testing protocol and the interactive DN Region Fit Diagnostic, so you can compare candidate regions using your own measurements.
For South African traders, the guide also separates local monitoring from where latency-sensitive execution should run.
Before moving your bot, measure the connection your strategy actually depends on.
Read the guide on Decentralised News
#CryptoTrading #TradingBots #CloudInfrastructure
Best VPS & Cloud Regions for Crypto Trading Bots in 2027: London vs Frankfurt vs Singapore vs Tokyo vs Virginia
The closest server to your desk can be the wrong home for your crypto trading bot.
London, Frankfurt, Singapore, Tokyo and Northern Virginia all belong on a serious shortlist. Choosing between them requires testing the exact exchange API your account uses.
Our DN guide explains why a low ping alone cannot establish execution quality—and what to measure instead:
• P50/P95/P99 latency, including the slower tail.
• WebSocket continuity, reconnects and order acknowledgements.
• Failover readiness, with one controlled order writer.
It includes a 24-hour testing protocol and the interactive DN Region Fit Diagnostic, so you can compare candidate regions using your own measurements.
For South African traders, the guide also separates local monitoring from where latency-sensitive execution should run.
Before moving your bot, measure the connection your strategy actually depends on.
Read the guide on Decentralised News
#CryptoTrading #TradingBots #CloudInfrastructure
The closest server to your desk can be the wrong home for your crypto trading bot.
London, Frankfurt, Singapore, Tokyo and Northern Virginia all belong on a serious shortlist. Choosing between them requires testing the exact exchange API your account uses.
Our DN guide explains why a low ping alone cannot establish execution quality—and what to measure instead:
• P50/P95/P99 latency, including the slower tail.
• WebSocket continuity, reconnects and order acknowledgements.
• Failover readiness, with one controlled order writer.
It includes a 24-hour testing protocol and the interactive DN Region Fit Diagnostic, so you can compare candidate regions using your own measurements.
For South African traders, the guide also separates local monitoring from where latency-sensitive execution should run.
Before moving your bot, measure the connection your strategy actually depends on.
Read the guide on Decentralised News
#CryptoTrading #TradingBots #CloudInfrastructure

83
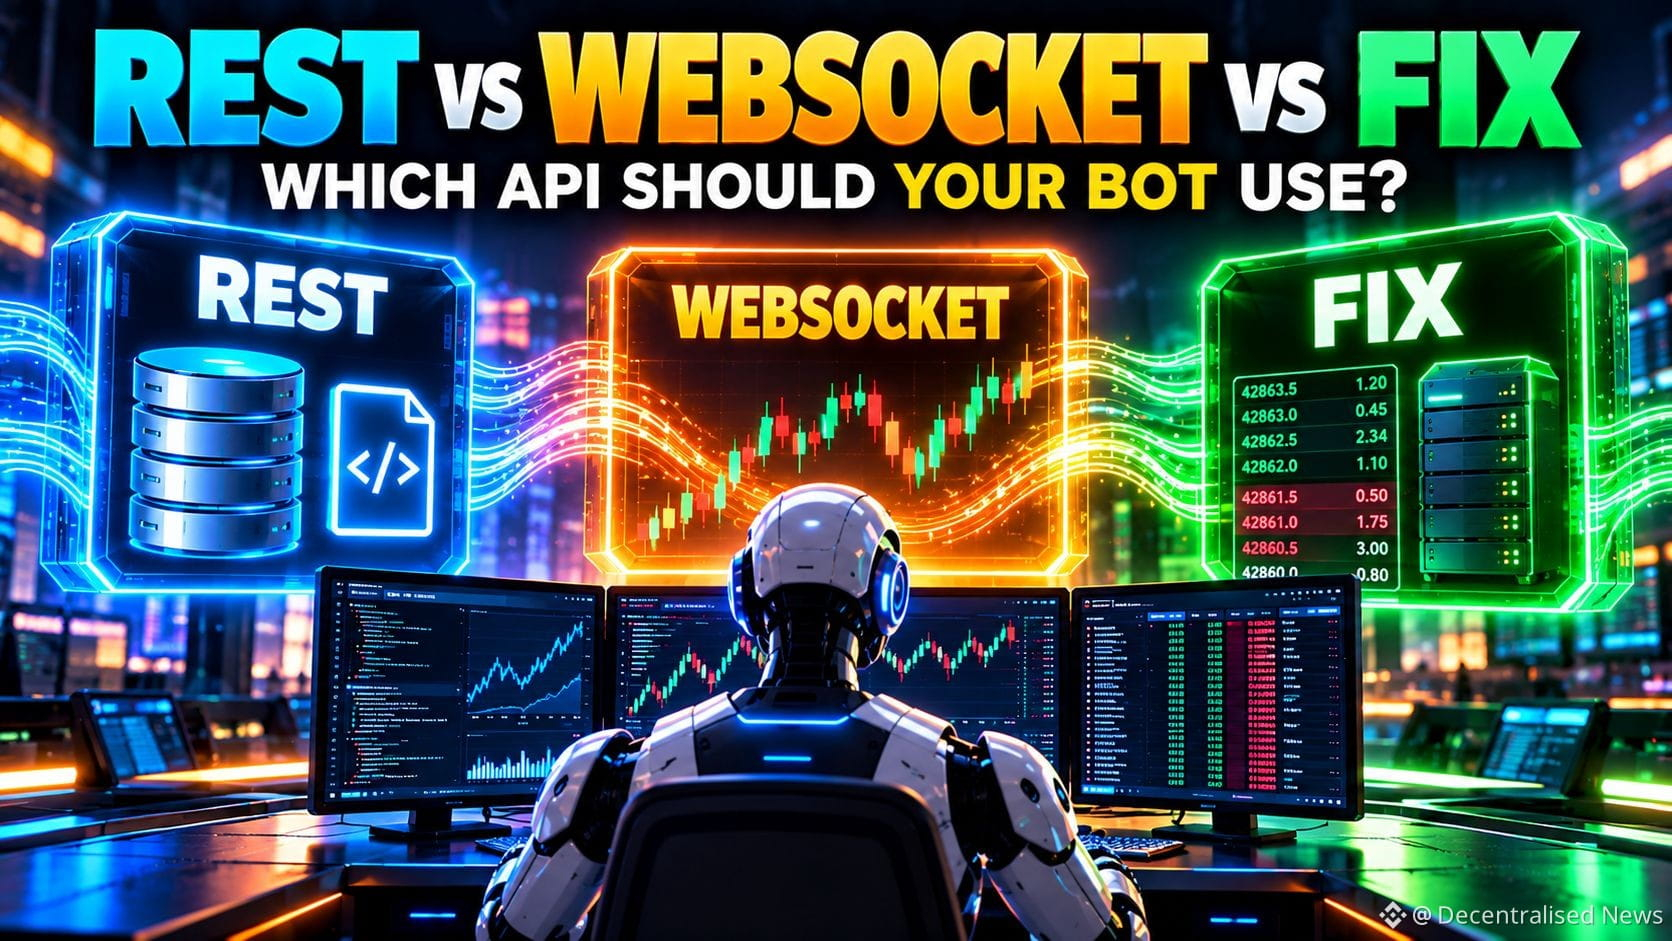
REST vs WebSocket vs FIX for Crypto Trading in 2027: Which API Should Your Bot Actually Use?
Most crypto trading bots should not choose between REST, WebSocket and FIX.
They should assign each protocol the job it is actually good at.
REST is excellent for snapshots, metadata and repairing uncertain state.
WebSocket should usually carry live market data, fills, balances, positions and other continuously changing information.
FIX becomes valuable where institutional execution, sequencing and OMS/EMS integration justify the additional complexity.
Our new DN research also explains where SBE fits — and why it is an encoding layer rather than simply a “faster fourth API.”
We introduce the DN Protocol Fit Matrix, State Freshness Debt, Protocol Migration Ladder and an API-stack selector for trading-system design.
Read the full research on Decentralised.News
#AlgorithmicTrading #CryptoTrading #TradingInfrastructure
REST vs WebSocket vs FIX for Crypto Trading in 2027: Which API Should Your Bot Actually Use?
Most crypto trading bots should not choose between REST, WebSocket and FIX.
They should assign each protocol the job it is actually good at.
REST is excellent for snapshots, metadata and repairing uncertain state.
WebSocket should usually carry live market data, fills, balances, positions and other continuously changing information.
FIX becomes valuable where institutional execution, sequencing and OMS/EMS integration justify the additional complexity.
Our new DN research also explains where SBE fits — and why it is an encoding layer rather than simply a “faster fourth API.”
We introduce the DN Protocol Fit Matrix, State Freshness Debt, Protocol Migration Ladder and an API-stack selector for trading-system design.
Read the full research on Decentralised.News
#AlgorithmicTrading #CryptoTrading #TradingInfrastructure
Most crypto trading bots should not choose between REST, WebSocket and FIX.
They should assign each protocol the job it is actually good at.
REST is excellent for snapshots, metadata and repairing uncertain state.
WebSocket should usually carry live market data, fills, balances, positions and other continuously changing information.
FIX becomes valuable where institutional execution, sequencing and OMS/EMS integration justify the additional complexity.
Our new DN research also explains where SBE fits — and why it is an encoding layer rather than simply a “faster fourth API.”
We introduce the DN Protocol Fit Matrix, State Freshness Debt, Protocol Migration Ladder and an API-stack selector for trading-system design.
Read the full research on Decentralised.News
#AlgorithmicTrading #CryptoTrading #TradingInfrastructure
73
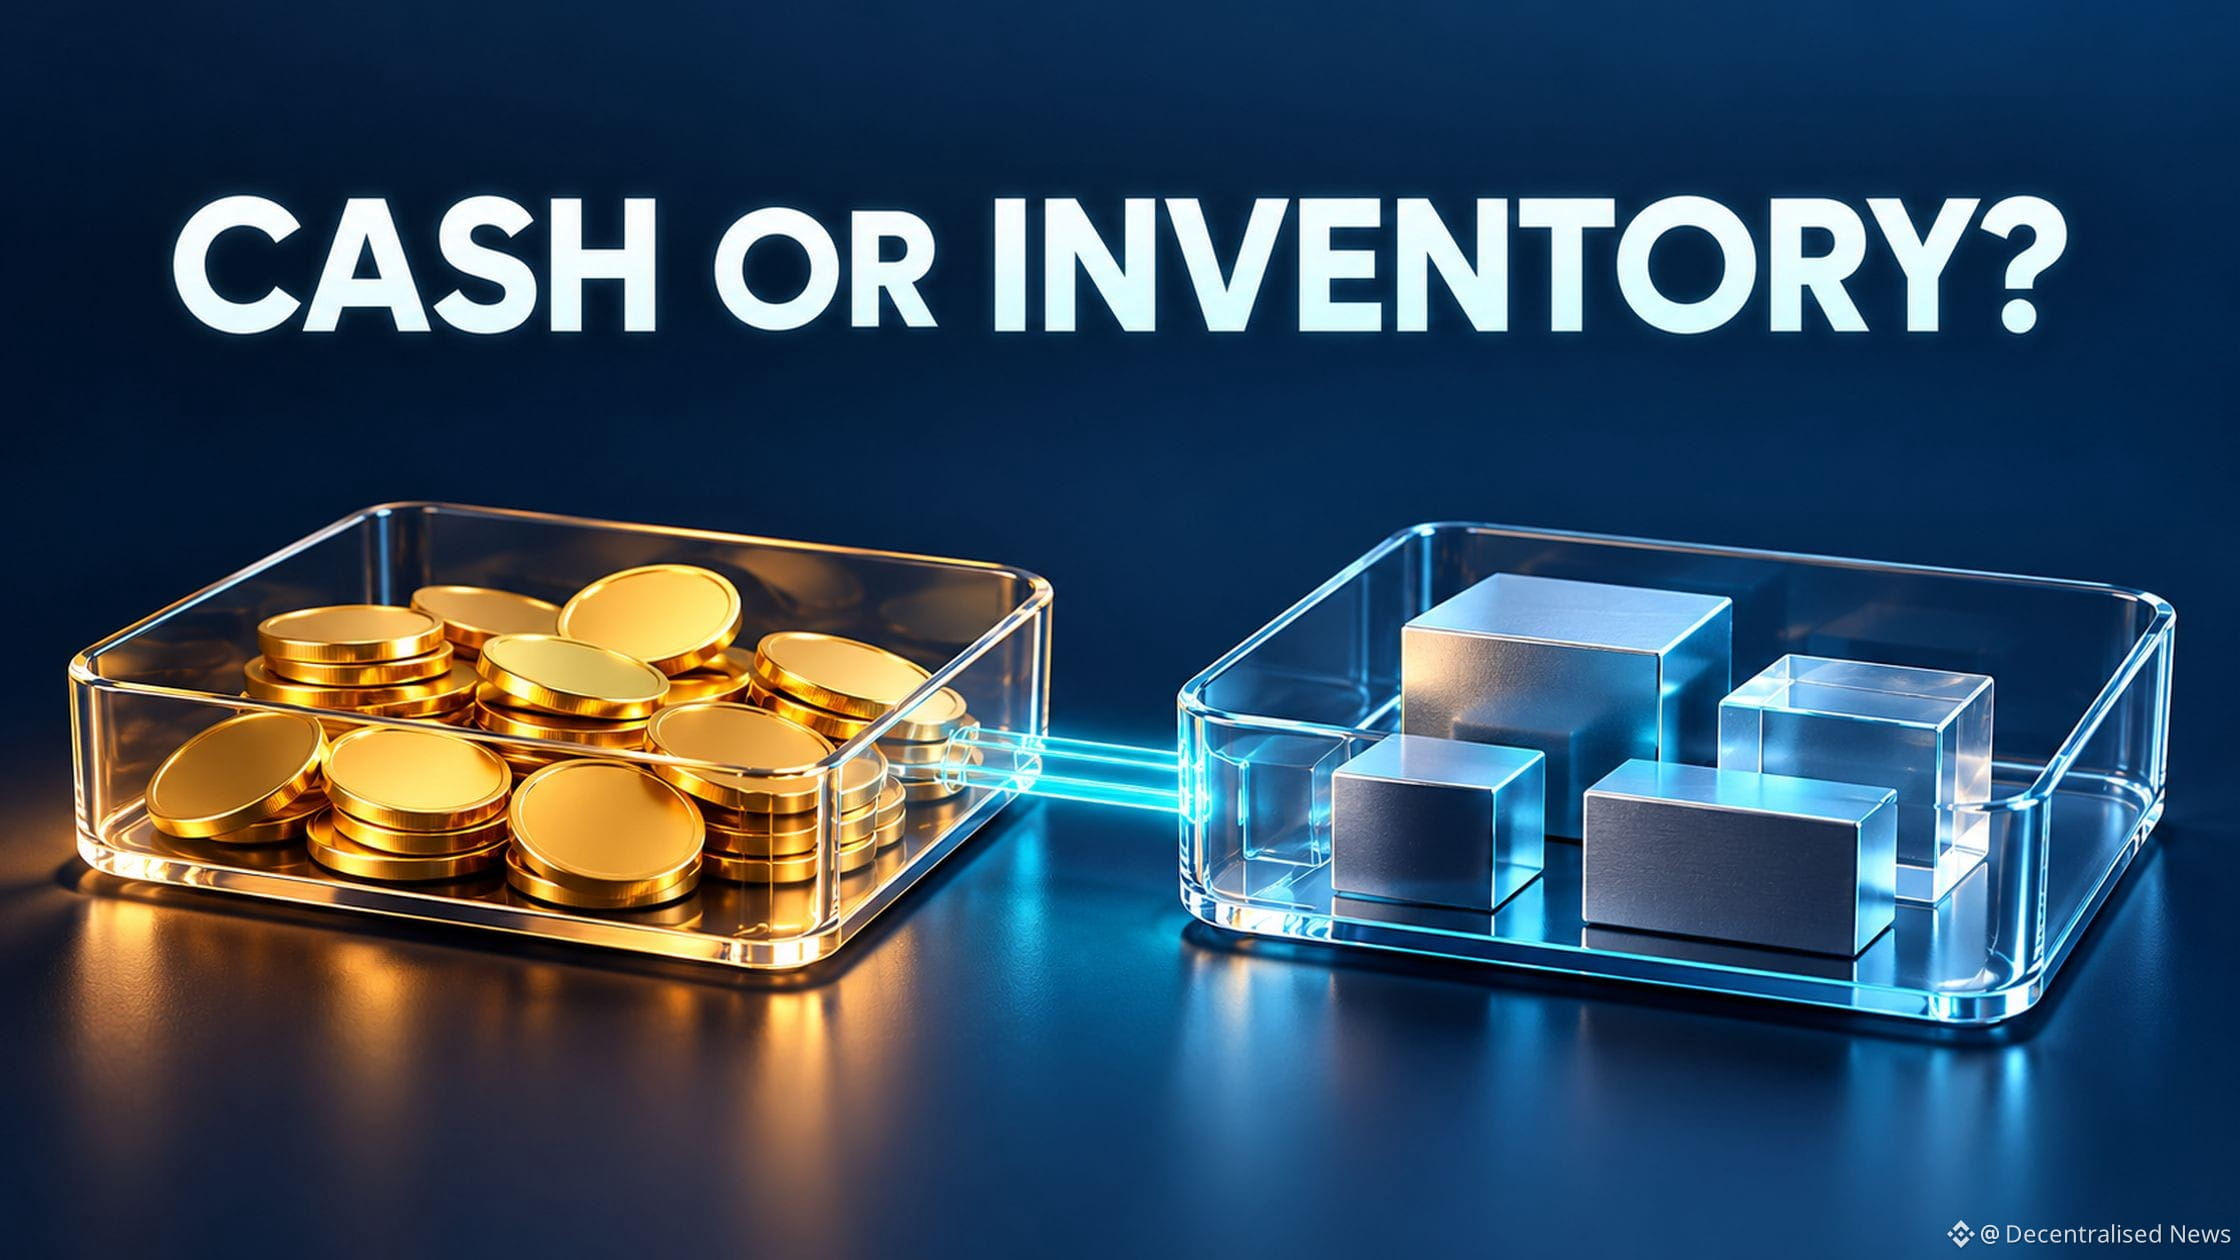
AI Market Making for Small Treasuries: Can You Get the Cash Back?
A trading bot can report positive spread earnings while the treasury loses money.
Our latest Decentralised News guide examines the cash question behind AI market making: what remains usable when quoting stops?
One clearly labelled synthetic example earns $60 after trading fees, yet finishes $180 down after inventory losses and operating costs. Another follows a partially filled bid through cancellation, showing why only the unfilled remainder releases cash.
The guide separates operating reserves, exchange holds, token inventory and conditional exit proceeds. It also explains which controls belong outside the AI supervisor.
There is an editable DN Treasury Cash and Inventory Planner, plus a practical evidence checklist for reviewing the assumptions. The figures illustrate accounting; they are not live trading results or return forecasts.
Read the guide and download the planner on Decentralised News
#AgenticFinance #TreasuryManagement #MarketMaking
AI Market Making for Small Treasuries: Can You Get the Cash Back?
A trading bot can report positive spread earnings while the treasury loses money.
Our latest Decentralised News guide examines the cash question behind AI market making: what remains usable when quoting stops?
One clearly labelled synthetic example earns $60 after trading fees, yet finishes $180 down after inventory losses and operating costs. Another follows a partially filled bid through cancellation, showing why only the unfilled remainder releases cash.
The guide separates operating reserves, exchange holds, token inventory and conditional exit proceeds. It also explains which controls belong outside the AI supervisor.
There is an editable DN Treasury Cash and Inventory Planner, plus a practical evidence checklist for reviewing the assumptions. The figures illustrate accounting; they are not live trading results or return forecasts.
Read the guide and download the planner on Decentralised News
#AgenticFinance #TreasuryManagement #MarketMaking
A trading bot can report positive spread earnings while the treasury loses money.
Our latest Decentralised News guide examines the cash question behind AI market making: what remains usable when quoting stops?
One clearly labelled synthetic example earns $60 after trading fees, yet finishes $180 down after inventory losses and operating costs. Another follows a partially filled bid through cancellation, showing why only the unfilled remainder releases cash.
The guide separates operating reserves, exchange holds, token inventory and conditional exit proceeds. It also explains which controls belong outside the AI supervisor.
There is an editable DN Treasury Cash and Inventory Planner, plus a practical evidence checklist for reviewing the assumptions. The figures illustrate accounting; they are not live trading results or return forecasts.
Read the guide and download the planner on Decentralised News
#AgenticFinance #TreasuryManagement #MarketMaking
1
64
How to Audit an AI Trading Bot’s Live Results: Rebuild Net P&L From the Trade Log
An AI trading bot can report $600 in realised gains while its account is down $520 for the same period.
The missing pieces? Open losses, trading fees and funding. Add a subscription paid outside the account, and the economic result changes again.
Our new Decentralised News guide walks through a fictional example that reconciles every dollar, then gives readers a practical P&L worksheet to use with their own records.
It covers deposits that inflate apparent performance, opening positions, incomplete exports, fee double counting and the difference between accurate accounting and proof that AI generated the trades.
The question to ask after seeing an impressive dashboard: can the account and the trade ledger explain the same net result?
Read the guide and use the worksheet on Decentralised News
#AITrading #AgenticFinance #RiskManagement
How to Audit an AI Trading Bot’s Live Results: Rebuild Net P&L From the Trade Log
An AI trading bot can report $600 in realised gains while its account is down $520 for the same period.
The missing pieces? Open losses, trading fees and funding. Add a subscription paid outside the account, and the economic result changes again.
Our new Decentralised News guide walks through a fictional example that reconciles every dollar, then gives readers a practical P&L worksheet to use with their own records.
It covers deposits that inflate apparent performance, opening positions, incomplete exports, fee double counting and the difference between accurate accounting and proof that AI generated the trades.
The question to ask after seeing an impressive dashboard: can the account and the trade ledger explain the same net result?
Read the guide and use the worksheet on Decentralised News
#AITrading #AgenticFinance #RiskManagement
An AI trading bot can report $600 in realised gains while its account is down $520 for the same period.
The missing pieces? Open losses, trading fees and funding. Add a subscription paid outside the account, and the economic result changes again.
Our new Decentralised News guide walks through a fictional example that reconciles every dollar, then gives readers a practical P&L worksheet to use with their own records.
It covers deposits that inflate apparent performance, opening positions, incomplete exports, fee double counting and the difference between accurate accounting and proof that AI generated the trades.
The question to ask after seeing an impressive dashboard: can the account and the trade ledger explain the same net result?
Read the guide and use the worksheet on Decentralised News
#AITrading #AgenticFinance #RiskManagement
85
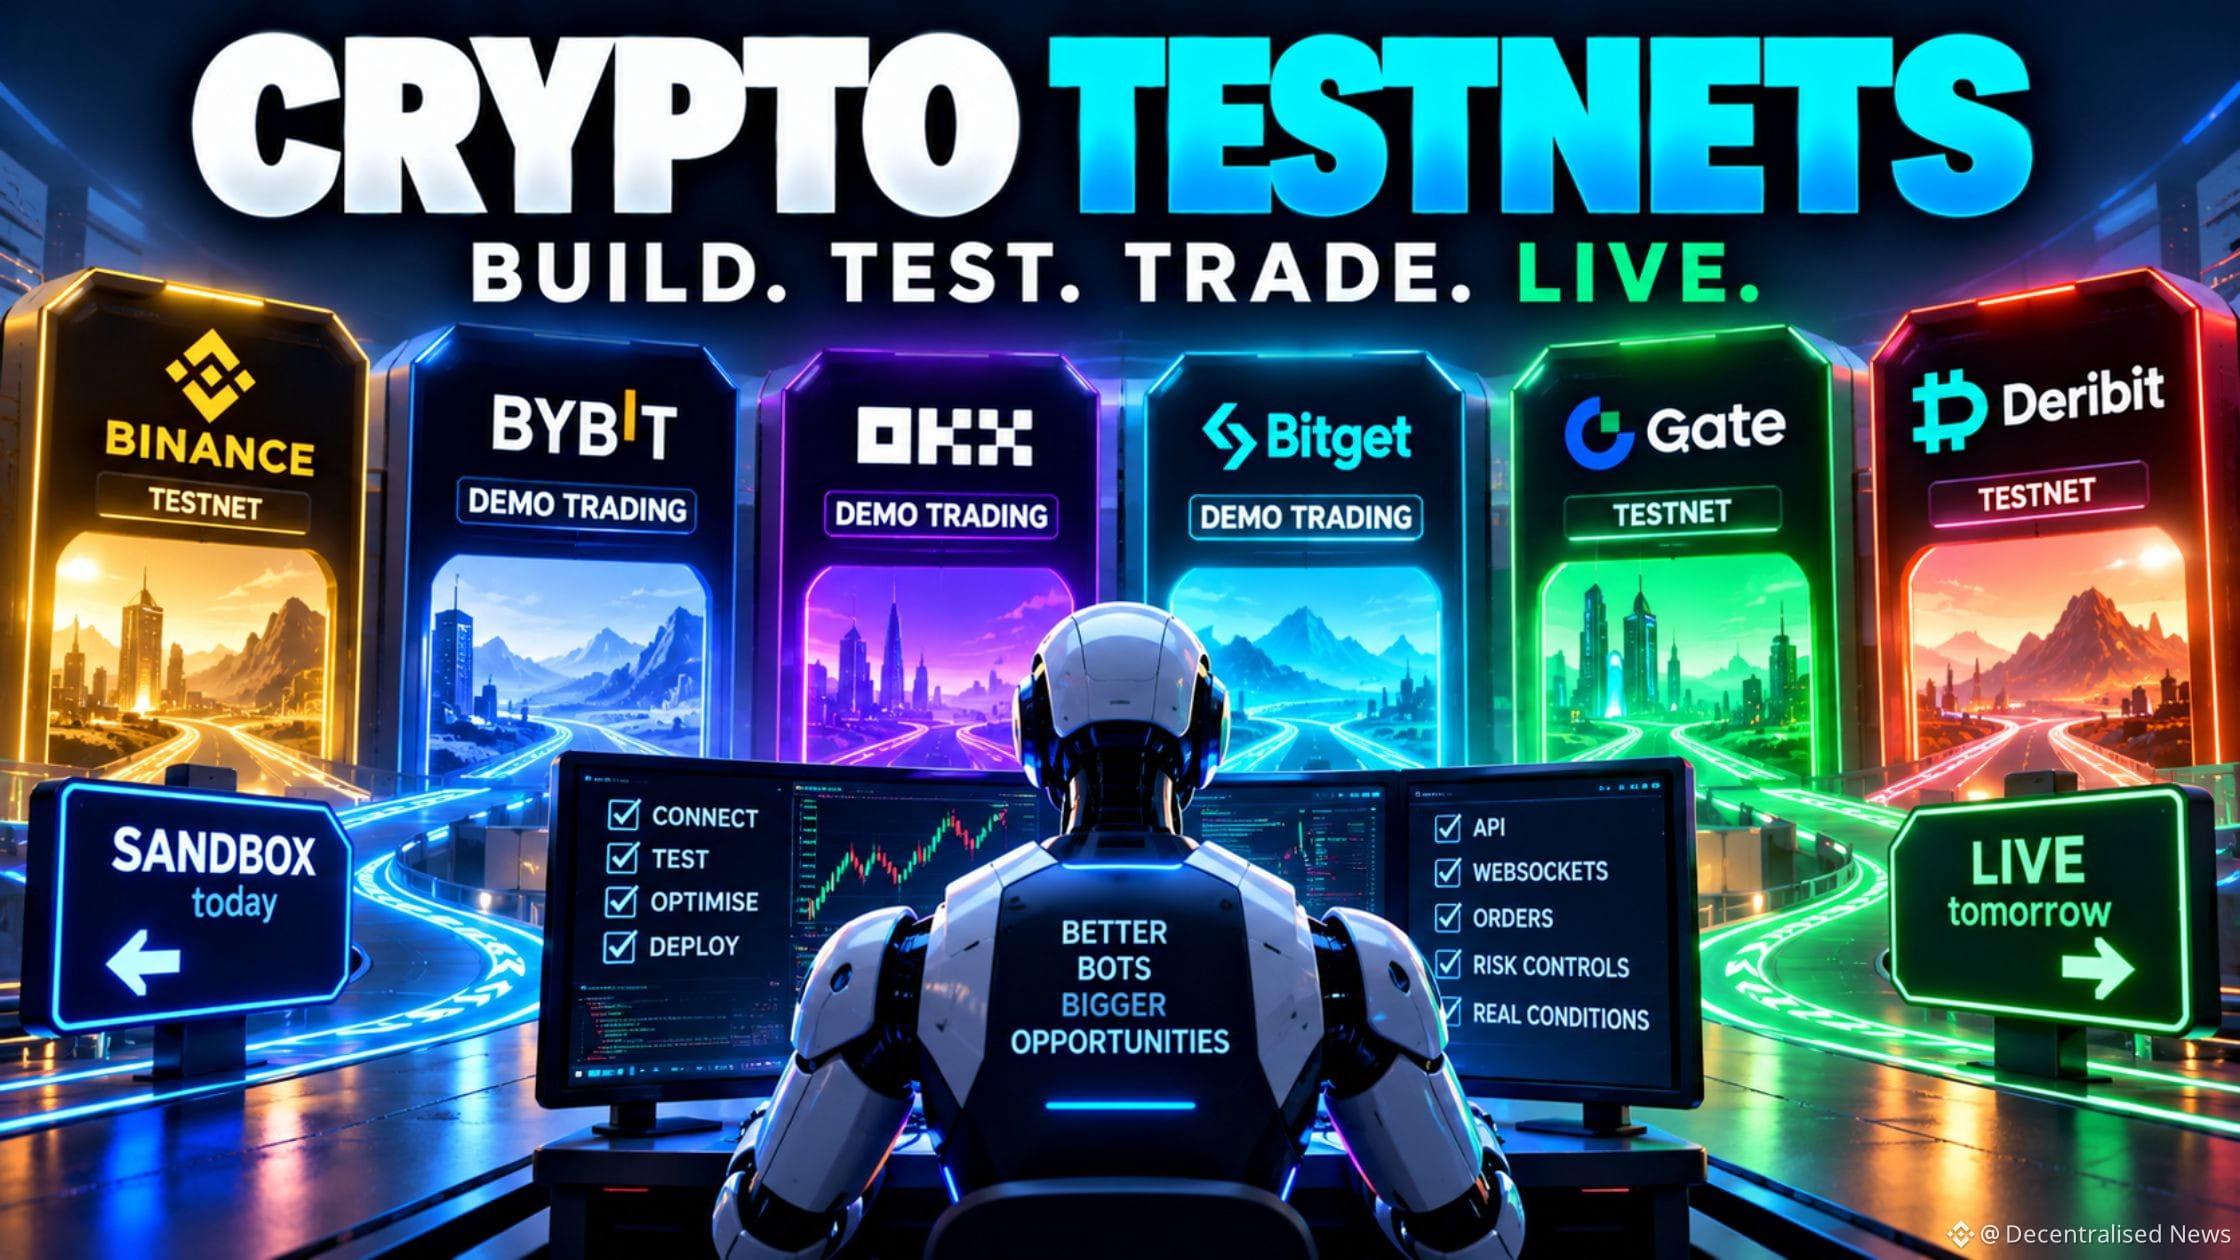
Crypto Sandbox & Testnet Benchmark 2027: Binance vs Bybit vs OKX vs Bitget vs Gate vs Deribit
Your trading bot works perfectly on testnet.
That does not mean it is ready for live capital.
A sandbox can validate:
• API authentication
• order payloads
• WebSocket state
• reconnect logic
• cancellations
• error handling
• exchange filters
But it may tell you almost nothing about:
• real slippage
• queue position
• fill probability
• market impact
• stress latency
• liquidation cascades
That is why we built the DN Crypto Sandbox & Testnet Benchmark 2027.
We compare:
[Binance](https://www.binance.com/en/activity/referral-entry/CPA?fromActivityPage=true&ref=CPA_00SXKU7IO9)
Gate
Bybit
Bitget
OKX
Deribit
across:
Production API parity
Product breadth
Market-data realism
State and test controls
Professional protocol parity
Documentation and limitations
The article also introduces:
DN Sandbox Readiness Score
DN Paper-to-Live Gap
DN Sandbox Deployment Diagnostic
7-Stage DN Bot Deployment Ladder
The most important principle:
A sandbox can prove that your bot talks to the exchange correctly. It cannot prove that your strategy survives the market.
The right progression is:
historical replay → exchange sandbox → chaos testing → mainnet shadow → micro-live → controlled production
Read the research on Decentralised.News
#Crypto #AlgorithmicTrading #TradingBots #QuantTrading #API #Python #FinTech #HFT #MarketStructure #CryptoTrading
Crypto Sandbox & Testnet Benchmark 2027: Binance vs Bybit vs OKX vs Bitget vs Gate vs Deribit
Your trading bot works perfectly on testnet.
That does not mean it is ready for live capital.
A sandbox can validate:
• API authentication
• order payloads
• WebSocket state
• reconnect logic
• cancellations
• error handling
• exchange filters
But it may tell you almost nothing about:
• real slippage
• queue position
• fill probability
• market impact
• stress latency
• liquidation cascades
That is why we built the DN Crypto Sandbox & Testnet Benchmark 2027.
We compare:
Binance
Gate
Bybit
Bitget
OKX
Deribit
across:
Production API parity
Product breadth
Market-data realism
State and test controls
Professional protocol parity
Documentation and limitations
The article also introduces:
DN Sandbox Readiness Score
DN Paper-to-Live Gap
DN Sandbox Deployment Diagnostic
7-Stage DN Bot Deployment Ladder
The most important principle:
A sandbox can prove that your bot talks to the exchange correctly. It cannot prove that your strategy survives the market.
The right progression is:
historical replay → exchange sandbox → chaos testing → mainnet shadow → micro-live → controlled production
Read the research on Decentralised.News
#Crypto #AlgorithmicTrading #TradingBots #QuantTrading #API #Python #FinTech #HFT #MarketStructure #CryptoTrading
Your trading bot works perfectly on testnet.
That does not mean it is ready for live capital.
A sandbox can validate:
• API authentication
• order payloads
• WebSocket state
• reconnect logic
• cancellations
• error handling
• exchange filters
But it may tell you almost nothing about:
• real slippage
• queue position
• fill probability
• market impact
• stress latency
• liquidation cascades
That is why we built the DN Crypto Sandbox & Testnet Benchmark 2027.
We compare:
Binance
Gate
Bybit
Bitget
OKX
Deribit
across:
Production API parity
Product breadth
Market-data realism
State and test controls
Professional protocol parity
Documentation and limitations
The article also introduces:
DN Sandbox Readiness Score
DN Paper-to-Live Gap
DN Sandbox Deployment Diagnostic
7-Stage DN Bot Deployment Ladder
The most important principle:
A sandbox can prove that your bot talks to the exchange correctly. It cannot prove that your strategy survives the market.
The right progression is:
historical replay → exchange sandbox → chaos testing → mainnet shadow → micro-live → controlled production
Read the research on Decentralised.News
#Crypto #AlgorithmicTrading #TradingBots #QuantTrading #API #Python #FinTech #HFT #MarketStructure #CryptoTrading
6
Crypto Venue Concentration Index 2027: Are Five Trading Accounts Really Five Independent Risks?
Your crypto capital can be spread across five accounts and still depend heavily on one issuer, custodian or settlement network.
Account diversification and dependency diversification are different measurements.
DN’s Crypto Venue Concentration Index 2027 introduces a calculator to explore:
• Capital concentration across user-defined dependency groups
• Effective allocation-group count
• Exposure to a selected group disruption
• Illustrative permanent loss and temporary unavailability
In the synthetic example, five equal accounts map to dependency groups holding 40%, 40% and 20% of capital. That produces an effective allocation-group count of 2.78.
This measures concentration. It does not prove independence, rate platform safety or predict failures.
Explore the framework on Decentralised News
#CryptoTrading #CounterpartyRisk #PortfolioManagement #Custody #DecentralisedNews
Crypto Venue Concentration Index 2027: Are Five Trading Accounts Really Five Independent Risks?
Your crypto capital can be spread across five accounts and still depend heavily on one issuer, custodian or settlement network.
Account diversification and dependency diversification are different measurements.
DN’s Crypto Venue Concentration Index 2027 introduces a calculator to explore:
• Capital concentration across user-defined dependency groups
• Effective allocation-group count
• Exposure to a selected group disruption
• Illustrative permanent loss and temporary unavailability
In the synthetic example, five equal accounts map to dependency groups holding 40%, 40% and 20% of capital. That produces an effective allocation-group count of 2.78.
This measures concentration. It does not prove independence, rate platform safety or predict failures.
Explore the framework on Decentralised News
#CryptoTrading #CounterpartyRisk #PortfolioManagement #Custody #DecentralisedNews
Your crypto capital can be spread across five accounts and still depend heavily on one issuer, custodian or settlement network.
Account diversification and dependency diversification are different measurements.
DN’s Crypto Venue Concentration Index 2027 introduces a calculator to explore:
• Capital concentration across user-defined dependency groups
• Effective allocation-group count
• Exposure to a selected group disruption
• Illustrative permanent loss and temporary unavailability
In the synthetic example, five equal accounts map to dependency groups holding 40%, 40% and 20% of capital. That produces an effective allocation-group count of 2.78.
This measures concentration. It does not prove independence, rate platform safety or predict failures.
Explore the framework on Decentralised News
#CryptoTrading #CounterpartyRisk #PortfolioManagement #Custody #DecentralisedNews

77
Crypto Collateral Efficiency Index 2027: Where Does $100,000 of Trading Capital Go Furthest?
Where does $100,000 of crypto trading capital go furthest?
Advertised leverage won’t answer that question.
The more useful comparison is how much capital remains after collateral haircuts, initial margin, costs and a credible stress reserve.
DN’s Crypto Collateral Efficiency Index 2027 introduces an interactive calculator and three transparent illustrative scenarios, alongside documentation comparisons covering [Binance](https://www.binance.com/en/activity/referral-entry/CPA?fromActivityPage=true&ref=CPA_00SXKU7IO9), Bybit, Deribit and Hyperliquid.
The central finding: the highest opening capital efficiency does not necessarily produce the strongest stressed capital balance.
Use the calculator to explore the assumptions behind your trading budget on Decentralised.News
#CryptoTrading #CapitalEfficiency #PortfolioMargin #RiskManagement #DecentralisedNews
Crypto Collateral Efficiency Index 2027: Where Does $100,000 of Trading Capital Go Furthest?
Where does $100,000 of crypto trading capital go furthest?
Advertised leverage won’t answer that question.
The more useful comparison is how much capital remains after collateral haircuts, initial margin, costs and a credible stress reserve.
DN’s Crypto Collateral Efficiency Index 2027 introduces an interactive calculator and three transparent illustrative scenarios, alongside documentation comparisons covering Binance, Bybit, Deribit and Hyperliquid.
The central finding: the highest opening capital efficiency does not necessarily produce the strongest stressed capital balance.
Use the calculator to explore the assumptions behind your trading budget on Decentralised.News
#CryptoTrading #CapitalEfficiency #PortfolioMargin #RiskManagement #DecentralisedNews
Where does $100,000 of crypto trading capital go furthest?
Advertised leverage won’t answer that question.
The more useful comparison is how much capital remains after collateral haircuts, initial margin, costs and a credible stress reserve.
DN’s Crypto Collateral Efficiency Index 2027 introduces an interactive calculator and three transparent illustrative scenarios, alongside documentation comparisons covering Binance, Bybit, Deribit and Hyperliquid.
The central finding: the highest opening capital efficiency does not necessarily produce the strongest stressed capital balance.
Use the calculator to explore the assumptions behind your trading budget on Decentralised.News
#CryptoTrading #CapitalEfficiency #PortfolioMargin #RiskManagement #DecentralisedNews

78
The Centralized Futures Index 2027: 25 Exchanges Ranked
The biggest difference between a centralized futures exchange and a perp DEX isn't the chart.
It's where your collateral sits.
On a centralized exchange, your margin is ultimately a claim on the exchange.
That gives traders enormous advantages:
deep order books
portfolio margin
cross-collateral
mature APIs
block trading
fiat rails
customer support
But it also creates something perp DEX traders don't face in quite the same way:
centralized counterparty risk.
So we built the new DN Centralized Futures Index 2027.
We ranked 25 centralized crypto futures exchanges across:
• liquidity & depth
• open interest
• trading fees
• funding economics
• counterparty transparency
• proof of reserves
• regulatory profile
• derivatives tooling
• market breadth
• API reliability
• trader UX
Current top 10:
1. [Binance](https://www.binance.com/en/activity/referral-entry/CPA?fromActivityPage=true&ref=CPA_00SXKU7IO9) — 9.8/10
2. OKX — 9.6/10
3. Bybit — 9.4/10
4. Gate — 9.3/10
5. Bitget — 9.2/10
6. MEXC — 9.1/10
7. Deribit by Coinbase — 9.1/10
8. Kraken — 9.0/10
9. BingX — 8.8/10
10. KuCoin — 8.6/10
But the rankings aren't the most interesting finding. So we also built the: DN CEX Futures Pathfinder + Counterparty Exposure Engine
Enter:
position size
leverage
maker/taker
holding period
funding assumption
slippage
exchange balance
and your priority
The tool calculates:
✓ estimated margin
✓ round-trip commission
✓ funding
✓ slippage
✓ total cost
✓ cost as % of margin
✓ capital exposed to exchange counterparty risk
✓ recommended venues
Another major trend emerged. Centralized crypto exchanges are becoming global leveraged-markets platforms.
Stocks.
Indices.
FX.
Commodities.
Metals.
Pre-IPO exposures.
That's a much larger battle.
Read the complete, technical review on Decentralised.News
#Crypto #Futures #Binance #Derivatives #Trading #Bitcoin #CryptoTrading #DecentralisedNews
The Centralized Futures Index 2027: 25 Exchanges Ranked
The biggest difference between a centralized futures exchange and a perp DEX isn't the chart.
It's where your collateral sits.
On a centralized exchange, your margin is ultimately a claim on the exchange.
That gives traders enormous advantages:
deep order books
portfolio margin
cross-collateral
mature APIs
block trading
fiat rails
customer support
But it also creates something perp DEX traders don't face in quite the same way:
centralized counterparty risk.
So we built the new DN Centralized Futures Index 2027.
We ranked 25 centralized crypto futures exchanges across:
• liquidity & depth
• open interest
• trading fees
• funding economics
• counterparty transparency
• proof of reserves
• regulatory profile
• derivatives tooling
• market breadth
• API reliability
• trader UX
Current top 10:
1. Binance — 9.8/10
2. OKX — 9.6/10
3. Bybit — 9.4/10
4. Gate — 9.3/10
5. Bitget — 9.2/10
6. MEXC — 9.1/10
7. Deribit by Coinbase — 9.1/10
8. Kraken — 9.0/10
9. BingX — 8.8/10
10. KuCoin — 8.6/10
But the rankings aren't the most interesting finding. So we also built the: DN CEX Futures Pathfinder + Counterparty Exposure Engine
Enter:
position size
leverage
maker/taker
holding period
funding assumption
slippage
exchange balance
and your priority
The tool calculates:
✓ estimated margin
✓ round-trip commission
✓ funding
✓ slippage
✓ total cost
✓ cost as % of margin
✓ capital exposed to exchange counterparty risk
✓ recommended venues
Another major trend emerged. Centralized crypto exchanges are becoming global leveraged-markets platforms.
Stocks.
Indices.
FX.
Commodities.
Metals.
Pre-IPO exposures.
That's a much larger battle.
Read the complete, technical review on Decentralised.News
#Crypto #Futures #Binance #Derivatives #Trading #Bitcoin #CryptoTrading #DecentralisedNews
The biggest difference between a centralized futures exchange and a perp DEX isn't the chart.
It's where your collateral sits.
On a centralized exchange, your margin is ultimately a claim on the exchange.
That gives traders enormous advantages:
deep order books
portfolio margin
cross-collateral
mature APIs
block trading
fiat rails
customer support
But it also creates something perp DEX traders don't face in quite the same way:
centralized counterparty risk.
So we built the new DN Centralized Futures Index 2027.
We ranked 25 centralized crypto futures exchanges across:
• liquidity & depth
• open interest
• trading fees
• funding economics
• counterparty transparency
• proof of reserves
• regulatory profile
• derivatives tooling
• market breadth
• API reliability
• trader UX
Current top 10:
1. Binance — 9.8/10
2. OKX — 9.6/10
3. Bybit — 9.4/10
4. Gate — 9.3/10
5. Bitget — 9.2/10
6. MEXC — 9.1/10
7. Deribit by Coinbase — 9.1/10
8. Kraken — 9.0/10
9. BingX — 8.8/10
10. KuCoin — 8.6/10
But the rankings aren't the most interesting finding. So we also built the: DN CEX Futures Pathfinder + Counterparty Exposure Engine
Enter:
position size
leverage
maker/taker
holding period
funding assumption
slippage
exchange balance
and your priority
The tool calculates:
✓ estimated margin
✓ round-trip commission
✓ funding
✓ slippage
✓ total cost
✓ cost as % of margin
✓ capital exposed to exchange counterparty risk
✓ recommended venues
Another major trend emerged. Centralized crypto exchanges are becoming global leveraged-markets platforms.
Stocks.
Indices.
FX.
Commodities.
Metals.
Pre-IPO exposures.
That's a much larger battle.
Read the complete, technical review on Decentralised.News
#Crypto #Futures #Binance #Derivatives #Trading #Bitcoin #CryptoTrading #DecentralisedNews
1
87
AI Trading Agent vs Trading Bot: 7 Platforms Compared
A traditional trading bot follows rules.
An AI trading agent can decide **which steps are needed to achieve an objective.**
That distinction is becoming much more important.
We compared **7 real AI trading-agent architectures**:
Wayfinder
QuantPilot
Coinrule MCP
3Commas MCP
HaasOnline MCP
Tickeron AI Agents
ASCN AI
against traditional trading bots such as:
Gunbot
Bitsgap
Pionex
Cryptohopper
The difference is not simply whether the software uses AI.
It is:
**How much discretion exists between your objective and the financial action?**
Tell a Grid bot:
“Trade BTC between these two prices using 50 grids.”
It executes the rule.
Tell an AI agent:
“My BTC portfolio has too much downside exposure. Find a reasonable hedge without selling the spot position.”
Now the system may need to:
inspect the portfolio,
research markets,
compare venues,
check funding,
evaluate hedge structures,
select tools,
calculate size,
and potentially execute.
We call the range of decisions the machine can make:
**The Discretion Envelope.**
And the useful capability created by that discretion:
**The Agentic Delta.**
If the task is:
buy every Monday,
maintain a Grid,
rebalance monthly,
or execute a fixed indicator rule,
the Agentic Delta may be close to zero.
A deterministic bot may actually be the better tool.
But if the task is:
research several hedge structures,
investigate why a strategy stopped working,
build and test new logic,
compare execution routes,
or coordinate multiple tools,
agency starts to matter.
The most interesting architectures also keep intelligence and financial authority separate.
Read the complete research and use the free Agent-or-Bot Classifier on Decentralised.News
#AITrading #AIAgents #TradingBots #AgenticFinance #CryptoTrading #ArtificialIntelligence #Automation #MCP #Crypto #Fintech #DecentralisedNews
AI Trading Agent vs Trading Bot: 7 Platforms Compared
A traditional trading bot follows rules.
An AI trading agent can decide **which steps are needed to achieve an objective.**
That distinction is becoming much more important.
We compared **7 real AI trading-agent architectures**:
Wayfinder
QuantPilot
Coinrule MCP
3Commas MCP
HaasOnline MCP
Tickeron AI Agents
ASCN AI
against traditional trading bots such as:
Gunbot
Bitsgap
Pionex
Cryptohopper
The difference is not simply whether the software uses AI.
It is:
**How much discretion exists between your objective and the financial action?**
Tell a Grid bot:
“Trade BTC between these two prices using 50 grids.”
It executes the rule.
Tell an AI agent:
“My BTC portfolio has too much downside exposure. Find a reasonable hedge without selling the spot position.”
Now the system may need to:
inspect the portfolio,
research markets,
compare venues,
check funding,
evaluate hedge structures,
select tools,
calculate size,
and potentially execute.
We call the range of decisions the machine can make:
**The Discretion Envelope.**
And the useful capability created by that discretion:
**The Agentic Delta.**
If the task is:
buy every Monday,
maintain a Grid,
rebalance monthly,
or execute a fixed indicator rule,
the Agentic Delta may be close to zero.
A deterministic bot may actually be the better tool.
But if the task is:
research several hedge structures,
investigate why a strategy stopped working,
build and test new logic,
compare execution routes,
or coordinate multiple tools,
agency starts to matter.
The most interesting architectures also keep intelligence and financial authority separate.
Read the complete research and use the free Agent-or-Bot Classifier on Decentralised.News
#AITrading #AIAgents #TradingBots #AgenticFinance #CryptoTrading #ArtificialIntelligence #Automation #MCP #Crypto #Fintech #DecentralisedNews
A traditional trading bot follows rules.
An AI trading agent can decide **which steps are needed to achieve an objective.**
That distinction is becoming much more important.
We compared **7 real AI trading-agent architectures**:
Wayfinder
QuantPilot
Coinrule MCP
3Commas MCP
HaasOnline MCP
Tickeron AI Agents
ASCN AI
against traditional trading bots such as:
Gunbot
Bitsgap
Pionex
Cryptohopper
The difference is not simply whether the software uses AI.
It is:
**How much discretion exists between your objective and the financial action?**
Tell a Grid bot:
“Trade BTC between these two prices using 50 grids.”
It executes the rule.
Tell an AI agent:
“My BTC portfolio has too much downside exposure. Find a reasonable hedge without selling the spot position.”
Now the system may need to:
inspect the portfolio,
research markets,
compare venues,
check funding,
evaluate hedge structures,
select tools,
calculate size,
and potentially execute.
We call the range of decisions the machine can make:
**The Discretion Envelope.**
And the useful capability created by that discretion:
**The Agentic Delta.**
If the task is:
buy every Monday,
maintain a Grid,
rebalance monthly,
or execute a fixed indicator rule,
the Agentic Delta may be close to zero.
A deterministic bot may actually be the better tool.
But if the task is:
research several hedge structures,
investigate why a strategy stopped working,
build and test new logic,
compare execution routes,
or coordinate multiple tools,
agency starts to matter.
The most interesting architectures also keep intelligence and financial authority separate.
Read the complete research and use the free Agent-or-Bot Classifier on Decentralised.News
#AITrading #AIAgents #TradingBots #AgenticFinance #CryptoTrading #ArtificialIntelligence #Automation #MCP #Crypto #Fintech #DecentralisedNews
79
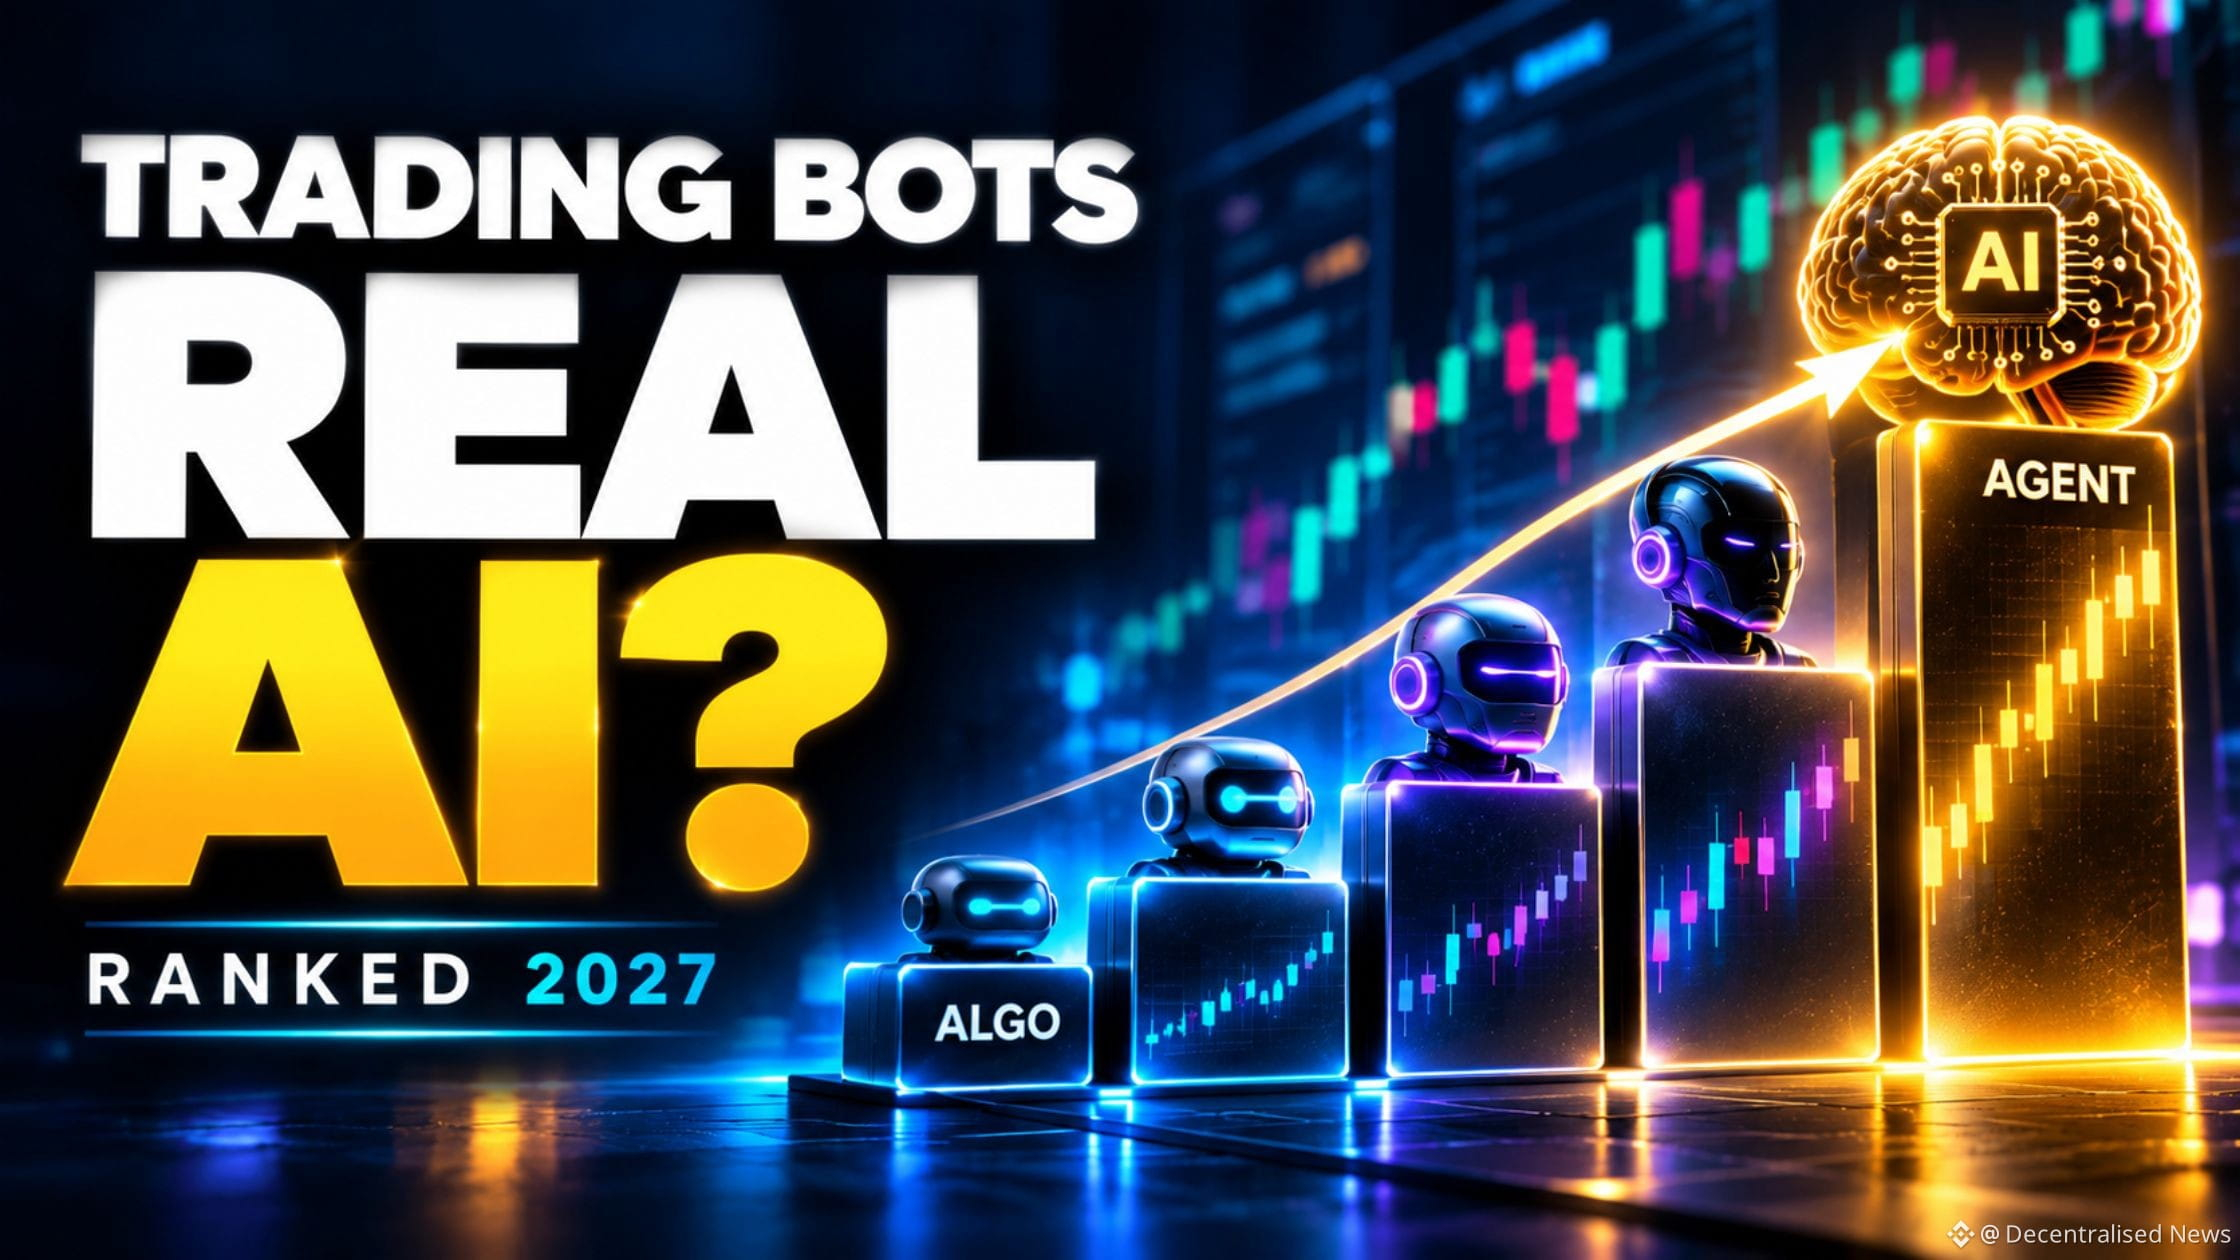
Which AI Trading Bots Actually Use AI? 10 Platforms Compared
Almost every trading bot is suddenly **“AI-powered.”**
But what does the AI actually do?
We investigated **10 AI-labelled and AI-adjacent trading platforms**:
QuantPilot
Tickeron
Coinrule
3Commas v2
HaasOnline
Capitalise(dot)ai
Gunbot
Bitsgap
Pionex
Cryptohopper
And found completely different technologies hiding behind the same phrase:
**AI trading bot.**
Some use machine learning to generate signals.
Some let LLMs call trading tools.
Some use AI to write strategy code.
Some use AI only to configure a bot.
Some use historical algorithms to recommend parameters.
And some are mostly deterministic automation.
One of the clearest examples?
Cryptohopper explicitly says its established **“A.I.” means Algorithmic Intelligence, not Artificial Intelligence.**
Pionex AI Grid uses historical backtests and quantitative algorithms to suggest Grid settings.
Bitsgap's AI Assistant helps configure a portfolio of bots, but the underlying bots execute rule-based strategies.
Coinrule lets compatible LLMs use authorized trading tools through MCP.
HaasOnline goes even further upstream.
Its AI agent can:
inspect bots,
analyze live context,
write strategy code,
compile it,
and run backtests.
But its current Cloud MCP deliberately does **not** expose live order-placement tools.
Then there is QuantPilot, where autonomous agents can research markets, write strategy code, backtest and iteratively optimize strategies.
These are not the same architecture.
So we created the:
**DN AI Trading Reality Ladder**
0 → Deterministic Bot
1 → Algorithmic Optimizer
2 → AI-Assisted Builder
3 → ML Decision System
4 → LLM Tool User
5 → Bounded Agent
And introduced another concept:
**AI Proximity to Capital.**
The important question isn't merely how much AI a platform uses.
It is:
**How close is probabilistic AI output to irreversible financial action?**
Read the complete research and use the free AI Trading Reality Checker on Decentralised.News
#AITrading #AIAgents #TradingBots
Which AI Trading Bots Actually Use AI? 10 Platforms Compared
Almost every trading bot is suddenly **“AI-powered.”**
But what does the AI actually do?
We investigated **10 AI-labelled and AI-adjacent trading platforms**:
QuantPilot
Tickeron
Coinrule
3Commas v2
HaasOnline
Capitalise(dot)ai
Gunbot
Bitsgap
Pionex
Cryptohopper
And found completely different technologies hiding behind the same phrase:
**AI trading bot.**
Some use machine learning to generate signals.
Some let LLMs call trading tools.
Some use AI to write strategy code.
Some use AI only to configure a bot.
Some use historical algorithms to recommend parameters.
And some are mostly deterministic automation.
One of the clearest examples?
Cryptohopper explicitly says its established **“A.I.” means Algorithmic Intelligence, not Artificial Intelligence.**
Pionex AI Grid uses historical backtests and quantitative algorithms to suggest Grid settings.
Bitsgap's AI Assistant helps configure a portfolio of bots, but the underlying bots execute rule-based strategies.
Coinrule lets compatible LLMs use authorized trading tools through MCP.
HaasOnline goes even further upstream.
Its AI agent can:
inspect bots,
analyze live context,
write strategy code,
compile it,
and run backtests.
But its current Cloud MCP deliberately does **not** expose live order-placement tools.
Then there is QuantPilot, where autonomous agents can research markets, write strategy code, backtest and iteratively optimize strategies.
These are not the same architecture.
So we created the:
**DN AI Trading Reality Ladder**
0 → Deterministic Bot
1 → Algorithmic Optimizer
2 → AI-Assisted Builder
3 → ML Decision System
4 → LLM Tool User
5 → Bounded Agent
And introduced another concept:
**AI Proximity to Capital.**
The important question isn't merely how much AI a platform uses.
It is:
**How close is probabilistic AI output to irreversible financial action?**
Read the complete research and use the free AI Trading Reality Checker on Decentralised.News
#AITrading #AIAgents #TradingBots
Almost every trading bot is suddenly **“AI-powered.”**
But what does the AI actually do?
We investigated **10 AI-labelled and AI-adjacent trading platforms**:
QuantPilot
Tickeron
Coinrule
3Commas v2
HaasOnline
Capitalise(dot)ai
Gunbot
Bitsgap
Pionex
Cryptohopper
And found completely different technologies hiding behind the same phrase:
**AI trading bot.**
Some use machine learning to generate signals.
Some let LLMs call trading tools.
Some use AI to write strategy code.
Some use AI only to configure a bot.
Some use historical algorithms to recommend parameters.
And some are mostly deterministic automation.
One of the clearest examples?
Cryptohopper explicitly says its established **“A.I.” means Algorithmic Intelligence, not Artificial Intelligence.**
Pionex AI Grid uses historical backtests and quantitative algorithms to suggest Grid settings.
Bitsgap's AI Assistant helps configure a portfolio of bots, but the underlying bots execute rule-based strategies.
Coinrule lets compatible LLMs use authorized trading tools through MCP.
HaasOnline goes even further upstream.
Its AI agent can:
inspect bots,
analyze live context,
write strategy code,
compile it,
and run backtests.
But its current Cloud MCP deliberately does **not** expose live order-placement tools.
Then there is QuantPilot, where autonomous agents can research markets, write strategy code, backtest and iteratively optimize strategies.
These are not the same architecture.
So we created the:
**DN AI Trading Reality Ladder**
0 → Deterministic Bot
1 → Algorithmic Optimizer
2 → AI-Assisted Builder
3 → ML Decision System
4 → LLM Tool User
5 → Bounded Agent
And introduced another concept:
**AI Proximity to Capital.**
The important question isn't merely how much AI a platform uses.
It is:
**How close is probabilistic AI output to irreversible financial action?**
Read the complete research and use the free AI Trading Reality Checker on Decentralised.News
#AITrading #AIAgents #TradingBots
33
How to Test MCP Servers Before Giving Agents Real Authority
An MCP server can be online while the agent’s workflow fails.
A market-data tool can return a stale price.
A CRM tool can create the same record twice after a retry.
A reachable endpoint can still reject valid requests or accept unauthorized ones.
Our MCP Server Reliability Index 2027 proposes five dimensions for evaluation:
• Accepted tool outcomes
• Availability
• Schema compatibility
• Recovery
• Authorization enforcement
The DN calculator keeps serious failures separate from the weighted score, so a high average cannot hide an unauthorized action or duplicate write.
This first edition publishes the methodology and illustrative calculator. It does not claim a tested vendor leaderboard.
Read the complete guide on Decentralised.News
#MCP #AIAgents #AgenticAI #AIInfrastructure
How to Test MCP Servers Before Giving Agents Real Authority
An MCP server can be online while the agent’s workflow fails.
A market-data tool can return a stale price.
A CRM tool can create the same record twice after a retry.
A reachable endpoint can still reject valid requests or accept unauthorized ones.
Our MCP Server Reliability Index 2027 proposes five dimensions for evaluation:
• Accepted tool outcomes
• Availability
• Schema compatibility
• Recovery
• Authorization enforcement
The DN calculator keeps serious failures separate from the weighted score, so a high average cannot hide an unauthorized action or duplicate write.
This first edition publishes the methodology and illustrative calculator. It does not claim a tested vendor leaderboard.
Read the complete guide on Decentralised.News
#MCP #AIAgents #AgenticAI #AIInfrastructure
An MCP server can be online while the agent’s workflow fails.
A market-data tool can return a stale price.
A CRM tool can create the same record twice after a retry.
A reachable endpoint can still reject valid requests or accept unauthorized ones.
Our MCP Server Reliability Index 2027 proposes five dimensions for evaluation:
• Accepted tool outcomes
• Availability
• Schema compatibility
• Recovery
• Authorization enforcement
The DN calculator keeps serious failures separate from the weighted score, so a high average cannot hide an unauthorized action or duplicate write.
This first edition publishes the methodology and illustrative calculator. It does not claim a tested vendor leaderboard.
Read the complete guide on Decentralised.News
#MCP #AIAgents #AgenticAI #AIInfrastructure

1
101
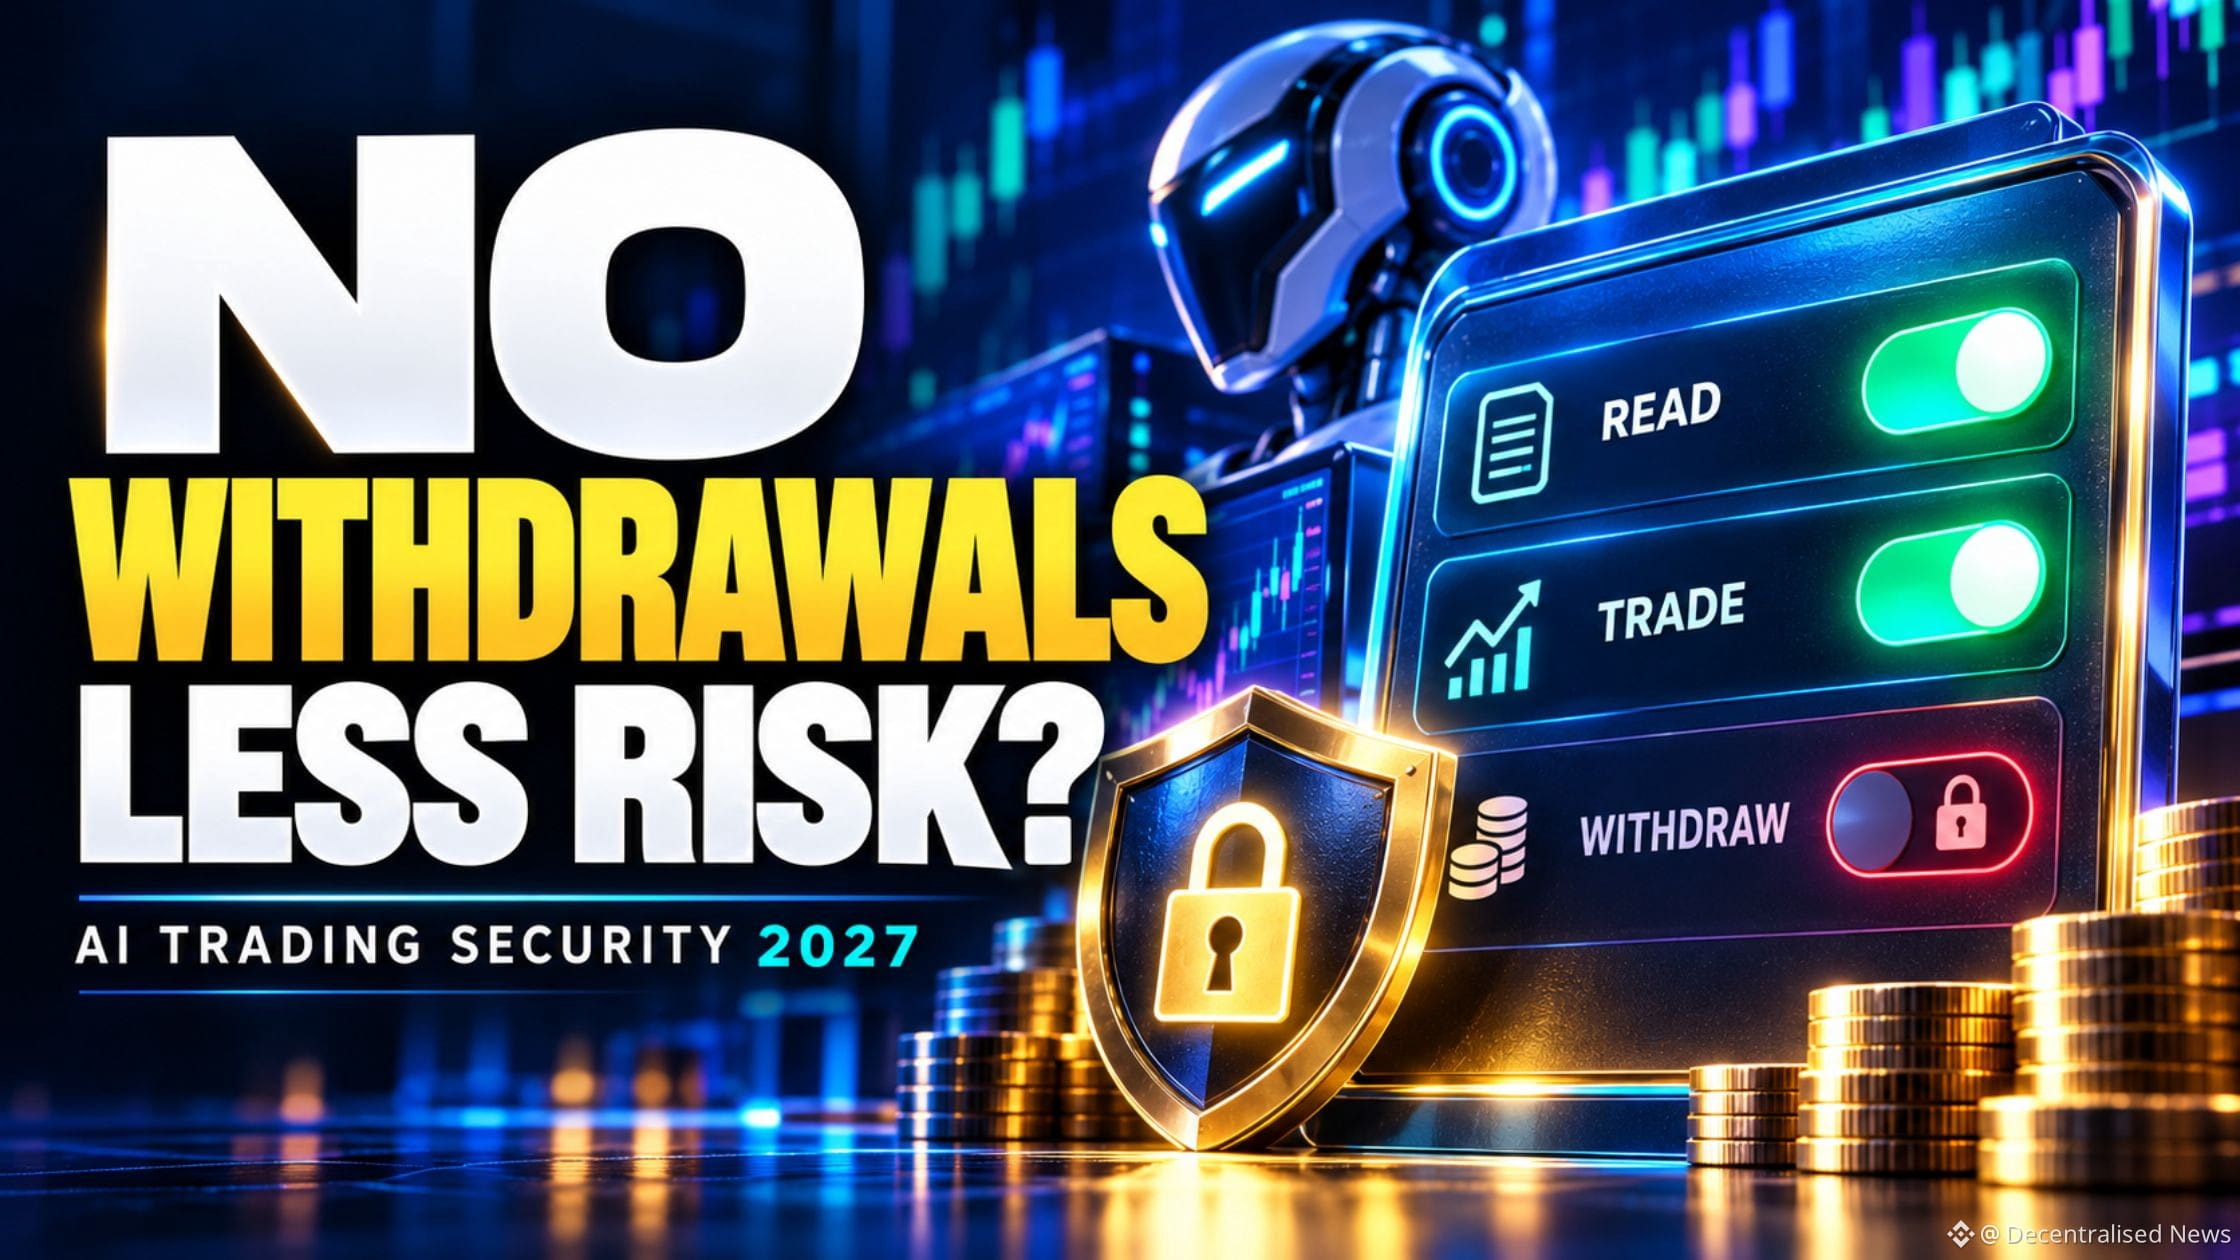
Best AI Crypto Trading Tools for Beginners: 11 Platforms Compared
AI trading is getting easier.
That does not automatically make it safer for beginners.
A complete beginner can now:
ask AI for a strategy,
turn plain English into trading rules,
backtest it,
launch a bot,
connect an exchange,
and automate execution.
Sometimes in minutes.
The problem?
**Software can become capable faster than the user becomes knowledgeable.**
We call this the:
**Automation Comprehension Gap.**
It is the difference between:
**what the trading system can do**
and
**what the user actually understands about what it is doing.**
That is why we compared **11 AI crypto trading tools for complete beginners** using a very different framework.
Not:
Who promises the highest return?
Instead:
• Setup Simplicity
• Learning Value
• Simulation Access
• Permission Safety
• Observability
• AI Authenticity
• Complexity Burden
The current list includes:
Coinrule
Capitalise(dot)ai
3Commas v2
Cornix
TradeSanta
TradingView
ASCN AI
Cryptohopper
Bitsgap
Tickeron
Gunbot
And the differences matter.
Some use genuine AI.
Some use LLM-connected tools.
Some are deterministic bots.
Some are research systems.
Some use machine learning.
+ Cryptohopper's established **A.I.** actually means **Algorithmic Intelligence**, not Artificial Intelligence.
+ Bitsgap lets users demo its bots, but its AI Assistant is not currently included in Demo Mode.
+ TradingView is not an autonomous AI trader at all.
Yet it may be one of the smartest beginner tools because learning how to define an alert can be more useful than immediately automating an order.
That leads to another DN concept:
**Beginner Authority Ceiling.**
A beginner should not give a machine more financial authority simply because the software supports it.
Permissions should expand more slowly than understanding.
Read the complete guide on Decentralised.News
#AITrading #CryptoTrading #AIAgents #TradingBots #ChatGPT #Crypto #AgenticFinance #Automation #ArtificialIntelligence #Fintech #DecentralisedNews
Best AI Crypto Trading Tools for Beginners: 11 Platforms Compared
AI trading is getting easier.
That does not automatically make it safer for beginners.
A complete beginner can now:
ask AI for a strategy,
turn plain English into trading rules,
backtest it,
launch a bot,
connect an exchange,
and automate execution.
Sometimes in minutes.
The problem?
**Software can become capable faster than the user becomes knowledgeable.**
We call this the:
**Automation Comprehension Gap.**
It is the difference between:
**what the trading system can do**
and
**what the user actually understands about what it is doing.**
That is why we compared **11 AI crypto trading tools for complete beginners** using a very different framework.
Not:
Who promises the highest return?
Instead:
• Setup Simplicity
• Learning Value
• Simulation Access
• Permission Safety
• Observability
• AI Authenticity
• Complexity Burden
The current list includes:
Coinrule
Capitalise(dot)ai
3Commas v2
Cornix
TradeSanta
TradingView
ASCN AI
Cryptohopper
Bitsgap
Tickeron
Gunbot
And the differences matter.
Some use genuine AI.
Some use LLM-connected tools.
Some are deterministic bots.
Some are research systems.
Some use machine learning.
+ Cryptohopper's established **A.I.** actually means **Algorithmic Intelligence**, not Artificial Intelligence.
+ Bitsgap lets users demo its bots, but its AI Assistant is not currently included in Demo Mode.
+ TradingView is not an autonomous AI trader at all.
Yet it may be one of the smartest beginner tools because learning how to define an alert can be more useful than immediately automating an order.
That leads to another DN concept:
**Beginner Authority Ceiling.**
A beginner should not give a machine more financial authority simply because the software supports it.
Permissions should expand more slowly than understanding.
Read the complete guide on Decentralised.News
#AITrading #CryptoTrading #AIAgents #TradingBots #ChatGPT #Crypto #AgenticFinance #Automation #ArtificialIntelligence #Fintech #DecentralisedNews
AI trading is getting easier.
That does not automatically make it safer for beginners.
A complete beginner can now:
ask AI for a strategy,
turn plain English into trading rules,
backtest it,
launch a bot,
connect an exchange,
and automate execution.
Sometimes in minutes.
The problem?
**Software can become capable faster than the user becomes knowledgeable.**
We call this the:
**Automation Comprehension Gap.**
It is the difference between:
**what the trading system can do**
and
**what the user actually understands about what it is doing.**
That is why we compared **11 AI crypto trading tools for complete beginners** using a very different framework.
Not:
Who promises the highest return?
Instead:
• Setup Simplicity
• Learning Value
• Simulation Access
• Permission Safety
• Observability
• AI Authenticity
• Complexity Burden
The current list includes:
Coinrule
Capitalise(dot)ai
3Commas v2
Cornix
TradeSanta
TradingView
ASCN AI
Cryptohopper
Bitsgap
Tickeron
Gunbot
And the differences matter.
Some use genuine AI.
Some use LLM-connected tools.
Some are deterministic bots.
Some are research systems.
Some use machine learning.
+ Cryptohopper's established **A.I.** actually means **Algorithmic Intelligence**, not Artificial Intelligence.
+ Bitsgap lets users demo its bots, but its AI Assistant is not currently included in Demo Mode.
+ TradingView is not an autonomous AI trader at all.
Yet it may be one of the smartest beginner tools because learning how to define an alert can be more useful than immediately automating an order.
That leads to another DN concept:
**Beginner Authority Ceiling.**
A beginner should not give a machine more financial authority simply because the software supports it.
Permissions should expand more slowly than understanding.
Read the complete guide on Decentralised.News
#AITrading #CryptoTrading #AIAgents #TradingBots #ChatGPT #Crypto #AgenticFinance #Automation #ArtificialIntelligence #Fintech #DecentralisedNews
58
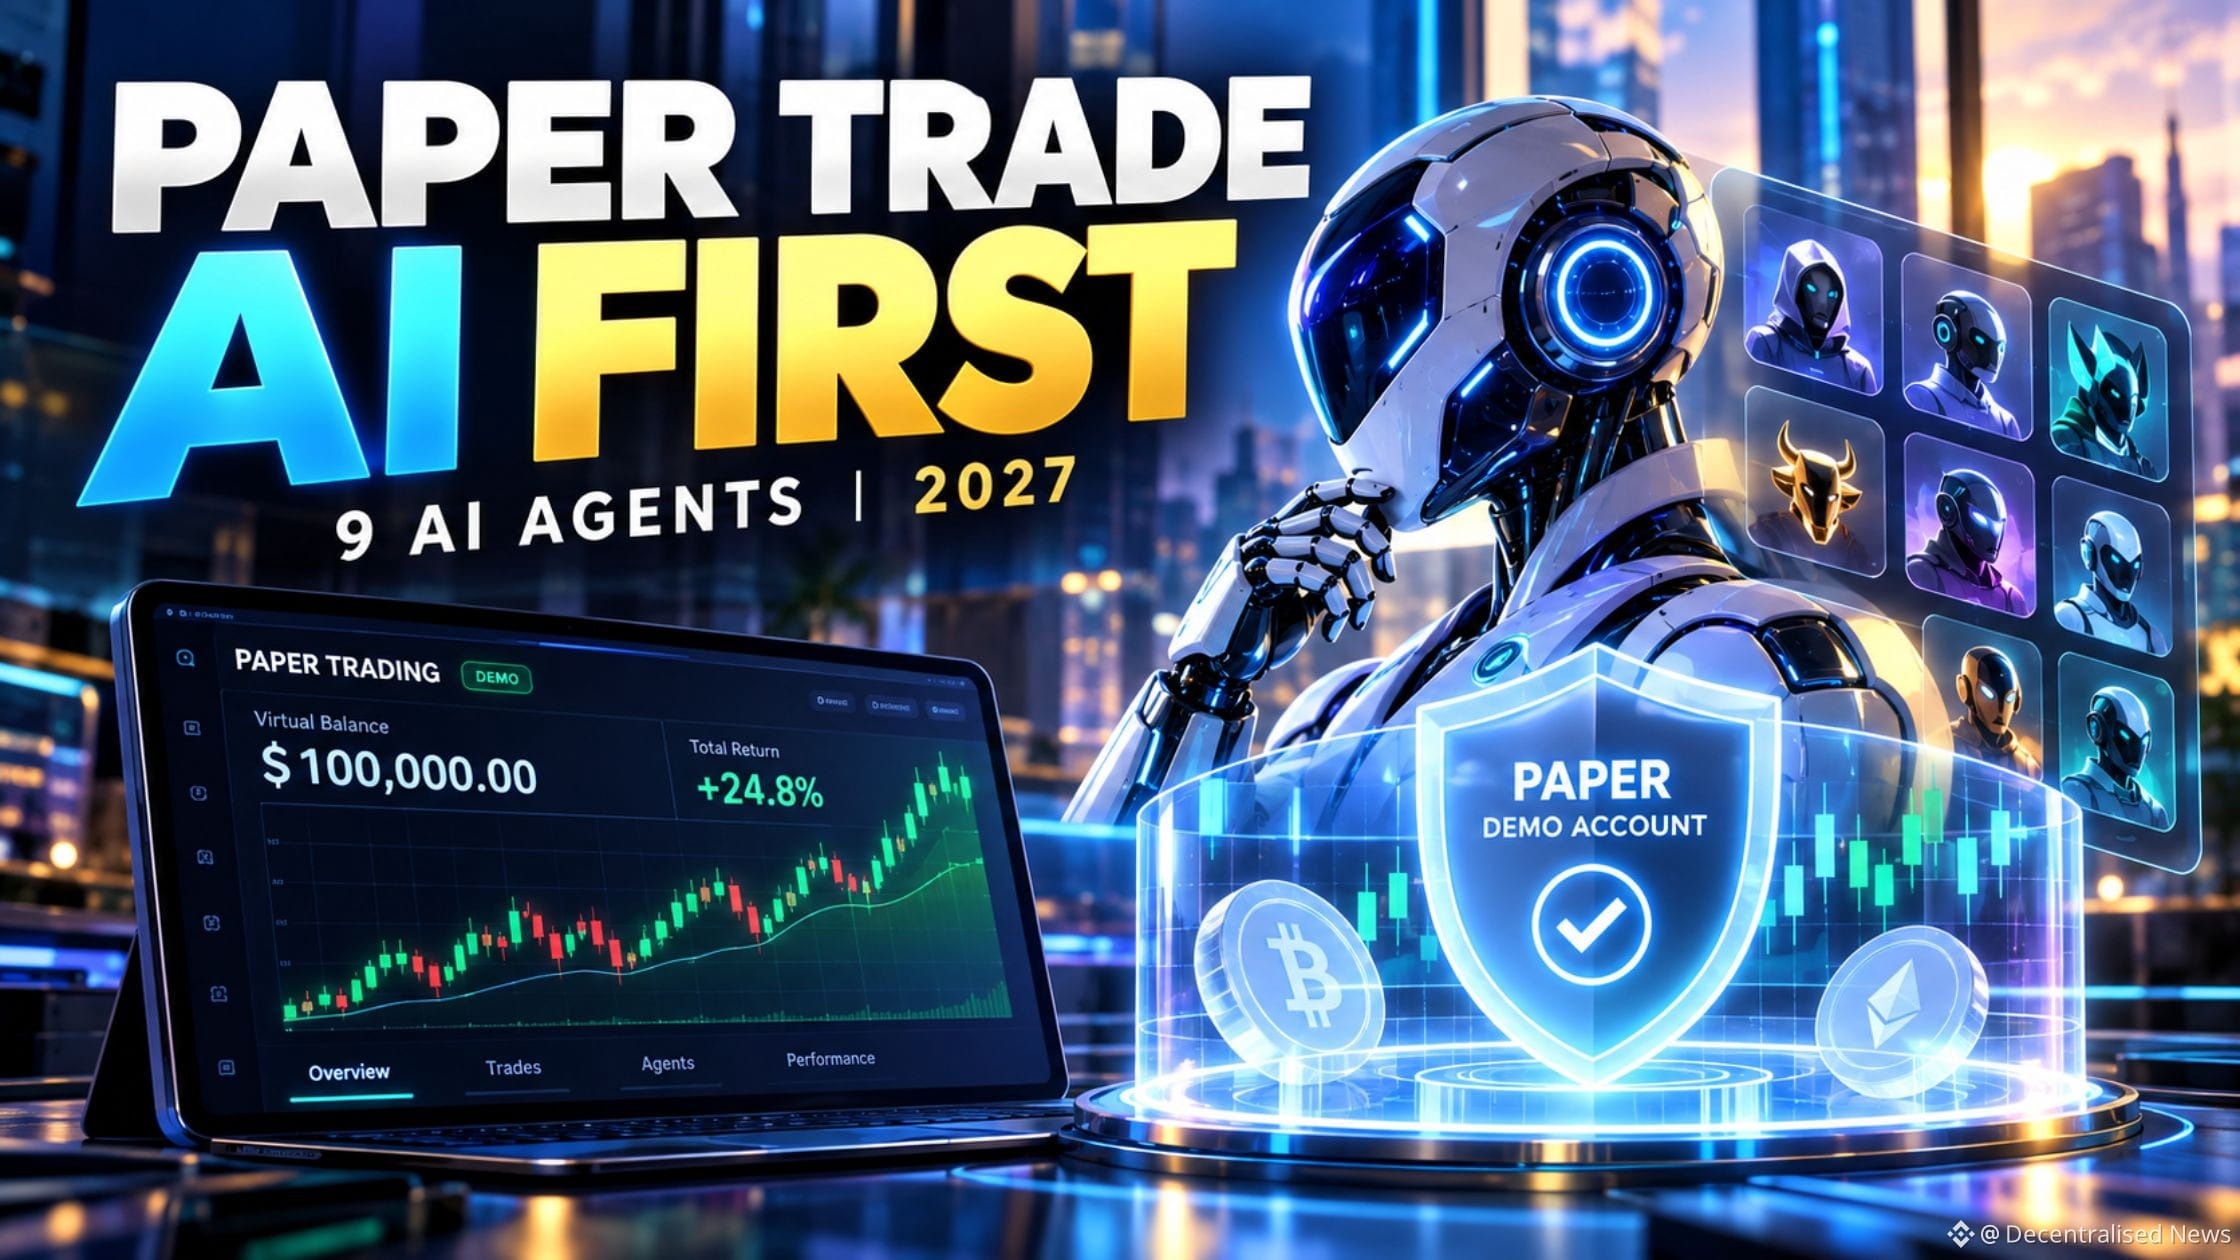
The Best AI Trading Demo Accounts for 2027
You do **not** need to risk real money to find out whether an AI trading system is useful.
In fact, that should probably be the last thing you do.
We compared **9 AI trading agents and automated platforms you can test with paper money, demo accounts or simulation before going live.**
The most important finding:
**Paper trading is not one thing.**
There are at least four different types:
Historical backtesting
Real-time paper trading
Platform demo accounts
Read-only AI sandboxes
And they test different things.
A profitable backtest does not prove live execution.
A demo bot does not prove the AI layer works.
A read-only agent does not prove write-enabled behavior will be safe.
And a green virtual P&L definitely does not prove future profitability.
That is why we built the:
**DN Paper-First Fit**
We evaluated platforms on:
• Simulation Depth
• AI / Agent Relevance
• Permission Safety
• Observability
• Live Transition Discipline
• Evidence Freshness
Read the complete guide and check out the **DN Paper-First AI Trading Selector** to match users with the right type of experiment on our main site.
#AITrading #TradingBots #AIAgents #CryptoTrading #PaperTrading #ChatGPT #AgenticFinance #Automation #ArtificialIntelligence #Crypto #DecentralisedNews
The Best AI Trading Demo Accounts for 2027
You do **not** need to risk real money to find out whether an AI trading system is useful.
In fact, that should probably be the last thing you do.
We compared **9 AI trading agents and automated platforms you can test with paper money, demo accounts or simulation before going live.**
The most important finding:
**Paper trading is not one thing.**
There are at least four different types:
Historical backtesting
Real-time paper trading
Platform demo accounts
Read-only AI sandboxes
And they test different things.
A profitable backtest does not prove live execution.
A demo bot does not prove the AI layer works.
A read-only agent does not prove write-enabled behavior will be safe.
And a green virtual P&L definitely does not prove future profitability.
That is why we built the:
**DN Paper-First Fit**
We evaluated platforms on:
• Simulation Depth
• AI / Agent Relevance
• Permission Safety
• Observability
• Live Transition Discipline
• Evidence Freshness
Read the complete guide and check out the **DN Paper-First AI Trading Selector** to match users with the right type of experiment on our main site.
#AITrading #TradingBots #AIAgents #CryptoTrading #PaperTrading #ChatGPT #AgenticFinance #Automation #ArtificialIntelligence #Crypto #DecentralisedNews
You do **not** need to risk real money to find out whether an AI trading system is useful.
In fact, that should probably be the last thing you do.
We compared **9 AI trading agents and automated platforms you can test with paper money, demo accounts or simulation before going live.**
The most important finding:
**Paper trading is not one thing.**
There are at least four different types:
Historical backtesting
Real-time paper trading
Platform demo accounts
Read-only AI sandboxes
And they test different things.
A profitable backtest does not prove live execution.
A demo bot does not prove the AI layer works.
A read-only agent does not prove write-enabled behavior will be safe.
And a green virtual P&L definitely does not prove future profitability.
That is why we built the:
**DN Paper-First Fit**
We evaluated platforms on:
• Simulation Depth
• AI / Agent Relevance
• Permission Safety
• Observability
• Live Transition Discipline
• Evidence Freshness
Read the complete guide and check out the **DN Paper-First AI Trading Selector** to match users with the right type of experiment on our main site.
#AITrading #TradingBots #AIAgents #CryptoTrading #PaperTrading #ChatGPT #AgenticFinance #Automation #ArtificialIntelligence #Crypto #DecentralisedNews
121
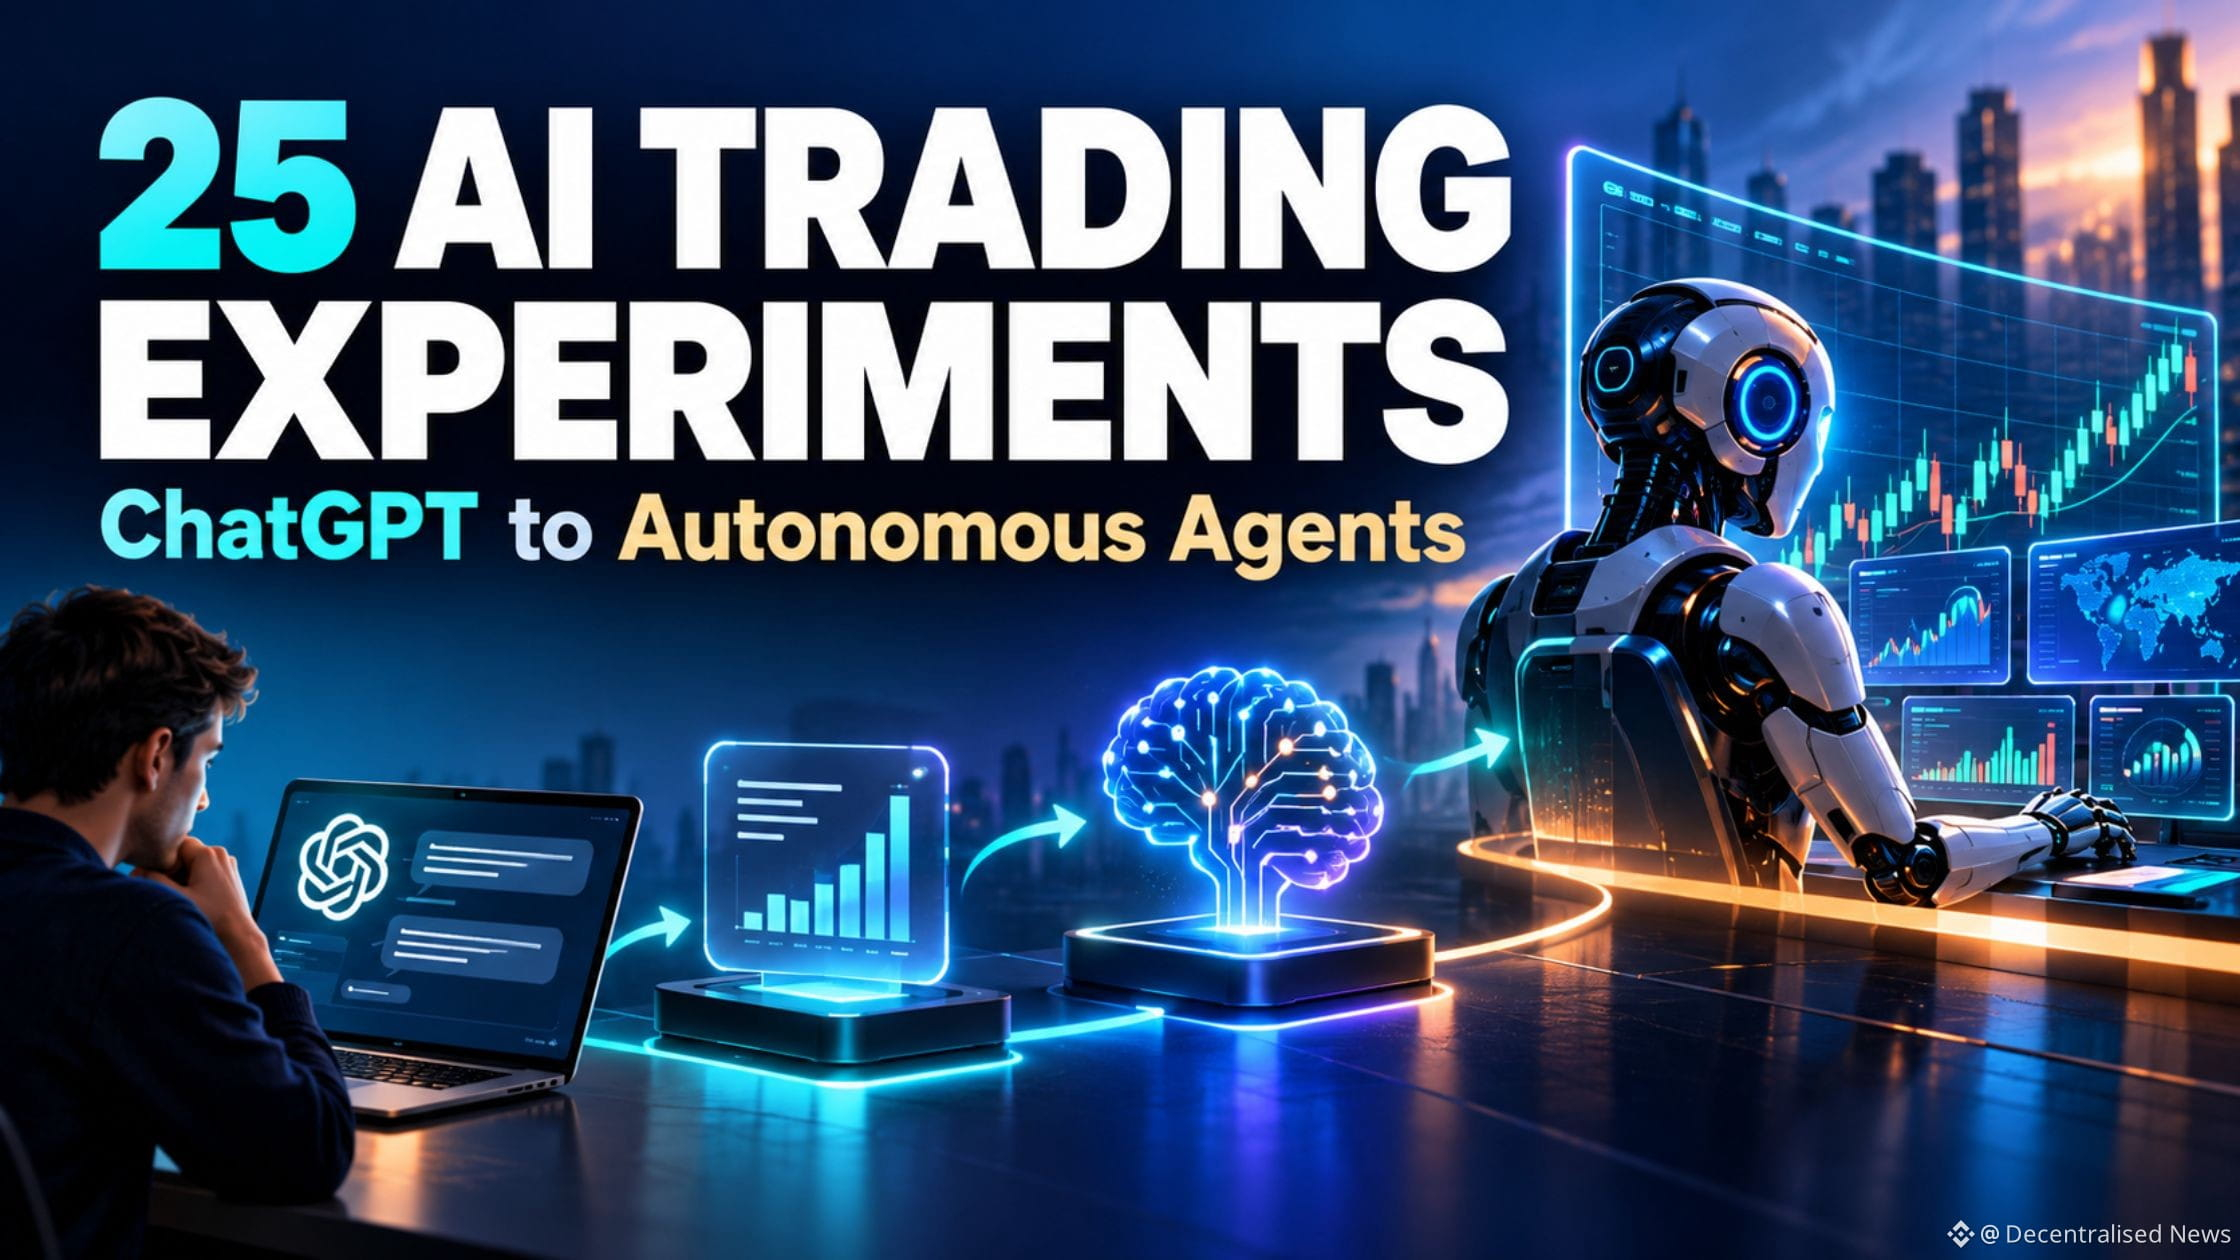
The 25 Best AI Trading Experiments to Try in 2027: From ChatGPT to Fully Autonomous Agents
Everyone wants to know:
**“What is the best AI trading bot?”**
That may be the wrong question.
Before handing an AI access to real capital, there are dozens of lower-risk experiments you can run first.
We mapped **25 AI trading experiments for 2027**, progressing from:
AI market research
↓
trade-thesis red teaming
↓
AI trading journals
↓
market-regime monitoring
↓
TradingView alerts
↓
paper trading
↓
AI-generated strategies
↓
ChatGPT-connected trading tools
↓
human-approved execution
↓
trade-only API bots
↓
multi-agent trading desks
↓
bounded wallet agents
↓
fully autonomous trading agents
The important variable is not just how intelligent the AI is.
It is how much **authority** you give it.
We call this:
**Authority Surface.**
A research assistant cannot directly lose your portfolio.
A trade-enabled bot can.
An agent that can transfer assets creates an even larger failure surface.
That leads to another DN framework:
**Agent Blast Radius.**
If the agent makes the worst mistake permitted by its current access, what can actually happen?
This is why the smartest path into AI trading is not:
Human → autonomous AI trader.
It is:
**Research → Monitor → Simulate → Approve → Automate → Agent.**
We also built the **DN AI Trading Pathfinder**, which recommends the lowest-authority experiment capable of achieving your objective based on:
• experience
• capital
• technical ability
• desired automation
• machine authority
AI trading is becoming real.
But the winning architecture may not be:
**“Let the smartest model control the money.”**
It may be:
**probabilistic reasoning upstream, deterministic risk control downstream.**
Let AI interpret messy information.
Let code decide what AI is allowed to do with capital.
Read the full Decentralised News research on our main site.
#AITrading
The 25 Best AI Trading Experiments to Try in 2027: From ChatGPT to Fully Autonomous Agents
Everyone wants to know:
**“What is the best AI trading bot?”**
That may be the wrong question.
Before handing an AI access to real capital, there are dozens of lower-risk experiments you can run first.
We mapped **25 AI trading experiments for 2027**, progressing from:
AI market research
↓
trade-thesis red teaming
↓
AI trading journals
↓
market-regime monitoring
↓
TradingView alerts
↓
paper trading
↓
AI-generated strategies
↓
ChatGPT-connected trading tools
↓
human-approved execution
↓
trade-only API bots
↓
multi-agent trading desks
↓
bounded wallet agents
↓
fully autonomous trading agents
The important variable is not just how intelligent the AI is.
It is how much **authority** you give it.
We call this:
**Authority Surface.**
A research assistant cannot directly lose your portfolio.
A trade-enabled bot can.
An agent that can transfer assets creates an even larger failure surface.
That leads to another DN framework:
**Agent Blast Radius.**
If the agent makes the worst mistake permitted by its current access, what can actually happen?
This is why the smartest path into AI trading is not:
Human → autonomous AI trader.
It is:
**Research → Monitor → Simulate → Approve → Automate → Agent.**
We also built the **DN AI Trading Pathfinder**, which recommends the lowest-authority experiment capable of achieving your objective based on:
• experience
• capital
• technical ability
• desired automation
• machine authority
AI trading is becoming real.
But the winning architecture may not be:
**“Let the smartest model control the money.”**
It may be:
**probabilistic reasoning upstream, deterministic risk control downstream.**
Let AI interpret messy information.
Let code decide what AI is allowed to do with capital.
Read the full Decentralised News research on our main site.
#AITrading
Everyone wants to know:
**“What is the best AI trading bot?”**
That may be the wrong question.
Before handing an AI access to real capital, there are dozens of lower-risk experiments you can run first.
We mapped **25 AI trading experiments for 2027**, progressing from:
AI market research
↓
trade-thesis red teaming
↓
AI trading journals
↓
market-regime monitoring
↓
TradingView alerts
↓
paper trading
↓
AI-generated strategies
↓
ChatGPT-connected trading tools
↓
human-approved execution
↓
trade-only API bots
↓
multi-agent trading desks
↓
bounded wallet agents
↓
fully autonomous trading agents
The important variable is not just how intelligent the AI is.
It is how much **authority** you give it.
We call this:
**Authority Surface.**
A research assistant cannot directly lose your portfolio.
A trade-enabled bot can.
An agent that can transfer assets creates an even larger failure surface.
That leads to another DN framework:
**Agent Blast Radius.**
If the agent makes the worst mistake permitted by its current access, what can actually happen?
This is why the smartest path into AI trading is not:
Human → autonomous AI trader.
It is:
**Research → Monitor → Simulate → Approve → Automate → Agent.**
We also built the **DN AI Trading Pathfinder**, which recommends the lowest-authority experiment capable of achieving your objective based on:
• experience
• capital
• technical ability
• desired automation
• machine authority
AI trading is becoming real.
But the winning architecture may not be:
**“Let the smartest model control the money.”**
It may be:
**probabilistic reasoning upstream, deterministic risk control downstream.**
Let AI interpret messy information.
Let code decide what AI is allowed to do with capital.
Read the full Decentralised News research on our main site.
#AITrading
118
Are Crypto VIP Tiers Worth It? Binance vs Bybit vs OKX vs Kraken vs Deribit
The cheapest crypto trading fee is not always the cheapest trade.
That becomes especially important once exchanges start pushing traders toward VIP tiers.
We built the DN VIP Break-Even Model to answer a more useful question:
When is a crypto VIP tier actually worth pursuing?
The model looks beyond the advertised fee and includes:
• Organic monthly turnover
• Maker vs taker mix
• Extra volume traded only to qualify
• Spread and slippage penalties
• Asset-balance requirements
• Exchange-token requirements
• Capital opportunity cost
• Routing concentration
At $1M of spot turnover and a 50/50 maker-taker mix, the modelled gross fee reduction at the first major VIP tier is roughly:
[Binance](https://www.binance.com/en/activity/referral-entry/CPA?fromActivityPage=true&ref=CPA_00SXKU7IO9): $50/month
OKX: $162.50/month
Bybit: $262.50/month
But those numbers alone can be misleading.
If reaching the tier requires unnecessary turnover, worse execution or additional idle capital, the “discount” can disappear.
We also introduce two DN concepts:
Tier-Chase Ratio
VIP benefit ÷ cost of trading only to qualify.
VIP Routing Lock-In Effect
The tendency to route orders to an inferior venue because maintaining a VIP threshold has become economically important.
The core conclusion:
Don’t optimise for the lowest trading fee. Optimise for the lowest total cost of execution.
The research includes an interactive DN VIP Break-Even Calculator.
Read the full analysis on Decentralised.News
#Crypto #CryptoTrading #QuantTrading #InstitutionalTrading #HFT #MarketStructure #Exchanges #FinTech
Are Crypto VIP Tiers Worth It? Binance vs Bybit vs OKX vs Kraken vs Deribit
The cheapest crypto trading fee is not always the cheapest trade.
That becomes especially important once exchanges start pushing traders toward VIP tiers.
We built the DN VIP Break-Even Model to answer a more useful question:
When is a crypto VIP tier actually worth pursuing?
The model looks beyond the advertised fee and includes:
• Organic monthly turnover
• Maker vs taker mix
• Extra volume traded only to qualify
• Spread and slippage penalties
• Asset-balance requirements
• Exchange-token requirements
• Capital opportunity cost
• Routing concentration
At $1M of spot turnover and a 50/50 maker-taker mix, the modelled gross fee reduction at the first major VIP tier is roughly:
Binance: $50/month
OKX: $162.50/month
Bybit: $262.50/month
But those numbers alone can be misleading.
If reaching the tier requires unnecessary turnover, worse execution or additional idle capital, the “discount” can disappear.
We also introduce two DN concepts:
Tier-Chase Ratio
VIP benefit ÷ cost of trading only to qualify.
VIP Routing Lock-In Effect
The tendency to route orders to an inferior venue because maintaining a VIP threshold has become economically important.
The core conclusion:
Don’t optimise for the lowest trading fee. Optimise for the lowest total cost of execution.
The research includes an interactive DN VIP Break-Even Calculator.
Read the full analysis on Decentralised.News
#Crypto #CryptoTrading #QuantTrading #InstitutionalTrading #HFT #MarketStructure #Exchanges #FinTech
The cheapest crypto trading fee is not always the cheapest trade.
That becomes especially important once exchanges start pushing traders toward VIP tiers.
We built the DN VIP Break-Even Model to answer a more useful question:
When is a crypto VIP tier actually worth pursuing?
The model looks beyond the advertised fee and includes:
• Organic monthly turnover
• Maker vs taker mix
• Extra volume traded only to qualify
• Spread and slippage penalties
• Asset-balance requirements
• Exchange-token requirements
• Capital opportunity cost
• Routing concentration
At $1M of spot turnover and a 50/50 maker-taker mix, the modelled gross fee reduction at the first major VIP tier is roughly:
Binance: $50/month
OKX: $162.50/month
Bybit: $262.50/month
But those numbers alone can be misleading.
If reaching the tier requires unnecessary turnover, worse execution or additional idle capital, the “discount” can disappear.
We also introduce two DN concepts:
Tier-Chase Ratio
VIP benefit ÷ cost of trading only to qualify.
VIP Routing Lock-In Effect
The tendency to route orders to an inferior venue because maintaining a VIP threshold has become economically important.
The core conclusion:
Don’t optimise for the lowest trading fee. Optimise for the lowest total cost of execution.
The research includes an interactive DN VIP Break-Even Calculator.
Read the full analysis on Decentralised.News
#Crypto #CryptoTrading #QuantTrading #InstitutionalTrading #HFT #MarketStructure #Exchanges #FinTech

123
Best Crypto Exchange APIs for Bots, Quants and HFT in 2027
The “fastest crypto exchange API” is not necessarily the one with the lowest ping.
For bots, quants and market makers, the real execution loop is:
Strategy → Serialization → Network → Gateway → Matching Engine → ACK → Market Data
That means raw RTT is only one piece of the latency puzzle.
We built the DN API Latency Benchmark 2027 to compare the infrastructure behind major crypto exchanges across:
• WebSocket and REST architecture
• FIX and SBE support
• Order-entry throughput
• Order acknowledgement telemetry
• Market-data delivery
• Rate limits
• Failover and resilience
• Institutional connectivity
• P95/P99 latency stability
One of the biggest findings:
Latency variance can matter more than median latency.
A venue with a 15 ms median response but frequent 200–500 ms spikes can be harder to trade systematically than one with a stable 25–30 ms path.
That is why we introduced the DN Latency Stability Ratio:
P95 Order ACK Latency ÷ Median Order ACK Latency
The lower the ratio, the more predictable the execution path.
We also built an interactive DN API Latency Lab so traders can enter their own RTT, acknowledgement times, feed delay and disconnect data to calculate a live latency score.
Read the full benchmark on Decentralised.News
#Crypto #QuantTrading #AlgorithmicTrading #HFT #TradingBots #MarketMaking #WebSocket #FIX #CryptoTrading #APIs #FinTech
Best Crypto Exchange APIs for Bots, Quants and HFT in 2027
The “fastest crypto exchange API” is not necessarily the one with the lowest ping.
For bots, quants and market makers, the real execution loop is:
Strategy → Serialization → Network → Gateway → Matching Engine → ACK → Market Data
That means raw RTT is only one piece of the latency puzzle.
We built the DN API Latency Benchmark 2027 to compare the infrastructure behind major crypto exchanges across:
• WebSocket and REST architecture
• FIX and SBE support
• Order-entry throughput
• Order acknowledgement telemetry
• Market-data delivery
• Rate limits
• Failover and resilience
• Institutional connectivity
• P95/P99 latency stability
One of the biggest findings:
Latency variance can matter more than median latency.
A venue with a 15 ms median response but frequent 200–500 ms spikes can be harder to trade systematically than one with a stable 25–30 ms path.
That is why we introduced the DN Latency Stability Ratio:
P95 Order ACK Latency ÷ Median Order ACK Latency
The lower the ratio, the more predictable the execution path.
We also built an interactive DN API Latency Lab so traders can enter their own RTT, acknowledgement times, feed delay and disconnect data to calculate a live latency score.
Read the full benchmark on Decentralised.News
#Crypto #QuantTrading #AlgorithmicTrading #HFT #TradingBots #MarketMaking #WebSocket #FIX #CryptoTrading #APIs #FinTech
The “fastest crypto exchange API” is not necessarily the one with the lowest ping.
For bots, quants and market makers, the real execution loop is:
Strategy → Serialization → Network → Gateway → Matching Engine → ACK → Market Data
That means raw RTT is only one piece of the latency puzzle.
We built the DN API Latency Benchmark 2027 to compare the infrastructure behind major crypto exchanges across:
• WebSocket and REST architecture
• FIX and SBE support
• Order-entry throughput
• Order acknowledgement telemetry
• Market-data delivery
• Rate limits
• Failover and resilience
• Institutional connectivity
• P95/P99 latency stability
One of the biggest findings:
Latency variance can matter more than median latency.
A venue with a 15 ms median response but frequent 200–500 ms spikes can be harder to trade systematically than one with a stable 25–30 ms path.
That is why we introduced the DN Latency Stability Ratio:
P95 Order ACK Latency ÷ Median Order ACK Latency
The lower the ratio, the more predictable the execution path.
We also built an interactive DN API Latency Lab so traders can enter their own RTT, acknowledgement times, feed delay and disconnect data to calculate a live latency score.
Read the full benchmark on Decentralised.News
#Crypto #QuantTrading #AlgorithmicTrading #HFT #TradingBots #MarketMaking #WebSocket #FIX #CryptoTrading #APIs #FinTech
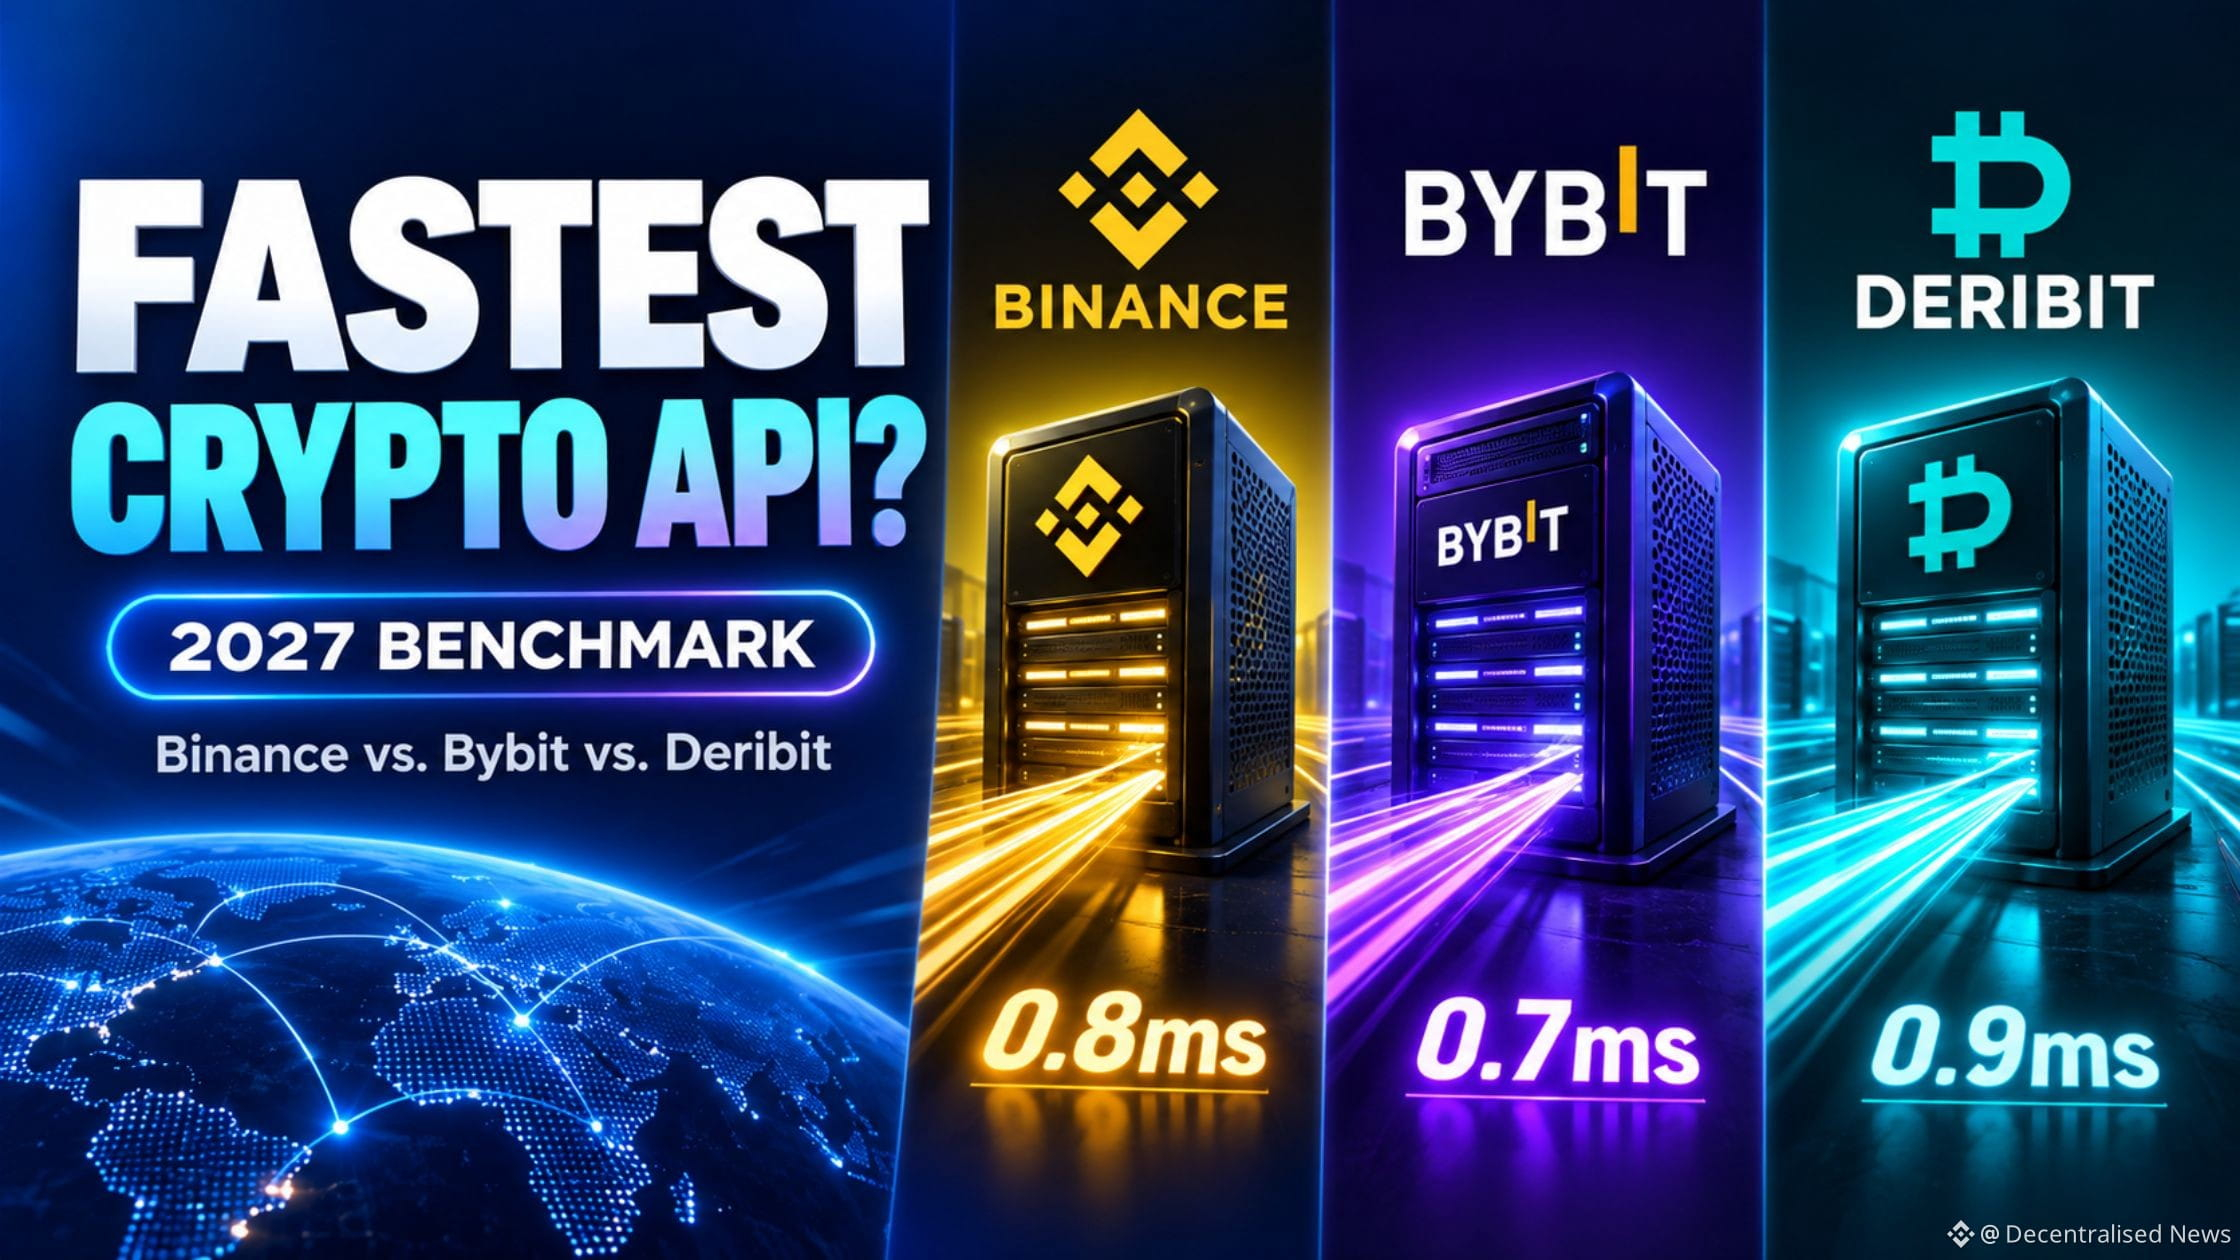
92
How to Set Up a Crypto Trading Bot on Binance Using 3Commas
Algorithmic trading isn't just for hedge funds anymore.
Platforms like 3Commas are democratising automation for retail traders... connecting directly to [Binance](https://www.binance.com/en/activity/referral-entry/CPA?fromActivityPage=true&ref=CPA_00SXKU7IO9), the world's largest exchange.
I wrote a full guide on:
• Setting up API keys securely
• Configuring DCA bots
• Backtesting strategies
• Risk management for automation
If you're trading crypto manually, you're competing against machines.
Full guide on Decentralised.News
#Crypto #Trading #Automation #Binance #3Commas #fintech
How to Set Up a Crypto Trading Bot on Binance Using 3Commas
Algorithmic trading isn't just for hedge funds anymore.
Platforms like 3Commas are democratising automation for retail traders... connecting directly to Binance, the world's largest exchange.
I wrote a full guide on:
• Setting up API keys securely
• Configuring DCA bots
• Backtesting strategies
• Risk management for automation
If you're trading crypto manually, you're competing against machines.
Full guide on Decentralised.News
#Crypto #Trading #Automation #Binance #3Commas #fintech
Algorithmic trading isn't just for hedge funds anymore.
Platforms like 3Commas are democratising automation for retail traders... connecting directly to Binance, the world's largest exchange.
I wrote a full guide on:
• Setting up API keys securely
• Configuring DCA bots
• Backtesting strategies
• Risk management for automation
If you're trading crypto manually, you're competing against machines.
Full guide on Decentralised.News
#Crypto #Trading #Automation #Binance #3Commas #fintech

71
How to Automate Crypto Trading When You Can’t Code (2026 Guide)
Algorithmic trading isn't just for hedge funds anymore.
Platforms like CoinRule are democratising automation — no code required.
I wrote a full guide on how to:
• Build "If This, Then That" trading rules
• Backtest strategies against historical data
• Connect to 20+ exchanges including [Binance](https://www.binance.com/en/activity/referral-entry/CPA?fromActivityPage=true&ref=CPA_00SXKU7IO9)
• Deploy with paper trading first
If you're in crypto and not automating, you're competing against machines manually.
Full guide on Decentralised.News
Disclaimer: This is not financial advice. Automated trading carries significant risk, including the potential loss of your entire investment. Past performance of trading strategies does not guarantee future results. Always do your own research and never deploy capital you cannot afford to lose.
#Crypto #Trading #Automation #FinTech #CoinRule
How to Automate Crypto Trading When You Can’t Code (2026 Guide)
Algorithmic trading isn't just for hedge funds anymore.
Platforms like CoinRule are democratising automation — no code required.
I wrote a full guide on how to:
• Build "If This, Then That" trading rules
• Backtest strategies against historical data
• Connect to 20+ exchanges including Binance
• Deploy with paper trading first
If you're in crypto and not automating, you're competing against machines manually.
Full guide on Decentralised.News
Disclaimer: This is not financial advice. Automated trading carries significant risk, including the potential loss of your entire investment. Past performance of trading strategies does not guarantee future results. Always do your own research and never deploy capital you cannot afford to lose.
#Crypto #Trading #Automation #FinTech #CoinRule
Algorithmic trading isn't just for hedge funds anymore.
Platforms like CoinRule are democratising automation — no code required.
I wrote a full guide on how to:
• Build "If This, Then That" trading rules
• Backtest strategies against historical data
• Connect to 20+ exchanges including Binance
• Deploy with paper trading first
If you're in crypto and not automating, you're competing against machines manually.
Full guide on Decentralised.News
Disclaimer: This is not financial advice. Automated trading carries significant risk, including the potential loss of your entire investment. Past performance of trading strategies does not guarantee future results. Always do your own research and never deploy capital you cannot afford to lose.
#Crypto #Trading #Automation #FinTech #CoinRule

79
Войдите, чтобы посмотреть больше материала
Присоединяйтесь к пользователям криптовалют по всему миру на Binance Square
⚡️ Получайте новейшую и полезную информацию о криптоактивах.
💬 Нам доверяет крупнейшая в мире криптобиржа.
👍 Получите достоверные аналитические данные от верифицированных создателей контента.
Эл. почта/номер телефона
В тренде
BinancePick
Просмотров: 3M
152,075 обсуждают
Join #EarningsSeason: Predict Earnings on Binance Pick, Share Your Take on Binance Square!
Binance Square Official
·Лайков: 409
·Просмотров: 342.6k
EarningsSeason
Просмотров: 5.2M
25,844 обсуждают
AnthropicTTMRevenueGrewAbout1200%
Просмотров: 22,273
355 обсуждают