
Huutruong039811
10.7k Публикации

Huutruong039811
Отправить жалобу
Заблокировать пользователя
Crypto Airdrop Daily | Follow for new opportunities | Binance UID 152277880 | X Huutruong039811 | KITE 277880 🇻🇳
Открытая сделка
Трейдер с частыми сделками
5.5 г
3.6K+ подписок(и/а)
2.4K+ подписчиков(а)
847 понравилось
Посты
Портфель
Все
Цитирования
Видео
Активно
·
--
Падение
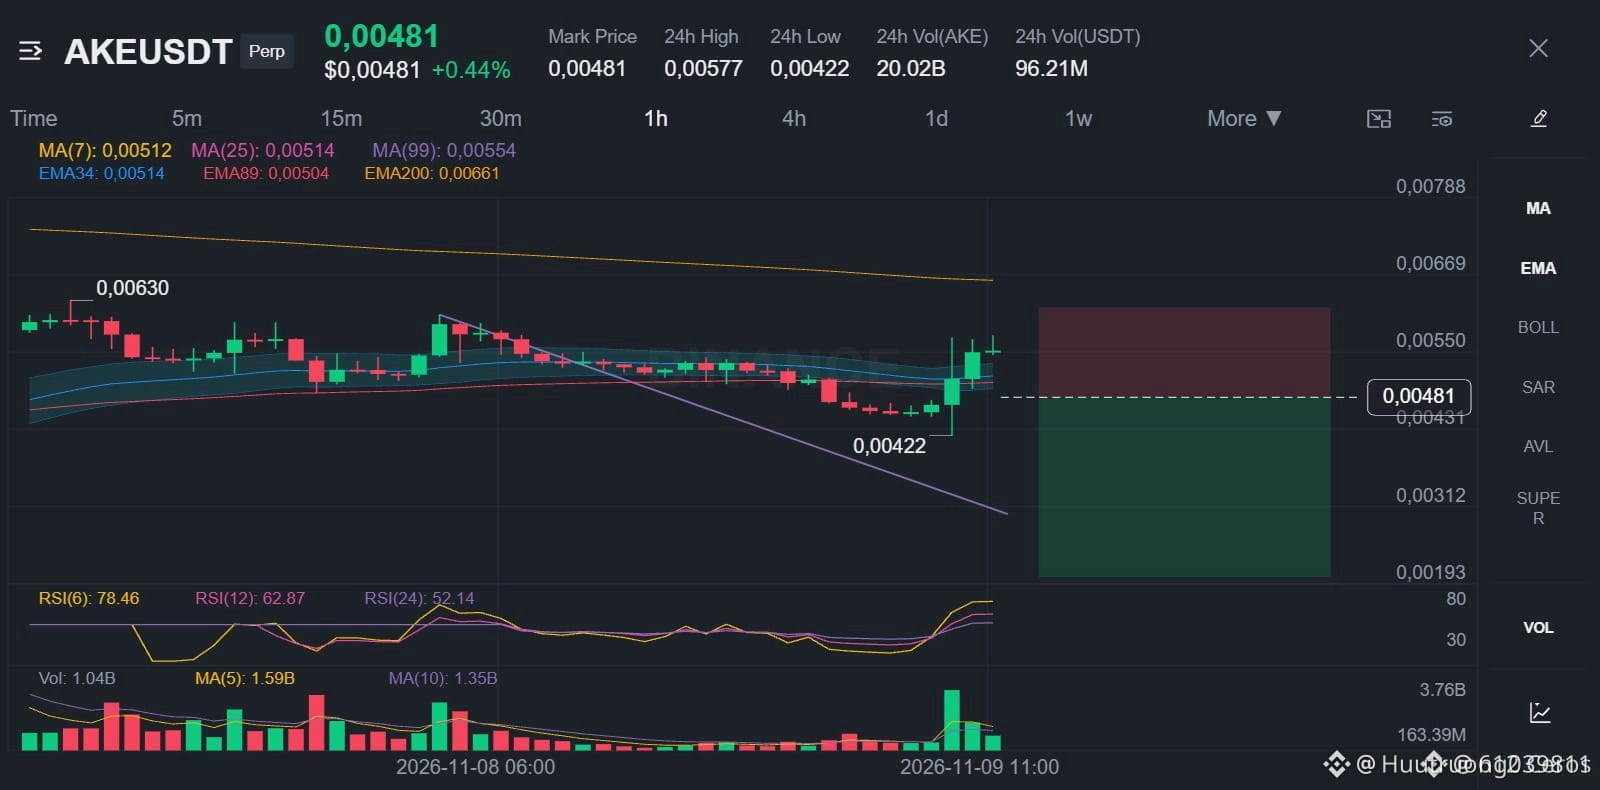
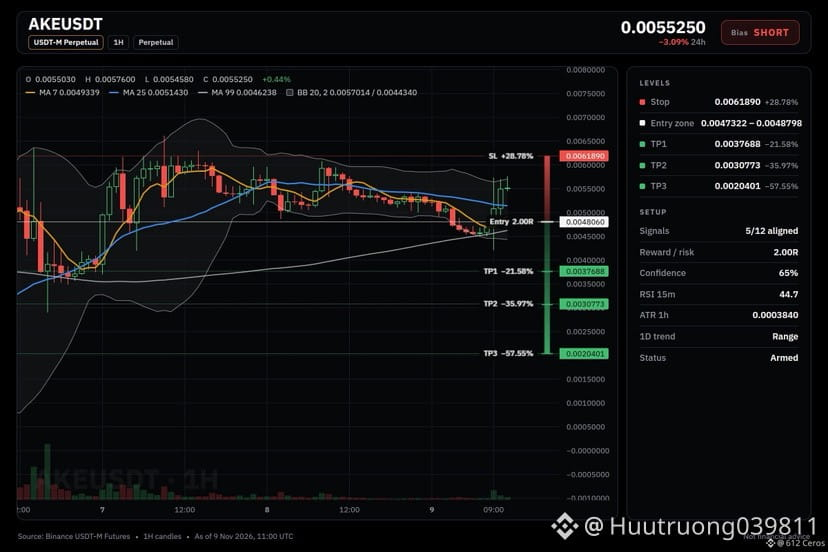
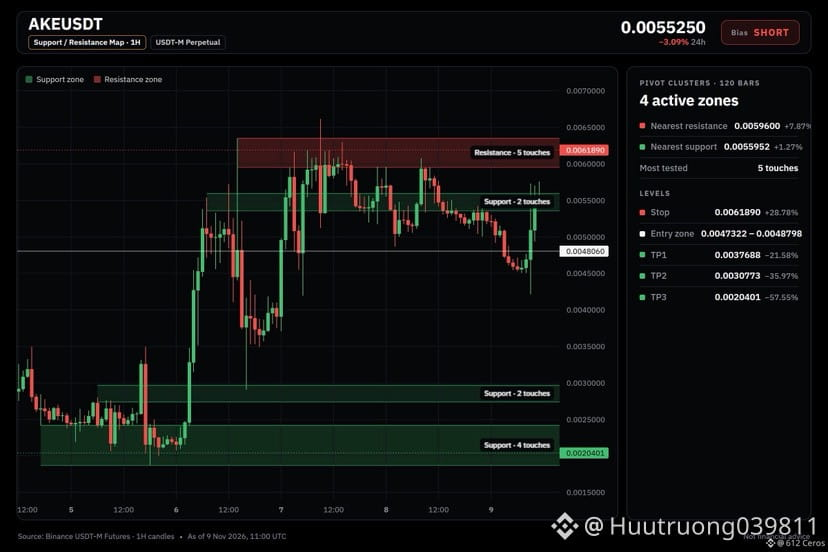
🔴 $AKE /USDT · Bias: SHORT
AKE price is below the 4h EMA50 and EMA200, so the swing trend is down.
Entry: 0.0047322 – 0.0048798
TP1: 0.0037688 (-21.6%)
TP2: 0.0030773 (-36.0%)
TP3: 0.0020401 (-57.6%)
SL: 0.0061890 (+28.8%)
Note: moderate conviction only, keep size light.
Why: The 4h trend shows price below EMA50 and EMA200, meaning the swing trend is bearish and sellers are in control.
Risk: Buyers have the momentum (1h RSI 60.8)
Plan: close 50% at TP1, 25% at TP2, 25% at TP3, and move the stop to entry after TP1.
Do you think this short has more upside or downside from here?
{future}(AKEUSDT)
🔴 $AKE /USDT · Bias: SHORT
AKE price is below the 4h EMA50 and EMA200, so the swing trend is down.
Entry: 0.0047322 – 0.0048798
TP1: 0.0037688 (-21.6%)
TP2: 0.0030773 (-36.0%)
TP3: 0.0020401 (-57.6%)
SL: 0.0061890 (+28.8%)
Note: moderate conviction only, keep size light.
Why: The 4h trend shows price below EMA50 and EMA200, meaning the swing trend is bearish and sellers are in control.
Risk: Buyers have the momentum (1h RSI 60.8)
Plan: close 50% at TP1, 25% at TP2, 25% at TP3, and move the stop to entry after TP1.
Do you think this short has more upside or downside from here?
AKE price is below the 4h EMA50 and EMA200, so the swing trend is down.
Entry: 0.0047322 – 0.0048798
TP1: 0.0037688 (-21.6%)
TP2: 0.0030773 (-36.0%)
TP3: 0.0020401 (-57.6%)
SL: 0.0061890 (+28.8%)
Note: moderate conviction only, keep size light.
Why: The 4h trend shows price below EMA50 and EMA200, meaning the swing trend is bearish and sellers are in control.
Risk: Buyers have the momentum (1h RSI 60.8)
Plan: close 50% at TP1, 25% at TP2, 25% at TP3, and move the stop to entry after TP1.
Do you think this short has more upside or downside from here?
9
·
--
Падение
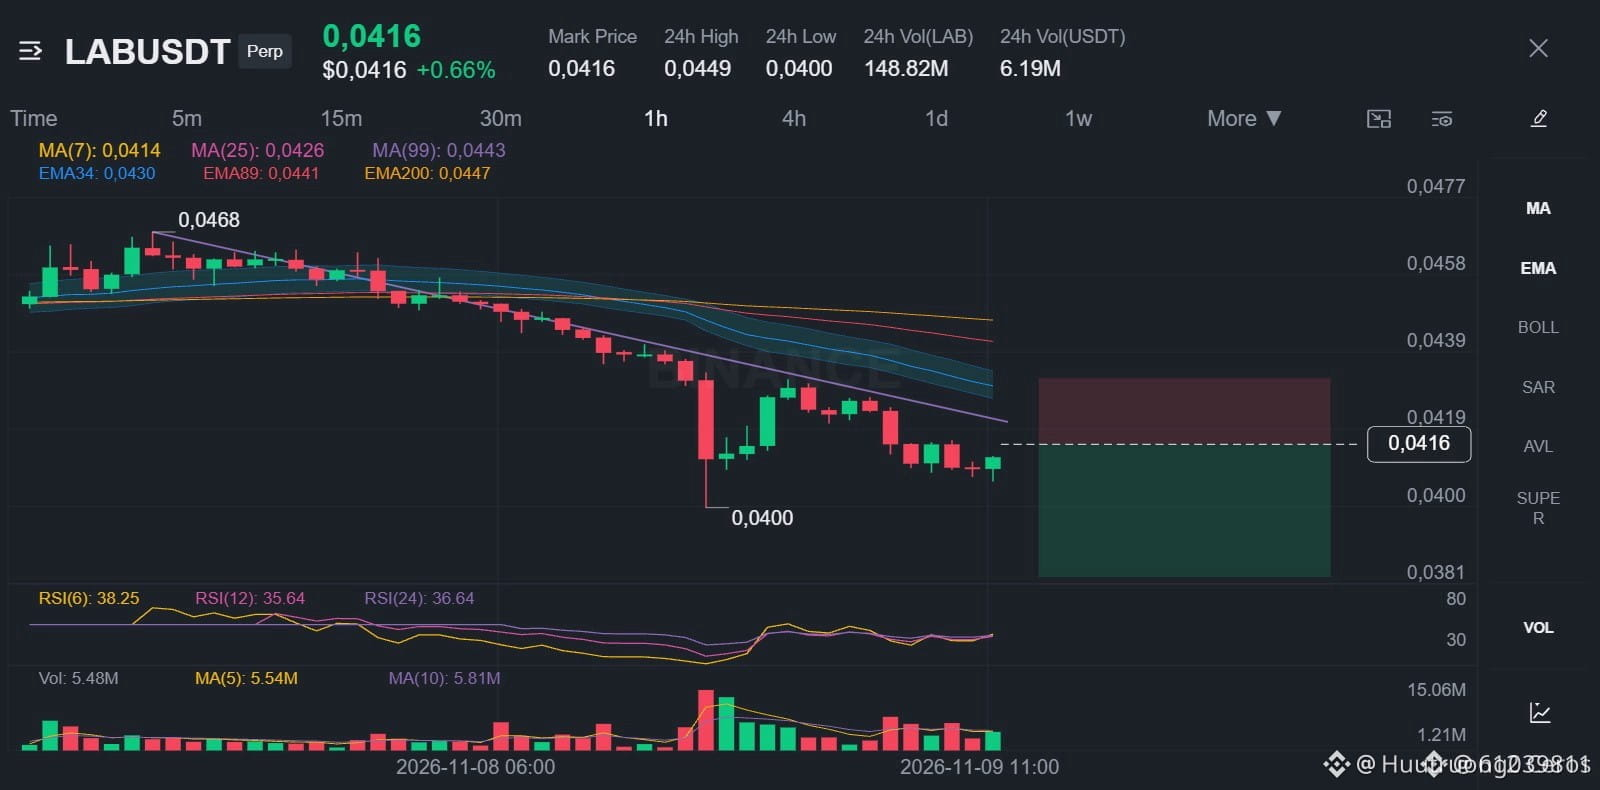
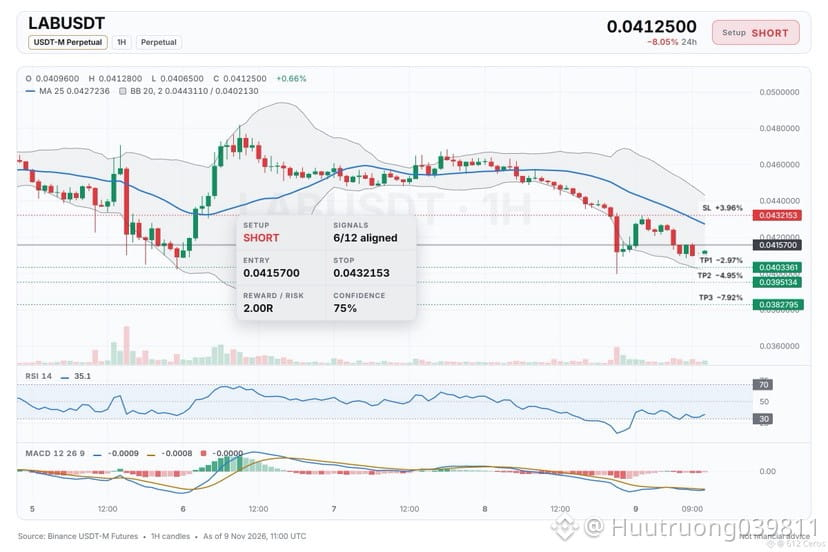
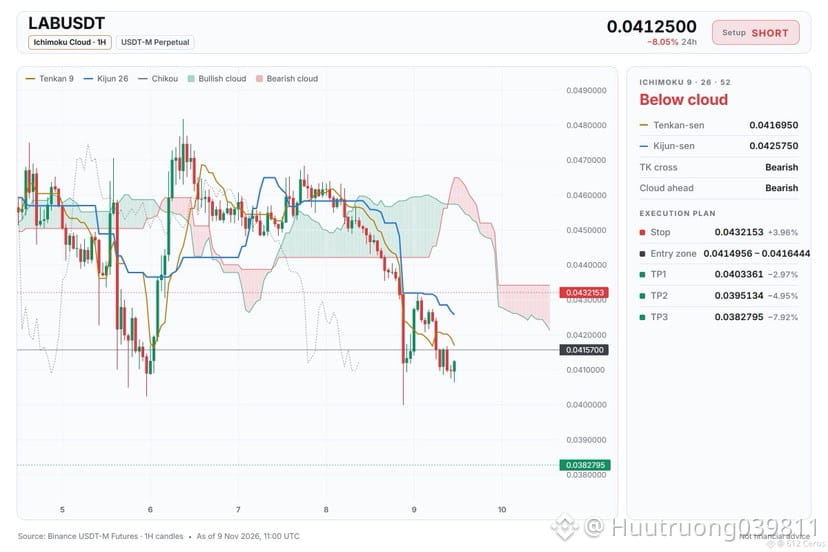
🔴 $LAB /USDT · Bias: SHORT
LAB price sits below all three EMAs, so the trend points down.
Entry: 0.0414956 – 0.0416444
TP1: 0.0403361 (-3.0%)
TP2: 0.0395134 (-4.9%)
TP3: 0.0382795 (-7.9%)
SL: 0.0432153 (+4.0%)
Why: The daily trend shows price below both the EMA50 and EMA200, meaning the big-picture trend is bearish.
Plan: close 50% at TP1, 25% at TP2, 25% at TP3, and move the stop to entry after TP1.
Where do you see LAB heading next?
{future}(LABUSDT)
🔴 $LAB /USDT · Bias: SHORT
LAB price sits below all three EMAs, so the trend points down.
Entry: 0.0414956 – 0.0416444
TP1: 0.0403361 (-3.0%)
TP2: 0.0395134 (-4.9%)
TP3: 0.0382795 (-7.9%)
SL: 0.0432153 (+4.0%)
Why: The daily trend shows price below both the EMA50 and EMA200, meaning the big-picture trend is bearish.
Plan: close 50% at TP1, 25% at TP2, 25% at TP3, and move the stop to entry after TP1.
Where do you see LAB heading next?
LAB price sits below all three EMAs, so the trend points down.
Entry: 0.0414956 – 0.0416444
TP1: 0.0403361 (-3.0%)
TP2: 0.0395134 (-4.9%)
TP3: 0.0382795 (-7.9%)
SL: 0.0432153 (+4.0%)
Why: The daily trend shows price below both the EMA50 and EMA200, meaning the big-picture trend is bearish.
Plan: close 50% at TP1, 25% at TP2, 25% at TP3, and move the stop to entry after TP1.
Where do you see LAB heading next?
7
·
--
Падение
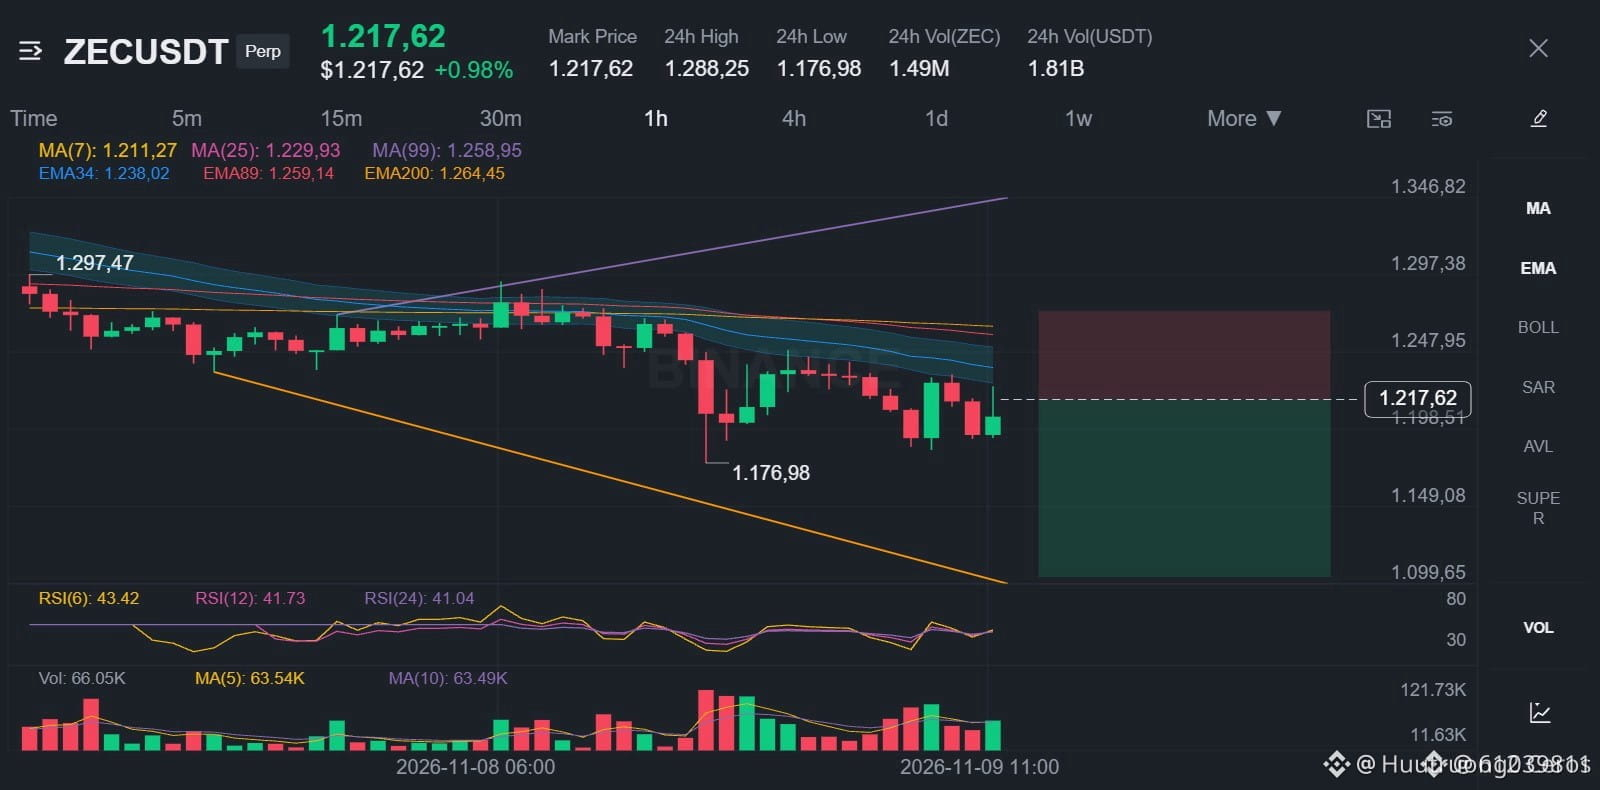
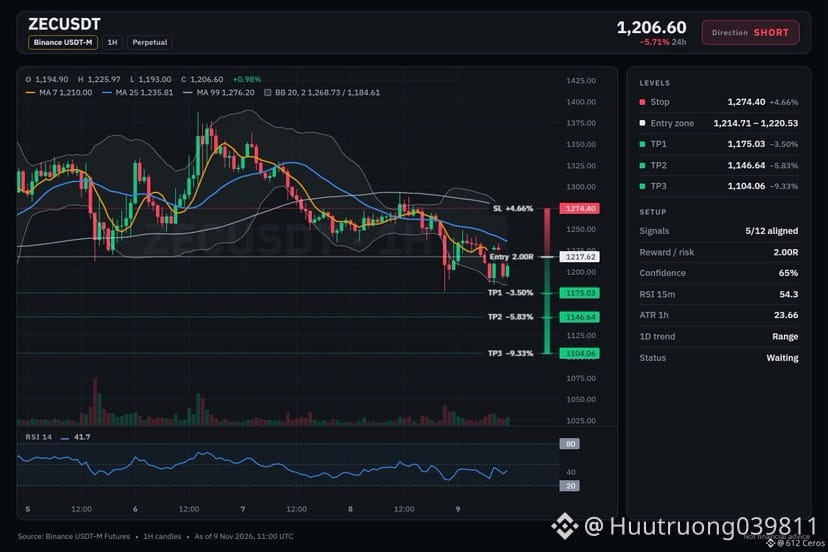
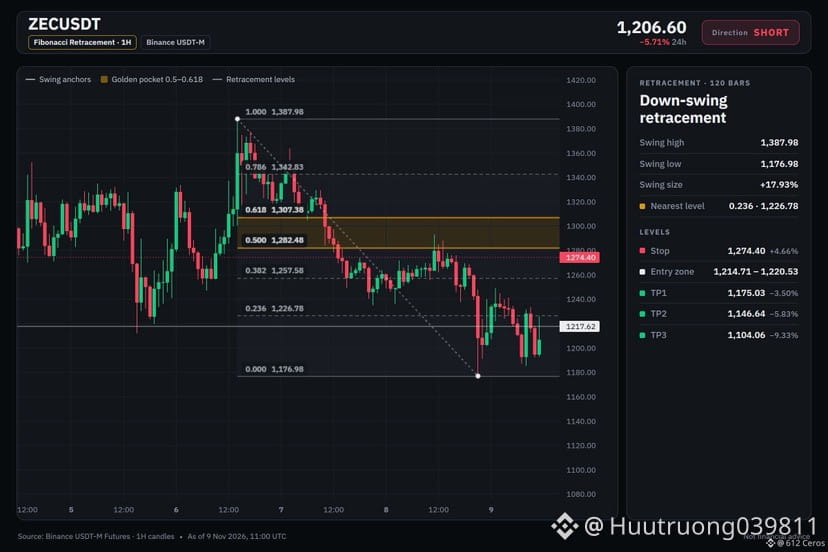
🔴 $ZEC /USDT · Bias: SHORT
ZEC price sits below both EMAs on the 4h, so the swing trend points down.
Entry: 1214.71 – 1220.53
TP1: 1175.03 (-3.5%)
TP2: 1146.64 (-5.8%)
TP3: 1104.06 (-9.3%)
SL: 1274.40 (+4.7%)
Note: moderate conviction only, keep size light.
Why: The 4h trend shows price below EMA50 and EMA200, a bearish stack meaning the short-term trend is down.
Risk: Buyers are pushing right now (+0.44% 15m candle)
Plan: close 50% at TP1, 25% at TP2, 25% at TP3, and move the stop to entry after TP1.
Do you think price continues lower from here?
{spot}(ZECUSDT)
🔴 $ZEC /USDT · Bias: SHORT
ZEC price sits below both EMAs on the 4h, so the swing trend points down.
Entry: 1214.71 – 1220.53
TP1: 1175.03 (-3.5%)
TP2: 1146.64 (-5.8%)
TP3: 1104.06 (-9.3%)
SL: 1274.40 (+4.7%)
Note: moderate conviction only, keep size light.
Why: The 4h trend shows price below EMA50 and EMA200, a bearish stack meaning the short-term trend is down.
Risk: Buyers are pushing right now (+0.44% 15m candle)
Plan: close 50% at TP1, 25% at TP2, 25% at TP3, and move the stop to entry after TP1.
Do you think price continues lower from here?
ZEC price sits below both EMAs on the 4h, so the swing trend points down.
Entry: 1214.71 – 1220.53
TP1: 1175.03 (-3.5%)
TP2: 1146.64 (-5.8%)
TP3: 1104.06 (-9.3%)
SL: 1274.40 (+4.7%)
Note: moderate conviction only, keep size light.
Why: The 4h trend shows price below EMA50 and EMA200, a bearish stack meaning the short-term trend is down.
Risk: Buyers are pushing right now (+0.44% 15m candle)
Plan: close 50% at TP1, 25% at TP2, 25% at TP3, and move the stop to entry after TP1.
Do you think price continues lower from here?
8
·
--
Рост
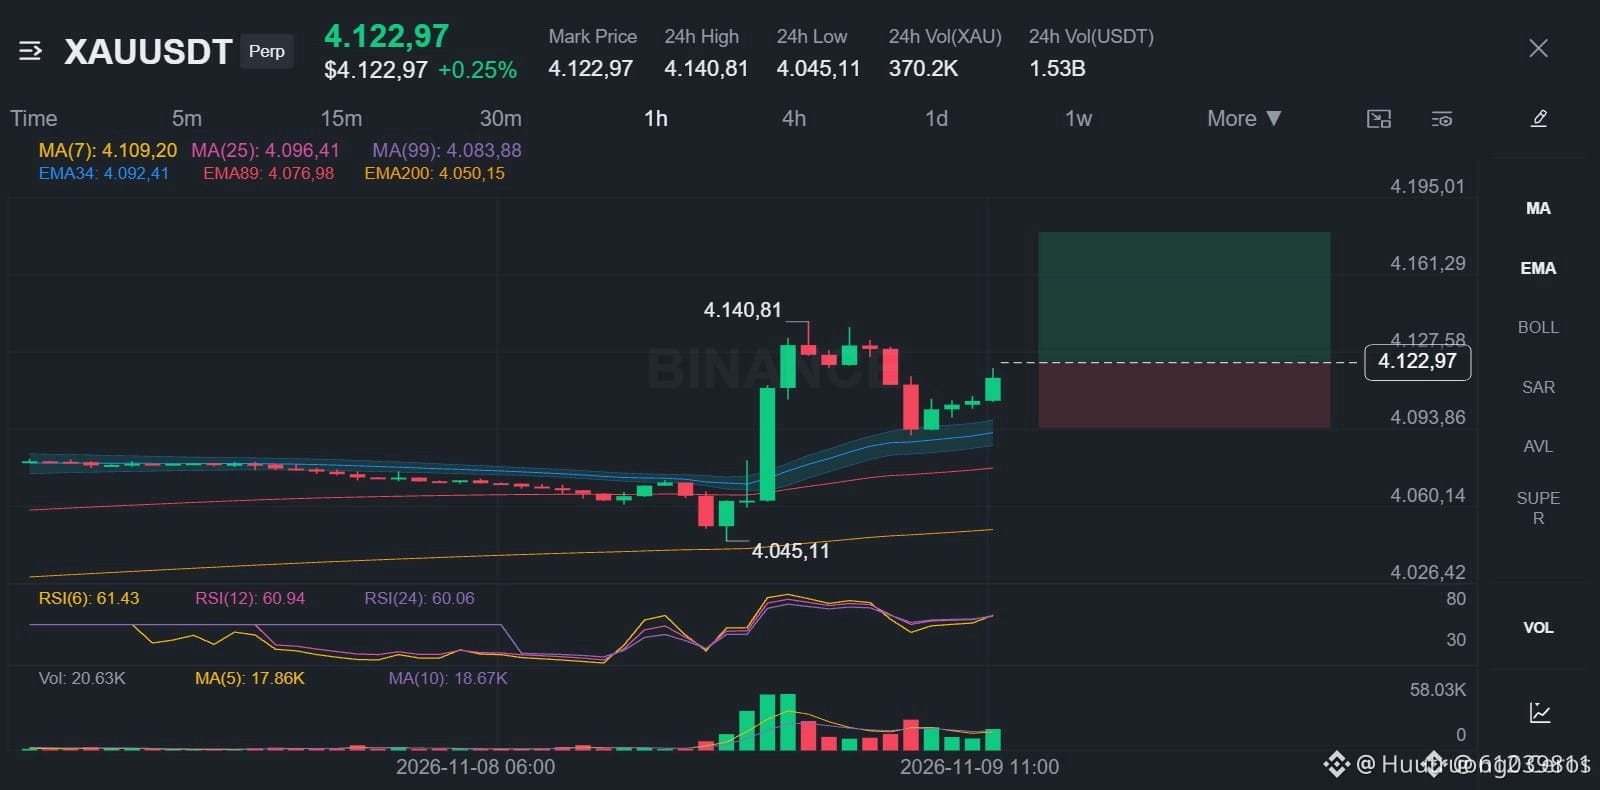
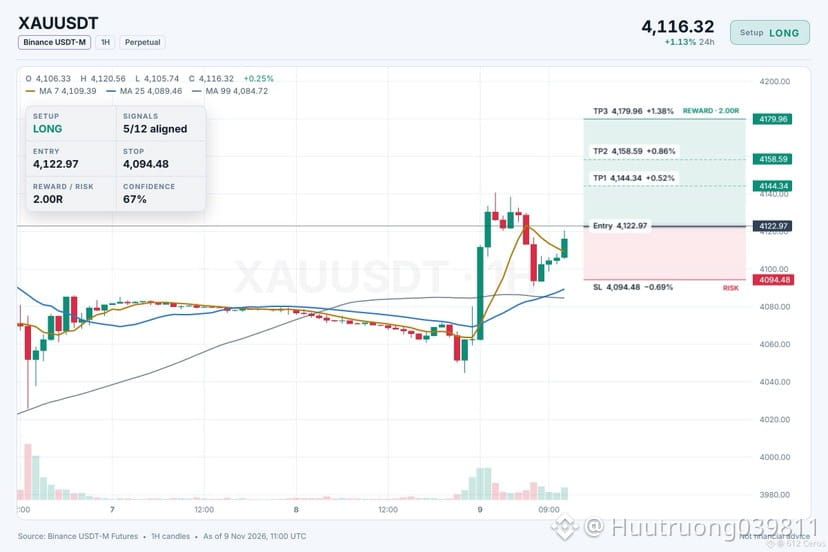
🟢 $XAU /USDT · Bias: LONG
Gold holds above its moving averages, so the short-term trend should push higher.
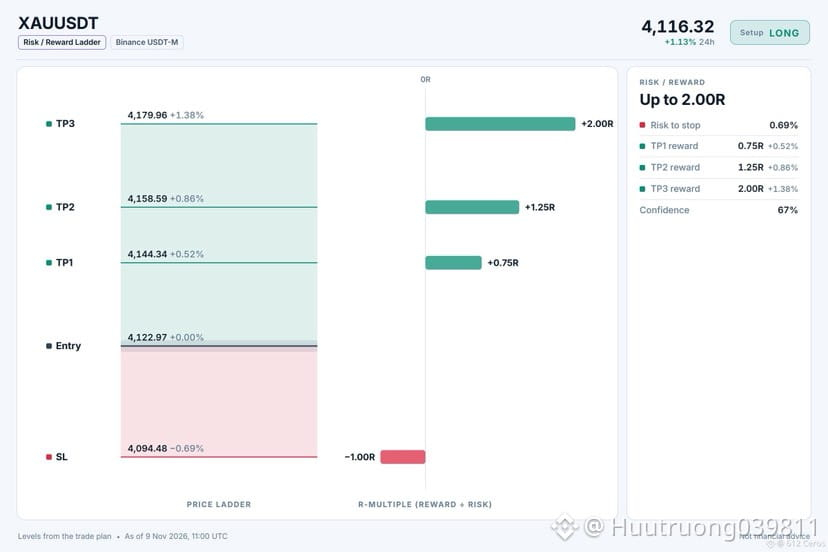
Entry: 4121.47 – 4124.47
TP1: 4144.34 (+0.5%)
TP2: 4158.59 (+0.9%)
TP3: 4179.96 (+1.4%)
SL: 4094.48 (-0.7%)
Note: moderate conviction only, keep size light.
Why: On the 1h chart, price sits above EMA50 and EMA200 in a bullish stack, meaning the short-term trend is up.
Plan: close 50% at TP1, 25% at TP2, 25% at TP3, and move the stop to entry after TP1.
Where do you take profit on this gold long?
{future}(XAUUSDT)
🟢 $XAU /USDT · Bias: LONG
Gold holds above its moving averages, so the short-term trend should push higher.
Entry: 4121.47 – 4124.47
TP1: 4144.34 (+0.5%)
TP2: 4158.59 (+0.9%)
TP3: 4179.96 (+1.4%)
SL: 4094.48 (-0.7%)
Note: moderate conviction only, keep size light.
Why: On the 1h chart, price sits above EMA50 and EMA200 in a bullish stack, meaning the short-term trend is up.
Plan: close 50% at TP1, 25% at TP2, 25% at TP3, and move the stop to entry after TP1.
Where do you take profit on this gold long?
Gold holds above its moving averages, so the short-term trend should push higher.
Entry: 4121.47 – 4124.47
TP1: 4144.34 (+0.5%)
TP2: 4158.59 (+0.9%)
TP3: 4179.96 (+1.4%)
SL: 4094.48 (-0.7%)
Note: moderate conviction only, keep size light.
Why: On the 1h chart, price sits above EMA50 and EMA200 in a bullish stack, meaning the short-term trend is up.
Plan: close 50% at TP1, 25% at TP2, 25% at TP3, and move the stop to entry after TP1.
Where do you take profit on this gold long?
7
·
--
Падение
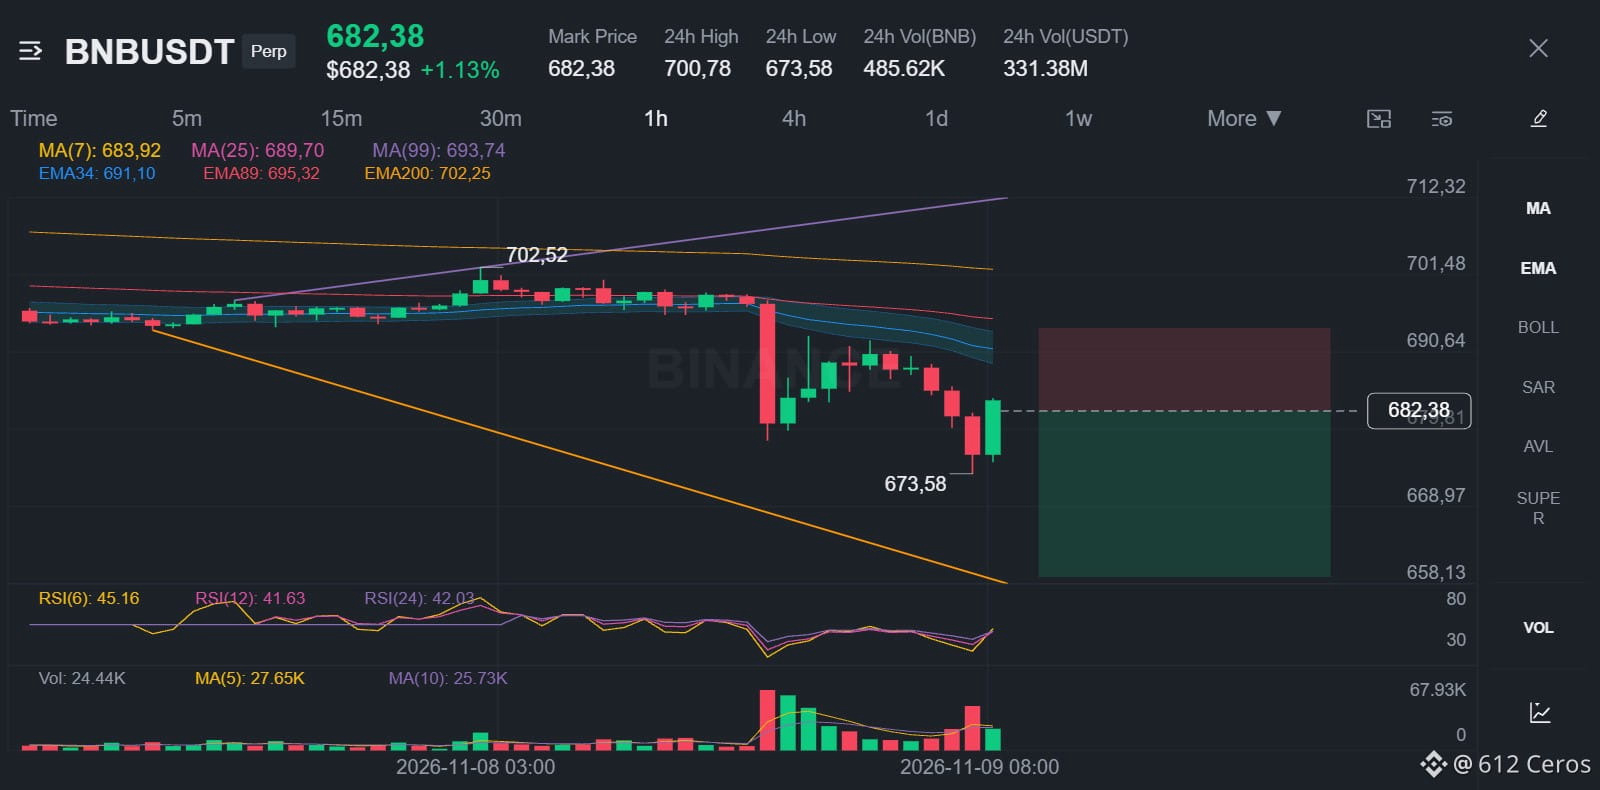
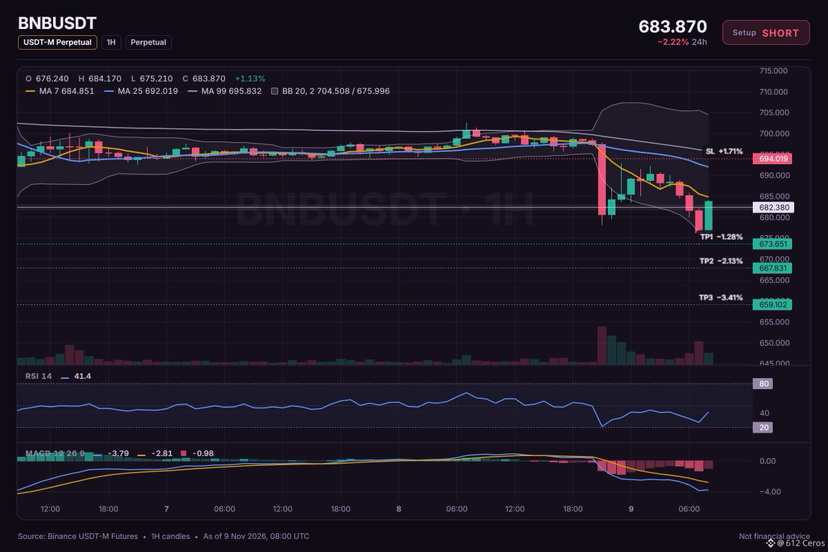
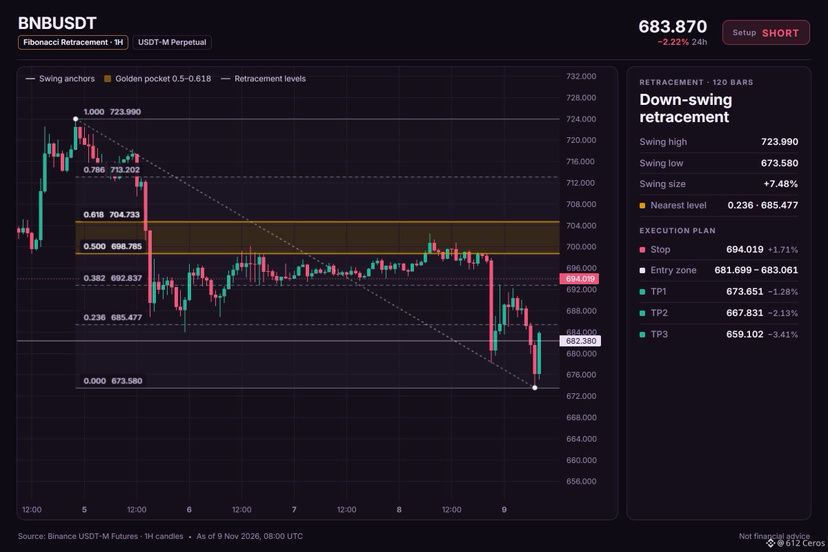
🔴 $BNB /USDT · Bias: SHORT
BNB is below both EMAs on the 4h, so the swing trend points down.
Entry: 681.699 – 683.061
TP1: 673.651 (-1.3%)
TP2: 667.831 (-2.1%)
TP3: 659.102 (-3.4%)
SL: 694.019 (+1.7%)
Why: The 4h trend shows price below EMA50 and EMA200 in a bearish stack, meaning the short-term trend is down.
Plan: close 50% at TP1, 25% at TP2, 25% at TP3, and move the stop to entry after TP1.
Would you enter this short trade at the current level?
{spot}(BNBUSDT)
🔴 $BNB /USDT · Bias: SHORT
BNB is below both EMAs on the 4h, so the swing trend points down.
Entry: 681.699 – 683.061
TP1: 673.651 (-1.3%)
TP2: 667.831 (-2.1%)
TP3: 659.102 (-3.4%)
SL: 694.019 (+1.7%)
Why: The 4h trend shows price below EMA50 and EMA200 in a bearish stack, meaning the short-term trend is down.
Plan: close 50% at TP1, 25% at TP2, 25% at TP3, and move the stop to entry after TP1.
Would you enter this short trade at the current level?
BNB is below both EMAs on the 4h, so the swing trend points down.
Entry: 681.699 – 683.061
TP1: 673.651 (-1.3%)
TP2: 667.831 (-2.1%)
TP3: 659.102 (-3.4%)
SL: 694.019 (+1.7%)
Why: The 4h trend shows price below EMA50 and EMA200 in a bearish stack, meaning the short-term trend is down.
Plan: close 50% at TP1, 25% at TP2, 25% at TP3, and move the stop to entry after TP1.
Would you enter this short trade at the current level?
5
·
--
Падение
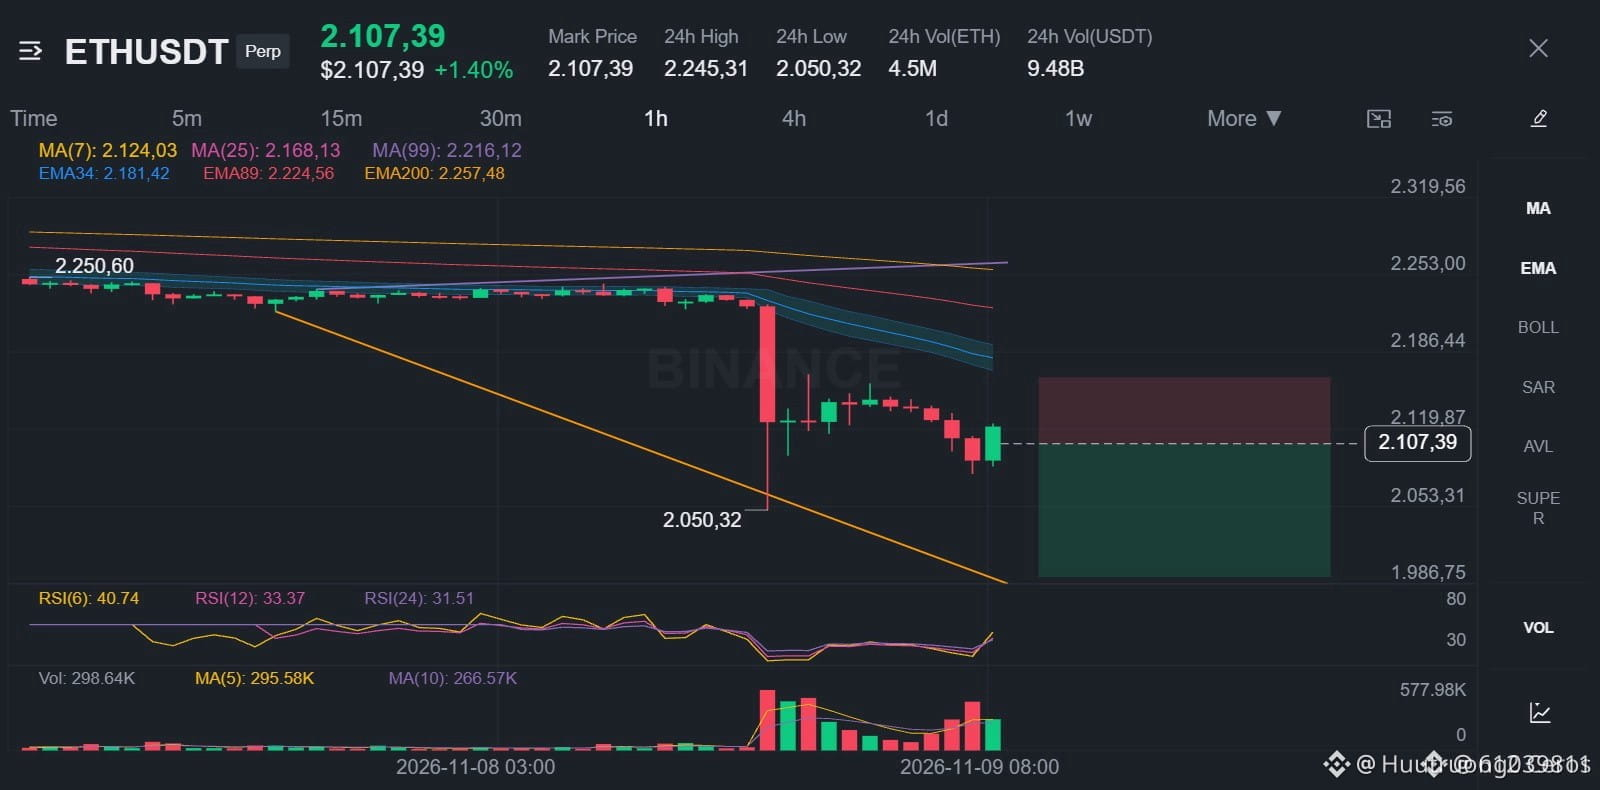
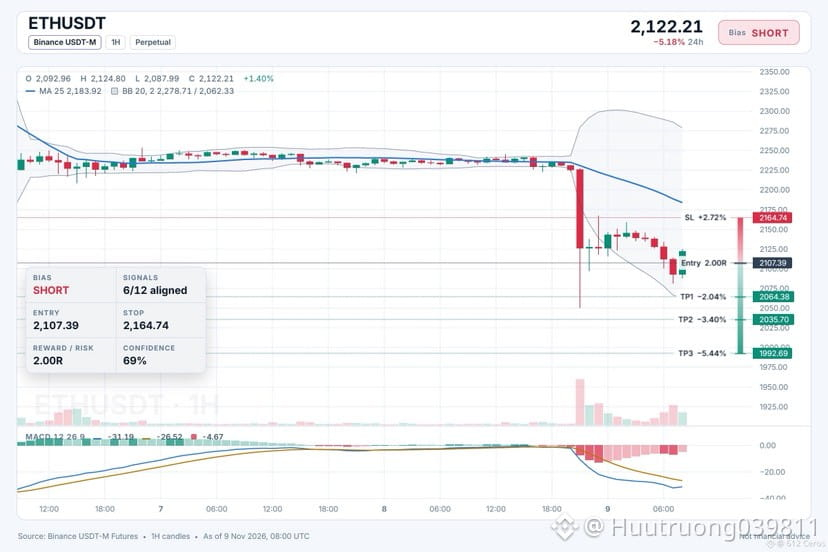
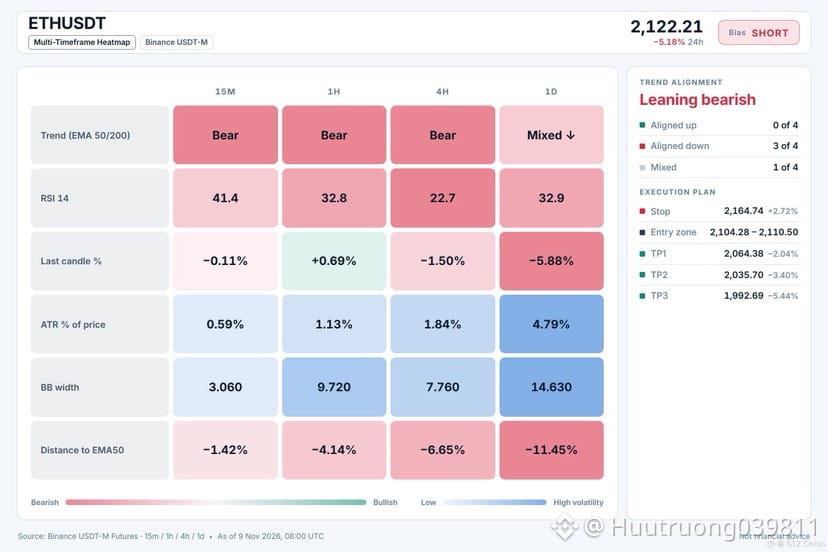
🔴 $ETH /USDT · Bias: SHORT
ETH price is below both EMAs on the 4h, so the swing trend points down.
Entry: 2104.28 – 2110.50
TP1: 2064.38 (-2.0%)
TP2: 2035.70 (-3.4%)
TP3: 1992.69 (-5.4%)
SL: 2164.74 (+2.7%)
Why: ADX 40.7 with sellers in control means the directional movement index shows strong selling pressure.
Risk: Price is washed out, bounces are common from here (4h RSI 22.7, oversold)
Plan: close 50% at TP1, 25% at TP2, 25% at TP3, and move the stop to entry after TP1.
Do you see room for more downside from here?
{spot}(ETHUSDT)
🔴 $ETH /USDT · Bias: SHORT
ETH price is below both EMAs on the 4h, so the swing trend points down.
Entry: 2104.28 – 2110.50
TP1: 2064.38 (-2.0%)
TP2: 2035.70 (-3.4%)
TP3: 1992.69 (-5.4%)
SL: 2164.74 (+2.7%)
Why: ADX 40.7 with sellers in control means the directional movement index shows strong selling pressure.
Risk: Price is washed out, bounces are common from here (4h RSI 22.7, oversold)
Plan: close 50% at TP1, 25% at TP2, 25% at TP3, and move the stop to entry after TP1.
Do you see room for more downside from here?
ETH price is below both EMAs on the 4h, so the swing trend points down.
Entry: 2104.28 – 2110.50
TP1: 2064.38 (-2.0%)
TP2: 2035.70 (-3.4%)
TP3: 1992.69 (-5.4%)
SL: 2164.74 (+2.7%)
Why: ADX 40.7 with sellers in control means the directional movement index shows strong selling pressure.
Risk: Price is washed out, bounces are common from here (4h RSI 22.7, oversold)
Plan: close 50% at TP1, 25% at TP2, 25% at TP3, and move the stop to entry after TP1.
Do you see room for more downside from here?
9
·
--
Падение
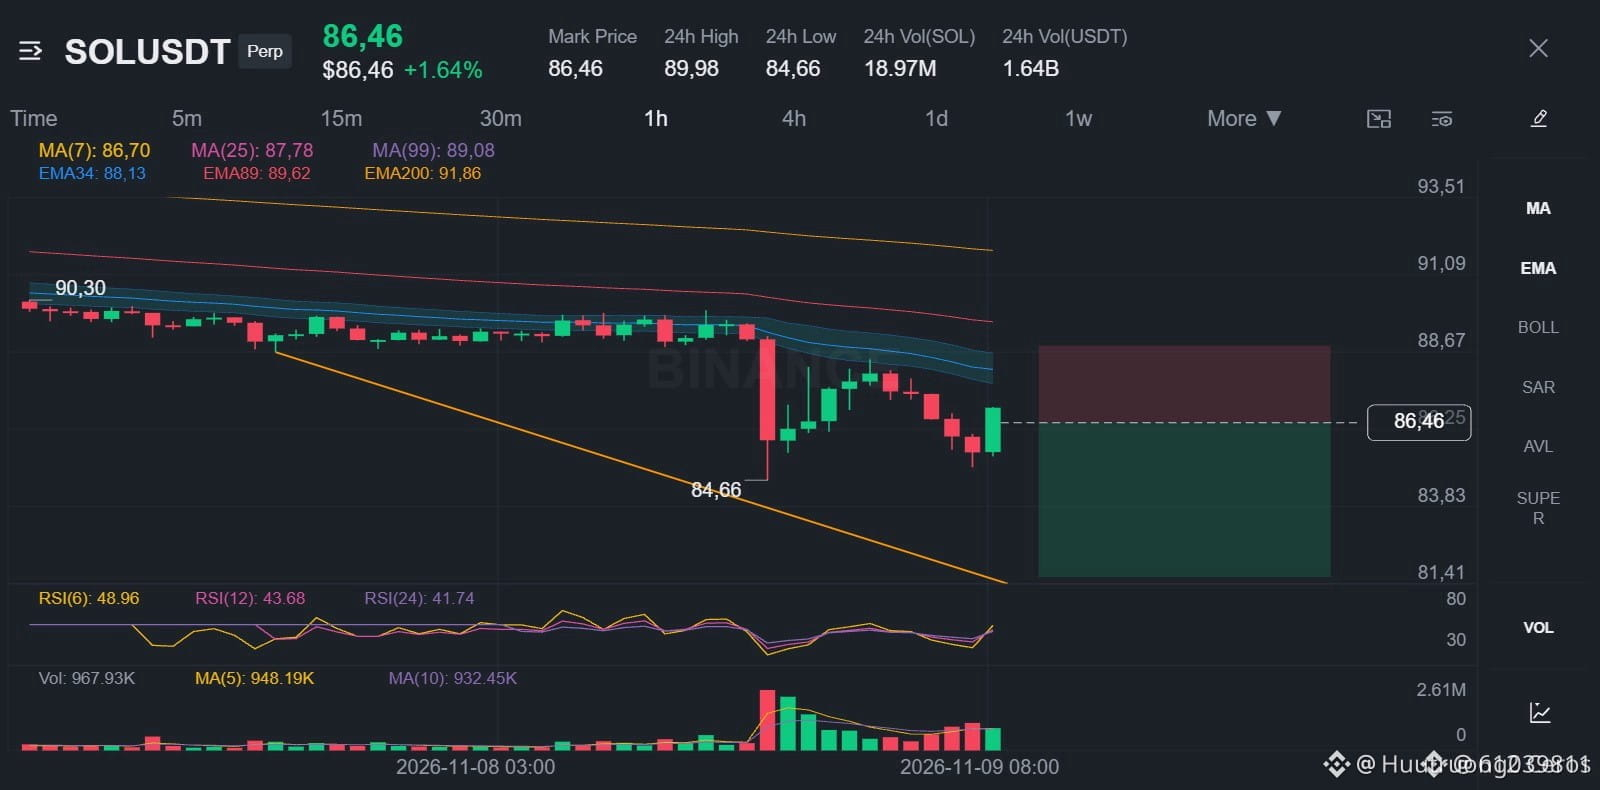
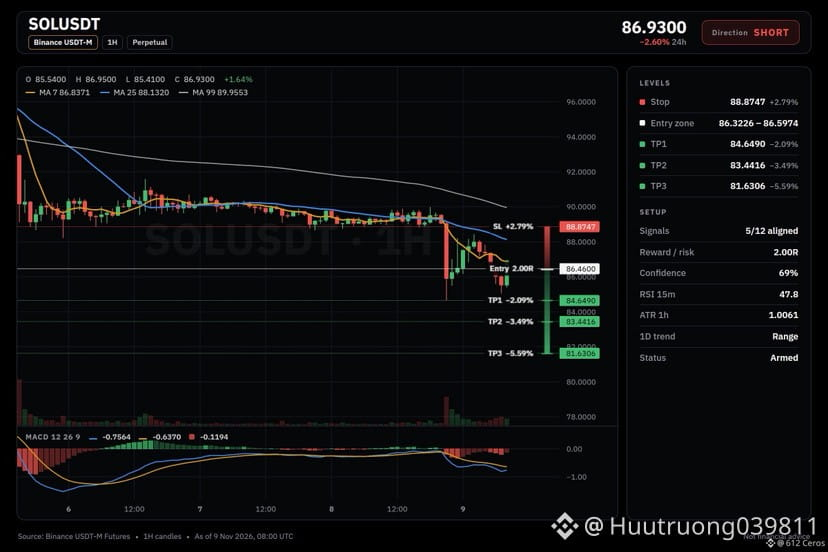
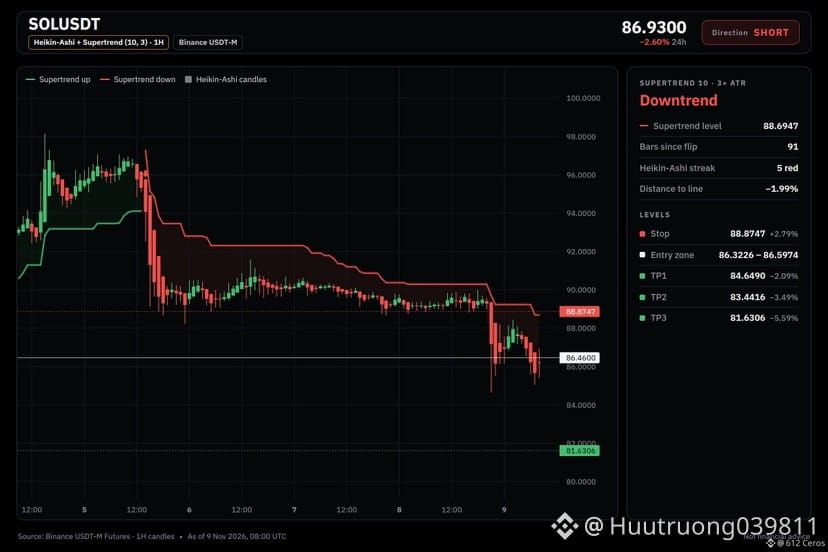
🔴 $SOL /USDT · Bias: SHORT
SOL price sits below EMA50 and EMA200 on the 4h, so the swing trend points down.
Entry: 86.3226 – 86.5974
TP1: 84.6490 (-2.1%)
TP2: 83.4416 (-3.5%)
TP3: 81.6306 (-5.6%)
SL: 88.8747 (+2.8%)
Note: moderate conviction only, keep size light.
Why: The 4h trend shows price below EMA50 and EMA200, which means the swing trend is bearish.
Plan: close 50% at TP1, 25% at TP2, 25% at TP3, and move the stop to entry after TP1.
Do you see a clean short on SOL?
{spot}(SOLUSDT)
🔴 $SOL /USDT · Bias: SHORT
SOL price sits below EMA50 and EMA200 on the 4h, so the swing trend points down.
Entry: 86.3226 – 86.5974
TP1: 84.6490 (-2.1%)
TP2: 83.4416 (-3.5%)
TP3: 81.6306 (-5.6%)
SL: 88.8747 (+2.8%)
Note: moderate conviction only, keep size light.
Why: The 4h trend shows price below EMA50 and EMA200, which means the swing trend is bearish.
Plan: close 50% at TP1, 25% at TP2, 25% at TP3, and move the stop to entry after TP1.
Do you see a clean short on SOL?
SOL price sits below EMA50 and EMA200 on the 4h, so the swing trend points down.
Entry: 86.3226 – 86.5974
TP1: 84.6490 (-2.1%)
TP2: 83.4416 (-3.5%)
TP3: 81.6306 (-5.6%)
SL: 88.8747 (+2.8%)
Note: moderate conviction only, keep size light.
Why: The 4h trend shows price below EMA50 and EMA200, which means the swing trend is bearish.
Plan: close 50% at TP1, 25% at TP2, 25% at TP3, and move the stop to entry after TP1.
Do you see a clean short on SOL?
9
·
--
Падение
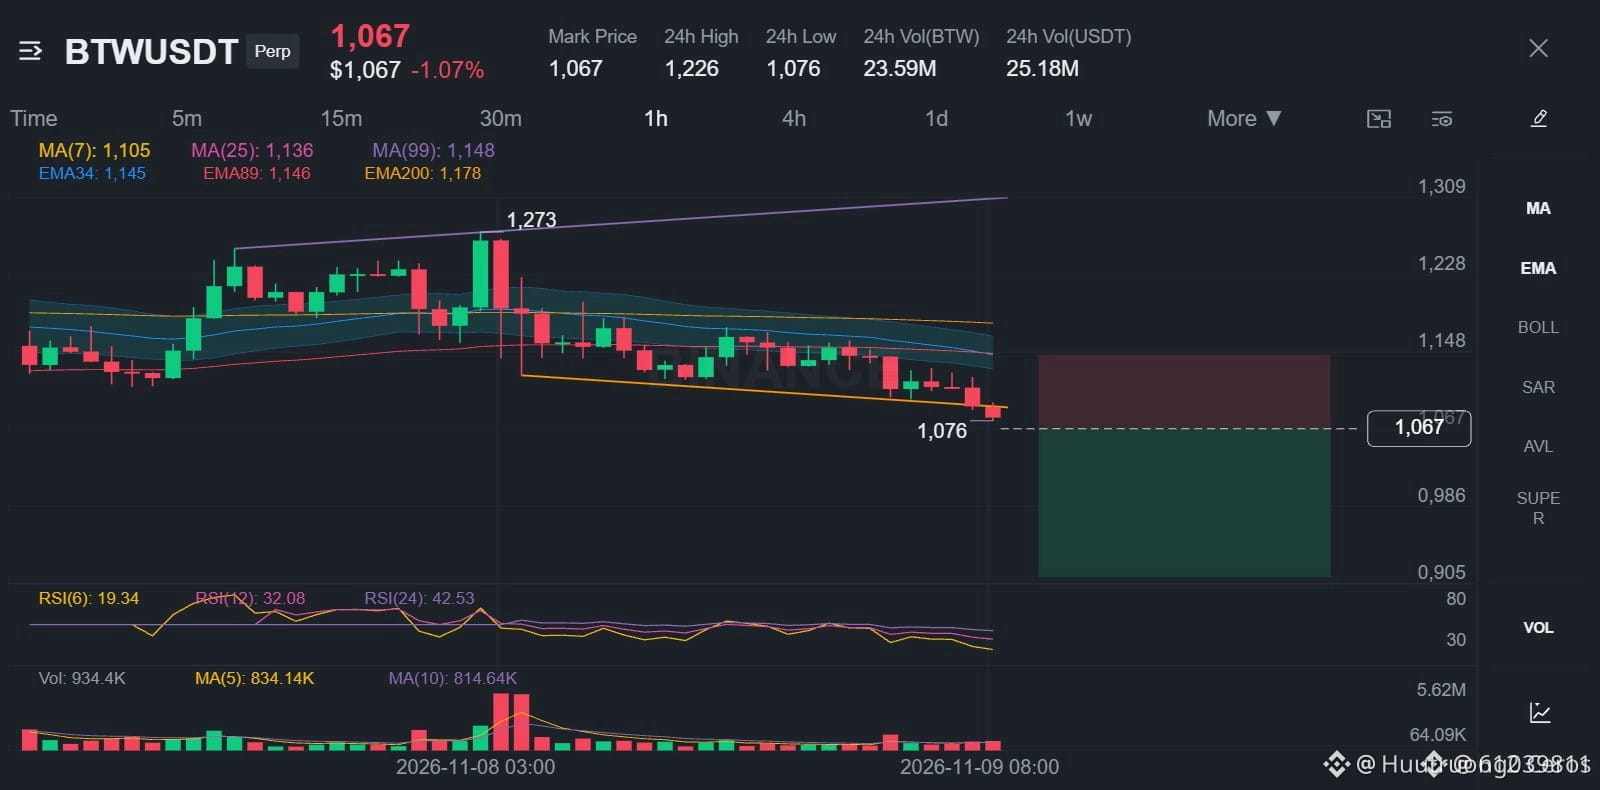
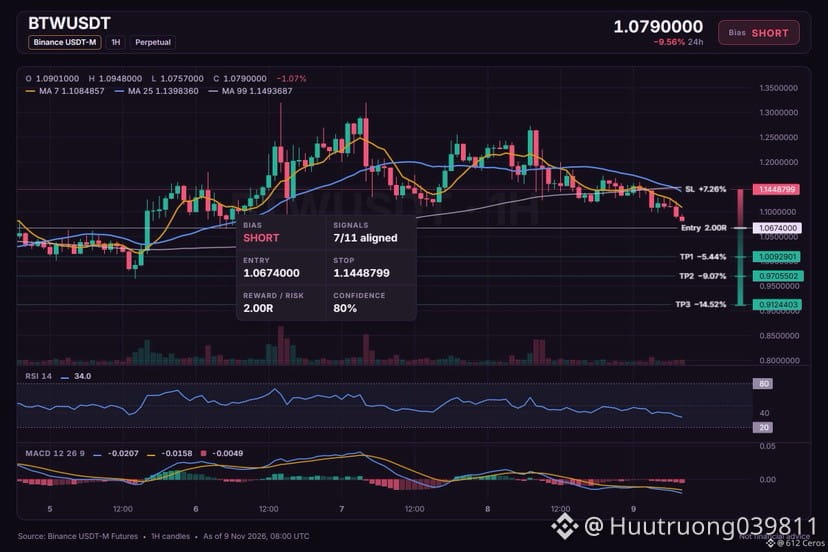
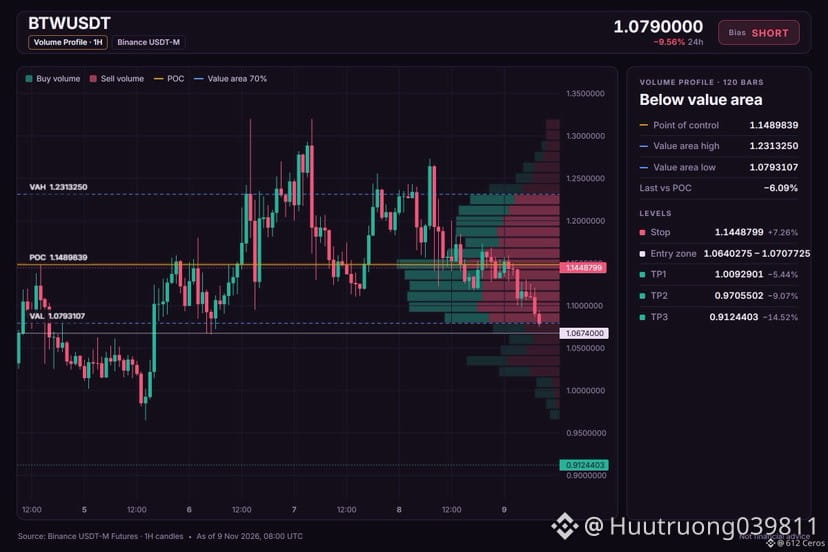
🔴 $BTW /USDT · Bias: SHORT
BTW price sits below EMA50 and EMA200 on the 4h, so the swing trend points down.
Entry: 1.0640275 – 1.0707725
TP1: 1.0092901 (-5.4%)
TP2: 0.9705502 (-9.1%)
TP3: 0.9124403 (-14.5%)
SL: 1.1448799 (+7.3%)
Why: 4h trend: price below EMA50 and EMA200 in a bearish stack, meaning the swing trend is down and sellers are driving the move.
Plan: close 50% at TP1, 25% at TP2, 25% at TP3, and move the stop to entry after TP1.
Would you take this short setup at the entry zone?
{future}(BTWUSDT)
🔴 $BTW /USDT · Bias: SHORT
BTW price sits below EMA50 and EMA200 on the 4h, so the swing trend points down.
Entry: 1.0640275 – 1.0707725
TP1: 1.0092901 (-5.4%)
TP2: 0.9705502 (-9.1%)
TP3: 0.9124403 (-14.5%)
SL: 1.1448799 (+7.3%)
Why: 4h trend: price below EMA50 and EMA200 in a bearish stack, meaning the swing trend is down and sellers are driving the move.
Plan: close 50% at TP1, 25% at TP2, 25% at TP3, and move the stop to entry after TP1.
Would you take this short setup at the entry zone?
BTW price sits below EMA50 and EMA200 on the 4h, so the swing trend points down.
Entry: 1.0640275 – 1.0707725
TP1: 1.0092901 (-5.4%)
TP2: 0.9705502 (-9.1%)
TP3: 0.9124403 (-14.5%)
SL: 1.1448799 (+7.3%)
Why: 4h trend: price below EMA50 and EMA200 in a bearish stack, meaning the swing trend is down and sellers are driving the move.
Plan: close 50% at TP1, 25% at TP2, 25% at TP3, and move the stop to entry after TP1.
Would you take this short setup at the entry zone?
7
·
--
Падение
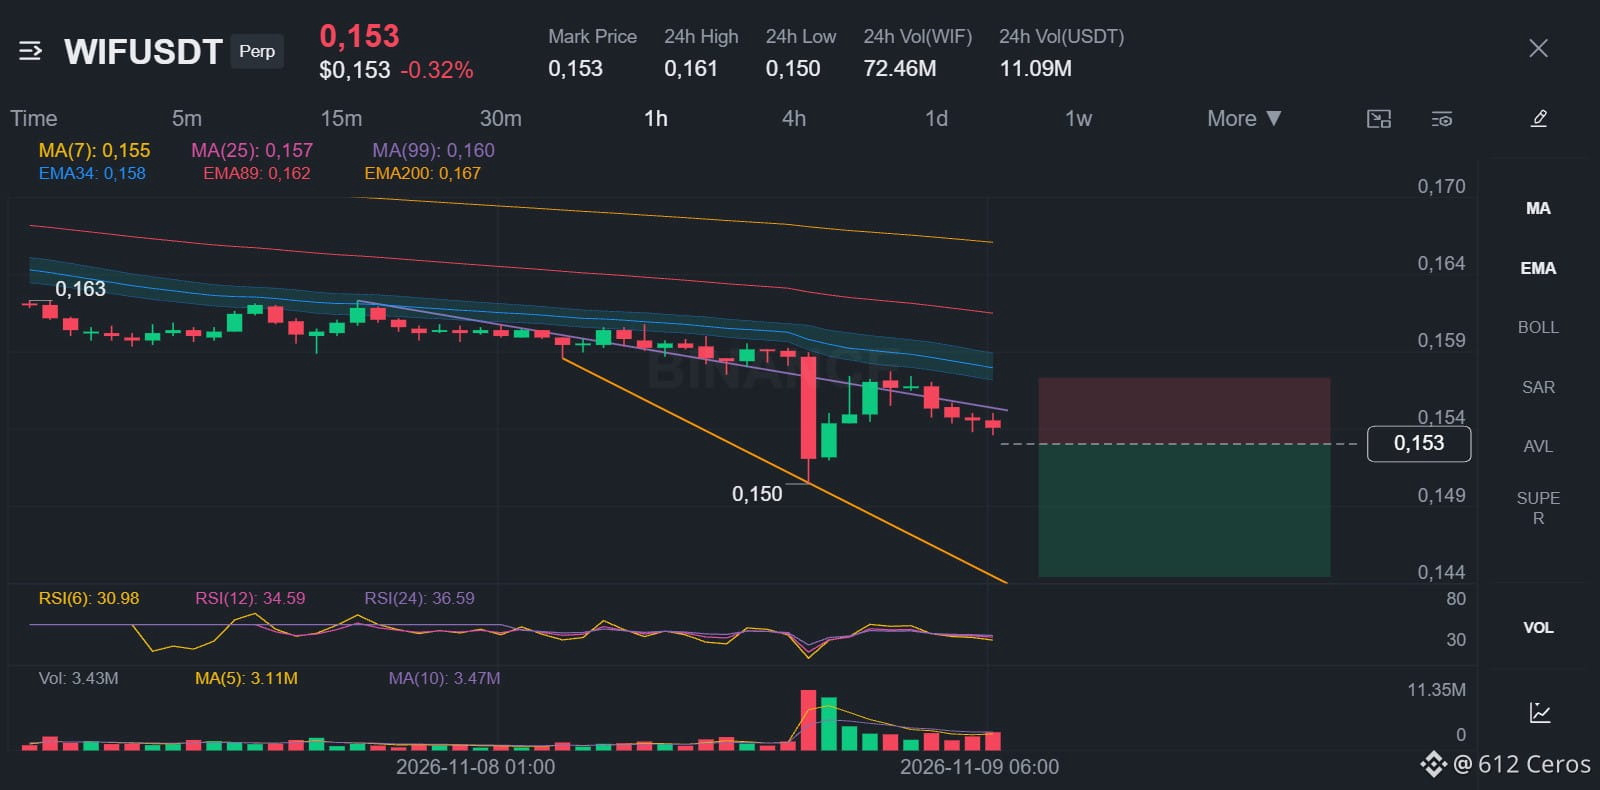
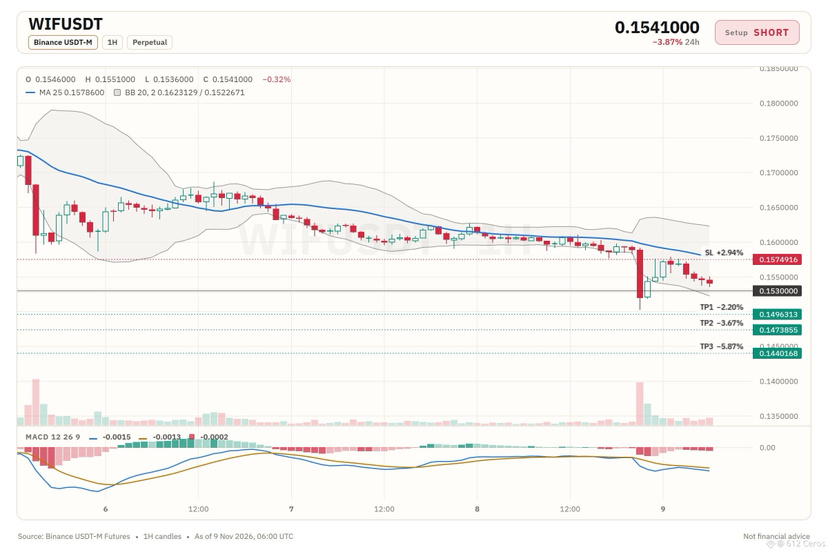
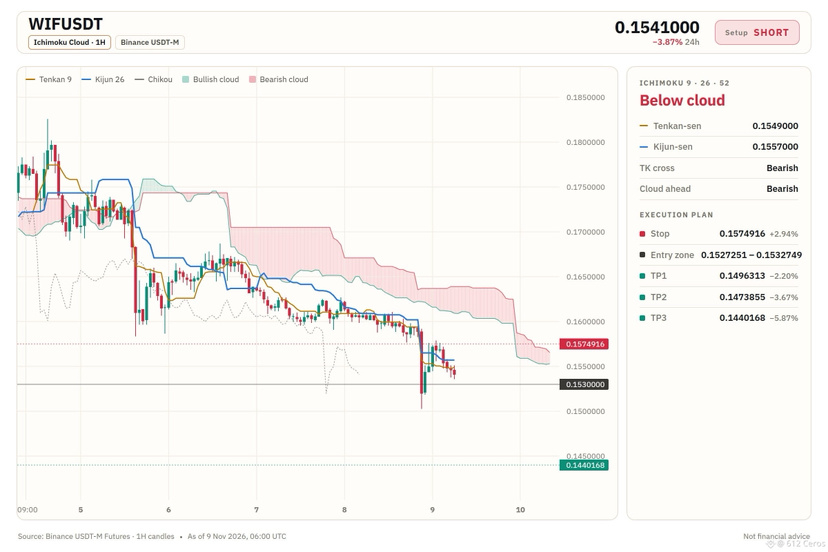
🔴 $WIF /USDT · Bias: SHORT
WIF price sits below EMA50 and EMA200 on the daily, 4h and 1h, so all trends point down.
Entry: 0.1527251 – 0.1532749
TP1: 0.1496313 (-2.2%)
TP2: 0.1473855 (-3.7%)
TP3: 0.1440168 (-5.9%)
SL: 0.1574916 (+2.9%)
Why: The daily trend shows price below EMA50 and EMA200, which means the big-picture trend is bearish.
Risk: Far below its average, bounce likely (−3.4 ATR from 1h EMA50)
Plan: close 50% at TP1, 25% at TP2, 25% at TP3, and move the stop to entry after TP1.
Where do you see WIF finding its next bounce?
{spot}(WIFUSDT)
🔴 $WIF /USDT · Bias: SHORT
WIF price sits below EMA50 and EMA200 on the daily, 4h and 1h, so all trends point down.
Entry: 0.1527251 – 0.1532749
TP1: 0.1496313 (-2.2%)
TP2: 0.1473855 (-3.7%)
TP3: 0.1440168 (-5.9%)
SL: 0.1574916 (+2.9%)
Why: The daily trend shows price below EMA50 and EMA200, which means the big-picture trend is bearish.
Risk: Far below its average, bounce likely (−3.4 ATR from 1h EMA50)
Plan: close 50% at TP1, 25% at TP2, 25% at TP3, and move the stop to entry after TP1.
Where do you see WIF finding its next bounce?
WIF price sits below EMA50 and EMA200 on the daily, 4h and 1h, so all trends point down.
Entry: 0.1527251 – 0.1532749
TP1: 0.1496313 (-2.2%)
TP2: 0.1473855 (-3.7%)
TP3: 0.1440168 (-5.9%)
SL: 0.1574916 (+2.9%)
Why: The daily trend shows price below EMA50 and EMA200, which means the big-picture trend is bearish.
Risk: Far below its average, bounce likely (−3.4 ATR from 1h EMA50)
Plan: close 50% at TP1, 25% at TP2, 25% at TP3, and move the stop to entry after TP1.
Where do you see WIF finding its next bounce?
10
·
--
Падение
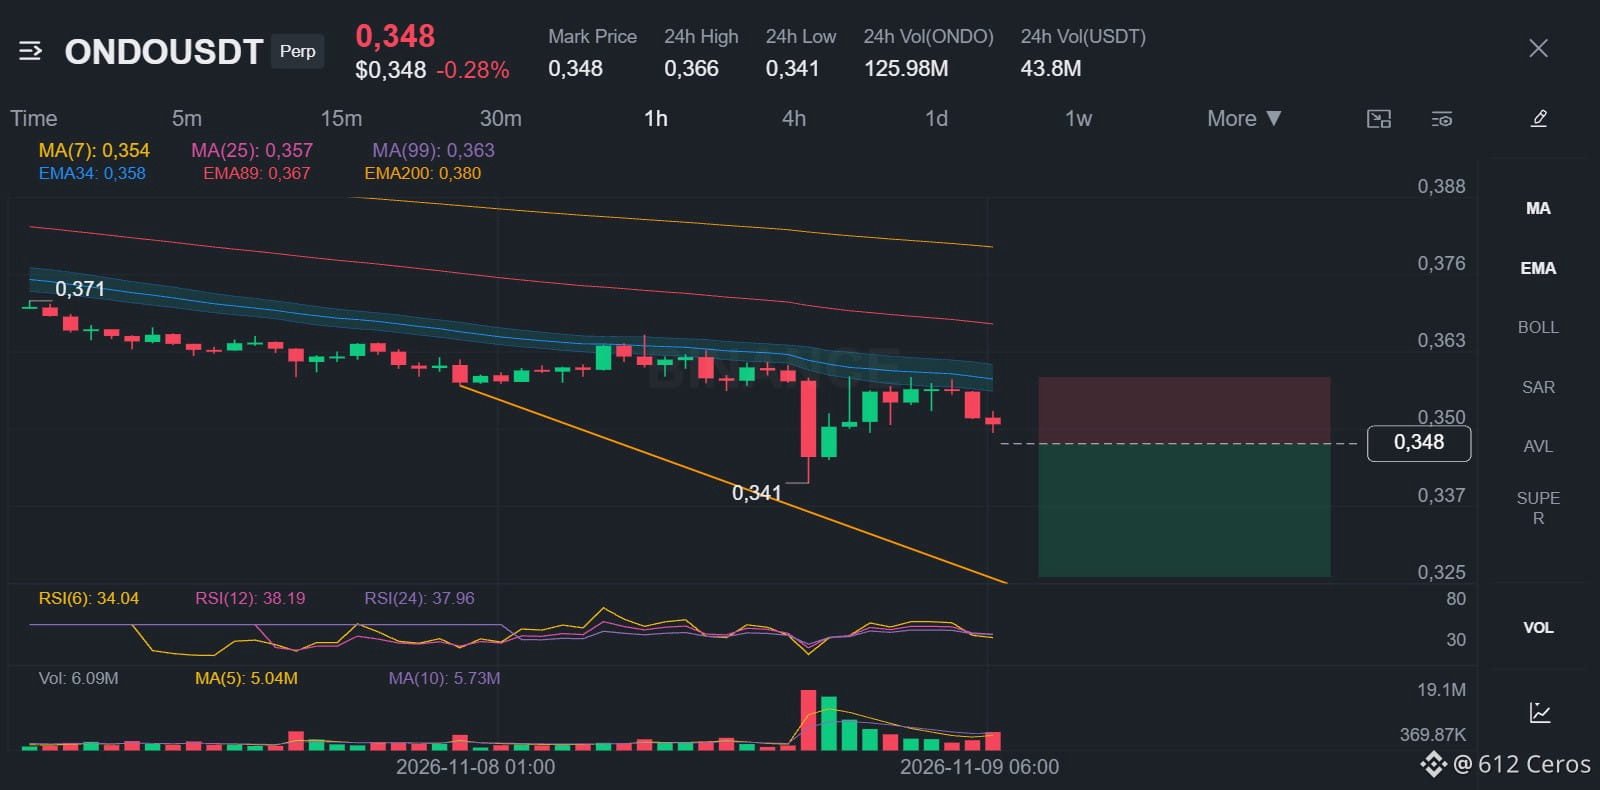
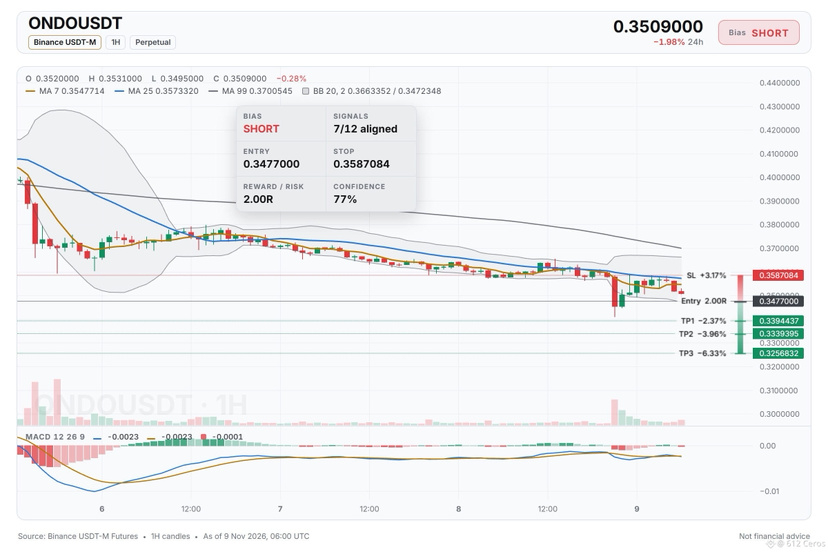
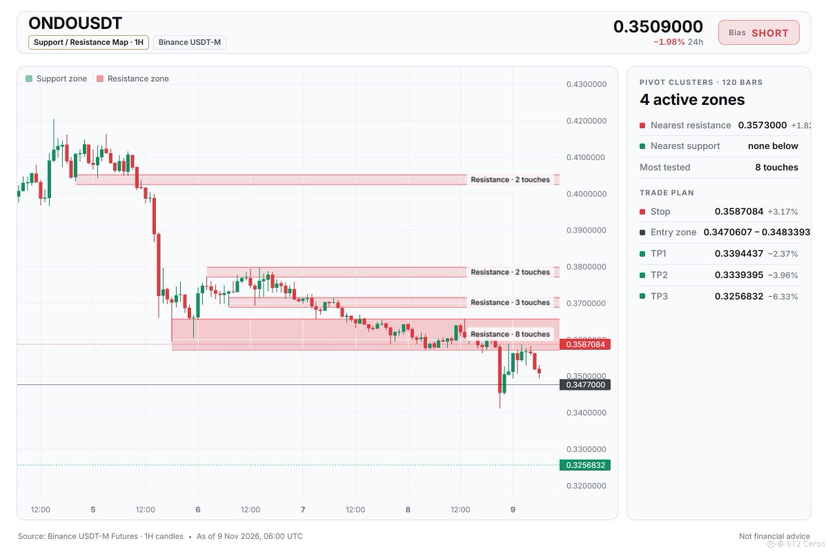
🔴 $ONDO /USDT · Bias: SHORT
ONDO price sits below both EMAs on the 4h, so the swing trend points down.
Entry: 0.3470607 – 0.3483393
TP1: 0.3394437 (-2.4%)
TP2: 0.3339395 (-4.0%)
TP3: 0.3256832 (-6.3%)
SL: 0.3587084 (+3.2%)
Why: The 4h trend shows price below EMA50 and EMA200 in a bearish stack, meaning the swing trend is down and sellers are in control.
Plan: close 50% at TP1, 25% at TP2, 25% at TP3, and move the stop to entry after TP1.
Where do you see ONDO heading from here?
{spot}(ONDOUSDT)
🔴 $ONDO /USDT · Bias: SHORT
ONDO price sits below both EMAs on the 4h, so the swing trend points down.
Entry: 0.3470607 – 0.3483393
TP1: 0.3394437 (-2.4%)
TP2: 0.3339395 (-4.0%)
TP3: 0.3256832 (-6.3%)
SL: 0.3587084 (+3.2%)
Why: The 4h trend shows price below EMA50 and EMA200 in a bearish stack, meaning the swing trend is down and sellers are in control.
Plan: close 50% at TP1, 25% at TP2, 25% at TP3, and move the stop to entry after TP1.
Where do you see ONDO heading from here?
ONDO price sits below both EMAs on the 4h, so the swing trend points down.
Entry: 0.3470607 – 0.3483393
TP1: 0.3394437 (-2.4%)
TP2: 0.3339395 (-4.0%)
TP3: 0.3256832 (-6.3%)
SL: 0.3587084 (+3.2%)
Why: The 4h trend shows price below EMA50 and EMA200 in a bearish stack, meaning the swing trend is down and sellers are in control.
Plan: close 50% at TP1, 25% at TP2, 25% at TP3, and move the stop to entry after TP1.
Where do you see ONDO heading from here?
13
·
--
Падение
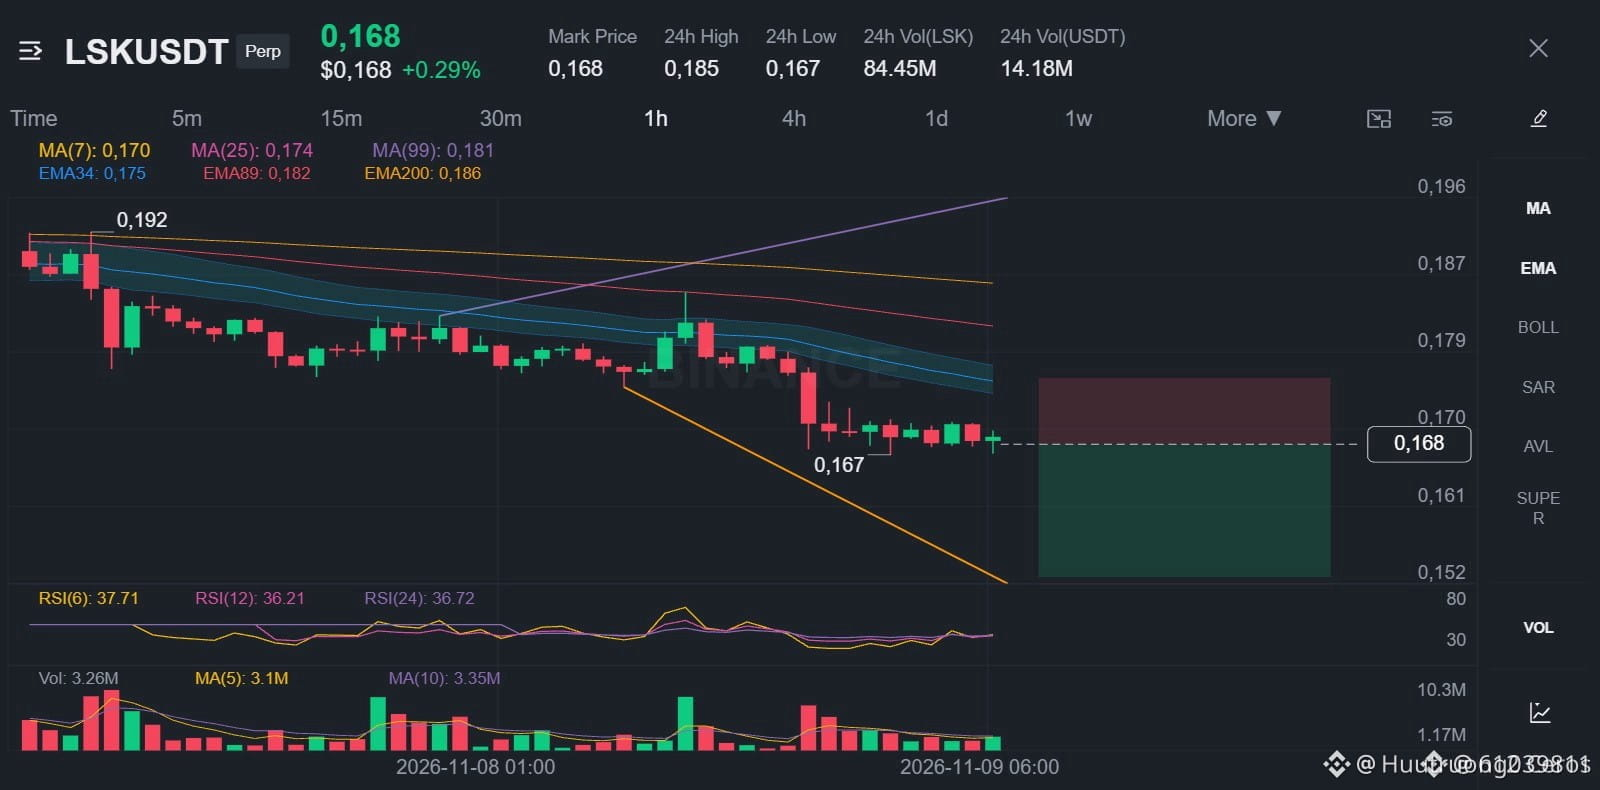
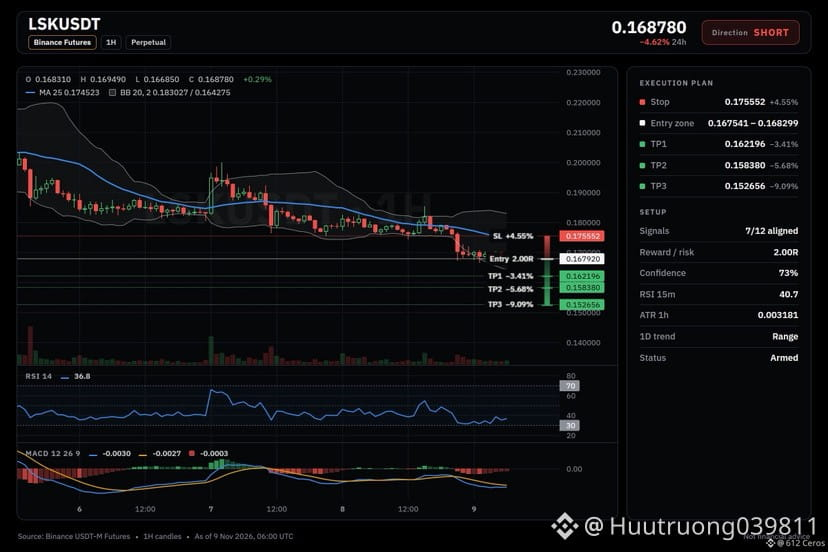
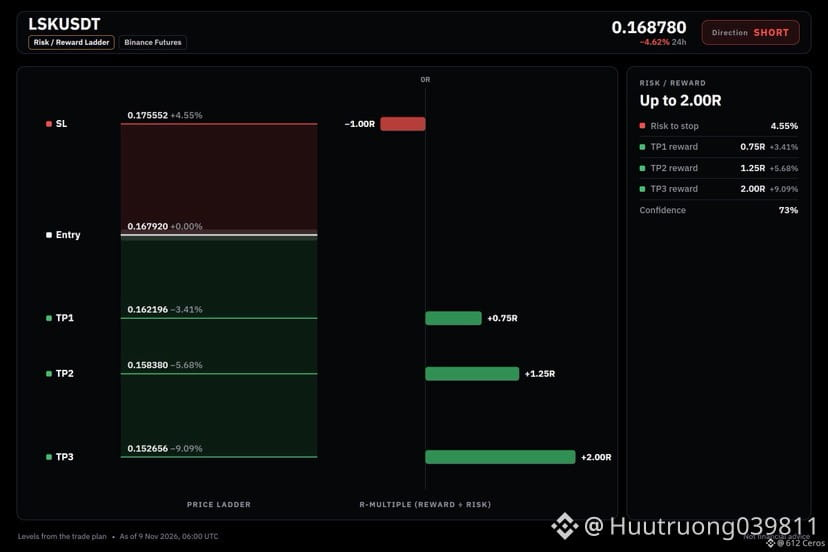
🔴 $LSK /USDT · Bias: SHORT
LSK price sits below both EMAs on the 4h, so the swing trend points down.
Entry: 0.167541 – 0.168299
TP1: 0.162196 (-3.4%)
TP2: 0.158380 (-5.7%)
TP3: 0.152656 (-9.1%)
SL: 0.175552 (+4.5%)
Why: The 4h trend shows price below EMA50 and EMA200 with a bearish stack, meaning the short-term trend is down.
Risk: Far below its average, bounce likely (−3.0 ATR from 1h EMA50)
Plan: close 50% at TP1, 25% at TP2, 25% at TP3, and move the stop to entry after TP1.
Do you agree with this short setup on LSK?
{spot}(LSKUSDT)
🔴 $LSK /USDT · Bias: SHORT
LSK price sits below both EMAs on the 4h, so the swing trend points down.
Entry: 0.167541 – 0.168299
TP1: 0.162196 (-3.4%)
TP2: 0.158380 (-5.7%)
TP3: 0.152656 (-9.1%)
SL: 0.175552 (+4.5%)
Why: The 4h trend shows price below EMA50 and EMA200 with a bearish stack, meaning the short-term trend is down.
Risk: Far below its average, bounce likely (−3.0 ATR from 1h EMA50)
Plan: close 50% at TP1, 25% at TP2, 25% at TP3, and move the stop to entry after TP1.
Do you agree with this short setup on LSK?
LSK price sits below both EMAs on the 4h, so the swing trend points down.
Entry: 0.167541 – 0.168299
TP1: 0.162196 (-3.4%)
TP2: 0.158380 (-5.7%)
TP3: 0.152656 (-9.1%)
SL: 0.175552 (+4.5%)
Why: The 4h trend shows price below EMA50 and EMA200 with a bearish stack, meaning the short-term trend is down.
Risk: Far below its average, bounce likely (−3.0 ATR from 1h EMA50)
Plan: close 50% at TP1, 25% at TP2, 25% at TP3, and move the stop to entry after TP1.
Do you agree with this short setup on LSK?
11
·
--
Падение
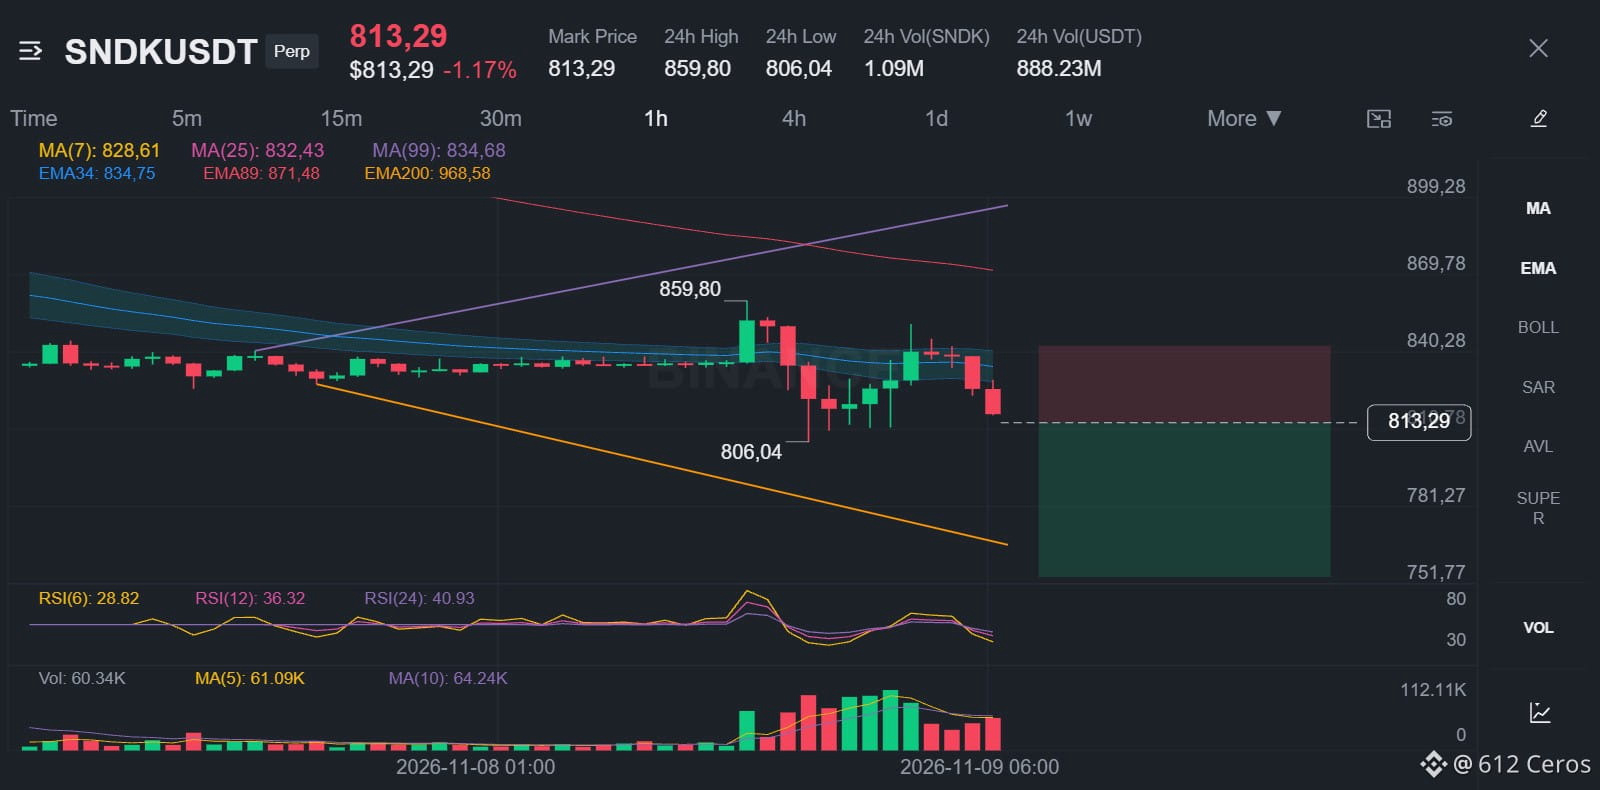
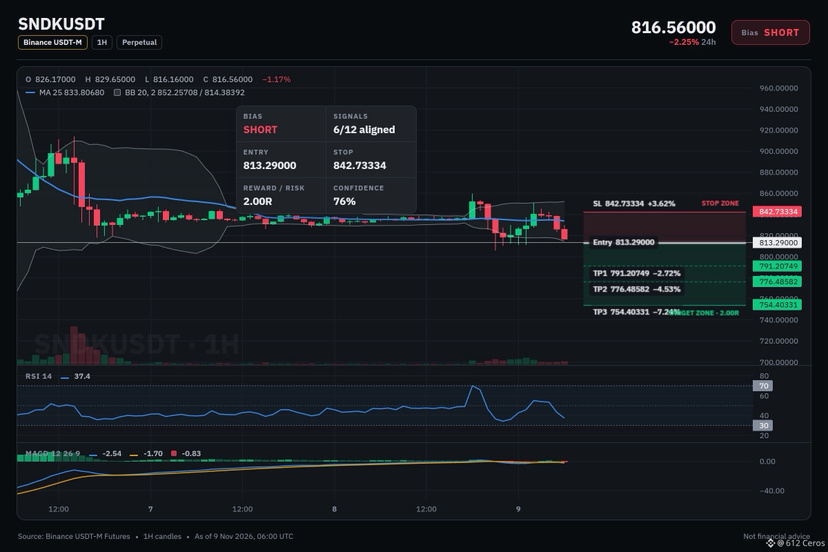
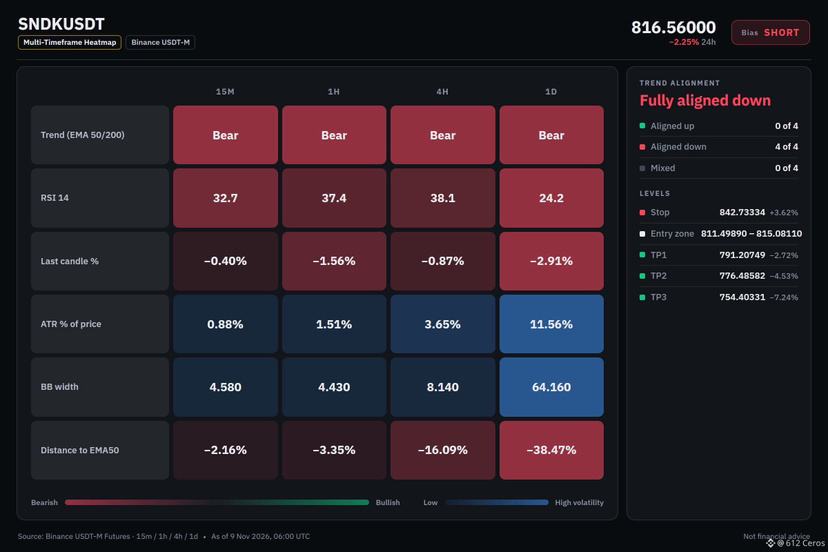
🔴 $SNDK /USDT · Bias: SHORT
SNDK price sits below all EMAs on daily, 4h and 1h, so the trend points down.
Entry: 811.49890 – 815.08110
TP1: 791.20749 (-2.7%)
TP2: 776.48582 (-4.5%)
TP3: 754.40331 (-7.2%)
SL: 842.73334 (+3.6%)
Why: The daily trend shows price below EMA50 and EMA200 in a bearish stack, meaning the big-picture trend is down.
Plan: close 50% at TP1, 25% at TP2, 25% at TP3, and move the stop to entry after TP1.
Do you think SNDK can break higher from here?
{future}(SNDKUSDT)
🔴 $SNDK /USDT · Bias: SHORT
SNDK price sits below all EMAs on daily, 4h and 1h, so the trend points down.
Entry: 811.49890 – 815.08110
TP1: 791.20749 (-2.7%)
TP2: 776.48582 (-4.5%)
TP3: 754.40331 (-7.2%)
SL: 842.73334 (+3.6%)
Why: The daily trend shows price below EMA50 and EMA200 in a bearish stack, meaning the big-picture trend is down.
Plan: close 50% at TP1, 25% at TP2, 25% at TP3, and move the stop to entry after TP1.
Do you think SNDK can break higher from here?
SNDK price sits below all EMAs on daily, 4h and 1h, so the trend points down.
Entry: 811.49890 – 815.08110
TP1: 791.20749 (-2.7%)
TP2: 776.48582 (-4.5%)
TP3: 754.40331 (-7.2%)
SL: 842.73334 (+3.6%)
Why: The daily trend shows price below EMA50 and EMA200 in a bearish stack, meaning the big-picture trend is down.
Plan: close 50% at TP1, 25% at TP2, 25% at TP3, and move the stop to entry after TP1.
Do you think SNDK can break higher from here?
16
·
--
Падение
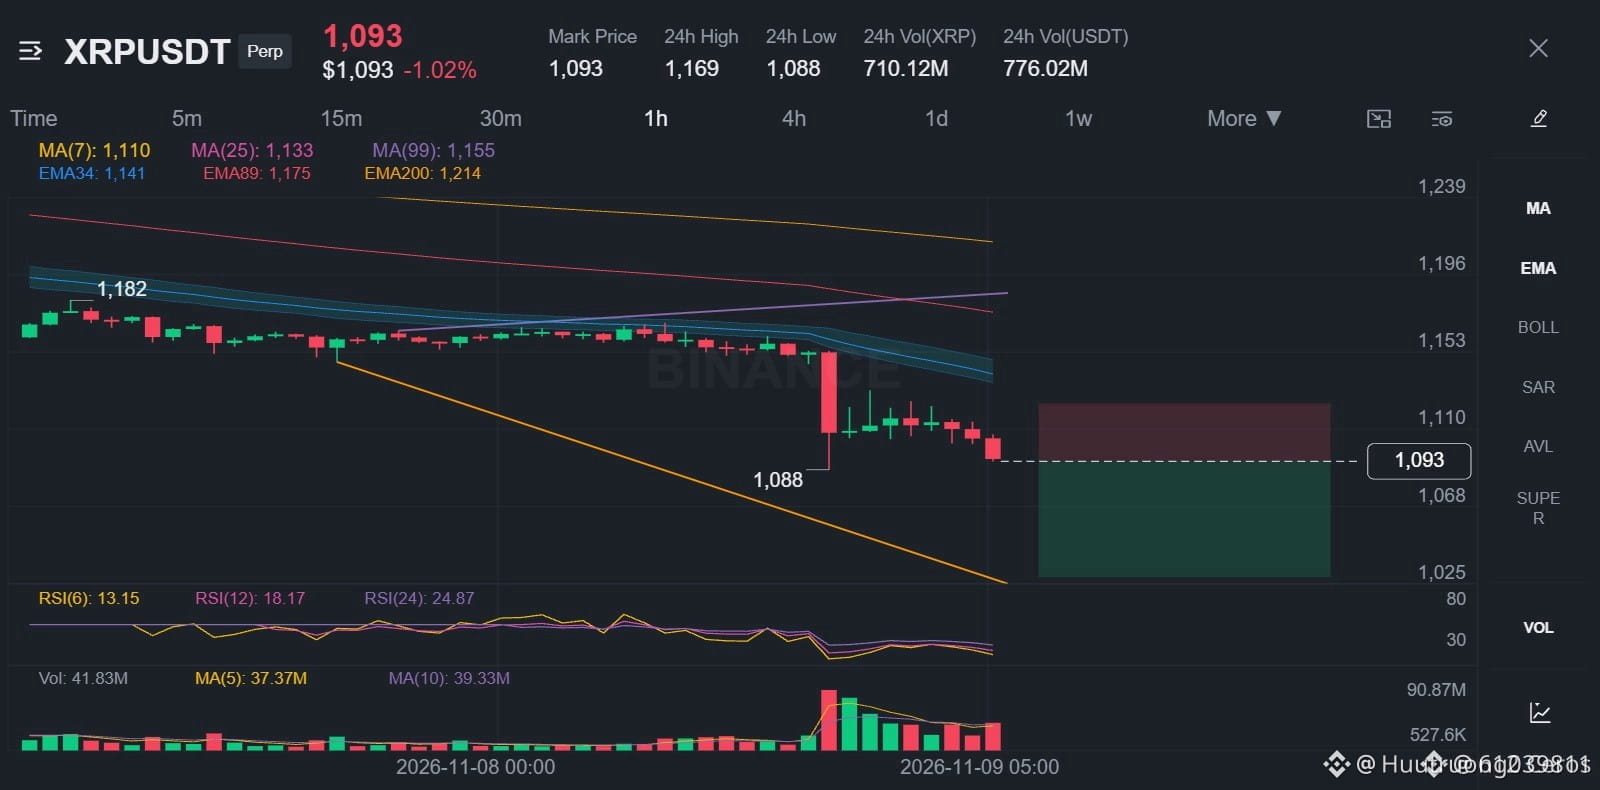
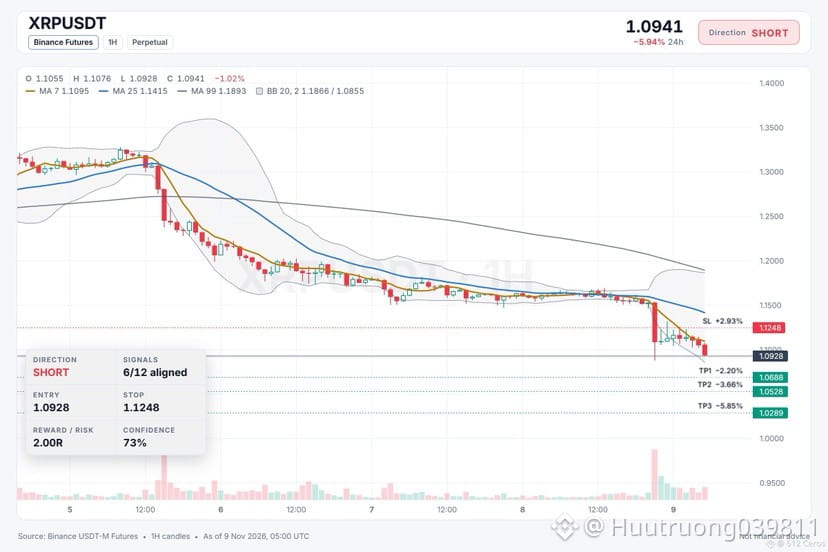
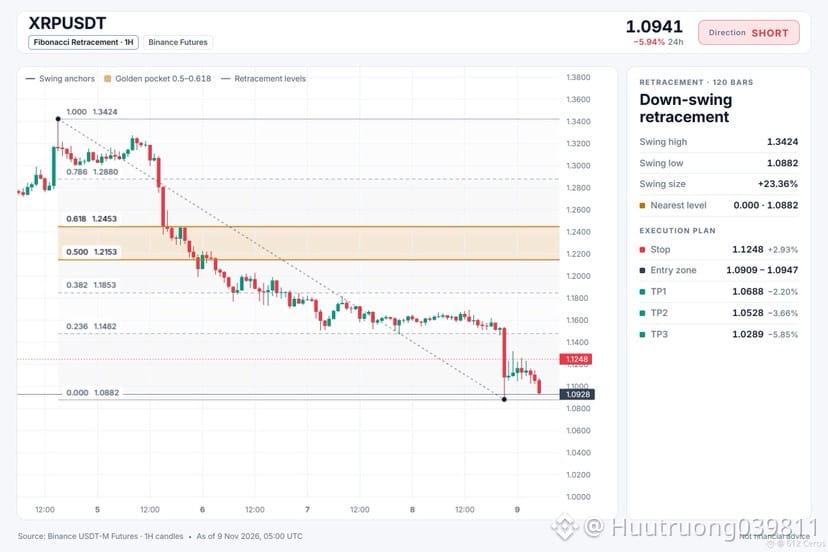
🔴 $XRP /USDT · Bias: SHORT
XRP price sits below EMA50 and EMA200 on the 4h, so the swing trend points down.
Entry: 1.0909 – 1.0947
TP1: 1.0688 (-2.2%)
TP2: 1.0528 (-3.7%)
TP3: 1.0289 (-5.8%)
SL: 1.1248 (+2.9%)
Why: The daily trend is bearish because price sits below both EMA50 and EMA200, meaning the big picture is clearly down.
Risk: Price is washed out, bounces are common from here (4h RSI 22.0, oversold)
Plan: close 50% at TP1, 25% at TP2, 25% at TP3, and move the stop to entry after TP1.
Do you think XRP can keep falling from here?
{spot}(XRPUSDT)
🔴 $XRP /USDT · Bias: SHORT
XRP price sits below EMA50 and EMA200 on the 4h, so the swing trend points down.
Entry: 1.0909 – 1.0947
TP1: 1.0688 (-2.2%)
TP2: 1.0528 (-3.7%)
TP3: 1.0289 (-5.8%)
SL: 1.1248 (+2.9%)
Why: The daily trend is bearish because price sits below both EMA50 and EMA200, meaning the big picture is clearly down.
Risk: Price is washed out, bounces are common from here (4h RSI 22.0, oversold)
Plan: close 50% at TP1, 25% at TP2, 25% at TP3, and move the stop to entry after TP1.
Do you think XRP can keep falling from here?
XRP price sits below EMA50 and EMA200 on the 4h, so the swing trend points down.
Entry: 1.0909 – 1.0947
TP1: 1.0688 (-2.2%)
TP2: 1.0528 (-3.7%)
TP3: 1.0289 (-5.8%)
SL: 1.1248 (+2.9%)
Why: The daily trend is bearish because price sits below both EMA50 and EMA200, meaning the big picture is clearly down.
Risk: Price is washed out, bounces are common from here (4h RSI 22.0, oversold)
Plan: close 50% at TP1, 25% at TP2, 25% at TP3, and move the stop to entry after TP1.
Do you think XRP can keep falling from here?
6
·
--
Падение
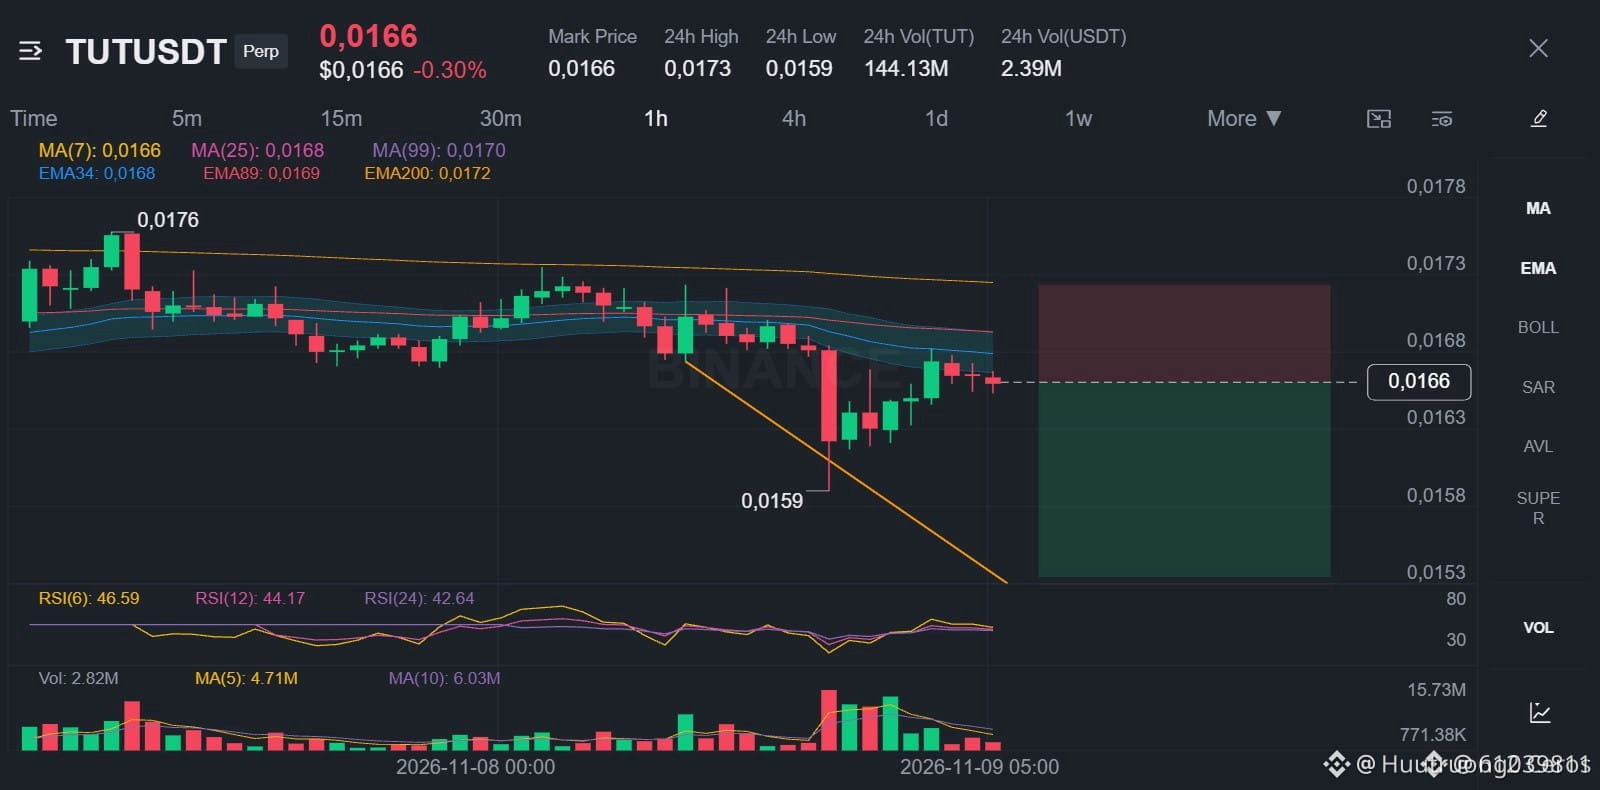
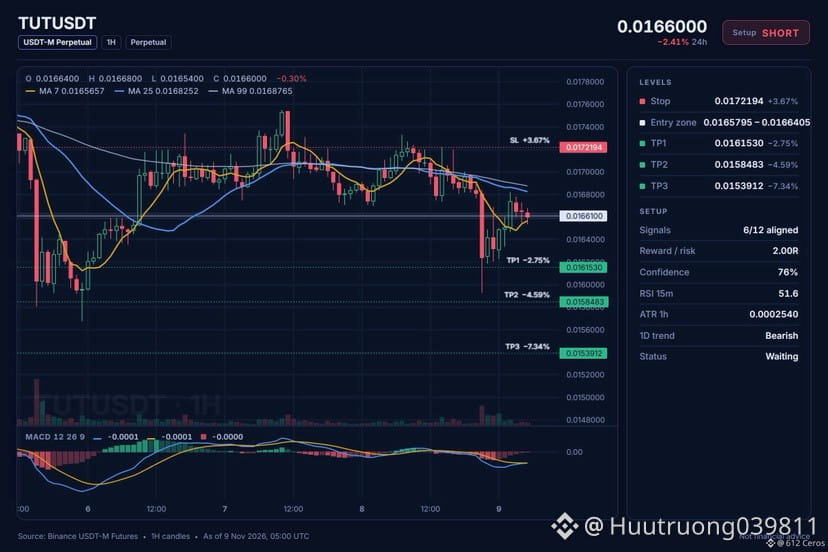
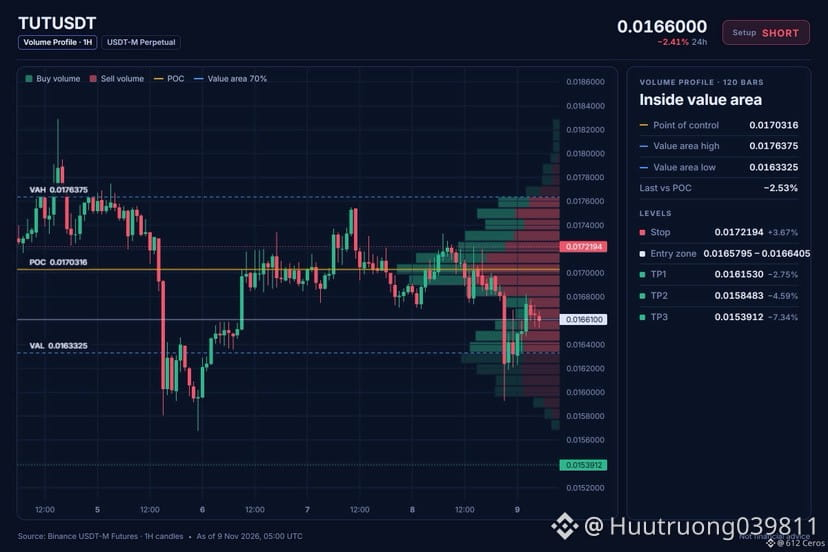
🔴 $TUT /USDT · Bias: SHORT
The daily, 4h and 1h trends are all bearish for TUT.
Entry: 0.0165795 – 0.0166405
TP1: 0.0161530 (-2.8%)
TP2: 0.0158483 (-4.6%)
TP3: 0.0153912 (-7.3%)
SL: 0.0172194 (+3.7%)
Why: The daily trend shows price below EMA50 below EMA200, meaning the big-picture trend is down and sellers are in control.
Plan: close 50% at TP1, 25% at TP2, 25% at TP3, and move the stop to entry after TP1.
Where do you see TUT heading from here?
{spot}(TUTUSDT)
🔴 $TUT /USDT · Bias: SHORT
The daily, 4h and 1h trends are all bearish for TUT.
Entry: 0.0165795 – 0.0166405
TP1: 0.0161530 (-2.8%)
TP2: 0.0158483 (-4.6%)
TP3: 0.0153912 (-7.3%)
SL: 0.0172194 (+3.7%)
Why: The daily trend shows price below EMA50 below EMA200, meaning the big-picture trend is down and sellers are in control.
Plan: close 50% at TP1, 25% at TP2, 25% at TP3, and move the stop to entry after TP1.
Where do you see TUT heading from here?
The daily, 4h and 1h trends are all bearish for TUT.
Entry: 0.0165795 – 0.0166405
TP1: 0.0161530 (-2.8%)
TP2: 0.0158483 (-4.6%)
TP3: 0.0153912 (-7.3%)
SL: 0.0172194 (+3.7%)
Why: The daily trend shows price below EMA50 below EMA200, meaning the big-picture trend is down and sellers are in control.
Plan: close 50% at TP1, 25% at TP2, 25% at TP3, and move the stop to entry after TP1.
Where do you see TUT heading from here?
8
·
--
Падение
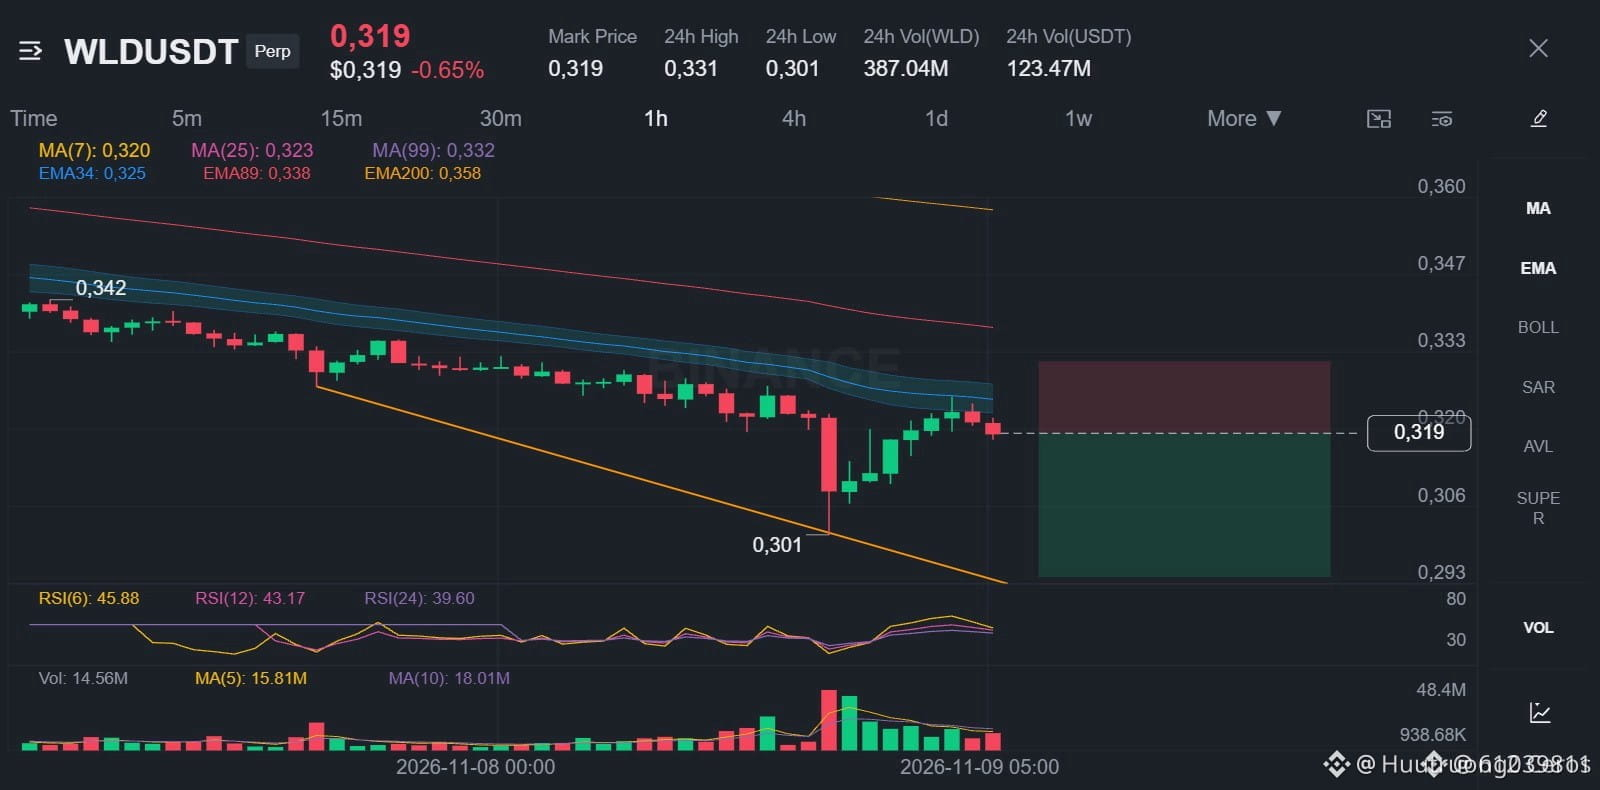
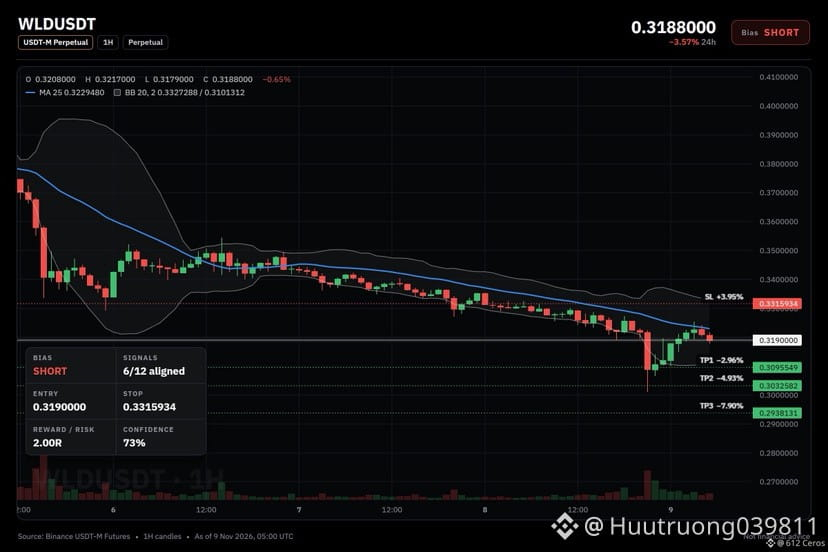
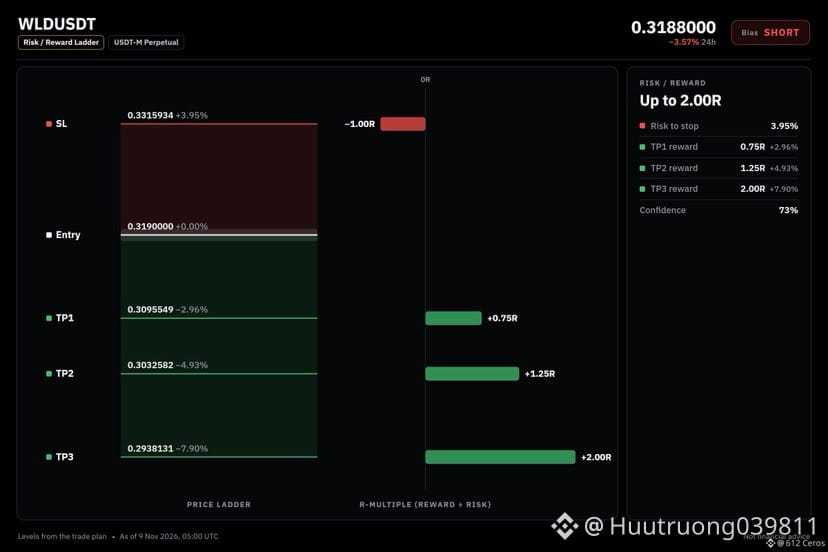
🔴 $WLD /USDT · Bias: SHORT
WLD is below both EMAs on the 4h, so the swing trend points down.
Entry: 0.3183109 – 0.3196891
TP1: 0.3095549 (-3.0%)
TP2: 0.3032582 (-4.9%)
TP3: 0.2938131 (-7.9%)
SL: 0.3315934 (+3.9%)
Why: The 4h trend shows price below EMA50 and EMA200 in a bearish stack, meaning the swing trend is down and sellers control the move.
Plan: close 50% at TP1, 25% at TP2, 25% at TP3, and move the stop to entry after TP1.
Do you also see this as a valid short entry?
{spot}(WLDUSDT)
🔴 $WLD /USDT · Bias: SHORT
WLD is below both EMAs on the 4h, so the swing trend points down.
Entry: 0.3183109 – 0.3196891
TP1: 0.3095549 (-3.0%)
TP2: 0.3032582 (-4.9%)
TP3: 0.2938131 (-7.9%)
SL: 0.3315934 (+3.9%)
Why: The 4h trend shows price below EMA50 and EMA200 in a bearish stack, meaning the swing trend is down and sellers control the move.
Plan: close 50% at TP1, 25% at TP2, 25% at TP3, and move the stop to entry after TP1.
Do you also see this as a valid short entry?
WLD is below both EMAs on the 4h, so the swing trend points down.
Entry: 0.3183109 – 0.3196891
TP1: 0.3095549 (-3.0%)
TP2: 0.3032582 (-4.9%)
TP3: 0.2938131 (-7.9%)
SL: 0.3315934 (+3.9%)
Why: The 4h trend shows price below EMA50 and EMA200 in a bearish stack, meaning the swing trend is down and sellers control the move.
Plan: close 50% at TP1, 25% at TP2, 25% at TP3, and move the stop to entry after TP1.
Do you also see this as a valid short entry?
3
·
--
Падение
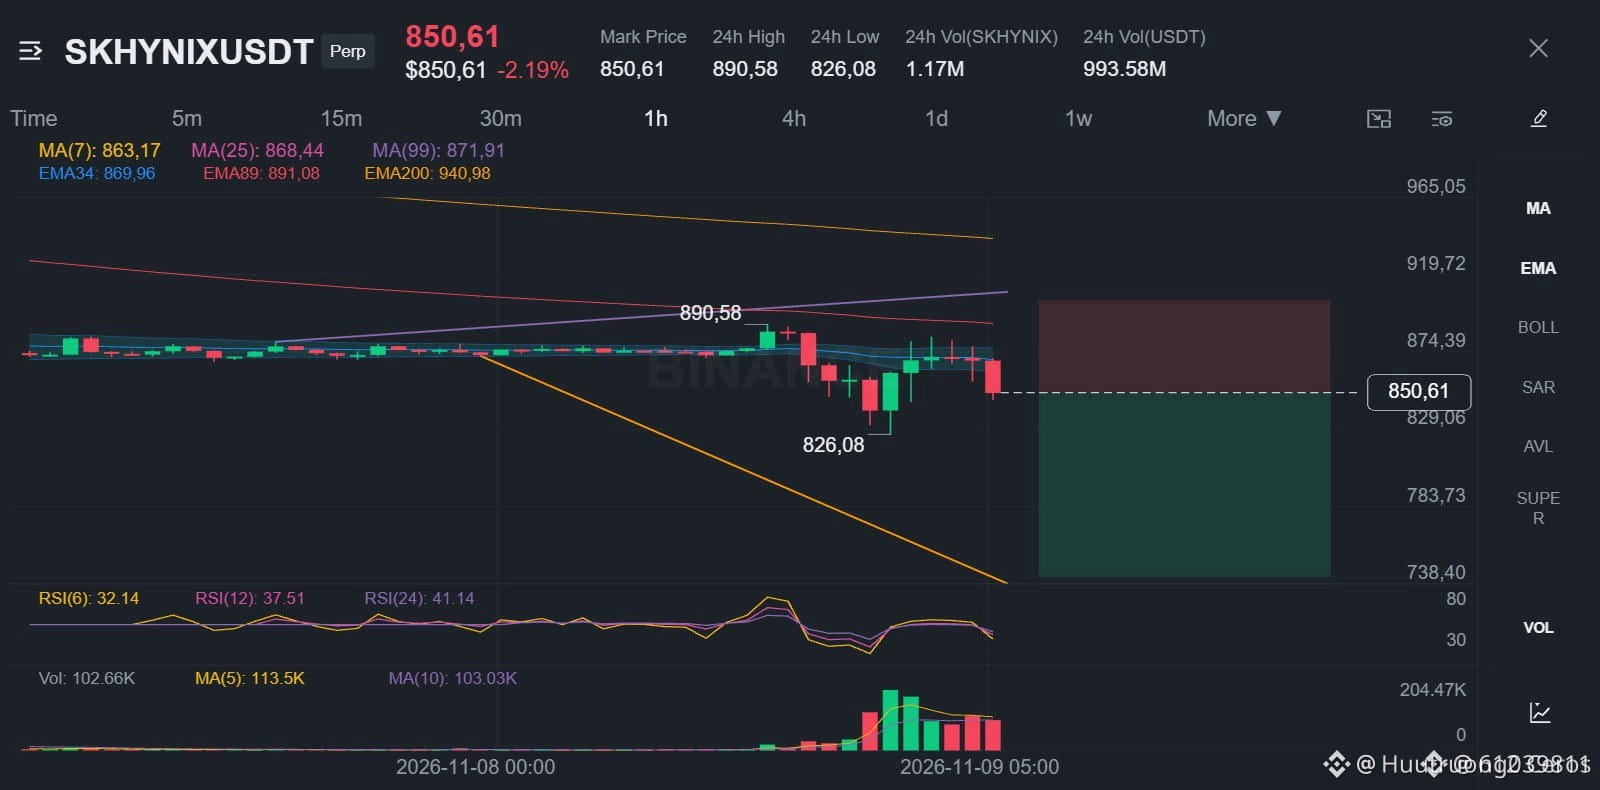
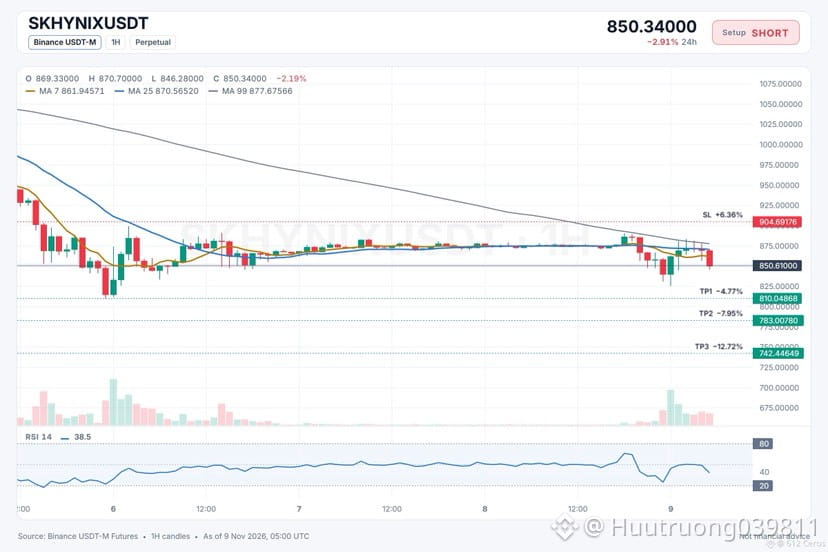
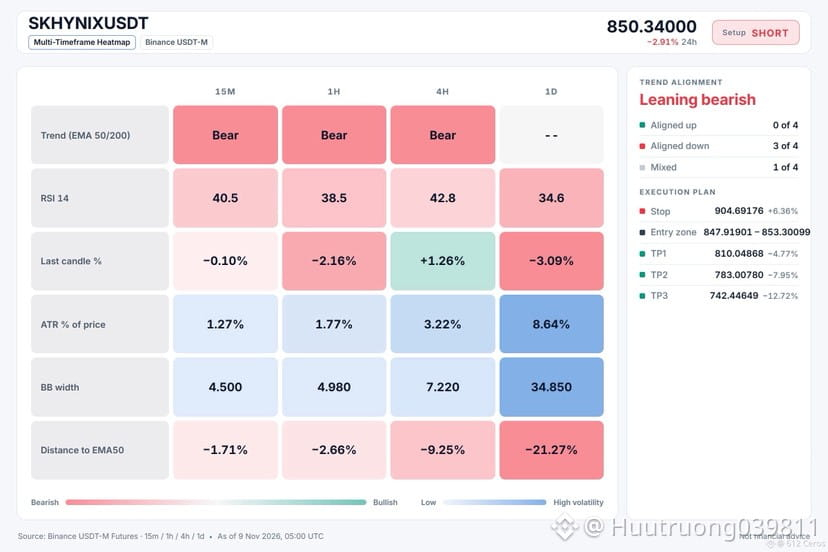
🔴 $SKHYNIX /USDT · Bias: SHORT
SKHYNIX price is below both EMAs on the 4h, so the swing trend points down.
Entry: 847.91901 – 853.30099
TP1: 810.04868 (-4.8%)
TP2: 783.00780 (-7.9%)
TP3: 742.44649 (-12.7%)
SL: 904.69176 (+6.4%)
Why: The 1h trend is bearish because price sits below EMA50 and EMA200, meaning the short-term trend is down.
Plan: close 50% at TP1, 25% at TP2, 25% at TP3, and move the stop to entry after TP1.
Do you agree with this short setup?
{future}(SKHYNIXUSDT)
🔴 $SKHYNIX /USDT · Bias: SHORT
SKHYNIX price is below both EMAs on the 4h, so the swing trend points down.
Entry: 847.91901 – 853.30099
TP1: 810.04868 (-4.8%)
TP2: 783.00780 (-7.9%)
TP3: 742.44649 (-12.7%)
SL: 904.69176 (+6.4%)
Why: The 1h trend is bearish because price sits below EMA50 and EMA200, meaning the short-term trend is down.
Plan: close 50% at TP1, 25% at TP2, 25% at TP3, and move the stop to entry after TP1.
Do you agree with this short setup?
SKHYNIX price is below both EMAs on the 4h, so the swing trend points down.
Entry: 847.91901 – 853.30099
TP1: 810.04868 (-4.8%)
TP2: 783.00780 (-7.9%)
TP3: 742.44649 (-12.7%)
SL: 904.69176 (+6.4%)
Why: The 1h trend is bearish because price sits below EMA50 and EMA200, meaning the short-term trend is down.
Plan: close 50% at TP1, 25% at TP2, 25% at TP3, and move the stop to entry after TP1.
Do you agree with this short setup?
7
·
--
Падение
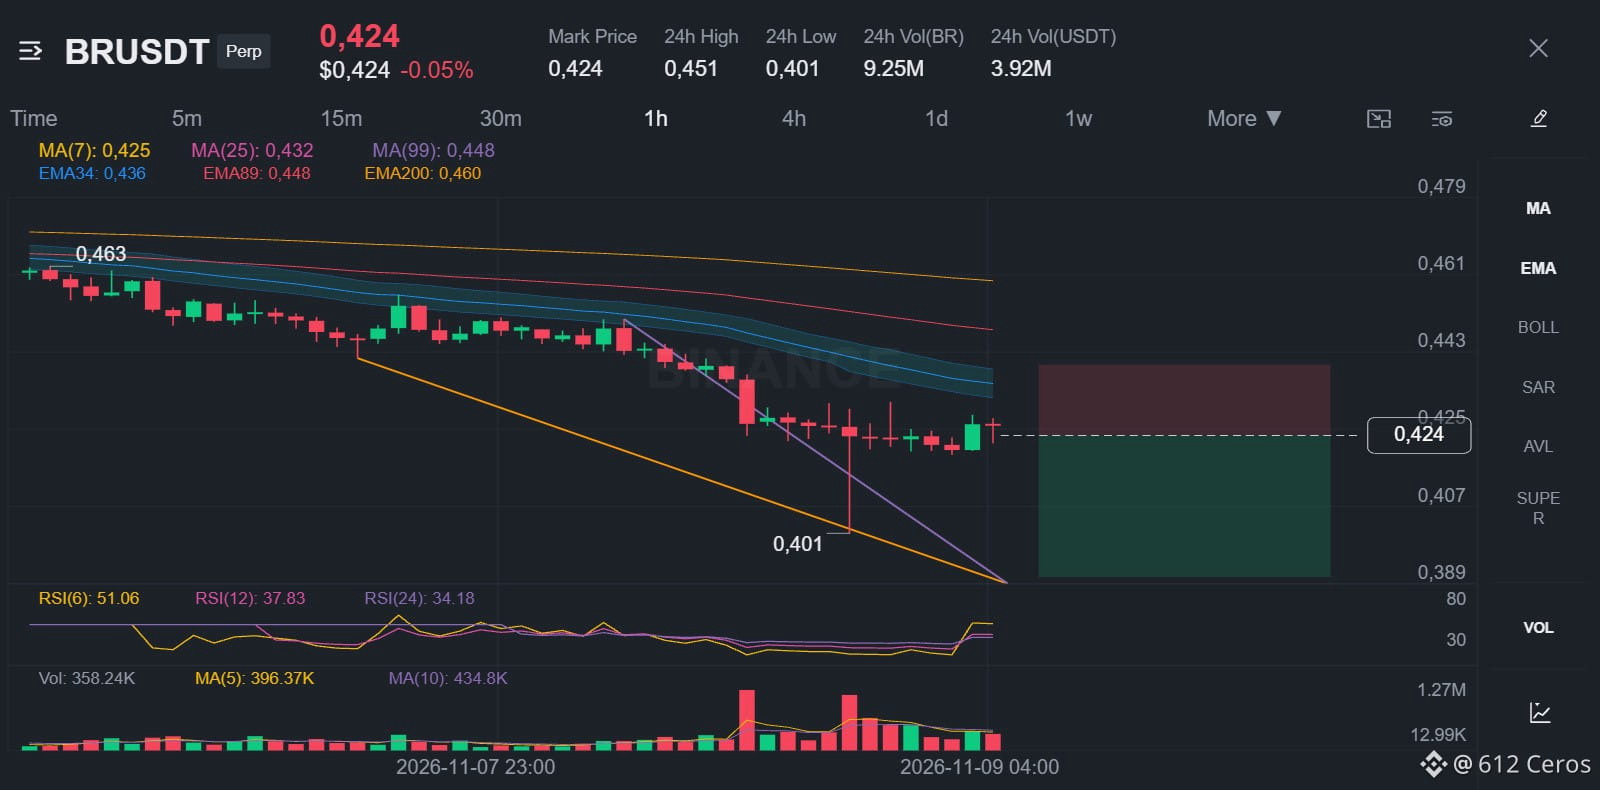
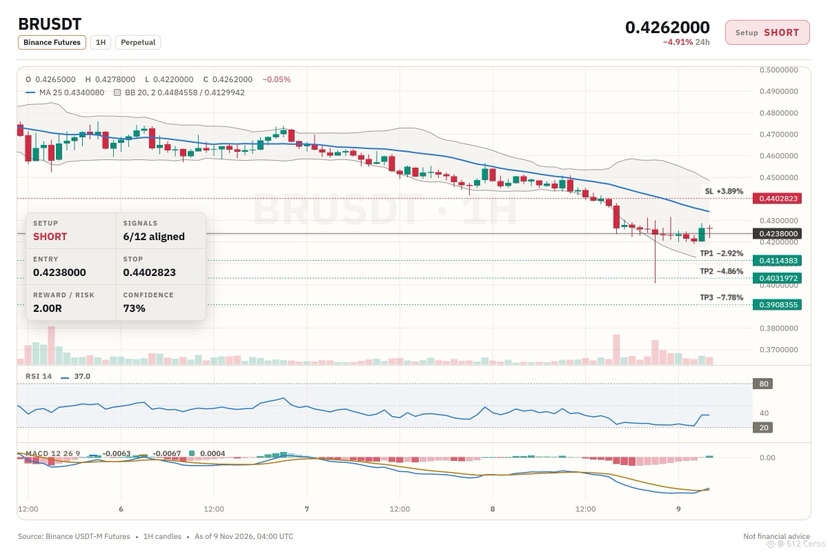
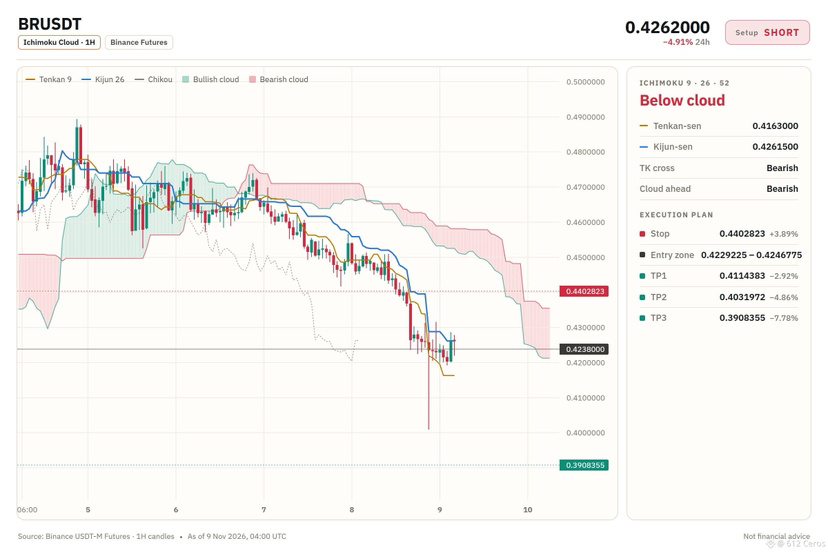
🔴 $BR /USDT · Bias: SHORT
$BR price sits below both EMAs on the 4h, so the swing trend points down.
Entry: 0.4229225 – 0.4246775
TP1: 0.4114383 (-2.9%)
TP2: 0.4031972 (-4.9%)
TP3: 0.3908355 (-7.8%)
SL: 0.4402823 (+3.9%)
Why: The 4h trend shows price below EMA50 and EMA200 in a bearish stack, meaning the swing trend is down.
Plan: close 50% at TP1, 25% at TP2, 25% at TP3, and move the stop to entry after TP1.
Do you think $BR will keep moving lower from here?
{future}(BRUSDT)
🔴 $BR /USDT · Bias: SHORT
$BR price sits below both EMAs on the 4h, so the swing trend points down.
Entry: 0.4229225 – 0.4246775
TP1: 0.4114383 (-2.9%)
TP2: 0.4031972 (-4.9%)
TP3: 0.3908355 (-7.8%)
SL: 0.4402823 (+3.9%)
Why: The 4h trend shows price below EMA50 and EMA200 in a bearish stack, meaning the swing trend is down.
Plan: close 50% at TP1, 25% at TP2, 25% at TP3, and move the stop to entry after TP1.
Do you think $BR will keep moving lower from here?
$BR price sits below both EMAs on the 4h, so the swing trend points down.
Entry: 0.4229225 – 0.4246775
TP1: 0.4114383 (-2.9%)
TP2: 0.4031972 (-4.9%)
TP3: 0.3908355 (-7.8%)
SL: 0.4402823 (+3.9%)
Why: The 4h trend shows price below EMA50 and EMA200 in a bearish stack, meaning the swing trend is down.
Plan: close 50% at TP1, 25% at TP2, 25% at TP3, and move the stop to entry after TP1.
Do you think $BR will keep moving lower from here?
7
·
--
Падение
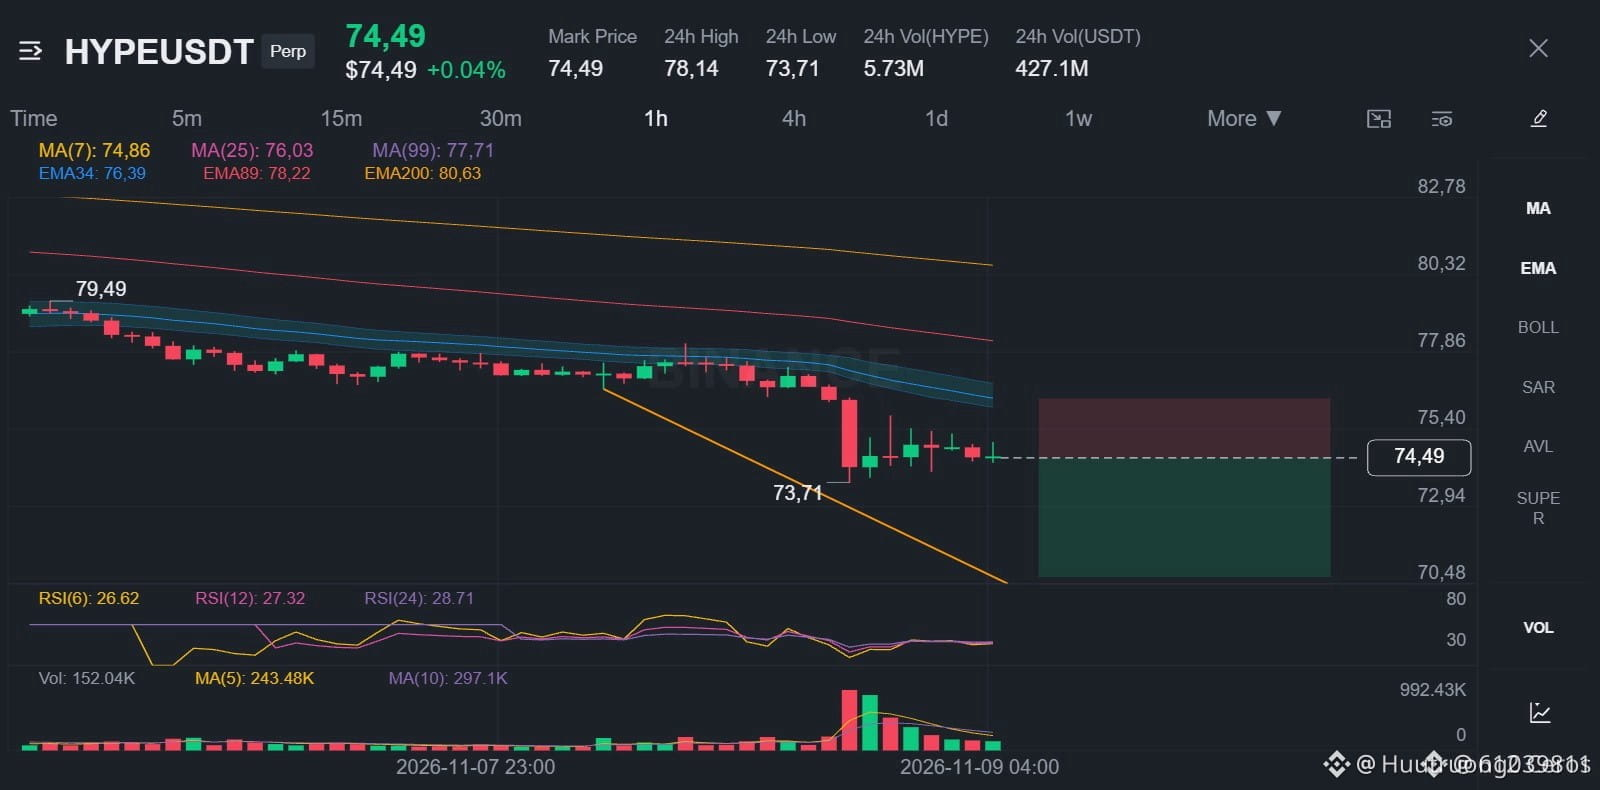
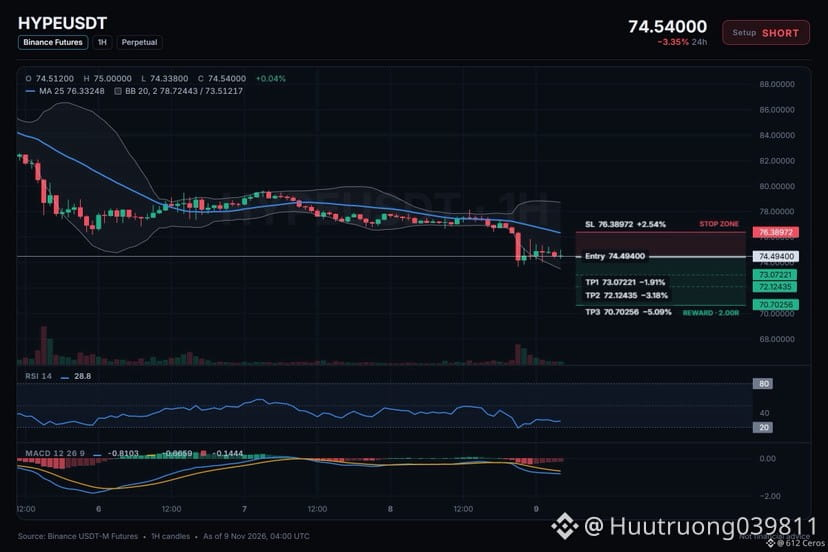
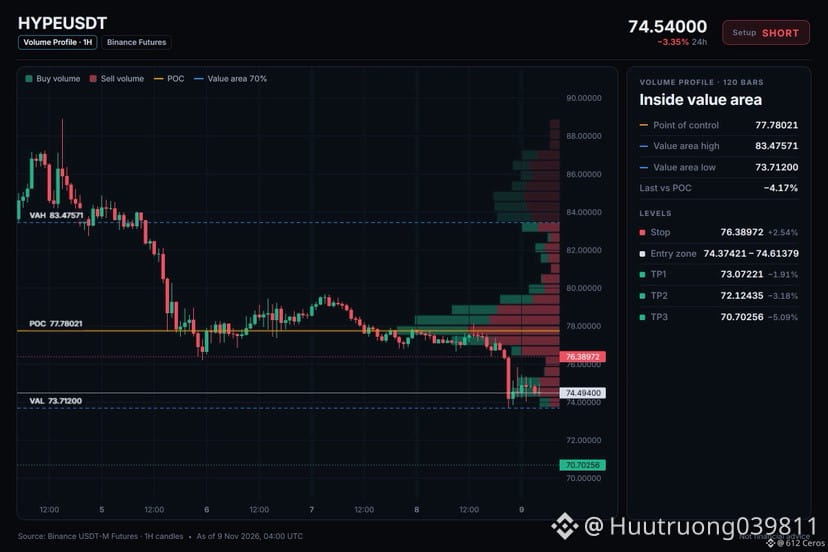
🔴 $HYPE /USDT · Bias: SHORT
4h and 1h trends are bearish, so HYPE price should continue lower.
Entry: 74.37421 – 74.61379
TP1: 73.07221 (-1.9%)
TP2: 72.12435 (-3.2%)
TP3: 70.70256 (-5.1%)
SL: 76.38972 (+2.5%)
Why: The 4h trend shows price below both EMAs, meaning the swing trend is down.
Risk: Far below its average, bounce likely (−3.1 ATR from 1h EMA50)
Plan: close 50% at TP1, 25% at TP2, 25% at TP3, and move the stop to entry after TP1.
Do you think HYPE keeps falling from here?
{spot}(HYPEUSDT)
🔴 $HYPE /USDT · Bias: SHORT
4h and 1h trends are bearish, so HYPE price should continue lower.
Entry: 74.37421 – 74.61379
TP1: 73.07221 (-1.9%)
TP2: 72.12435 (-3.2%)
TP3: 70.70256 (-5.1%)
SL: 76.38972 (+2.5%)
Why: The 4h trend shows price below both EMAs, meaning the swing trend is down.
Risk: Far below its average, bounce likely (−3.1 ATR from 1h EMA50)
Plan: close 50% at TP1, 25% at TP2, 25% at TP3, and move the stop to entry after TP1.
Do you think HYPE keeps falling from here?
4h and 1h trends are bearish, so HYPE price should continue lower.
Entry: 74.37421 – 74.61379
TP1: 73.07221 (-1.9%)
TP2: 72.12435 (-3.2%)
TP3: 70.70256 (-5.1%)
SL: 76.38972 (+2.5%)
Why: The 4h trend shows price below both EMAs, meaning the swing trend is down.
Risk: Far below its average, bounce likely (−3.1 ATR from 1h EMA50)
Plan: close 50% at TP1, 25% at TP2, 25% at TP3, and move the stop to entry after TP1.
Do you think HYPE keeps falling from here?
7
·
--
Падение
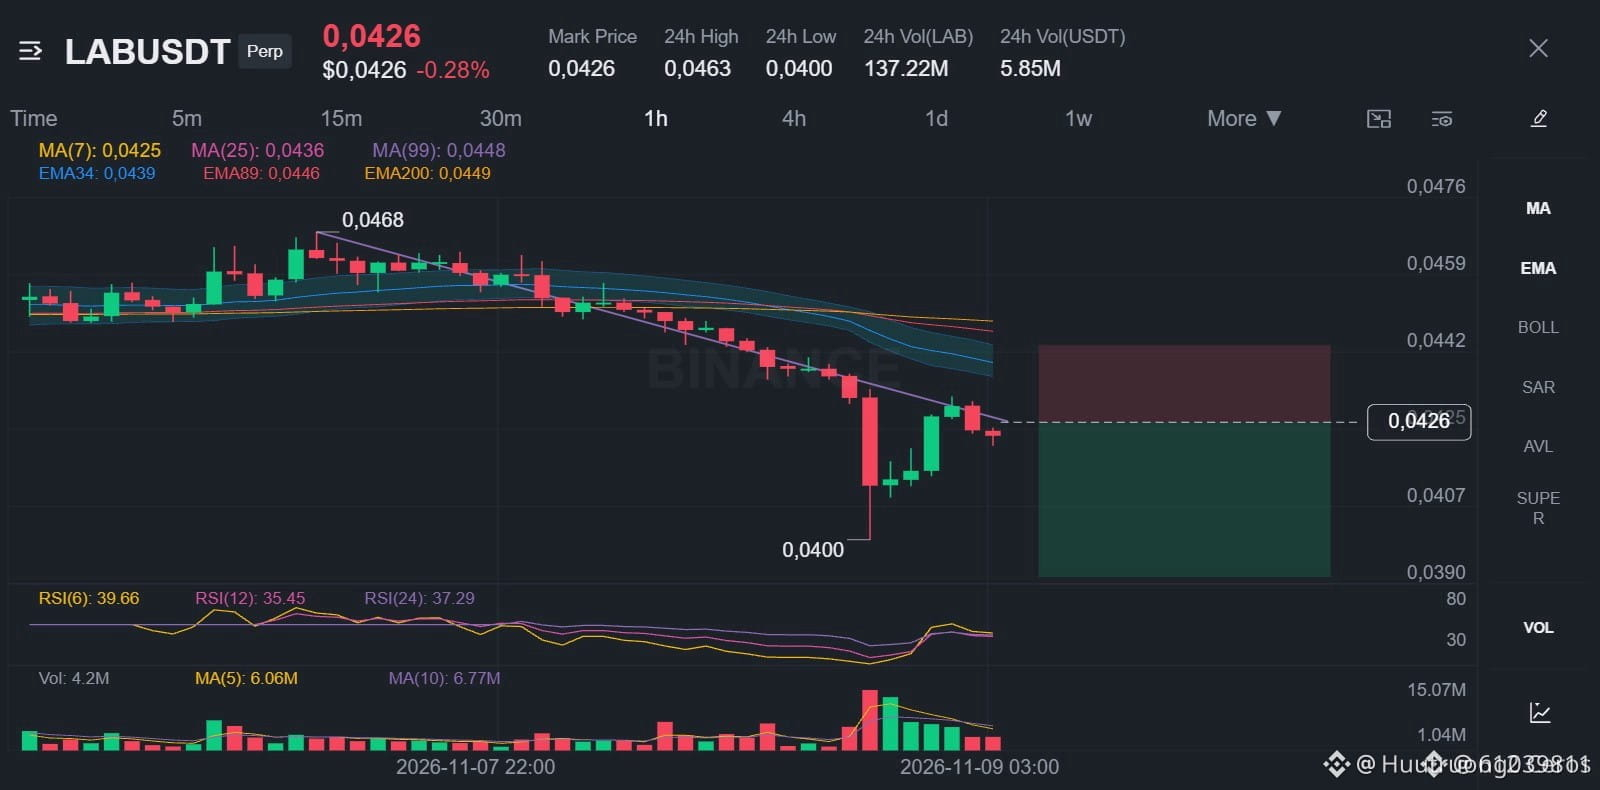
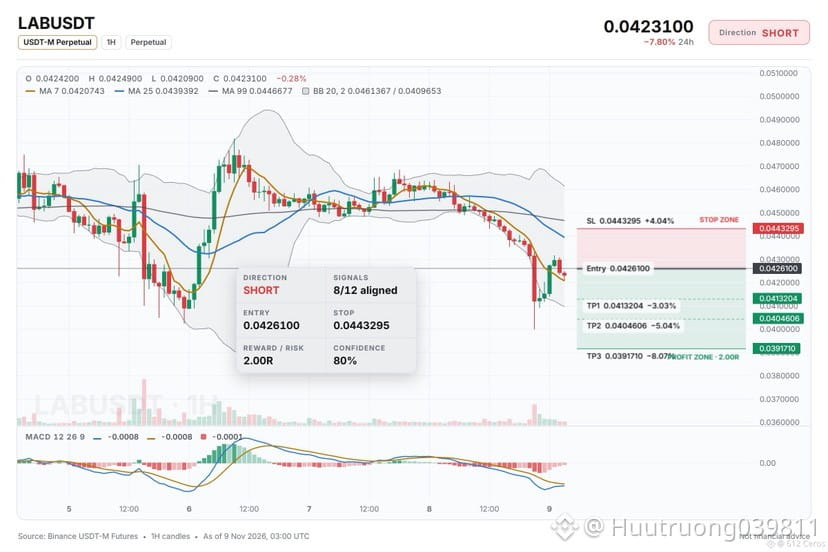
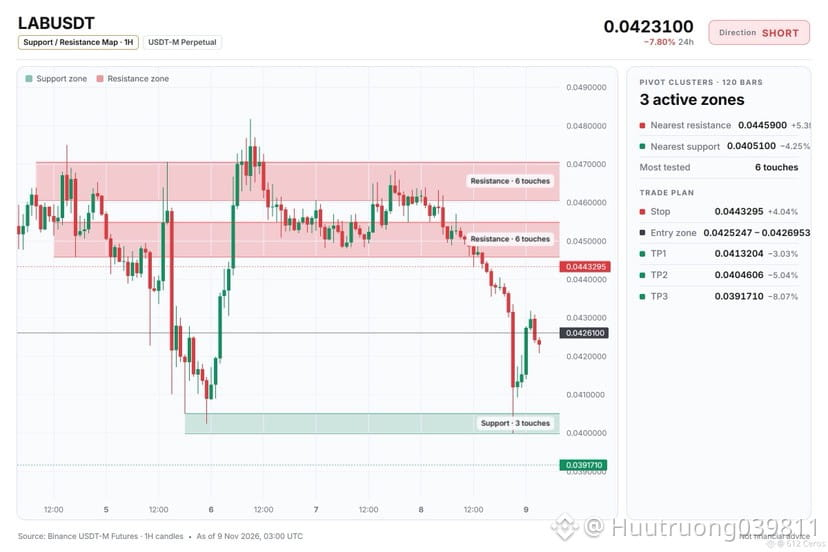
🔴 $LAB /USDT · Bias: SHORT
LAB is below EMA50 and EMA200 on the 4h, so the swing trend points down.
Entry: 0.0425247 – 0.0426953
TP1: 0.0413204 (-3.0%)
TP2: 0.0404606 (-5.0%)
TP3: 0.0391710 (-8.1%)
SL: 0.0443295 (+4.0%)
Why: The daily trend is bearish with price below EMA50 and EMA200, meaning the big-picture trend is down and sellers are in control.
Risk: Buyers are pushing right now (+0.28% 15m candle)
Plan: close 50% at TP1, 25% at TP2, 25% at TP3, and move the stop to entry after TP1.
Do you see LAB continuing lower from the current 4h price?
{future}(LABUSDT)
🔴 $LAB /USDT · Bias: SHORT
LAB is below EMA50 and EMA200 on the 4h, so the swing trend points down.
Entry: 0.0425247 – 0.0426953
TP1: 0.0413204 (-3.0%)
TP2: 0.0404606 (-5.0%)
TP3: 0.0391710 (-8.1%)
SL: 0.0443295 (+4.0%)
Why: The daily trend is bearish with price below EMA50 and EMA200, meaning the big-picture trend is down and sellers are in control.
Risk: Buyers are pushing right now (+0.28% 15m candle)
Plan: close 50% at TP1, 25% at TP2, 25% at TP3, and move the stop to entry after TP1.
Do you see LAB continuing lower from the current 4h price?
LAB is below EMA50 and EMA200 on the 4h, so the swing trend points down.
Entry: 0.0425247 – 0.0426953
TP1: 0.0413204 (-3.0%)
TP2: 0.0404606 (-5.0%)
TP3: 0.0391710 (-8.1%)
SL: 0.0443295 (+4.0%)
Why: The daily trend is bearish with price below EMA50 and EMA200, meaning the big-picture trend is down and sellers are in control.
Risk: Buyers are pushing right now (+0.28% 15m candle)
Plan: close 50% at TP1, 25% at TP2, 25% at TP3, and move the stop to entry after TP1.
Do you see LAB continuing lower from the current 4h price?
6
·
--
Падение
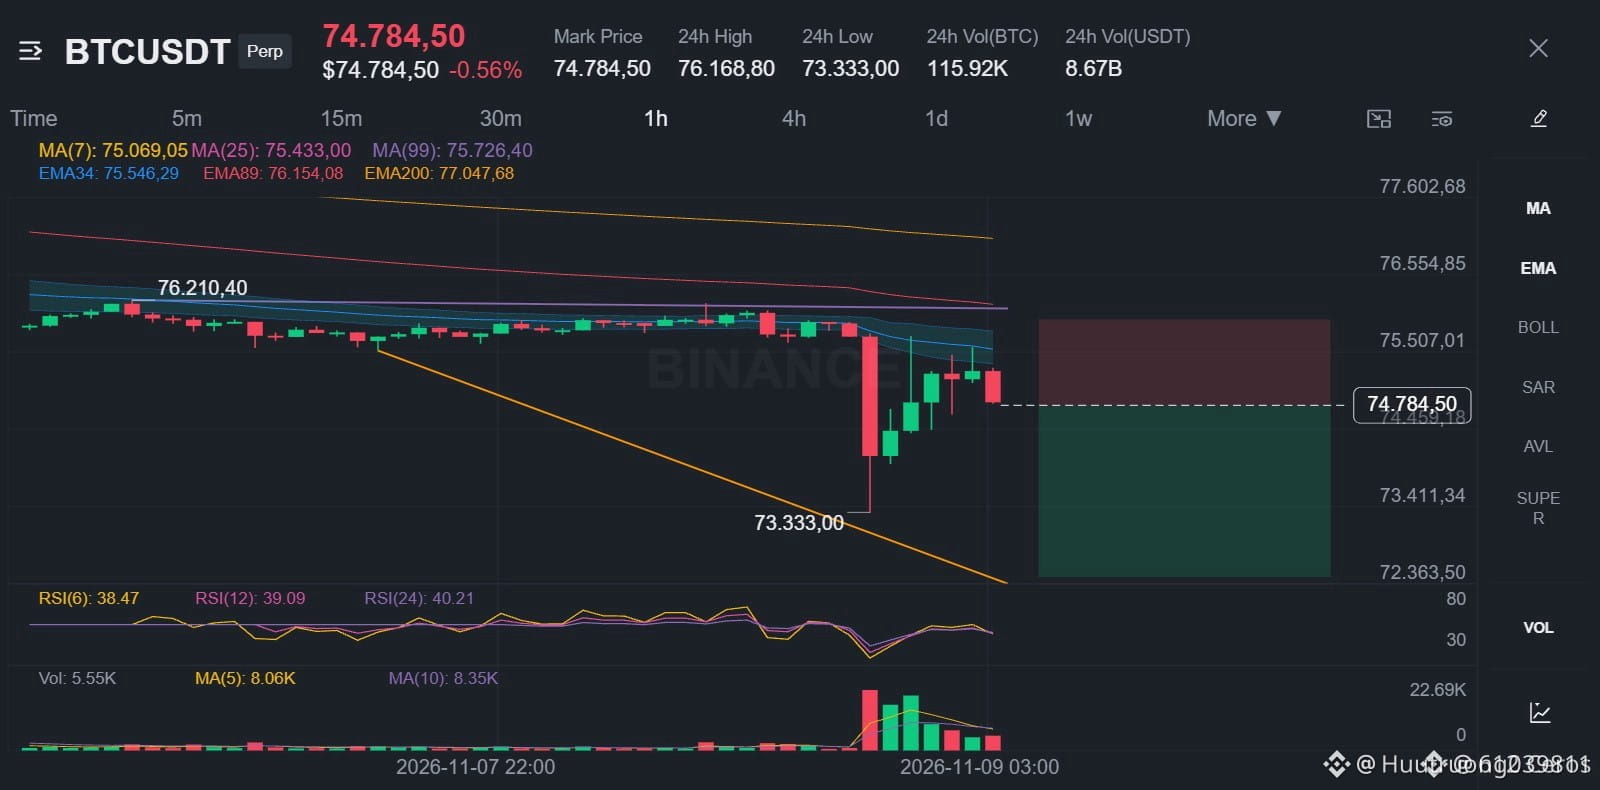
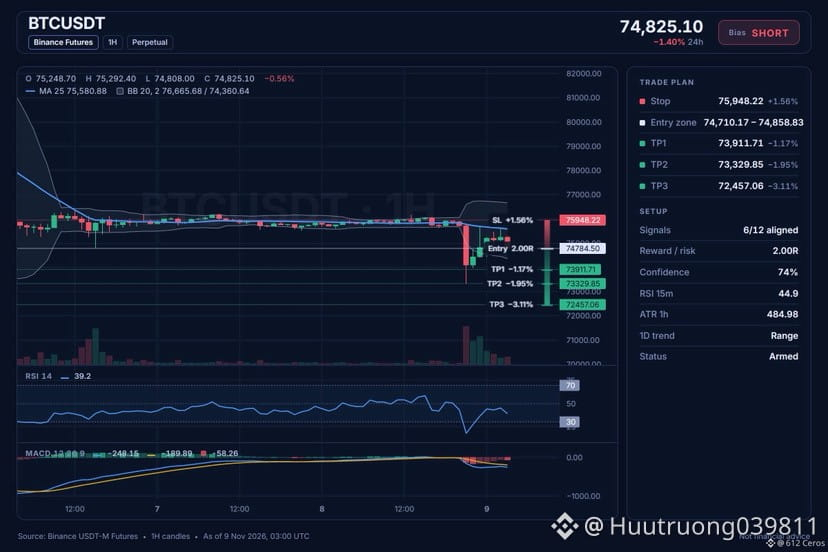
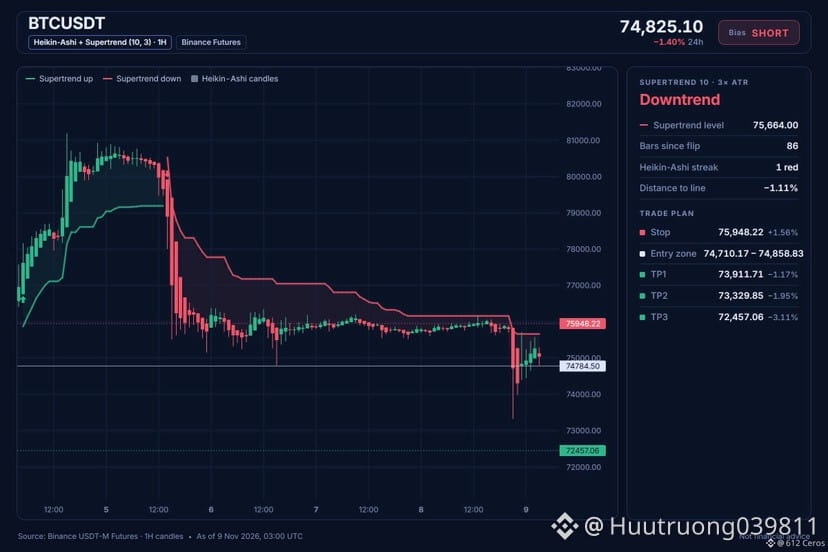
🔴 $BTC /USDT · Bias: SHORT
The 4h and 1h trends are bearish, so $BTC should continue lower.
Entry: 74710.17 – 74858.83
TP1: 73911.71 (-1.2%)
TP2: 73329.85 (-1.9%)
TP3: 72457.06 (-3.1%)
SL: 75948.22 (+1.6%)
Why: The 4h trend shows price below both the EMA50 and EMA200, meaning the swing trend is down.
Plan: close 50% at TP1, 25% at TP2, 25% at TP3, and move the stop to entry after TP1.
Do you agree with this short setup?
{spot}(BTCUSDT)
🔴 $BTC /USDT · Bias: SHORT
The 4h and 1h trends are bearish, so $BTC should continue lower.
Entry: 74710.17 – 74858.83
TP1: 73911.71 (-1.2%)
TP2: 73329.85 (-1.9%)
TP3: 72457.06 (-3.1%)
SL: 75948.22 (+1.6%)
Why: The 4h trend shows price below both the EMA50 and EMA200, meaning the swing trend is down.
Plan: close 50% at TP1, 25% at TP2, 25% at TP3, and move the stop to entry after TP1.
Do you agree with this short setup?
The 4h and 1h trends are bearish, so $BTC should continue lower.
Entry: 74710.17 – 74858.83
TP1: 73911.71 (-1.2%)
TP2: 73329.85 (-1.9%)
TP3: 72457.06 (-3.1%)
SL: 75948.22 (+1.6%)
Why: The 4h trend shows price below both the EMA50 and EMA200, meaning the swing trend is down.
Plan: close 50% at TP1, 25% at TP2, 25% at TP3, and move the stop to entry after TP1.
Do you agree with this short setup?
8
Войдите, чтобы посмотреть больше материала
Присоединяйтесь к пользователям криптовалют по всему миру на Binance Square
⚡️ Получайте новейшую и полезную информацию о криптоактивах.
💬 Нам доверяет крупнейшая в мире криптобиржа.
👍 Получите достоверные аналитические данные от верифицированных создателей контента.
Эл. почта/номер телефона
В тренде
NvidiaInvestigatesAfterHuang’sAffairApology
Просмотров: 77,592
853 обсуждают
Nvidia Board Opens Probe Into Whether Huang Was Target of Foreign Intelligence Effort
Binance News
·Лайков: 12
·Просмотров: 39.4k
BitcoinFiveWeeklyLosses
Просмотров: 96,532
1,303 обсуждают
AIChipSlumpNasdaq
Просмотров: 48,949
796 обсуждают