
RabiaShahzadi
40 Публикации

RabiaShahzadi
Отправить жалобу
Заблокировать пользователя
Crypto Information available
3 подписок(и/а)
10 подписчиков(а)
13 понравилось
Посты
A Fed rate cut means the Federal Reserve is lowering its policy rate. For #Bitcoin , that is often a more supportive macro backdrop because it can reduce the appeal of holding cash and short-term government bonds, lower financing costs, and increase expectations of easier financial conditions.
The latest confirmed Fed decision was a hold at 3.50%–3.75% on 2026-07-29; the Federal Reserve’s calendar shows the next scheduled FOMC decision is 2026-09-16. So, at this point, any September cut is still a scenario rather than a confirmed event.
How the transmission works
Rate cuts → lower yields and potentially softer U.S. dollar → more favorable liquidity and risk sentiment → possible support for Bitcoin demand.
When yields decline, the opportunity cost of holding a non-yielding asset such as BTC can fall. If the dollar also weakens, USD-priced assets may become relatively more accessible to buyers using other currencies. Easier borrowing conditions can also increase activity across risk markets—but they can amplify volatility as well.
Why cuts are not automatically positive
The reason for the cut matters:
Preventive cuts: If inflation is easing and growth remains stable, markets may interpret cuts as a gradual easing of financial conditions. That can improve risk appetite.
Crisis-response cuts: If the Fed cuts because recession risks, credit stress, or financial instability are rising, investors may initially prioritize safety. Bitcoin can be volatile or decline alongside equities despite lower rates.
Already priced in: If markets had widely expected a cut, BTC may react more to the Fed’s outlook—future cuts, inflation concerns, and growth projections—than to the cut itself.
Pay attention to the Fed statement, economic projections, the Chair’s press conference, U.S. Treasury yields, and the dollar. A cut paired with cautious language about persistent inflation may produce a different reaction than a cut paired with clear signals of further easing.
{spot}(BTCUSDT)
A Fed rate cut means the Federal Reserve is lowering its policy rate. For #Bitcoin , that is often a more supportive macro backdrop because it can reduce the appeal of holding cash and short-term government bonds, lower financing costs, and increase expectations of easier financial conditions.
The latest confirmed Fed decision was a hold at 3.50%–3.75% on 2026-07-29; the Federal Reserve’s calendar shows the next scheduled FOMC decision is 2026-09-16. So, at this point, any September cut is still a scenario rather than a confirmed event.
How the transmission works
Rate cuts → lower yields and potentially softer U.S. dollar → more favorable liquidity and risk sentiment → possible support for Bitcoin demand.
When yields decline, the opportunity cost of holding a non-yielding asset such as BTC can fall. If the dollar also weakens, USD-priced assets may become relatively more accessible to buyers using other currencies. Easier borrowing conditions can also increase activity across risk markets—but they can amplify volatility as well.
Why cuts are not automatically positive
The reason for the cut matters:
Preventive cuts: If inflation is easing and growth remains stable, markets may interpret cuts as a gradual easing of financial conditions. That can improve risk appetite.
Crisis-response cuts: If the Fed cuts because recession risks, credit stress, or financial instability are rising, investors may initially prioritize safety. Bitcoin can be volatile or decline alongside equities despite lower rates.
Already priced in: If markets had widely expected a cut, BTC may react more to the Fed’s outlook—future cuts, inflation concerns, and growth projections—than to the cut itself.
Pay attention to the Fed statement, economic projections, the Chair’s press conference, U.S. Treasury yields, and the dollar. A cut paired with cautious language about persistent inflation may produce a different reaction than a cut paired with clear signals of further easing.
The latest confirmed Fed decision was a hold at 3.50%–3.75% on 2026-07-29; the Federal Reserve’s calendar shows the next scheduled FOMC decision is 2026-09-16. So, at this point, any September cut is still a scenario rather than a confirmed event.
How the transmission works
Rate cuts → lower yields and potentially softer U.S. dollar → more favorable liquidity and risk sentiment → possible support for Bitcoin demand.
When yields decline, the opportunity cost of holding a non-yielding asset such as BTC can fall. If the dollar also weakens, USD-priced assets may become relatively more accessible to buyers using other currencies. Easier borrowing conditions can also increase activity across risk markets—but they can amplify volatility as well.
Why cuts are not automatically positive
The reason for the cut matters:
Preventive cuts: If inflation is easing and growth remains stable, markets may interpret cuts as a gradual easing of financial conditions. That can improve risk appetite.
Crisis-response cuts: If the Fed cuts because recession risks, credit stress, or financial instability are rising, investors may initially prioritize safety. Bitcoin can be volatile or decline alongside equities despite lower rates.
Already priced in: If markets had widely expected a cut, BTC may react more to the Fed’s outlook—future cuts, inflation concerns, and growth projections—than to the cut itself.
Pay attention to the Fed statement, economic projections, the Chair’s press conference, U.S. Treasury yields, and the dollar. A cut paired with cautious language about persistent inflation may produce a different reaction than a cut paired with clear signals of further easing.
1
80
A stronger#U.S. dollar often puts pressure on crypto because it changes the relative appeal of holding dollars versus riskier assets.
Cash and U.S. bonds may look more attractive: A strong dollar often comes with higher U.S. interest rates or higher Treasury yields. Investors may prefer dollar cash or bonds rather than volatile assets such as #Bitcoin.
Liquidity can tighten: Dollar strength can reflect tighter global financial conditions. Less available liquidity and more expensive borrowing can reduce speculative demand in crypto.
Risk appetite may weaken: Bitcoin and many #altcoins are frequently treated as risk-sensitive assets. When investors become defensive, they may reduce exposure to crypto, equities, and other volatile markets.
Global buyers face a higher local-currency cost: Since crypto is commonly quoted in USD or USDT, a stronger dollar means buyers using PKR, EUR, JPY, or other currencies need more of their local currency for the same BTC price.
Leverage becomes costlier: Higher U.S. rates can raise financing costs across markets, potentially causing leveraged traders to reduce positions—often increasing short-term volatility.
The relationship is not automatic. Bitcoin can rise while the dollar is strong if crypto-specific factors dominate, such as ETF flows, institutional demand, regulatory developments, or changes in supply-demand dynamics. It is better viewed as a macro headwind or tailwind, not a fixed rule.
{spot}(BTCUSDT)
A stronger#U.S. dollar often puts pressure on crypto because it changes the relative appeal of holding dollars versus riskier assets.
Cash and U.S. bonds may look more attractive: A strong dollar often comes with higher U.S. interest rates or higher Treasury yields. Investors may prefer dollar cash or bonds rather than volatile assets such as #Bitcoin.
Liquidity can tighten: Dollar strength can reflect tighter global financial conditions. Less available liquidity and more expensive borrowing can reduce speculative demand in crypto.
Risk appetite may weaken: Bitcoin and many #altcoins are frequently treated as risk-sensitive assets. When investors become defensive, they may reduce exposure to crypto, equities, and other volatile markets.
Global buyers face a higher local-currency cost: Since crypto is commonly quoted in USD or USDT, a stronger dollar means buyers using PKR, EUR, JPY, or other currencies need more of their local currency for the same BTC price.
Leverage becomes costlier: Higher U.S. rates can raise financing costs across markets, potentially causing leveraged traders to reduce positions—often increasing short-term volatility.
The relationship is not automatic. Bitcoin can rise while the dollar is strong if crypto-specific factors dominate, such as ETF flows, institutional demand, regulatory developments, or changes in supply-demand dynamics. It is better viewed as a macro headwind or tailwind, not a fixed rule.
Cash and U.S. bonds may look more attractive: A strong dollar often comes with higher U.S. interest rates or higher Treasury yields. Investors may prefer dollar cash or bonds rather than volatile assets such as #Bitcoin.
Liquidity can tighten: Dollar strength can reflect tighter global financial conditions. Less available liquidity and more expensive borrowing can reduce speculative demand in crypto.
Risk appetite may weaken: Bitcoin and many #altcoins are frequently treated as risk-sensitive assets. When investors become defensive, they may reduce exposure to crypto, equities, and other volatile markets.
Global buyers face a higher local-currency cost: Since crypto is commonly quoted in USD or USDT, a stronger dollar means buyers using PKR, EUR, JPY, or other currencies need more of their local currency for the same BTC price.
Leverage becomes costlier: Higher U.S. rates can raise financing costs across markets, potentially causing leveraged traders to reduce positions—often increasing short-term volatility.
The relationship is not automatic. Bitcoin can rise while the dollar is strong if crypto-specific factors dominate, such as ETF flows, institutional demand, regulatory developments, or changes in supply-demand dynamics. It is better viewed as a macro headwind or tailwind, not a fixed rule.
7
Hawkish fed and Dovish fed
A hawkish Fed is focused mainly on controlling inflation. It may raise interest rates, keep them high for longer, or #Bitcoin signal that it will not ease policy soon. Higher rates can strengthen the U.S. dollar and make lower-risk assets such as cash and government bonds relatively more attractive, which can reduce appetite for volatile assets like #Bitcoin and altcoins.
A dovish Fed is more focused on supporting economic growth and employment. It may favor holding rates steady, cutting them, or signaling that policy could become less restrictive. That can improve liquidity expectations and risk sentiment, which may be supportive for crypto—though it does not guarantee prices will rise.
Hypothetical example: If the Fed holds rates unchanged but says inflation remains a serious concern and further hikes are possible, markets may read that as hawkish. If it instead says inflation is easing and future cuts are being considered, markets may read that as dovish.
matters most is the gap between the Fed’s message and what markets already expected. A rate hike that was fully priced in may have a smaller effect than unexpectedly hawkish comments from the Fed Chair.
{spot}(BTCUSDT)
Hawkish fed and Dovish fed
A hawkish Fed is focused mainly on controlling inflation. It may raise interest rates, keep them high for longer, or #Bitcoin signal that it will not ease policy soon. Higher rates can strengthen the U.S. dollar and make lower-risk assets such as cash and government bonds relatively more attractive, which can reduce appetite for volatile assets like #Bitcoin and altcoins.
A dovish Fed is more focused on supporting economic growth and employment. It may favor holding rates steady, cutting them, or signaling that policy could become less restrictive. That can improve liquidity expectations and risk sentiment, which may be supportive for crypto—though it does not guarantee prices will rise.
Hypothetical example: If the Fed holds rates unchanged but says inflation remains a serious concern and further hikes are possible, markets may read that as hawkish. If it instead says inflation is easing and future cuts are being considered, markets may read that as dovish.
matters most is the gap between the Fed’s message and what markets already expected. A rate hike that was fully priced in may have a smaller effect than unexpectedly hawkish comments from the Fed Chair.
A hawkish Fed is focused mainly on controlling inflation. It may raise interest rates, keep them high for longer, or #Bitcoin signal that it will not ease policy soon. Higher rates can strengthen the U.S. dollar and make lower-risk assets such as cash and government bonds relatively more attractive, which can reduce appetite for volatile assets like #Bitcoin and altcoins.
A dovish Fed is more focused on supporting economic growth and employment. It may favor holding rates steady, cutting them, or signaling that policy could become less restrictive. That can improve liquidity expectations and risk sentiment, which may be supportive for crypto—though it does not guarantee prices will rise.
Hypothetical example: If the Fed holds rates unchanged but says inflation remains a serious concern and further hikes are possible, markets may read that as hawkish. If it instead says inflation is easing and future cuts are being considered, markets may read that as dovish.
matters most is the gap between the Fed’s message and what markets already expected. A rate hike that was fully priced in may have a smaller effect than unexpectedly hawkish comments from the Fed Chair.
14
A Fed rate hike generally means the Federal Reserve is making borrowing more expensive to restrain inflation. The latest confirmed Fed decision before this meeting was on 2026-07-29, when it held the federal-funds target range at 3.50%–3.75%. The key implication for #Bitcoin is usually tighter liquidity and less appetite for higher-volatility assets—but the actual reaction depends heavily on expectations and the Fed’s forward guidance.
A hike can pressure Bitcoin
A higher policy rate can lift short-term yields and support the U.S. dollar. That makes cash and government securities relatively more attractive, while borrowing and leverage become more expensive. Since #Bitcoin is often traded as a higher-risk, liquidity-sensitive asset, this environment can lead some investors to reduce risk exposure.
The common transmission chain is:
rate hike → higher yields / firmer dollar / tighter liquidity → reduced risk appetite → potential pressure on BTC and especially altcoins
Why Bitcoin may not fall after every hike
Markets often price in expected decisions before the announcement. If investors already expect a 25-basis-point hike, Bitcoin may move more on the Fed’s wording than on the hike itself:
Hike plus signals of further tightening: risk sentiment may weaken further.
Hike but suggests policy may be near a peak: the initial reaction can be mixed or reverse.
No hike when markets expected one: risk appetite may improve, though that is not guaranteed.
Inflation or growth concerns dominate: BTC can react differently from equities, so the relationship is not fixed.
What to watch around a Fed decision
Focus on the policy statement, Chair Powell’s press conference, inflation language, projected rate path, U.S. Treasury yields, and the dollar index. These can reveal whether financial conditions are likely to become tighter or easier after the meeting.
{spot}(BTCUSDT)
A Fed rate hike generally means the Federal Reserve is making borrowing more expensive to restrain inflation. The latest confirmed Fed decision before this meeting was on 2026-07-29, when it held the federal-funds target range at 3.50%–3.75%. The key implication for #Bitcoin is usually tighter liquidity and less appetite for higher-volatility assets—but the actual reaction depends heavily on expectations and the Fed’s forward guidance.
A hike can pressure Bitcoin
A higher policy rate can lift short-term yields and support the U.S. dollar. That makes cash and government securities relatively more attractive, while borrowing and leverage become more expensive. Since #Bitcoin is often traded as a higher-risk, liquidity-sensitive asset, this environment can lead some investors to reduce risk exposure.
The common transmission chain is:
rate hike → higher yields / firmer dollar / tighter liquidity → reduced risk appetite → potential pressure on BTC and especially altcoins
Why Bitcoin may not fall after every hike
Markets often price in expected decisions before the announcement. If investors already expect a 25-basis-point hike, Bitcoin may move more on the Fed’s wording than on the hike itself:
Hike plus signals of further tightening: risk sentiment may weaken further.
Hike but suggests policy may be near a peak: the initial reaction can be mixed or reverse.
No hike when markets expected one: risk appetite may improve, though that is not guaranteed.
Inflation or growth concerns dominate: BTC can react differently from equities, so the relationship is not fixed.
What to watch around a Fed decision
Focus on the policy statement, Chair Powell’s press conference, inflation language, projected rate path, U.S. Treasury yields, and the dollar index. These can reveal whether financial conditions are likely to become tighter or easier after the meeting.
A hike can pressure Bitcoin
A higher policy rate can lift short-term yields and support the U.S. dollar. That makes cash and government securities relatively more attractive, while borrowing and leverage become more expensive. Since #Bitcoin is often traded as a higher-risk, liquidity-sensitive asset, this environment can lead some investors to reduce risk exposure.
The common transmission chain is:
rate hike → higher yields / firmer dollar / tighter liquidity → reduced risk appetite → potential pressure on BTC and especially altcoins
Why Bitcoin may not fall after every hike
Markets often price in expected decisions before the announcement. If investors already expect a 25-basis-point hike, Bitcoin may move more on the Fed’s wording than on the hike itself:
Hike plus signals of further tightening: risk sentiment may weaken further.
Hike but suggests policy may be near a peak: the initial reaction can be mixed or reverse.
No hike when markets expected one: risk appetite may improve, though that is not guaranteed.
Inflation or growth concerns dominate: BTC can react differently from equities, so the relationship is not fixed.
What to watch around a Fed decision
Focus on the policy statement, Chair Powell’s press conference, inflation language, projected rate path, U.S. Treasury yields, and the dollar index. These can reveal whether financial conditions are likely to become tighter or easier after the meeting.
30
Fed news can strongly affect crypto, especially #BTC and major altcoins.
The key mechanism is: higher rates / tighter policy → stronger dollar, higher yields on safer assets, and less liquidity for risk assets. That can weigh on crypto sentiment. Conversely, a less restrictive policy tone can improve risk appetite and liquidity expectations, which may support crypto demand.
For the current September 15–16, 2026 FOMC meeting, the important factor is not only whether rates change, but whether the Fed signals more tightening ahead or sounds more confident about inflation easing. Public reporting shows markets have been split on the chance of a rate increase, so a surprise versus expectations may matter more than the decision itself. (tapbit.com)
Typical market scenarios
More hawkish than expected: crypto may face short-term pressure, particularly higher-beta altcoins, as yields and the dollar can rise.
Hold rates but hawkish guidance: crypto can still react negatively if future tightening is emphasized.
Less hawkish than expected: risk sentiment may improve, though this does not guarantee a sustained rally.
Decision already priced in: the initial move can be limited or even reverse after the press conference as traders reassess the Fed’s wording.
The press conference and updated economic projections are often as important as the rate decision itself. Watch the Fed’s comments on inflation, employment, future rate-path expectations, the dollar, Treasury yields, and whether BTC moves alongside—or against—U.S. equities.
#BTC at $78,589.78, up +1.9% over the prior 24 hours, indicating crypto was already responding to broader policy and regulatory expectations before the Fed outcome. This is a prior-day snapshot, not a live quote.
{spot}(BTCUSDT)
Fed news can strongly affect crypto, especially #BTC and major altcoins.
The key mechanism is: higher rates / tighter policy → stronger dollar, higher yields on safer assets, and less liquidity for risk assets. That can weigh on crypto sentiment. Conversely, a less restrictive policy tone can improve risk appetite and liquidity expectations, which may support crypto demand.
For the current September 15–16, 2026 FOMC meeting, the important factor is not only whether rates change, but whether the Fed signals more tightening ahead or sounds more confident about inflation easing. Public reporting shows markets have been split on the chance of a rate increase, so a surprise versus expectations may matter more than the decision itself. (tapbit.com)
Typical market scenarios
More hawkish than expected: crypto may face short-term pressure, particularly higher-beta altcoins, as yields and the dollar can rise.
Hold rates but hawkish guidance: crypto can still react negatively if future tightening is emphasized.
Less hawkish than expected: risk sentiment may improve, though this does not guarantee a sustained rally.
Decision already priced in: the initial move can be limited or even reverse after the press conference as traders reassess the Fed’s wording.
The press conference and updated economic projections are often as important as the rate decision itself. Watch the Fed’s comments on inflation, employment, future rate-path expectations, the dollar, Treasury yields, and whether BTC moves alongside—or against—U.S. equities.
#BTC at $78,589.78, up +1.9% over the prior 24 hours, indicating crypto was already responding to broader policy and regulatory expectations before the Fed outcome. This is a prior-day snapshot, not a live quote.
The key mechanism is: higher rates / tighter policy → stronger dollar, higher yields on safer assets, and less liquidity for risk assets. That can weigh on crypto sentiment. Conversely, a less restrictive policy tone can improve risk appetite and liquidity expectations, which may support crypto demand.
For the current September 15–16, 2026 FOMC meeting, the important factor is not only whether rates change, but whether the Fed signals more tightening ahead or sounds more confident about inflation easing. Public reporting shows markets have been split on the chance of a rate increase, so a surprise versus expectations may matter more than the decision itself. (tapbit.com)
Typical market scenarios
More hawkish than expected: crypto may face short-term pressure, particularly higher-beta altcoins, as yields and the dollar can rise.
Hold rates but hawkish guidance: crypto can still react negatively if future tightening is emphasized.
Less hawkish than expected: risk sentiment may improve, though this does not guarantee a sustained rally.
Decision already priced in: the initial move can be limited or even reverse after the press conference as traders reassess the Fed’s wording.
The press conference and updated economic projections are often as important as the rate decision itself. Watch the Fed’s comments on inflation, employment, future rate-path expectations, the dollar, Treasury yields, and whether BTC moves alongside—or against—U.S. equities.
#BTC at $78,589.78, up +1.9% over the prior 24 hours, indicating crypto was already responding to broader policy and regulatory expectations before the Fed outcome. This is a prior-day snapshot, not a live quote.
26
#BTC/USDT is around $77,454, down -0.10% over the past 24 hours. It reached $79,600 at the session high and fell to $77,300, so the current price is sitting close to the day’s lower end. Binance spot volume is about 14.1K BTC ($1.10B) over 24 hours.
Macro-event caution is the clearest current narrative. Markets are focused on the U.S. Federal Reserve decision scheduled for Senate procedural vote on crypto legislation expected today. These events can quickly shift rate expectations, the dollar, and broader risk appetite—factors that often affect BTC alongside equities. This is a market narrative, not a confirmed single-cause explanation. (coinstats.app)
Recent spot-Bitcoin ETF outflows have weakened the demand backdrop. Multiple market reports point to roughly $462.7M of net U.S. spot-Bitcoin ETF outflows during 2026-09-08 to 2026-09-11, ending a prior inflow streak. That does not prove ETFs caused today’s small decline, but it is consistent with more cautious institutional flows. (coinstats.app)
This is a modest pullback rather than a one-way market move. #BTC is only -0.10% lower on Binance over 24 hours, but the roughly $2,300 gap between today’s high and low shows elevated intraday volatility. There is no clear, verified BTC-specific breaking headline explaining the entire move; it currently looks more like macro-sensitive positioning and profit-taking near $79.6K.
A sustained recovery away from the $77.3K intraday low would suggest the dip is being absorbed; continued trading near that low would show sellers remain active.
{spot}(BTCUSDT)
#BTC/USDT is around $77,454, down -0.10% over the past 24 hours. It reached $79,600 at the session high and fell to $77,300, so the current price is sitting close to the day’s lower end. Binance spot volume is about 14.1K BTC ($1.10B) over 24 hours.
Macro-event caution is the clearest current narrative. Markets are focused on the U.S. Federal Reserve decision scheduled for Senate procedural vote on crypto legislation expected today. These events can quickly shift rate expectations, the dollar, and broader risk appetite—factors that often affect BTC alongside equities. This is a market narrative, not a confirmed single-cause explanation. (coinstats.app)
Recent spot-Bitcoin ETF outflows have weakened the demand backdrop. Multiple market reports point to roughly $462.7M of net U.S. spot-Bitcoin ETF outflows during 2026-09-08 to 2026-09-11, ending a prior inflow streak. That does not prove ETFs caused today’s small decline, but it is consistent with more cautious institutional flows. (coinstats.app)
This is a modest pullback rather than a one-way market move. #BTC is only -0.10% lower on Binance over 24 hours, but the roughly $2,300 gap between today’s high and low shows elevated intraday volatility. There is no clear, verified BTC-specific breaking headline explaining the entire move; it currently looks more like macro-sensitive positioning and profit-taking near $79.6K.
A sustained recovery away from the $77.3K intraday low would suggest the dip is being absorbed; continued trading near that low would show sellers remain active.
Macro-event caution is the clearest current narrative. Markets are focused on the U.S. Federal Reserve decision scheduled for Senate procedural vote on crypto legislation expected today. These events can quickly shift rate expectations, the dollar, and broader risk appetite—factors that often affect BTC alongside equities. This is a market narrative, not a confirmed single-cause explanation. (coinstats.app)
Recent spot-Bitcoin ETF outflows have weakened the demand backdrop. Multiple market reports point to roughly $462.7M of net U.S. spot-Bitcoin ETF outflows during 2026-09-08 to 2026-09-11, ending a prior inflow streak. That does not prove ETFs caused today’s small decline, but it is consistent with more cautious institutional flows. (coinstats.app)
This is a modest pullback rather than a one-way market move. #BTC is only -0.10% lower on Binance over 24 hours, but the roughly $2,300 gap between today’s high and low shows elevated intraday volatility. There is no clear, verified BTC-specific breaking headline explaining the entire move; it currently looks more like macro-sensitive positioning and profit-taking near $79.6K.
A sustained recovery away from the $77.3K intraday low would suggest the dip is being absorbed; continued trading near that low would show sellers remain active.
57
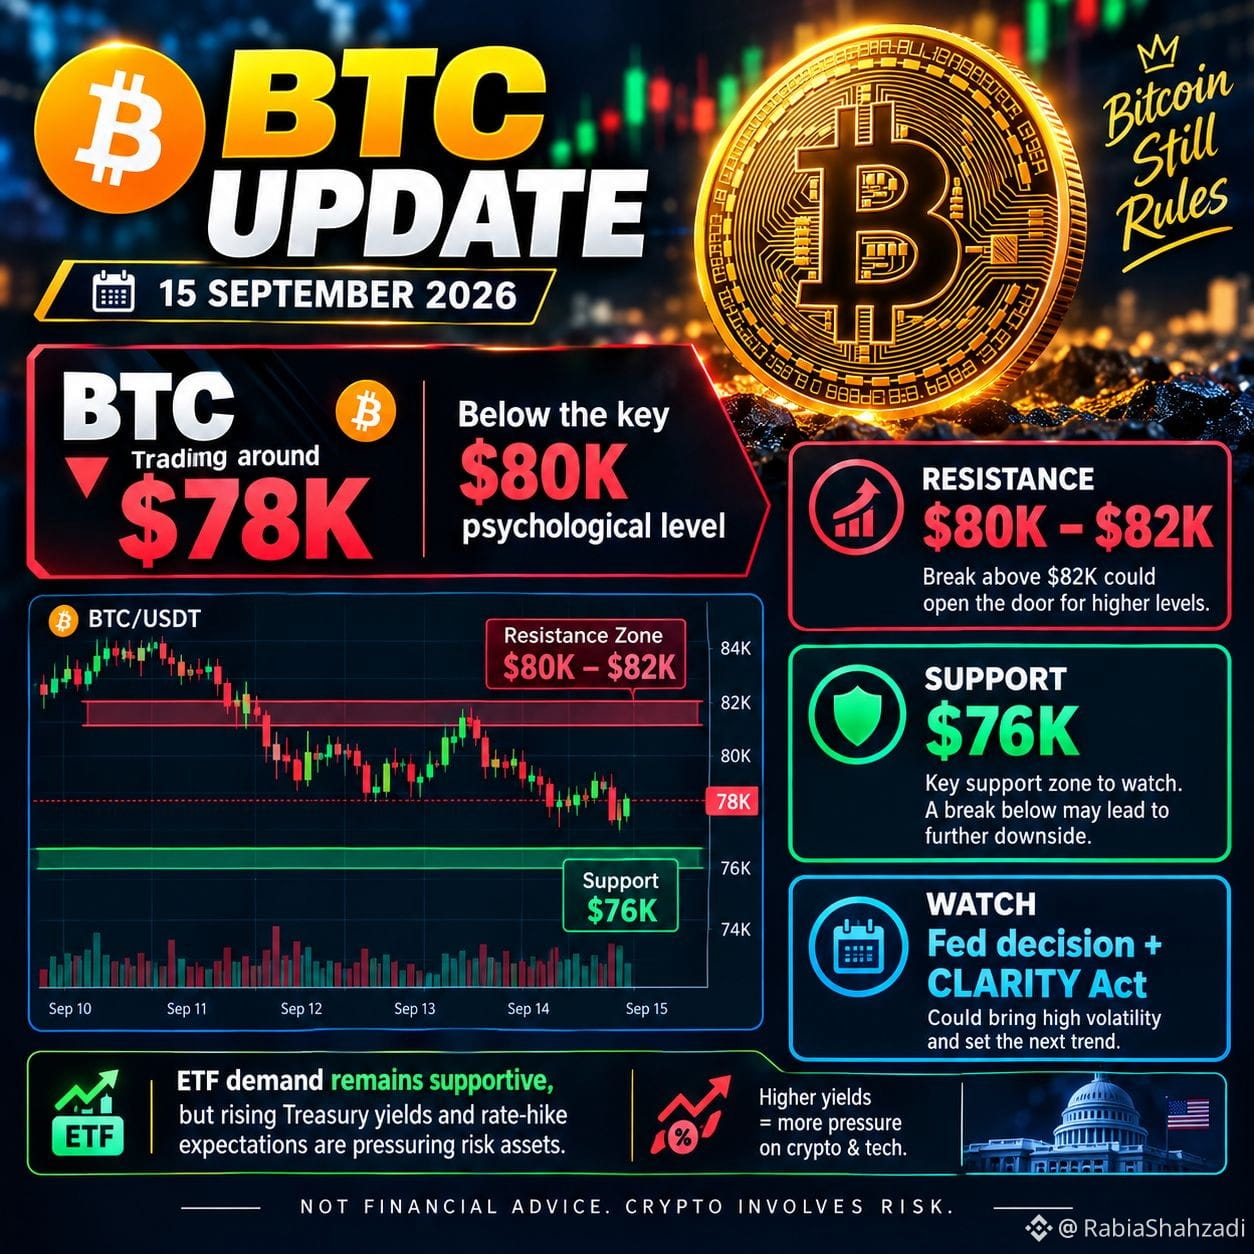
#BTC around $78K
Resistance: $80K–$82K
Support: around $76K
Bullish trigger: break and hold above $82K
Risk: rising Treasury yields and Fed-rate expectations are pressuring crypto.
ETF demand: recent U.S. spot BTC ETF flows have provided institutional support, although flows can reverse quickly.
Big catalyst: today’s CLARITY Act Senate vote and this week’s Fed decision could create high volatility.
BTC is currently below $80K, so $80K–$82K is the key breakout zone. A clean break above it would improve the bullish setup; losing $76K would weaken it.
{spot}(BTCUSDT)
#BTC around $78K
Resistance: $80K–$82K
Support: around $76K
Bullish trigger: break and hold above $82K
Risk: rising Treasury yields and Fed-rate expectations are pressuring crypto.
ETF demand: recent U.S. spot BTC ETF flows have provided institutional support, although flows can reverse quickly.
Big catalyst: today’s CLARITY Act Senate vote and this week’s Fed decision could create high volatility.
BTC is currently below $80K, so $80K–$82K is the key breakout zone. A clean break above it would improve the bullish setup; losing $76K would weaken it.
Resistance: $80K–$82K
Support: around $76K
Bullish trigger: break and hold above $82K
Risk: rising Treasury yields and Fed-rate expectations are pressuring crypto.
ETF demand: recent U.S. spot BTC ETF flows have provided institutional support, although flows can reverse quickly.
Big catalyst: today’s CLARITY Act Senate vote and this week’s Fed decision could create high volatility.
BTC is currently below $80K, so $80K–$82K is the key breakout zone. A clean break above it would improve the bullish setup; losing $76K would weaken it.
68
#BTC ETF Flow Update — Sept 11, 2026
U.S. spot #Bitcoin ETFs did not have an outflow on Sept. 11; they recorded a small +$3.8M net inflow.
However, the previous three sessions were strongly negative:
Sept 8: −$46.6M
Sept 9: −$120.2M
Sept 10: −$282.7M
3-day total: about −$449.5M
ETF selling pressure appears to have paused on Sept. 11, but the recent 3-day outflow streak was significant.
{spot}(BTCUSDT)
#BTC ETF Flow Update — Sept 11, 2026
U.S. spot #Bitcoin ETFs did not have an outflow on Sept. 11; they recorded a small +$3.8M net inflow.
However, the previous three sessions were strongly negative:
Sept 8: −$46.6M
Sept 9: −$120.2M
Sept 10: −$282.7M
3-day total: about −$449.5M
ETF selling pressure appears to have paused on Sept. 11, but the recent 3-day outflow streak was significant.
U.S. spot #Bitcoin ETFs did not have an outflow on Sept. 11; they recorded a small +$3.8M net inflow.
However, the previous three sessions were strongly negative:
Sept 8: −$46.6M
Sept 9: −$120.2M
Sept 10: −$282.7M
3-day total: about −$449.5M
ETF selling pressure appears to have paused on Sept. 11, but the recent 3-day outflow streak was significant.
54
#BTC is moving in a wide but nearly flat range today rather than making a decisive directional move.
Most likely driver: macro and rate expectations. Bitcoin has been trading alongside broader risk assets as markets reassess inflation data and the likely path of U.S. interest rates. Reports today point to elevated Treasury yields and concerns that persistent inflation could keep financial conditions tighter, which can reduce appetite for higher-volatility assets such as crypto.
There does not appear to be one dominant #BTC -specific headline. The small net move, despite a roughly $3.8K intraday range, is more consistent with two-way trading and position adjustment than with a single fundamental catalyst. Market commentary also describes cooling ETF demand and softer derivatives positioning as factors limiting upside follow-through.
watch whether BTC can sustain trading above the day’s upper range with stronger volume, versus whether renewed macro pressure pushes it back toward the day’s lower range. ETF flow data, bond yields, and futures positioning are especially relevant in the current setup.
{spot}(BTCUSDT)
#BTC is moving in a wide but nearly flat range today rather than making a decisive directional move.
Most likely driver: macro and rate expectations. Bitcoin has been trading alongside broader risk assets as markets reassess inflation data and the likely path of U.S. interest rates. Reports today point to elevated Treasury yields and concerns that persistent inflation could keep financial conditions tighter, which can reduce appetite for higher-volatility assets such as crypto.
There does not appear to be one dominant #BTC -specific headline. The small net move, despite a roughly $3.8K intraday range, is more consistent with two-way trading and position adjustment than with a single fundamental catalyst. Market commentary also describes cooling ETF demand and softer derivatives positioning as factors limiting upside follow-through.
watch whether BTC can sustain trading above the day’s upper range with stronger volume, versus whether renewed macro pressure pushes it back toward the day’s lower range. ETF flow data, bond yields, and futures positioning are especially relevant in the current setup.
Most likely driver: macro and rate expectations. Bitcoin has been trading alongside broader risk assets as markets reassess inflation data and the likely path of U.S. interest rates. Reports today point to elevated Treasury yields and concerns that persistent inflation could keep financial conditions tighter, which can reduce appetite for higher-volatility assets such as crypto.
There does not appear to be one dominant #BTC -specific headline. The small net move, despite a roughly $3.8K intraday range, is more consistent with two-way trading and position adjustment than with a single fundamental catalyst. Market commentary also describes cooling ETF demand and softer derivatives positioning as factors limiting upside follow-through.
watch whether BTC can sustain trading above the day’s upper range with stronger volume, versus whether renewed macro pressure pushes it back toward the day’s lower range. ETF flow data, bond yields, and futures positioning are especially relevant in the current setup.
61
#ETH currently shows stronger relative momentum than BTC, though both have short-term bearish MACD signals.
| Current price | $78,331 | $2,478 |
| 24h change | -0.98% | -0.46% |
| 7d change | -0.32% | +0.45% |
| 30d change | +20.58% | +29.30% |
| RSI(6) | 46.99 — neutral, weakening | 54.99 — neutral, firmer |
| MACD | Bearish; death cross 4 days ago | Bearish; death cross 7 days ago |
| MA structure | Bullish alignment | Bullish alignment |
| SuperTrend | Up | Up |
| Today’s volume vs. 7d avg | 1.12× | 0.62× |
| Large-order flow | Net outflow: -20.42% | Net outflow: -7.01% |
#ETH is outperforming on relative strength: it has a smaller 24-hour loss, a positive 7-day return, and stronger 30-day momentum.
#BTC has more immediate selling pressure: its RSI is lower, its MACD bearish momentum is more pronounced, and large-order outflows are heavier.
ETH’s advance has less participation today: volume is below its 7-day average, so its resilience is not yet backed by unusually strong current trading activity.
Both still retain a broader bullish daily structure: prices remain above the 25-day and 99-day moving averages, and SuperTrend remains upward. That means the near-term pullback has not, by itself, invalidated the broader uptrend.
In short: ETH leads in relative momentum; BTC is seeing stronger short-term defensive pressure. Both markets remain sensitive to whether current outflows persist or reverse.
{spot}(ETHUSDT)
{spot}(BTCUSDT)
#ETH currently shows stronger relative momentum than BTC, though both have short-term bearish MACD signals.
| Current price | $78,331 | $2,478 |
| 24h change | -0.98% | -0.46% |
| 7d change | -0.32% | +0.45% |
| 30d change | +20.58% | +29.30% |
| RSI(6) | 46.99 — neutral, weakening | 54.99 — neutral, firmer |
| MACD | Bearish; death cross 4 days ago | Bearish; death cross 7 days ago |
| MA structure | Bullish alignment | Bullish alignment |
| SuperTrend | Up | Up |
| Today’s volume vs. 7d avg | 1.12× | 0.62× |
| Large-order flow | Net outflow: -20.42% | Net outflow: -7.01% |
#ETH is outperforming on relative strength: it has a smaller 24-hour loss, a positive 7-day return, and stronger 30-day momentum.
#BTC has more immediate selling pressure: its RSI is lower, its MACD bearish momentum is more pronounced, and large-order outflows are heavier.
ETH’s advance has less participation today: volume is below its 7-day average, so its resilience is not yet backed by unusually strong current trading activity.
Both still retain a broader bullish daily structure: prices remain above the 25-day and 99-day moving averages, and SuperTrend remains upward. That means the near-term pullback has not, by itself, invalidated the broader uptrend.
In short: ETH leads in relative momentum; BTC is seeing stronger short-term defensive pressure. Both markets remain sensitive to whether current outflows persist or reverse.
| Current price | $78,331 | $2,478 |
| 24h change | -0.98% | -0.46% |
| 7d change | -0.32% | +0.45% |
| 30d change | +20.58% | +29.30% |
| RSI(6) | 46.99 — neutral, weakening | 54.99 — neutral, firmer |
| MACD | Bearish; death cross 4 days ago | Bearish; death cross 7 days ago |
| MA structure | Bullish alignment | Bullish alignment |
| SuperTrend | Up | Up |
| Today’s volume vs. 7d avg | 1.12× | 0.62× |
| Large-order flow | Net outflow: -20.42% | Net outflow: -7.01% |
#ETH is outperforming on relative strength: it has a smaller 24-hour loss, a positive 7-day return, and stronger 30-day momentum.
#BTC has more immediate selling pressure: its RSI is lower, its MACD bearish momentum is more pronounced, and large-order outflows are heavier.
ETH’s advance has less participation today: volume is below its 7-day average, so its resilience is not yet backed by unusually strong current trading activity.
Both still retain a broader bullish daily structure: prices remain above the 25-day and 99-day moving averages, and SuperTrend remains upward. That means the near-term pullback has not, by itself, invalidated the broader uptrend.
In short: ETH leads in relative momentum; BTC is seeing stronger short-term defensive pressure. Both markets remain sensitive to whether current outflows persist or reverse.
15
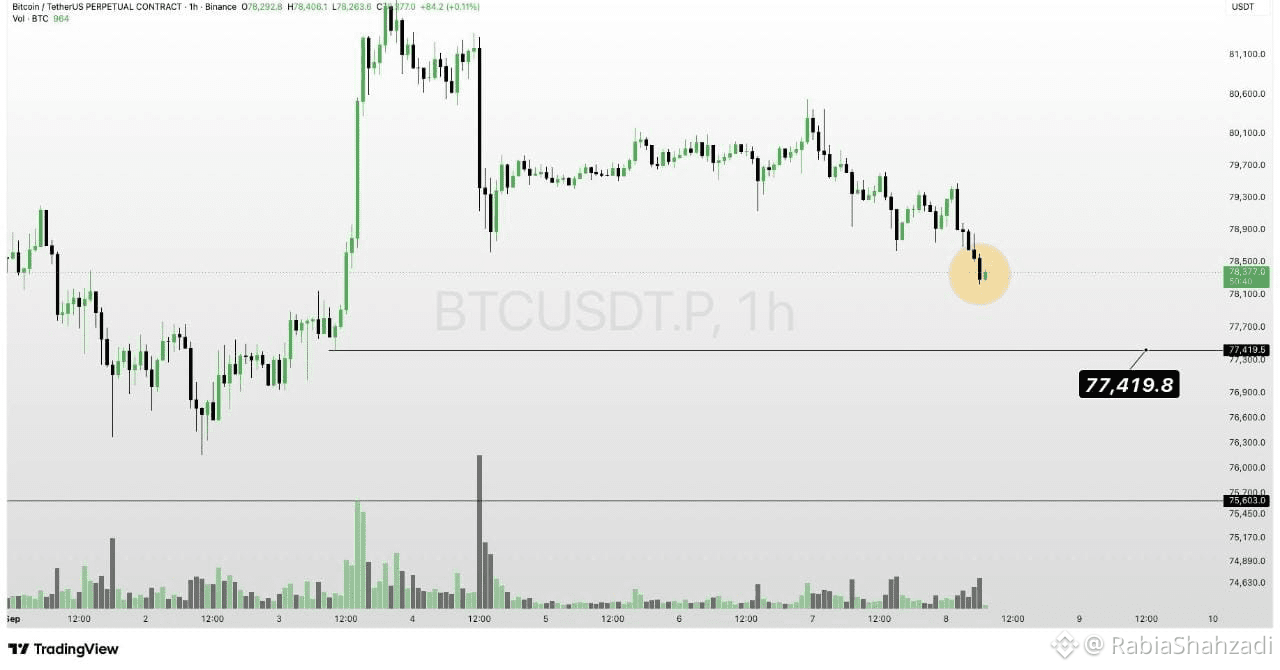
#BTC next move looks mixed, with short-term downside pressure but a still-positive broader daily trend.
Current price: $78,385, down 0.91% today
Momentum: RSI(6) is 47.38 — neutral, but weakening from 53.34
MACD: bearish; the death cross occurred 4 daily candles ago, and bearish momentum is increasing
Trend structure: price remains above the 25-day and 99-day moving averages, while SuperTrend is still up — the broader daily structure has not fully broken down
Flow: large-order net flow is negative today, indicating selling pressure
Volume: 1.12× the 7-day average, so today’s pullback has meaningful participation
If BTC reclaims and holds above the short-term average around $79.4K, momentum may stabilize. If selling continues below today’s low near $77.6K, the market could test the recent 7-day low area around $76.3K. On the upside, the recent range high near $82.3K remains an important area where sellers previously appeared.
#BitcoinETFsStill$1BShortIn2026
{spot}(BTCUSDT)
#BTC next move looks mixed, with short-term downside pressure but a still-positive broader daily trend.
Current price: $78,385, down 0.91% today
Momentum: RSI(6) is 47.38 — neutral, but weakening from 53.34
MACD: bearish; the death cross occurred 4 daily candles ago, and bearish momentum is increasing
Trend structure: price remains above the 25-day and 99-day moving averages, while SuperTrend is still up — the broader daily structure has not fully broken down
Flow: large-order net flow is negative today, indicating selling pressure
Volume: 1.12× the 7-day average, so today’s pullback has meaningful participation
If BTC reclaims and holds above the short-term average around $79.4K, momentum may stabilize. If selling continues below today’s low near $77.6K, the market could test the recent 7-day low area around $76.3K. On the upside, the recent range high near $82.3K remains an important area where sellers previously appeared.
#BitcoinETFsStill$1BShortIn2026
Current price: $78,385, down 0.91% today
Momentum: RSI(6) is 47.38 — neutral, but weakening from 53.34
MACD: bearish; the death cross occurred 4 daily candles ago, and bearish momentum is increasing
Trend structure: price remains above the 25-day and 99-day moving averages, while SuperTrend is still up — the broader daily structure has not fully broken down
Flow: large-order net flow is negative today, indicating selling pressure
Volume: 1.12× the 7-day average, so today’s pullback has meaningful participation
If BTC reclaims and holds above the short-term average around $79.4K, momentum may stabilize. If selling continues below today’s low near $77.6K, the market could test the recent 7-day low area around $76.3K. On the upside, the recent range high near $82.3K remains an important area where sellers previously appeared.
#BitcoinETFsStill$1BShortIn2026
10
7
#ATOM is showing a short-term upward move, but it is also becoming stretched.
#ATOM is at $1.672, up +2.96% versus the 24h open of $1.624; the 24h range is $1.605–$1.698. As of 2026-09-08, it is about -1.76% below its 7-day high of $1.70.
Daily RSI(6) is 81.64, which is in the overbought zone. That supports strong momentum but also raises the chance of sharp pullbacks or consolidation.
Trend signals: MACD recorded a golden cross two daily candles ago; SuperTrend remains up at $1.43. ATOM is above MA(7) at $1.56 and MA(25) at $1.52, while MA(99) is also $1.56.
Participation: ATOM is up +13.74% over 7 days and +20.46% over 30 days. However, current volume is only 0.50× the 7-day average, so a further push would be more convincing with stronger volume. Large-order flow over the last day is a modest net inflow of 3.16K ATOM.
In short: the trend indicators currently support the upswing, while the high RSI and lighter volume mean the next move could be either a continuation if demand strengthens, or a cooldown after the recent run.
{spot}(ATOMUSDT)
#ATOM is showing a short-term upward move, but it is also becoming stretched.
#ATOM is at $1.672, up +2.96% versus the 24h open of $1.624; the 24h range is $1.605–$1.698. As of 2026-09-08, it is about -1.76% below its 7-day high of $1.70.
Daily RSI(6) is 81.64, which is in the overbought zone. That supports strong momentum but also raises the chance of sharp pullbacks or consolidation.
Trend signals: MACD recorded a golden cross two daily candles ago; SuperTrend remains up at $1.43. ATOM is above MA(7) at $1.56 and MA(25) at $1.52, while MA(99) is also $1.56.
Participation: ATOM is up +13.74% over 7 days and +20.46% over 30 days. However, current volume is only 0.50× the 7-day average, so a further push would be more convincing with stronger volume. Large-order flow over the last day is a modest net inflow of 3.16K ATOM.
In short: the trend indicators currently support the upswing, while the high RSI and lighter volume mean the next move could be either a continuation if demand strengthens, or a cooldown after the recent run.
#ATOM is at $1.672, up +2.96% versus the 24h open of $1.624; the 24h range is $1.605–$1.698. As of 2026-09-08, it is about -1.76% below its 7-day high of $1.70.
Daily RSI(6) is 81.64, which is in the overbought zone. That supports strong momentum but also raises the chance of sharp pullbacks or consolidation.
Trend signals: MACD recorded a golden cross two daily candles ago; SuperTrend remains up at $1.43. ATOM is above MA(7) at $1.56 and MA(25) at $1.52, while MA(99) is also $1.56.
Participation: ATOM is up +13.74% over 7 days and +20.46% over 30 days. However, current volume is only 0.50× the 7-day average, so a further push would be more convincing with stronger volume. Large-order flow over the last day is a modest net inflow of 3.16K ATOM.
In short: the trend indicators currently support the upswing, while the high RSI and lighter volume mean the next move could be either a continuation if demand strengthens, or a cooldown after the recent run.
23
#ETH near-term picture is mixed, with a bearish trend filter still active. On the 1h chart, ETH is around $2,489.68 as of 2026-09-08, up +0.49% from today’s open.
Momentum: RSI(6) is 58.51, which is neutral—not an overheated reading.
Trend: MACD remains in a death cross state from 6 bars ago, and SuperTrend is still down at $2,509.92.
#ETH is above MA(7) and MA(99), but only slightly above MA(25), so moving averages are mixed rather than clearly bullish.
Current hourly volume is only 0.47× its 7-bar average, while 1-day large-order flow shows net outflow of 24.8K ETH. That makes a sustained upside move less convincing unless volume returns.
Holding above the recent $2,463 range low keeps the rebound structure intact; reclaiming and maintaining strength above the recent $2,508–$2,516 highs would improve the trend picture. Failure to do so leaves room for another range retest.
For a futures long, the key risk is that the price is still below the 1h SuperTrend and MACD has not turned positive yet—so watch confirmation from volume and trend indicators rather than relying on a single green candle.
#ETH near-term picture is mixed, with a bearish trend filter still active. On the 1h chart, ETH is around $2,489.68 as of 2026-09-08, up +0.49% from today’s open.
Momentum: RSI(6) is 58.51, which is neutral—not an overheated reading.
Trend: MACD remains in a death cross state from 6 bars ago, and SuperTrend is still down at $2,509.92.
Structure: ETH is above MA(7) and MA(99), but only slightly above MA(25), so moving averages are mixed rather than clearly bullish.Current hourly volume is only 0.47× its 7-bar average, while 1-day large-order flow shows net outflow of 24.8K ETH. That makes a sustained upside move less convincing unless volume returns.
$2,463 range low keeps the rebound structure intact; reclaiming and maintaining strength above the recent $2,508–$2,516 highs would improve the trend picture. Failure to do so leaves room for another range retest.
#CanadaTariffsOnUSTakeEffect
{spot}(ETHUSDT)
#ETH near-term picture is mixed, with a bearish trend filter still active. On the 1h chart, ETH is around $2,489.68 as of 2026-09-08, up +0.49% from today’s open.
Momentum: RSI(6) is 58.51, which is neutral—not an overheated reading.
Trend: MACD remains in a death cross state from 6 bars ago, and SuperTrend is still down at $2,509.92.
#ETH is above MA(7) and MA(99), but only slightly above MA(25), so moving averages are mixed rather than clearly bullish.
Current hourly volume is only 0.47× its 7-bar average, while 1-day large-order flow shows net outflow of 24.8K ETH. That makes a sustained upside move less convincing unless volume returns.
Holding above the recent $2,463 range low keeps the rebound structure intact; reclaiming and maintaining strength above the recent $2,508–$2,516 highs would improve the trend picture. Failure to do so leaves room for another range retest.
For a futures long, the key risk is that the price is still below the 1h SuperTrend and MACD has not turned positive yet—so watch confirmation from volume and trend indicators rather than relying on a single green candle.
#ETH near-term picture is mixed, with a bearish trend filter still active. On the 1h chart, ETH is around $2,489.68 as of 2026-09-08, up +0.49% from today’s open.
Momentum: RSI(6) is 58.51, which is neutral—not an overheated reading.
Trend: MACD remains in a death cross state from 6 bars ago, and SuperTrend is still down at $2,509.92.
Structure: ETH is above MA(7) and MA(99), but only slightly above MA(25), so moving averages are mixed rather than clearly bullish.Current hourly volume is only 0.47× its 7-bar average, while 1-day large-order flow shows net outflow of 24.8K ETH. That makes a sustained upside move less convincing unless volume returns.
$2,463 range low keeps the rebound structure intact; reclaiming and maintaining strength above the recent $2,508–$2,516 highs would improve the trend picture. Failure to do so leaves room for another range retest.
#CanadaTariffsOnUSTakeEffect
Momentum: RSI(6) is 58.51, which is neutral—not an overheated reading.
Trend: MACD remains in a death cross state from 6 bars ago, and SuperTrend is still down at $2,509.92.
#ETH is above MA(7) and MA(99), but only slightly above MA(25), so moving averages are mixed rather than clearly bullish.
Current hourly volume is only 0.47× its 7-bar average, while 1-day large-order flow shows net outflow of 24.8K ETH. That makes a sustained upside move less convincing unless volume returns.
Holding above the recent $2,463 range low keeps the rebound structure intact; reclaiming and maintaining strength above the recent $2,508–$2,516 highs would improve the trend picture. Failure to do so leaves room for another range retest.
For a futures long, the key risk is that the price is still below the 1h SuperTrend and MACD has not turned positive yet—so watch confirmation from volume and trend indicators rather than relying on a single green candle.
#ETH near-term picture is mixed, with a bearish trend filter still active. On the 1h chart, ETH is around $2,489.68 as of 2026-09-08, up +0.49% from today’s open.
Momentum: RSI(6) is 58.51, which is neutral—not an overheated reading.
Trend: MACD remains in a death cross state from 6 bars ago, and SuperTrend is still down at $2,509.92.
Structure: ETH is above MA(7) and MA(99), but only slightly above MA(25), so moving averages are mixed rather than clearly bullish.Current hourly volume is only 0.47× its 7-bar average, while 1-day large-order flow shows net outflow of 24.8K ETH. That makes a sustained upside move less convincing unless volume returns.
$2,463 range low keeps the rebound structure intact; reclaiming and maintaining strength above the recent $2,508–$2,516 highs would improve the trend picture. Failure to do so leaves room for another range retest.
#CanadaTariffsOnUSTakeEffect
8
#Zcash (ZEC) is trading around $1,132, down roughly -$55 (-4.6%) over the past 24 hours on 2026-09-08. It traded between approximately $1,105 and $1,211 during that window, meaning the pullback followed a move above $1,200. CoinDesk and CoinMarketCap both show a decline of roughly 4%–5% today. (coindesk.com)
Most likely driver: profit-taking after a rapid surge. #ZEC had risen sharply in the preceding days—historical market data show a close near $815.26 on 2026-09-02 and $1,227.11 on 2026-09-06. After a move of that scale, traders taking profits and leveraged positions being reduced can create a swift intraday pullback. This is a market-structure interpretation, not a confirmed single-cause headline. (coingecko.com)
Positioning may be adding volatility. Coverage from CoinStats notes that ZEC’s recent rally was amplified by short liquidations and that futures open interest had become very large. When a market moves rapidly in one direction, crowded positioning can reverse sharply as traders unwind—so today’s decline may reflect that deleveraging dynamic. (coinstats.app)
No clear new negative project-specific catalyst stands out in the available reporting. The recent news flow still highlights institutional interest and network developments, so the current drop appears more consistent with a volatile retracement after the rally than with a single confirmed adverse Zcash announcement. That read would be weakened if selling volume expands materially or if broader crypto markets also accelerate lower.
#USIranTradeTankerStrikesEscalate
{spot}(ZECUSDT)
#Zcash (ZEC) is trading around $1,132, down roughly -$55 (-4.6%) over the past 24 hours on 2026-09-08. It traded between approximately $1,105 and $1,211 during that window, meaning the pullback followed a move above $1,200. CoinDesk and CoinMarketCap both show a decline of roughly 4%–5% today. (coindesk.com)
Most likely driver: profit-taking after a rapid surge. #ZEC had risen sharply in the preceding days—historical market data show a close near $815.26 on 2026-09-02 and $1,227.11 on 2026-09-06. After a move of that scale, traders taking profits and leveraged positions being reduced can create a swift intraday pullback. This is a market-structure interpretation, not a confirmed single-cause headline. (coingecko.com)
Positioning may be adding volatility. Coverage from CoinStats notes that ZEC’s recent rally was amplified by short liquidations and that futures open interest had become very large. When a market moves rapidly in one direction, crowded positioning can reverse sharply as traders unwind—so today’s decline may reflect that deleveraging dynamic. (coinstats.app)
No clear new negative project-specific catalyst stands out in the available reporting. The recent news flow still highlights institutional interest and network developments, so the current drop appears more consistent with a volatile retracement after the rally than with a single confirmed adverse Zcash announcement. That read would be weakened if selling volume expands materially or if broader crypto markets also accelerate lower.
#USIranTradeTankerStrikesEscalate
Most likely driver: profit-taking after a rapid surge. #ZEC had risen sharply in the preceding days—historical market data show a close near $815.26 on 2026-09-02 and $1,227.11 on 2026-09-06. After a move of that scale, traders taking profits and leveraged positions being reduced can create a swift intraday pullback. This is a market-structure interpretation, not a confirmed single-cause headline. (coingecko.com)
Positioning may be adding volatility. Coverage from CoinStats notes that ZEC’s recent rally was amplified by short liquidations and that futures open interest had become very large. When a market moves rapidly in one direction, crowded positioning can reverse sharply as traders unwind—so today’s decline may reflect that deleveraging dynamic. (coinstats.app)
No clear new negative project-specific catalyst stands out in the available reporting. The recent news flow still highlights institutional interest and network developments, so the current drop appears more consistent with a volatile retracement after the rally than with a single confirmed adverse Zcash announcement. That read would be weakened if selling volume expands materially or if broader crypto markets also accelerate lower.
#USIranTradeTankerStrikesEscalate
84
#Bitcoin -linked blockchain, Liquid Network, used by several crypto exchanges, was hacked for $320 million. This incident is the latest in a series of thefts affecting the digital asset market.
⚡ South Korea to Expand Tokenized Securities to Stocks, Bonds, and Funds
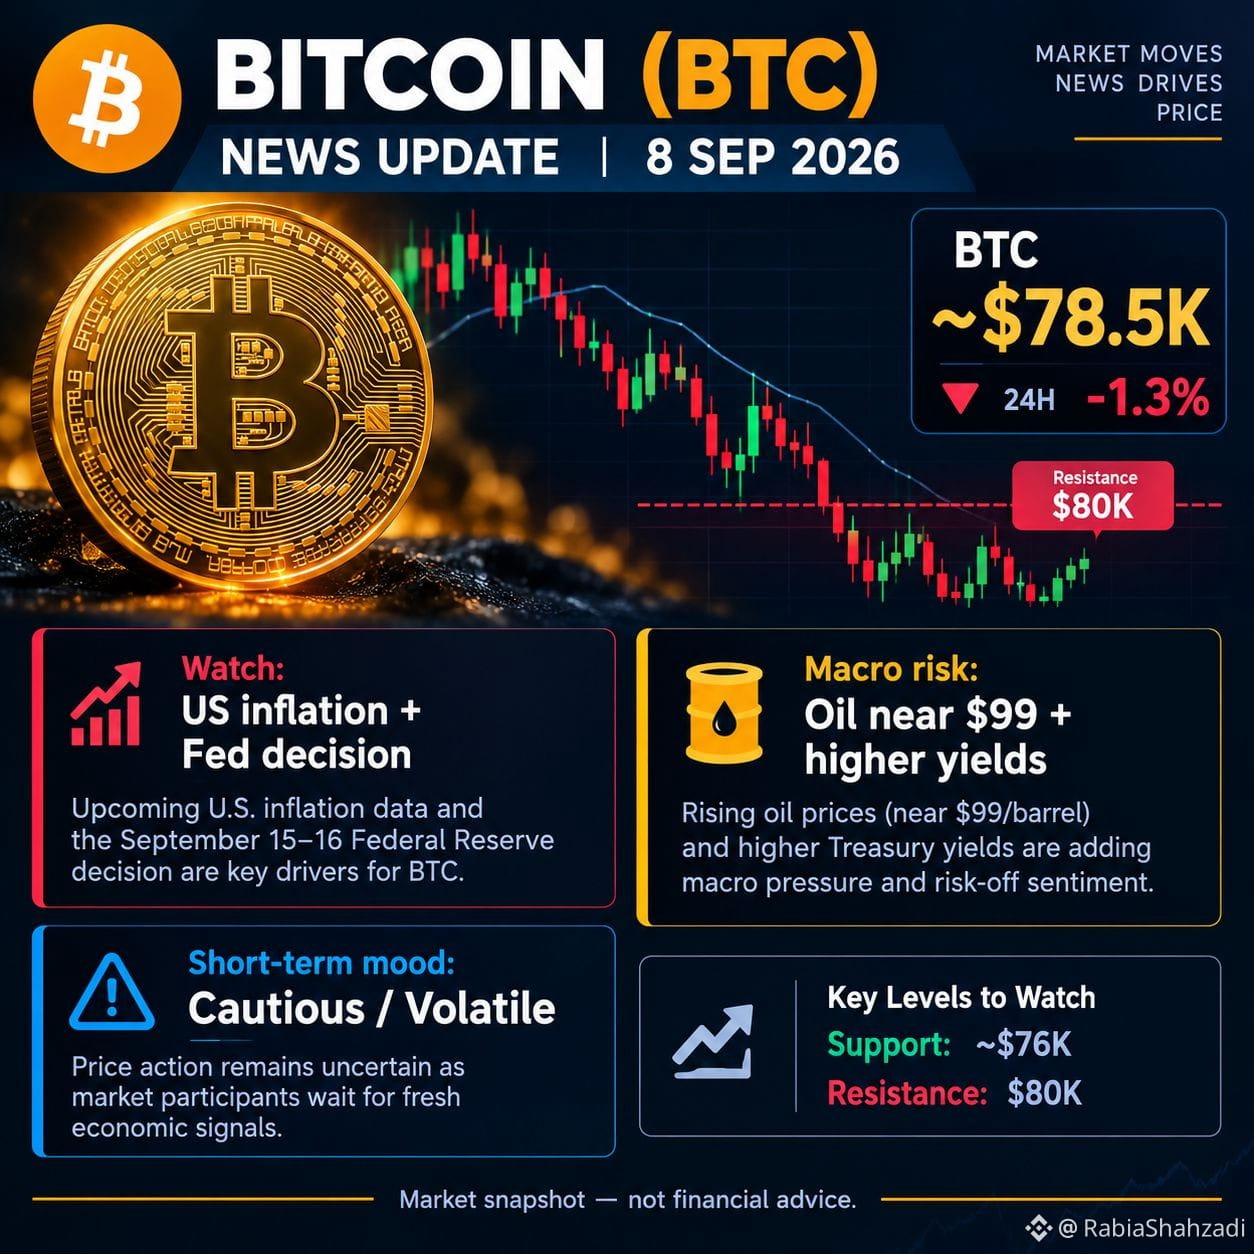
BTC has remained near the $79,000–$80,000 area after recent volatility, with market attention focused on institutional demand and upcoming U.S. inflation and central-bank signals.
Reports also indicate continued corporate Bitcoin treasury accumulation, while the Liquid Network incident remains a key security story for the Bitcoin ecosystem. It concerns a Bitcoin-linked sidechain rather than Bitcoin’s main network.
{spot}(BTCUSDT)
#Bitcoin -linked blockchain, Liquid Network, used by several crypto exchanges, was hacked for $320 million. This incident is the latest in a series of thefts affecting the digital asset market.
⚡ South Korea to Expand Tokenized Securities to Stocks, Bonds, and Funds
BTC has remained near the $79,000–$80,000 area after recent volatility, with market attention focused on institutional demand and upcoming U.S. inflation and central-bank signals.
Reports also indicate continued corporate Bitcoin treasury accumulation, while the Liquid Network incident remains a key security story for the Bitcoin ecosystem. It concerns a Bitcoin-linked sidechain rather than Bitcoin’s main network.
⚡ South Korea to Expand Tokenized Securities to Stocks, Bonds, and Funds
BTC has remained near the $79,000–$80,000 area after recent volatility, with market attention focused on institutional demand and upcoming U.S. inflation and central-bank signals.
Reports also indicate continued corporate Bitcoin treasury accumulation, while the Liquid Network incident remains a key security story for the Bitcoin ecosystem. It concerns a Bitcoin-linked sidechain rather than Bitcoin’s main network.
35
Войдите, чтобы посмотреть больше материала
Присоединяйтесь к пользователям криптовалют по всему миру на Binance Square
⚡️ Получайте новейшую и полезную информацию о криптоактивах.
💬 Нам доверяет крупнейшая в мире криптобиржа.
👍 Получите достоверные аналитические данные от верифицированных создателей контента.
Эл. почта/номер телефона
В тренде
BitcoinReboundsTo$79K
Просмотров: 27,179
241 обсуждают
🚨 $BTC is pushing higher.
Bitcoin is trading around $78,804, up roughly 1.9%, after reclaiming the $78K area. The next level to watch is the intraday high near $78,905.
A clean break above that level could open the way toward $79K–$80K. If BTC gets rejected, support sits around $78,300, then $77,975.
Bulls have momentum, but BTC needs to hold above $78K.
#Bitcoin #BTC #CryptoTrading #CryptoMarket #CryptoAnalysis
PulseON
·Лайков: 21
·Просмотров: 21.3k
USDCOnChainVolumeTops$100Trillion
Просмотров: 58
9 обсуждают
BitcoinSpotETFsNetInflow$160M
Просмотров: 983
59 обсуждают