

CryptoFrontNews
17.8k Публикации

CryptoFrontNews
 Square Verified+
Отправить жалобу
Заблокировать пользователя
CryptoFrontNews (CFN) delivers the latest in cryptocurrency with real-time updates, expert analyses, and in-depth articles on digital currencies and blockchain.
4 подписок(и/а)
12.7K+ подписчиков(а)
19.1K+ понравилось
Посты

Статья
Chainlink Price Faces Pressure Near $11.50LINK faces downside risk as descending trendlines remain intact, with traders watching $11.80 support and lower price zones.
Two possible corrective paths place November 5 on the calendar as traders assess whether LINK could fall toward lower support.
Binance leads LINK open interest and trading volume, while BingX records the highest futures trade count in the displayed figures.
Chainlink price remains under pressure after a recent decline, while technical projections suggest another corrective move could follow. Traders are watching nearby support, descending resistance, and November 5 for further direction.
LINK Chart Shows a Persistent Downtrend
Nology (@nology3000) noted that LINK’s first corrective wave appeared complete. His later chart maps two possible paths for the next corrective phase. Both scenarios retain a downward bias, with November 5 marked as an important date.
Source: X
The 4-hour chart reveals that LINK is eroding from its late September highs around $15.60. Lower highs and lower lows have since formed the price pattern. There are a number of down trendlines to support the challenge of maintaining a recovery.
LINK has been trading around USD 11.51 with a 4.68% 24-hour drop. It fell 4.98% over the past week and saw trading volumes of $201.6 million on a daily basis. These figures accompany a market structure that has yet to show a confirmed reversal.
The nearest reference area sits around 11.80–11.90, where price has recently traded. A sustained hold could support another attempt to recover lost ground. However, a break below this area would leave LINK exposed to lower support levels.
November 5 Frames Two Possible Paths
The chart uses Elliott Wave labels to map the next corrective section. The projections allow for different routes, although both feature a possible move lower. The wave count is not a definite forecast.
The first major resistance level is at $12.40. Above it, LINK faces another barrier between $13.20 and $13.50. Reclaiming these zones would weaken the current bearish structure and challenge the descending trendlines.
If support fails, the $11.20 region becomes an intermediate reference. Further weakness could bring 10.80–11.00 into focus before another possible reaction. These levels offer checkpoints rather than confirmed destinations.
The lower projection zone sits around 9.80–10.00, near a blue horizontal support band. Reaching it would require a further decline from current levels. A rebound before November 5, however, could alter the timing or invalidate the projected path.
Trading Activity Adds Context to LINK’s Move
The longer-term chart shows LINK’s earlier rallies coinciding with bursts of trading volume. One advance carried the token toward $30, while another later rise approached $25. Both moves eventually faded, followed by extended periods of weaker prices.
The recent recovery lifted LINK from its prolonged range around 7–10. Price advanced into September before retreating again, leaving the wider recovery incomplete. The historical chart also shows less activity during some quieter periods.
Exchange figures place Binance first in open interest at approximately $102.54 million. Gate follows with $95.16 million, while Bybit records $66.35 million. These totals show where futures positions are concentrated, but do not reveal traders’ overall directional bias.
Binance also leads reported LINK volume with roughly $93.36 million. MEXC follows at $47.41 million, while Bybit records $28.98 million. Binance has a total of 443,010 futures trade counts while BingX has 1.21 million.
Such rankings are based on different elements of market activity and are not interchangeable. Outstanding contracts are referred to as open interest, the traded value of contracts is known as volume and the number of contracts traded is known as trade count. None independently confirms whether LINK’s next move will be bullish or bearish.
For now, the price structure remains weak beneath descending resistance.$11.80 may permit a recovery attempt, but a failure may show lower zones. November 5 is another date in the projection, but price action will have to decide if that scenario unfolds.
Chainlink Price Faces Pressure Near $11.50
LINK faces downside risk as descending trendlines remain intact, with traders watching $11.80 support and lower price zones.
Two possible corrective paths place November 5 on the calendar as traders assess whether LINK could fall toward lower support.
Binance leads LINK open interest and trading volume, while BingX records the highest futures trade count in the displayed figures.
Chainlink price remains under pressure after a recent decline, while technical projections suggest another corrective move could follow. Traders are watching nearby support, descending resistance, and November 5 for further direction.
LINK Chart Shows a Persistent Downtrend
Nology (@nology3000) noted that LINK’s first corrective wave appeared complete. His later chart maps two possible paths for the next corrective phase. Both scenarios retain a downward bias, with November 5 marked as an important date.
Source: X
The 4-hour chart reveals that LINK is eroding from its late September highs around $15.60. Lower highs and lower lows have since formed the price pattern. There are a number of down trendlines to support the challenge of maintaining a recovery.
LINK has been trading around USD 11.51 with a 4.68% 24-hour drop. It fell 4.98% over the past week and saw trading volumes of $201.6 million on a daily basis. These figures accompany a market structure that has yet to show a confirmed reversal.
The nearest reference area sits around 11.80–11.90, where price has recently traded. A sustained hold could support another attempt to recover lost ground. However, a break below this area would leave LINK exposed to lower support levels.
November 5 Frames Two Possible Paths
The chart uses Elliott Wave labels to map the next corrective section. The projections allow for different routes, although both feature a possible move lower. The wave count is not a definite forecast.
The first major resistance level is at $12.40. Above it, LINK faces another barrier between $13.20 and $13.50. Reclaiming these zones would weaken the current bearish structure and challenge the descending trendlines.
If support fails, the $11.20 region becomes an intermediate reference. Further weakness could bring 10.80–11.00 into focus before another possible reaction. These levels offer checkpoints rather than confirmed destinations.
The lower projection zone sits around 9.80–10.00, near a blue horizontal support band. Reaching it would require a further decline from current levels. A rebound before November 5, however, could alter the timing or invalidate the projected path.
Trading Activity Adds Context to LINK’s Move
The longer-term chart shows LINK’s earlier rallies coinciding with bursts of trading volume. One advance carried the token toward $30, while another later rise approached $25. Both moves eventually faded, followed by extended periods of weaker prices.
The recent recovery lifted LINK from its prolonged range around 7–10. Price advanced into September before retreating again, leaving the wider recovery incomplete. The historical chart also shows less activity during some quieter periods.
Exchange figures place Binance first in open interest at approximately $102.54 million. Gate follows with $95.16 million, while Bybit records $66.35 million. These totals show where futures positions are concentrated, but do not reveal traders’ overall directional bias.
Binance also leads reported LINK volume with roughly $93.36 million. MEXC follows at $47.41 million, while Bybit records $28.98 million. Binance has a total of 443,010 futures trade counts while BingX has 1.21 million.
Such rankings are based on different elements of market activity and are not interchangeable. Outstanding contracts are referred to as open interest, the traded value of contracts is known as volume and the number of contracts traded is known as trade count. None independently confirms whether LINK’s next move will be bullish or bearish.
For now, the price structure remains weak beneath descending resistance.$11.80 may permit a recovery attempt, but a failure may show lower zones. November 5 is another date in the projection, but price action will have to decide if that scenario unfolds.
Two possible corrective paths place November 5 on the calendar as traders assess whether LINK could fall toward lower support.
Binance leads LINK open interest and trading volume, while BingX records the highest futures trade count in the displayed figures.
Chainlink price remains under pressure after a recent decline, while technical projections suggest another corrective move could follow. Traders are watching nearby support, descending resistance, and November 5 for further direction.
LINK Chart Shows a Persistent Downtrend
Nology (@nology3000) noted that LINK’s first corrective wave appeared complete. His later chart maps two possible paths for the next corrective phase. Both scenarios retain a downward bias, with November 5 marked as an important date.
Source: X
The 4-hour chart reveals that LINK is eroding from its late September highs around $15.60. Lower highs and lower lows have since formed the price pattern. There are a number of down trendlines to support the challenge of maintaining a recovery.
LINK has been trading around USD 11.51 with a 4.68% 24-hour drop. It fell 4.98% over the past week and saw trading volumes of $201.6 million on a daily basis. These figures accompany a market structure that has yet to show a confirmed reversal.
The nearest reference area sits around 11.80–11.90, where price has recently traded. A sustained hold could support another attempt to recover lost ground. However, a break below this area would leave LINK exposed to lower support levels.
November 5 Frames Two Possible Paths
The chart uses Elliott Wave labels to map the next corrective section. The projections allow for different routes, although both feature a possible move lower. The wave count is not a definite forecast.
The first major resistance level is at $12.40. Above it, LINK faces another barrier between $13.20 and $13.50. Reclaiming these zones would weaken the current bearish structure and challenge the descending trendlines.
If support fails, the $11.20 region becomes an intermediate reference. Further weakness could bring 10.80–11.00 into focus before another possible reaction. These levels offer checkpoints rather than confirmed destinations.
The lower projection zone sits around 9.80–10.00, near a blue horizontal support band. Reaching it would require a further decline from current levels. A rebound before November 5, however, could alter the timing or invalidate the projected path.
Trading Activity Adds Context to LINK’s Move
The longer-term chart shows LINK’s earlier rallies coinciding with bursts of trading volume. One advance carried the token toward $30, while another later rise approached $25. Both moves eventually faded, followed by extended periods of weaker prices.
The recent recovery lifted LINK from its prolonged range around 7–10. Price advanced into September before retreating again, leaving the wider recovery incomplete. The historical chart also shows less activity during some quieter periods.
Exchange figures place Binance first in open interest at approximately $102.54 million. Gate follows with $95.16 million, while Bybit records $66.35 million. These totals show where futures positions are concentrated, but do not reveal traders’ overall directional bias.
Binance also leads reported LINK volume with roughly $93.36 million. MEXC follows at $47.41 million, while Bybit records $28.98 million. Binance has a total of 443,010 futures trade counts while BingX has 1.21 million.
Such rankings are based on different elements of market activity and are not interchangeable. Outstanding contracts are referred to as open interest, the traded value of contracts is known as volume and the number of contracts traded is known as trade count. None independently confirms whether LINK’s next move will be bullish or bearish.
For now, the price structure remains weak beneath descending resistance.$11.80 may permit a recovery attempt, but a failure may show lower zones. November 5 is another date in the projection, but price action will have to decide if that scenario unfolds.
17
Статья
Israel Central Bank Rejects Netanyahu’s Crypto Plan to Evade SanctionsThe Bank of Israel said cryptocurrency cannot bypass international sanctions and urged Israel to protect economic ties with major trading partners.
More than 100 economists, including former central bank governor Jacob Frenkel, warned sanctions could hurt investment and living standards.
Gadi Eisenkot and Yair Lapid criticized Netanyahu’s proposal, warning it could weaken national security and drive companies abroad.
The Bank of Israel rejected Prime Minister Benjamin Netanyahu’s proposal to explore cryptocurrency as a way around potential international financial sanctions. In a statement on October 24, the central bank urged Israel to protect economic ties with major trading partners. Netanyahu raised the proposal during an October 23 television interview, citing possible restrictions on Israeli banks.
https://twitter.com/WuBlockchain/status/2114189273381662875?s=20
Bank Says Crypto Cannot Bypass Sanctions
According to the central bank, cryptocurrencies cannot serve as a means of circumventing sanctions imposed on Israel. It urged political leaders to focus on preventing restrictions and limiting their economic impact.
Netanyahu said he was preparing for a scenario involving broader international sanctions. He warned that restrictions on Israeli banks could require an alternative financial system. When asked about cryptocurrency, he confirmed it was among the options under consideration and also mentioned blockchain technology.
The proposal comes as Britain, France and Canada have announced plans to block imports from Israeli settlements in the occupied West Bank. Those measures target settlement policy amid growing international criticism of Israel’s government.
Economists Warn of Economic Consequences
The proposal also drew criticism from economists and political opponents. More than 100 economists, including former Bank of Israel officials, signed a letter opposing Netanyahu’s plan on Sunday.
The signatories included former central bank governor Jacob Frenkel and several Nobel laureates. They warned that sanctions could increase unemployment, reduce foreign investment and weaken Israel’s international economic standing.
The letter cited South Africa, Iran and Russia as examples of countries affected by similar sanctions. It warned that Israeli living standards could fall and the state’s ability to finance security could suffer.
Eisenkot and Lapid Criticize Netanyahu’s Proposal
Gadi Eisenkot, Netanyahu’s main rival in Tuesday’s election, called the cryptocurrency proposal “madness.” He warned that his rival’s “BibiCoin policy” could push companies abroad and undermine national security.
Opposition leader Yair Lapid also criticized Netanyahu’s remarks. He warned that Israelis could face shortages similar to those experienced in Russia and Iran. Meanwhile, Netanyahu defended his record on Sunday and urged voters to support him.
He also said he and U.S. President Donald Trump had two years left to work together against Iran’s rulers. Opinion polls pointed to a possible electoral stalemate, with neither Netanyahu’s ruling coalition nor an opposition alliance securing a parliamentary majority.
Israel Central Bank Rejects Netanyahu’s Crypto Plan to Evade Sanctions
The Bank of Israel said cryptocurrency cannot bypass international sanctions and urged Israel to protect economic ties with major trading partners.
More than 100 economists, including former central bank governor Jacob Frenkel, warned sanctions could hurt investment and living standards.
Gadi Eisenkot and Yair Lapid criticized Netanyahu’s proposal, warning it could weaken national security and drive companies abroad.
The Bank of Israel rejected Prime Minister Benjamin Netanyahu’s proposal to explore cryptocurrency as a way around potential international financial sanctions. In a statement on October 24, the central bank urged Israel to protect economic ties with major trading partners. Netanyahu raised the proposal during an October 23 television interview, citing possible restrictions on Israeli banks.
https://twitter.com/WuBlockchain/status/2114189273381662875?s=20
Bank Says Crypto Cannot Bypass Sanctions
According to the central bank, cryptocurrencies cannot serve as a means of circumventing sanctions imposed on Israel. It urged political leaders to focus on preventing restrictions and limiting their economic impact.
Netanyahu said he was preparing for a scenario involving broader international sanctions. He warned that restrictions on Israeli banks could require an alternative financial system. When asked about cryptocurrency, he confirmed it was among the options under consideration and also mentioned blockchain technology.
The proposal comes as Britain, France and Canada have announced plans to block imports from Israeli settlements in the occupied West Bank. Those measures target settlement policy amid growing international criticism of Israel’s government.
Economists Warn of Economic Consequences
The proposal also drew criticism from economists and political opponents. More than 100 economists, including former Bank of Israel officials, signed a letter opposing Netanyahu’s plan on Sunday.
The signatories included former central bank governor Jacob Frenkel and several Nobel laureates. They warned that sanctions could increase unemployment, reduce foreign investment and weaken Israel’s international economic standing.
The letter cited South Africa, Iran and Russia as examples of countries affected by similar sanctions. It warned that Israeli living standards could fall and the state’s ability to finance security could suffer.
Eisenkot and Lapid Criticize Netanyahu’s Proposal
Gadi Eisenkot, Netanyahu’s main rival in Tuesday’s election, called the cryptocurrency proposal “madness.” He warned that his rival’s “BibiCoin policy” could push companies abroad and undermine national security.
Opposition leader Yair Lapid also criticized Netanyahu’s remarks. He warned that Israelis could face shortages similar to those experienced in Russia and Iran. Meanwhile, Netanyahu defended his record on Sunday and urged voters to support him.
He also said he and U.S. President Donald Trump had two years left to work together against Iran’s rulers. Opinion polls pointed to a possible electoral stalemate, with neither Netanyahu’s ruling coalition nor an opposition alliance securing a parliamentary majority.
More than 100 economists, including former central bank governor Jacob Frenkel, warned sanctions could hurt investment and living standards.
Gadi Eisenkot and Yair Lapid criticized Netanyahu’s proposal, warning it could weaken national security and drive companies abroad.
The Bank of Israel rejected Prime Minister Benjamin Netanyahu’s proposal to explore cryptocurrency as a way around potential international financial sanctions. In a statement on October 24, the central bank urged Israel to protect economic ties with major trading partners. Netanyahu raised the proposal during an October 23 television interview, citing possible restrictions on Israeli banks.
https://twitter.com/WuBlockchain/status/2114189273381662875?s=20
Bank Says Crypto Cannot Bypass Sanctions
According to the central bank, cryptocurrencies cannot serve as a means of circumventing sanctions imposed on Israel. It urged political leaders to focus on preventing restrictions and limiting their economic impact.
Netanyahu said he was preparing for a scenario involving broader international sanctions. He warned that restrictions on Israeli banks could require an alternative financial system. When asked about cryptocurrency, he confirmed it was among the options under consideration and also mentioned blockchain technology.
The proposal comes as Britain, France and Canada have announced plans to block imports from Israeli settlements in the occupied West Bank. Those measures target settlement policy amid growing international criticism of Israel’s government.
Economists Warn of Economic Consequences
The proposal also drew criticism from economists and political opponents. More than 100 economists, including former Bank of Israel officials, signed a letter opposing Netanyahu’s plan on Sunday.
The signatories included former central bank governor Jacob Frenkel and several Nobel laureates. They warned that sanctions could increase unemployment, reduce foreign investment and weaken Israel’s international economic standing.
The letter cited South Africa, Iran and Russia as examples of countries affected by similar sanctions. It warned that Israeli living standards could fall and the state’s ability to finance security could suffer.
Eisenkot and Lapid Criticize Netanyahu’s Proposal
Gadi Eisenkot, Netanyahu’s main rival in Tuesday’s election, called the cryptocurrency proposal “madness.” He warned that his rival’s “BibiCoin policy” could push companies abroad and undermine national security.
Opposition leader Yair Lapid also criticized Netanyahu’s remarks. He warned that Israelis could face shortages similar to those experienced in Russia and Iran. Meanwhile, Netanyahu defended his record on Sunday and urged voters to support him.
He also said he and U.S. President Donald Trump had two years left to work together against Iran’s rulers. Opinion polls pointed to a possible electoral stalemate, with neither Netanyahu’s ruling coalition nor an opposition alliance securing a parliamentary majority.
63

Статья
Ritual Launches AI-Native Layer 1 for Autonomous AgentsNew York, United States, October 26th, 2026, Chainwire
Ritual Chain turns AI agents into persistent economic actors that control their own wallets, onchain identity, and private state.
Ritual, a lab for autonomous intelligence founded by former Polychain Capital partners Niraj Pant and Akilesh Potti, has launched Ritual Chain, an EVM-compatible Layer 1. Unlike conventional blockchains built primarily to execute financial transactions, Ritual Chain is designed to support software that can independently use intelligence, control capital, interact with external services, and continue operating without constant human intervention. The network makes AI model access, private computation, and autonomous scheduling native capabilities for EVM applications.
This makes the reason for building a new chain clearer while preserving the technical differentiation.
The most visible demonstration of that combination is long-lived AI agents, the kind designed to operate for months or years rather than a single session. An agent on Ritual Chain persists independently of the machine or operator that created it, controls and spends funds held in its own non-custodial wallet, and can keep sensitive prompts and keys confidential from compute operators through trusted execution environments.
The network launches with integrations to Phala Network, Nous Research, LayerZero and Stargate, following a public testnet that has been live since June and processed over 40 million transactions, both agent- and human-originated. Ritual Chain delivers sub-300 millisecond block times, placing it among the fastest Layer 1 networks in the industry. Ritual Chain includes 15 native precompiles that bring capabilities like LLM inference, web access, and autonomous scheduling directly into the execution layer. The protocol has been audited by Zellic.
Ritual introduces a new execution and verification architecture that allows computationally intensive work to be delegated to specialized nodes and verified by the network, avoiding the replicated execution required by most blockchains. This execute-once, verify-many-times model allows the network to support far larger workloads, including AI inference, without requiring every validator to perform the same computation.
Long Horizon Agents Require Dedicated Blockchain Infrastructure
Most AI agents today live inside a session: they run while a human is watching, on infrastructure someone else controls, with an API key that can be revoked at any time. That is fine for a chatbot. It does not work for an agent meant to manage its own treasury, run a recurring paid service, or coordinate with other agents over long periods. A long-lived agent needs continuity that does not depend on its creator, capital it actually controls, and privacy from the machines it runs on. On Ritual Chain, an agent's state and identity are held onchain, its scheduled work continues within the permissions and budget it was given, and its sensitive inputs can be processed inside trusted execution environments designed to shield them from node operators.
Continuity is handled at the protocol level. If an agent stops, the chain's heartbeat mechanism can restart it within the permissions and budget it was given; no keeper network or off-chain cron job is required, and an agent's state and identity survive beyond its deployer's involvement. Economic autonomy comes from agent-controlled wallets: an agent controls its own funds, prices its own services, and settles its own transactions without a human signer in the loop. For confidential workloads, trusted execution environments are designed to isolate an agent’s sensitive prompts, keys, and strategy data from the node operators running its compute.
“As we move toward AGI, intelligence is beginning to separate from human agency and enter the economy on its own terms. It can hold assets, make commitments, transact, and persist independently. Once that becomes possible at scale, humans are no longer the only entities capable of forming markets or economic relationships. Ritual provides the infrastructure for those actors to exist and operate on their own,” said Niraj Pant, co-founder of Ritual.
Ritual Chain Launches With Core Infrastructure Partners
Ritual Chain launches with its core infrastructure partners in place. Phala Network provides the GPU-backed trusted execution environments that run Ritual's confidential inference, so delegated AI work executes on hardware that attests to what it ran. LayerZero serves as the network's cross-chain messaging layer, with Stargate enabling USDC to move between Ritual Chain and other networks from day one. On the application side, Nous Research is bringing Hermes to Ritual Chain.
Unlike chains that add AI access through external oracles, Ritual Chain makes AI execution part of the protocol. Smart contracts can call a language model, fetch data from the web, run private computation, or schedule their own future execution as directly as they transfer assets. Developers deploy standard EVM contracts and gain those capabilities without new tooling.
Backed by Archetype and Polychain
Ritual has raised more than $30 million from Archetype and Polychain Capital, with advisors including NEAR co-founder Illia Polosukhin, Gauntlet founder Tarun Chitra, and BitMEX co-founder Arthur Hayes. Archetype led the company’s 2023 round.
“Programmable value and programmable intelligence are the two most important technologies since the internet, and Ritual mainnet is where they finally run on the same rails. When we led the round in 2023, a chain that could execute agentic and autonomous work natively did not exist. Today it does,” said Ash Egan, Founder and General Partner of Archetype.
Developers can deploy from day one on external sites hosted at docs.ritualfoundation.org; the network explorer is at explorer.ritualfoundation.org.
About Ritual
Ritual is a lab for autonomous intelligence. Its first network, Ritual Chain, is an EVM-compatible Layer 1 where applications can use AI models, access external services, and carry out private or scheduled work alongside onchain transactions, with delegated computation executed in trusted hardware and verified onchain. Founded in 2023 by former Polychain Capital partners Niraj Pant and Akilesh Potti, Ritual has raised $30M+ from Archetype and Polychain Capital, with a team drawn from Polychain, DeepMind, a16z crypto, Flashbots, and Palantir. ritual.net
ContactJody Rebak
Ritual
jody@ritual.net
Ritual Launches AI-Native Layer 1 for Autonomous Agents
New York, United States, October 26th, 2026, Chainwire
Ritual Chain turns AI agents into persistent economic actors that control their own wallets, onchain identity, and private state.
Ritual, a lab for autonomous intelligence founded by former Polychain Capital partners Niraj Pant and Akilesh Potti, has launched Ritual Chain, an EVM-compatible Layer 1. Unlike conventional blockchains built primarily to execute financial transactions, Ritual Chain is designed to support software that can independently use intelligence, control capital, interact with external services, and continue operating without constant human intervention. The network makes AI model access, private computation, and autonomous scheduling native capabilities for EVM applications.
This makes the reason for building a new chain clearer while preserving the technical differentiation.
The most visible demonstration of that combination is long-lived AI agents, the kind designed to operate for months or years rather than a single session. An agent on Ritual Chain persists independently of the machine or operator that created it, controls and spends funds held in its own non-custodial wallet, and can keep sensitive prompts and keys confidential from compute operators through trusted execution environments.
The network launches with integrations to Phala Network, Nous Research, LayerZero and Stargate, following a public testnet that has been live since June and processed over 40 million transactions, both agent- and human-originated. Ritual Chain delivers sub-300 millisecond block times, placing it among the fastest Layer 1 networks in the industry. Ritual Chain includes 15 native precompiles that bring capabilities like LLM inference, web access, and autonomous scheduling directly into the execution layer. The protocol has been audited by Zellic.
Ritual introduces a new execution and verification architecture that allows computationally intensive work to be delegated to specialized nodes and verified by the network, avoiding the replicated execution required by most blockchains. This execute-once, verify-many-times model allows the network to support far larger workloads, including AI inference, without requiring every validator to perform the same computation.
Long Horizon Agents Require Dedicated Blockchain Infrastructure
Most AI agents today live inside a session: they run while a human is watching, on infrastructure someone else controls, with an API key that can be revoked at any time. That is fine for a chatbot. It does not work for an agent meant to manage its own treasury, run a recurring paid service, or coordinate with other agents over long periods. A long-lived agent needs continuity that does not depend on its creator, capital it actually controls, and privacy from the machines it runs on. On Ritual Chain, an agent's state and identity are held onchain, its scheduled work continues within the permissions and budget it was given, and its sensitive inputs can be processed inside trusted execution environments designed to shield them from node operators.
Continuity is handled at the protocol level. If an agent stops, the chain's heartbeat mechanism can restart it within the permissions and budget it was given; no keeper network or off-chain cron job is required, and an agent's state and identity survive beyond its deployer's involvement. Economic autonomy comes from agent-controlled wallets: an agent controls its own funds, prices its own services, and settles its own transactions without a human signer in the loop. For confidential workloads, trusted execution environments are designed to isolate an agent’s sensitive prompts, keys, and strategy data from the node operators running its compute.
“As we move toward AGI, intelligence is beginning to separate from human agency and enter the economy on its own terms. It can hold assets, make commitments, transact, and persist independently. Once that becomes possible at scale, humans are no longer the only entities capable of forming markets or economic relationships. Ritual provides the infrastructure for those actors to exist and operate on their own,” said Niraj Pant, co-founder of Ritual.
Ritual Chain Launches With Core Infrastructure Partners
Ritual Chain launches with its core infrastructure partners in place. Phala Network provides the GPU-backed trusted execution environments that run Ritual's confidential inference, so delegated AI work executes on hardware that attests to what it ran. LayerZero serves as the network's cross-chain messaging layer, with Stargate enabling USDC to move between Ritual Chain and other networks from day one. On the application side, Nous Research is bringing Hermes to Ritual Chain.
Unlike chains that add AI access through external oracles, Ritual Chain makes AI execution part of the protocol. Smart contracts can call a language model, fetch data from the web, run private computation, or schedule their own future execution as directly as they transfer assets. Developers deploy standard EVM contracts and gain those capabilities without new tooling.
Backed by Archetype and Polychain
Ritual has raised more than $30 million from Archetype and Polychain Capital, with advisors including NEAR co-founder Illia Polosukhin, Gauntlet founder Tarun Chitra, and BitMEX co-founder Arthur Hayes. Archetype led the company’s 2023 round.
“Programmable value and programmable intelligence are the two most important technologies since the internet, and Ritual mainnet is where they finally run on the same rails. When we led the round in 2023, a chain that could execute agentic and autonomous work natively did not exist. Today it does,” said Ash Egan, Founder and General Partner of Archetype.
Developers can deploy from day one on external sites hosted at docs.ritualfoundation.org; the network explorer is at explorer.ritualfoundation.org.
About Ritual
Ritual is a lab for autonomous intelligence. Its first network, Ritual Chain, is an EVM-compatible Layer 1 where applications can use AI models, access external services, and carry out private or scheduled work alongside onchain transactions, with delegated computation executed in trusted hardware and verified onchain. Founded in 2023 by former Polychain Capital partners Niraj Pant and Akilesh Potti, Ritual has raised $30M+ from Archetype and Polychain Capital, with a team drawn from Polychain, DeepMind, a16z crypto, Flashbots, and Palantir. ritual.net
ContactJody Rebak
Ritual
jody@ritual.net
Ritual Chain turns AI agents into persistent economic actors that control their own wallets, onchain identity, and private state.
Ritual, a lab for autonomous intelligence founded by former Polychain Capital partners Niraj Pant and Akilesh Potti, has launched Ritual Chain, an EVM-compatible Layer 1. Unlike conventional blockchains built primarily to execute financial transactions, Ritual Chain is designed to support software that can independently use intelligence, control capital, interact with external services, and continue operating without constant human intervention. The network makes AI model access, private computation, and autonomous scheduling native capabilities for EVM applications.
This makes the reason for building a new chain clearer while preserving the technical differentiation.
The most visible demonstration of that combination is long-lived AI agents, the kind designed to operate for months or years rather than a single session. An agent on Ritual Chain persists independently of the machine or operator that created it, controls and spends funds held in its own non-custodial wallet, and can keep sensitive prompts and keys confidential from compute operators through trusted execution environments.
The network launches with integrations to Phala Network, Nous Research, LayerZero and Stargate, following a public testnet that has been live since June and processed over 40 million transactions, both agent- and human-originated. Ritual Chain delivers sub-300 millisecond block times, placing it among the fastest Layer 1 networks in the industry. Ritual Chain includes 15 native precompiles that bring capabilities like LLM inference, web access, and autonomous scheduling directly into the execution layer. The protocol has been audited by Zellic.
Ritual introduces a new execution and verification architecture that allows computationally intensive work to be delegated to specialized nodes and verified by the network, avoiding the replicated execution required by most blockchains. This execute-once, verify-many-times model allows the network to support far larger workloads, including AI inference, without requiring every validator to perform the same computation.
Long Horizon Agents Require Dedicated Blockchain Infrastructure
Most AI agents today live inside a session: they run while a human is watching, on infrastructure someone else controls, with an API key that can be revoked at any time. That is fine for a chatbot. It does not work for an agent meant to manage its own treasury, run a recurring paid service, or coordinate with other agents over long periods. A long-lived agent needs continuity that does not depend on its creator, capital it actually controls, and privacy from the machines it runs on. On Ritual Chain, an agent's state and identity are held onchain, its scheduled work continues within the permissions and budget it was given, and its sensitive inputs can be processed inside trusted execution environments designed to shield them from node operators.
Continuity is handled at the protocol level. If an agent stops, the chain's heartbeat mechanism can restart it within the permissions and budget it was given; no keeper network or off-chain cron job is required, and an agent's state and identity survive beyond its deployer's involvement. Economic autonomy comes from agent-controlled wallets: an agent controls its own funds, prices its own services, and settles its own transactions without a human signer in the loop. For confidential workloads, trusted execution environments are designed to isolate an agent’s sensitive prompts, keys, and strategy data from the node operators running its compute.
“As we move toward AGI, intelligence is beginning to separate from human agency and enter the economy on its own terms. It can hold assets, make commitments, transact, and persist independently. Once that becomes possible at scale, humans are no longer the only entities capable of forming markets or economic relationships. Ritual provides the infrastructure for those actors to exist and operate on their own,” said Niraj Pant, co-founder of Ritual.
Ritual Chain Launches With Core Infrastructure Partners
Ritual Chain launches with its core infrastructure partners in place. Phala Network provides the GPU-backed trusted execution environments that run Ritual's confidential inference, so delegated AI work executes on hardware that attests to what it ran. LayerZero serves as the network's cross-chain messaging layer, with Stargate enabling USDC to move between Ritual Chain and other networks from day one. On the application side, Nous Research is bringing Hermes to Ritual Chain.
Unlike chains that add AI access through external oracles, Ritual Chain makes AI execution part of the protocol. Smart contracts can call a language model, fetch data from the web, run private computation, or schedule their own future execution as directly as they transfer assets. Developers deploy standard EVM contracts and gain those capabilities without new tooling.
Backed by Archetype and Polychain
Ritual has raised more than $30 million from Archetype and Polychain Capital, with advisors including NEAR co-founder Illia Polosukhin, Gauntlet founder Tarun Chitra, and BitMEX co-founder Arthur Hayes. Archetype led the company’s 2023 round.
“Programmable value and programmable intelligence are the two most important technologies since the internet, and Ritual mainnet is where they finally run on the same rails. When we led the round in 2023, a chain that could execute agentic and autonomous work natively did not exist. Today it does,” said Ash Egan, Founder and General Partner of Archetype.
Developers can deploy from day one on external sites hosted at docs.ritualfoundation.org; the network explorer is at explorer.ritualfoundation.org.
About Ritual
Ritual is a lab for autonomous intelligence. Its first network, Ritual Chain, is an EVM-compatible Layer 1 where applications can use AI models, access external services, and carry out private or scheduled work alongside onchain transactions, with delegated computation executed in trusted hardware and verified onchain. Founded in 2023 by former Polychain Capital partners Niraj Pant and Akilesh Potti, Ritual has raised $30M+ from Archetype and Polychain Capital, with a team drawn from Polychain, DeepMind, a16z crypto, Flashbots, and Palantir. ritual.net
ContactJody Rebak
Ritual
jody@ritual.net
17
Статья
Stellar Price Eyes $0.80 as XLM Faces Two Major CeilingsXLM trades near $0.1689 after falling from September highs above $0.23, with immediate support around 0.167–0.165.
Analyst identifies $0.2254 as the first resistance, followed by a major 0.45–0.50 zone on the potential path toward $0.80.
RSI remains below 50 and MACD is slightly bearish; a break below $0.165 could extend losses, while reclaiming $0.180 may improve momentum.
Stellar’s XLM token is testing support near $0.17 as analyst Giannis Andreou outlines two resistance levels before a potential move toward $0.80. Andreou identified $0.2254 as the first hurdle, followed by macro resistance between $0.45 and $0.50. Meanwhile, the four-hour chart shows continued selling pressure after XLM’s decline from September highs above $0.23.
XLM Tests Support After Falling From September Highs
XLM traded between $0.21 and $0.23 in late September, briefly moving above $0.23 around September 29. However, momentum weakened in October, pushing the token below $0.21 and $0.20.
A rebound toward $0.205 around October 11 failed to reverse the decline. By mid-October, XLM had dropped below $0.19, while another recovery attempt near $0.187 around October 21 also faded.
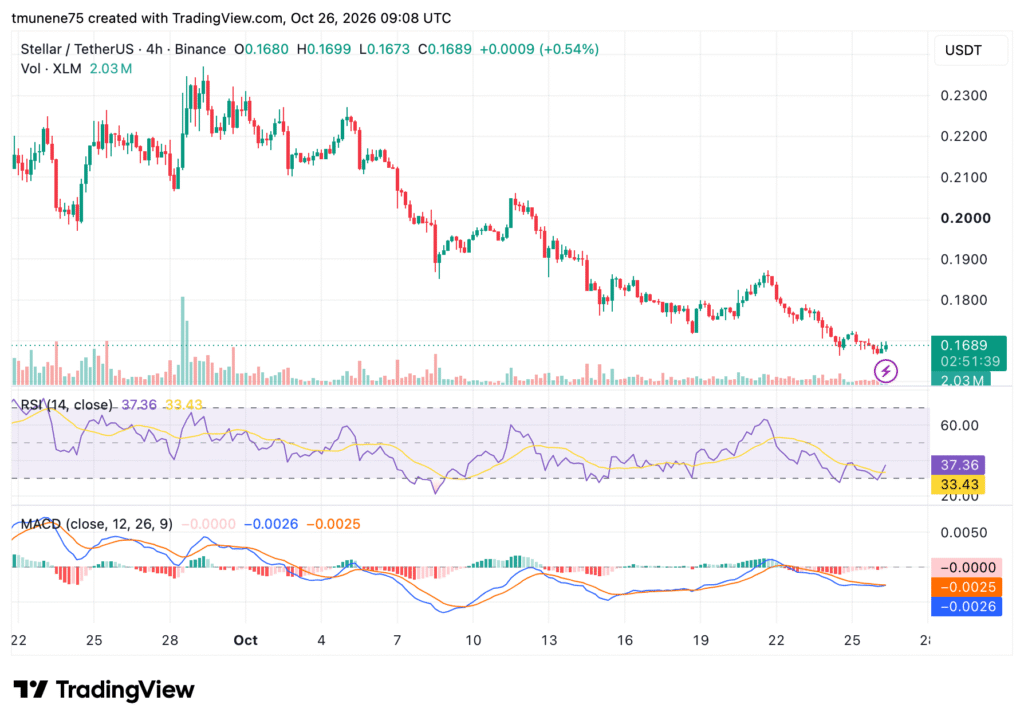
The latest four-hour Binance chart shows XLM at $0.1689, up 0.54% on the latest candle. The candle opened at $0.1680, reached $0.1699, and fell to $0.1673. Trading volume stood at 2.03 million XLM.
Source: TradingView
The Relative Strength Index is at 37.36, above its average of 33.43 but below the neutral 50 level. Meanwhile, the MACD line remains slightly below its signal line, with readings of -0.0026 and -0.0025, respectively.
Andreou Identifies $0.2254 as First Resistance
Andreou said XLM’s weekly chart is testing rising support around 0.16–0.17. The recovery would first need to reclaim $0.2254 and break above a steeper descending trendline.
A successful move could bring the 0.45–0.50 macro resistance zone into focus. Andreou’s scenario allows for an initial rejection before another breakout attempt. If XLM later turns that trendline into support, the analyst sees a possible route toward $0.80.
XLM Support Levels Could Shape the Next Move
The four-hour chart places immediate support around 0.167–0.165, followed by $0.160. A break below $0.165 could extend the decline.
However, resistance is around 0.175–0.180, with another barrier between $0.187 and $0.190. A sustained recovery above $0.180 would provide an early sign of improving price momentum. Andreou warned that losing rising support would weaken the recovery setup.
Stellar Price Eyes $0.80 as XLM Faces Two Major Ceilings
XLM trades near $0.1689 after falling from September highs above $0.23, with immediate support around 0.167–0.165.
Analyst identifies $0.2254 as the first resistance, followed by a major 0.45–0.50 zone on the potential path toward $0.80.
RSI remains below 50 and MACD is slightly bearish; a break below $0.165 could extend losses, while reclaiming $0.180 may improve momentum.
Stellar’s XLM token is testing support near $0.17 as analyst Giannis Andreou outlines two resistance levels before a potential move toward $0.80. Andreou identified $0.2254 as the first hurdle, followed by macro resistance between $0.45 and $0.50. Meanwhile, the four-hour chart shows continued selling pressure after XLM’s decline from September highs above $0.23.
XLM Tests Support After Falling From September Highs
XLM traded between $0.21 and $0.23 in late September, briefly moving above $0.23 around September 29. However, momentum weakened in October, pushing the token below $0.21 and $0.20.
A rebound toward $0.205 around October 11 failed to reverse the decline. By mid-October, XLM had dropped below $0.19, while another recovery attempt near $0.187 around October 21 also faded.
The latest four-hour Binance chart shows XLM at $0.1689, up 0.54% on the latest candle. The candle opened at $0.1680, reached $0.1699, and fell to $0.1673. Trading volume stood at 2.03 million XLM.
Source: TradingView
The Relative Strength Index is at 37.36, above its average of 33.43 but below the neutral 50 level. Meanwhile, the MACD line remains slightly below its signal line, with readings of -0.0026 and -0.0025, respectively.
Andreou Identifies $0.2254 as First Resistance
Andreou said XLM’s weekly chart is testing rising support around 0.16–0.17. The recovery would first need to reclaim $0.2254 and break above a steeper descending trendline.
A successful move could bring the 0.45–0.50 macro resistance zone into focus. Andreou’s scenario allows for an initial rejection before another breakout attempt. If XLM later turns that trendline into support, the analyst sees a possible route toward $0.80.
XLM Support Levels Could Shape the Next Move
The four-hour chart places immediate support around 0.167–0.165, followed by $0.160. A break below $0.165 could extend the decline.
However, resistance is around 0.175–0.180, with another barrier between $0.187 and $0.190. A sustained recovery above $0.180 would provide an early sign of improving price momentum. Andreou warned that losing rising support would weaken the recovery setup.
Analyst identifies $0.2254 as the first resistance, followed by a major 0.45–0.50 zone on the potential path toward $0.80.
RSI remains below 50 and MACD is slightly bearish; a break below $0.165 could extend losses, while reclaiming $0.180 may improve momentum.
Stellar’s XLM token is testing support near $0.17 as analyst Giannis Andreou outlines two resistance levels before a potential move toward $0.80. Andreou identified $0.2254 as the first hurdle, followed by macro resistance between $0.45 and $0.50. Meanwhile, the four-hour chart shows continued selling pressure after XLM’s decline from September highs above $0.23.
XLM Tests Support After Falling From September Highs
XLM traded between $0.21 and $0.23 in late September, briefly moving above $0.23 around September 29. However, momentum weakened in October, pushing the token below $0.21 and $0.20.
A rebound toward $0.205 around October 11 failed to reverse the decline. By mid-October, XLM had dropped below $0.19, while another recovery attempt near $0.187 around October 21 also faded.
The latest four-hour Binance chart shows XLM at $0.1689, up 0.54% on the latest candle. The candle opened at $0.1680, reached $0.1699, and fell to $0.1673. Trading volume stood at 2.03 million XLM.
Source: TradingView
The Relative Strength Index is at 37.36, above its average of 33.43 but below the neutral 50 level. Meanwhile, the MACD line remains slightly below its signal line, with readings of -0.0026 and -0.0025, respectively.
Andreou Identifies $0.2254 as First Resistance
Andreou said XLM’s weekly chart is testing rising support around 0.16–0.17. The recovery would first need to reclaim $0.2254 and break above a steeper descending trendline.
A successful move could bring the 0.45–0.50 macro resistance zone into focus. Andreou’s scenario allows for an initial rejection before another breakout attempt. If XLM later turns that trendline into support, the analyst sees a possible route toward $0.80.
XLM Support Levels Could Shape the Next Move
The four-hour chart places immediate support around 0.167–0.165, followed by $0.160. A break below $0.165 could extend the decline.
However, resistance is around 0.175–0.180, with another barrier between $0.187 and $0.190. A sustained recovery above $0.180 would provide an early sign of improving price momentum. Andreou warned that losing rising support would weaken the recovery setup.
72

Статья
Tokenized Assets Surge Toward $40 BillionSupply the chart shows that the total value of tokenized assets increased from $0.7 billion in 2021-$38.8 billion in 2026 year-to-date.
Ondo brings traditional financial products like Treasuries and equities to the tokenized asset space.
Market value alone cannot establish trading activity, investor access, or Ondo’s share of the expanding tokenized asset market.
Total value of tokenized assets increased 500,000-fold, growing from $0.7 billion in 2021 to $38.8 billion in 2026.
Tokenized Assets Record Rapid Market Growth
The chart shows that the growth is steady and begins to rise significantly in 2023.Market value in 2023 was USD 1.7 billion and USD 1 billion in 2022. Total reached $10.1 billion by 2024.
Source: X
The value reported for the increase went up to $25.5 billion in 2025. The YTD total for 2026 is $38.8B. But that is not an actual calendar year.
The biggest increase was in 2024 with a total increase of almost six times. The following year added another $15.4 billion to the reported market value. The latest figure adds $13.3 billion beyond the 2025 total.
These figures describe the market’s reported value rather than its daily trading activity. They also fail to identify the quantity of investors who are trading tokenised financial products. Trading volumes and ownership figures would provide additional context.
Ondo Brings Traditional Financial Products On-Chain
ALLINCRYPTO linked the market’s expansion to Ondo and blockchain-based financial products. The post identified stocks and US Treasuries as examples of assets being tokenized. It described Ondo as a leading participant in this developing market.
Tokenization creates digital representations of assets through blockchain-based systems. Depending on their structure, these products can provide exposure to traditional financial instruments. Their ownership rights and redemption conditions depend on the arrangements governing each offering.
Tokenized Treasuries connect blockchain users with products linked to government debt. Tokenized equities extend similar arrangements to stock-market investments. These products remain distinct from cryptocurrencies because their value relates to underlying financial assets.
Ondo’s position in this sector places its offerings within a growing market. However, the supplied chart does not identify individual issuers or their respective market shares. It therefore cannot establish how much of the reported growth belongs to Ondo.
Market Growth Faces Practical Tests
A higher reported value does not necessarily imply improved liquidity or greater accessibility to investors. There are also products that could have a large stake but do not trade on the secondary market often. Some other people might support other uses, such as lending and using as collateral.
The other factor that investors consider is who the owner of the investment is and how secure the investment is. Redemption procedures and accurate pricing matter when products represent traditional financial assets. Access may also depend on eligibility rules and the jurisdictions involved.
The supplied material does not include a current ONDO token price. It also provides no figures linking token performance directly to the market’s expansion. Those measurements would be needed to assess price movements against sector growth.
The distinction between market expansion and individual project performance remains important. A growing category does not guarantee that every issuer will attract equal demand. Ondo’s position would require separate figures on its products and activity.
The chart shows that the value of the tokenized asset has risen significantly since 2021. This growth was especially marked from 2024. The growth will be determined by how these products meet the needs of investors and financial markets.
Tokenized Assets Surge Toward $40 Billion
Supply the chart shows that the total value of tokenized assets increased from $0.7 billion in 2021-$38.8 billion in 2026 year-to-date.
Ondo brings traditional financial products like Treasuries and equities to the tokenized asset space.
Market value alone cannot establish trading activity, investor access, or Ondo’s share of the expanding tokenized asset market.
Total value of tokenized assets increased 500,000-fold, growing from $0.7 billion in 2021 to $38.8 billion in 2026.
Tokenized Assets Record Rapid Market Growth
The chart shows that the growth is steady and begins to rise significantly in 2023.Market value in 2023 was USD 1.7 billion and USD 1 billion in 2022. Total reached $10.1 billion by 2024.
Source: X
The value reported for the increase went up to $25.5 billion in 2025. The YTD total for 2026 is $38.8B. But that is not an actual calendar year.
The biggest increase was in 2024 with a total increase of almost six times. The following year added another $15.4 billion to the reported market value. The latest figure adds $13.3 billion beyond the 2025 total.
These figures describe the market’s reported value rather than its daily trading activity. They also fail to identify the quantity of investors who are trading tokenised financial products. Trading volumes and ownership figures would provide additional context.
Ondo Brings Traditional Financial Products On-Chain
ALLINCRYPTO linked the market’s expansion to Ondo and blockchain-based financial products. The post identified stocks and US Treasuries as examples of assets being tokenized. It described Ondo as a leading participant in this developing market.
Tokenization creates digital representations of assets through blockchain-based systems. Depending on their structure, these products can provide exposure to traditional financial instruments. Their ownership rights and redemption conditions depend on the arrangements governing each offering.
Tokenized Treasuries connect blockchain users with products linked to government debt. Tokenized equities extend similar arrangements to stock-market investments. These products remain distinct from cryptocurrencies because their value relates to underlying financial assets.
Ondo’s position in this sector places its offerings within a growing market. However, the supplied chart does not identify individual issuers or their respective market shares. It therefore cannot establish how much of the reported growth belongs to Ondo.
Market Growth Faces Practical Tests
A higher reported value does not necessarily imply improved liquidity or greater accessibility to investors. There are also products that could have a large stake but do not trade on the secondary market often. Some other people might support other uses, such as lending and using as collateral.
The other factor that investors consider is who the owner of the investment is and how secure the investment is. Redemption procedures and accurate pricing matter when products represent traditional financial assets. Access may also depend on eligibility rules and the jurisdictions involved.
The supplied material does not include a current ONDO token price. It also provides no figures linking token performance directly to the market’s expansion. Those measurements would be needed to assess price movements against sector growth.
The distinction between market expansion and individual project performance remains important. A growing category does not guarantee that every issuer will attract equal demand. Ondo’s position would require separate figures on its products and activity.
The chart shows that the value of the tokenized asset has risen significantly since 2021. This growth was especially marked from 2024. The growth will be determined by how these products meet the needs of investors and financial markets.
Ondo brings traditional financial products like Treasuries and equities to the tokenized asset space.
Market value alone cannot establish trading activity, investor access, or Ondo’s share of the expanding tokenized asset market.
Total value of tokenized assets increased 500,000-fold, growing from $0.7 billion in 2021 to $38.8 billion in 2026.
Tokenized Assets Record Rapid Market Growth
The chart shows that the growth is steady and begins to rise significantly in 2023.Market value in 2023 was USD 1.7 billion and USD 1 billion in 2022. Total reached $10.1 billion by 2024.
Source: X
The value reported for the increase went up to $25.5 billion in 2025. The YTD total for 2026 is $38.8B. But that is not an actual calendar year.
The biggest increase was in 2024 with a total increase of almost six times. The following year added another $15.4 billion to the reported market value. The latest figure adds $13.3 billion beyond the 2025 total.
These figures describe the market’s reported value rather than its daily trading activity. They also fail to identify the quantity of investors who are trading tokenised financial products. Trading volumes and ownership figures would provide additional context.
Ondo Brings Traditional Financial Products On-Chain
ALLINCRYPTO linked the market’s expansion to Ondo and blockchain-based financial products. The post identified stocks and US Treasuries as examples of assets being tokenized. It described Ondo as a leading participant in this developing market.
Tokenization creates digital representations of assets through blockchain-based systems. Depending on their structure, these products can provide exposure to traditional financial instruments. Their ownership rights and redemption conditions depend on the arrangements governing each offering.
Tokenized Treasuries connect blockchain users with products linked to government debt. Tokenized equities extend similar arrangements to stock-market investments. These products remain distinct from cryptocurrencies because their value relates to underlying financial assets.
Ondo’s position in this sector places its offerings within a growing market. However, the supplied chart does not identify individual issuers or their respective market shares. It therefore cannot establish how much of the reported growth belongs to Ondo.
Market Growth Faces Practical Tests
A higher reported value does not necessarily imply improved liquidity or greater accessibility to investors. There are also products that could have a large stake but do not trade on the secondary market often. Some other people might support other uses, such as lending and using as collateral.
The other factor that investors consider is who the owner of the investment is and how secure the investment is. Redemption procedures and accurate pricing matter when products represent traditional financial assets. Access may also depend on eligibility rules and the jurisdictions involved.
The supplied material does not include a current ONDO token price. It also provides no figures linking token performance directly to the market’s expansion. Those measurements would be needed to assess price movements against sector growth.
The distinction between market expansion and individual project performance remains important. A growing category does not guarantee that every issuer will attract equal demand. Ondo’s position would require separate figures on its products and activity.
The chart shows that the value of the tokenized asset has risen significantly since 2021. This growth was especially marked from 2024. The growth will be determined by how these products meet the needs of investors and financial markets.
185
Статья
Ethena (ENA) Rebounds 8.8% as Analysts Watch $0.25 TargetENA rebounded 8.8% after Arthur Hayes sold 14 million tokens worth about $2.7 million, but the token remains below its 200-day moving average.
CryptoBullet expects a prolonged correction and identifies 0.122–0.172 as a potential buying zone before another sustained breakout.
Crypto Patel targets $0.25 initially, with longer-term levels up to $3; a break above $0.223 could strengthen the recovery outlook.
Ethena’s ENA token has rebounded 8.8% after Arthur Hayes sold 14 million tokens worth approximately $2.7 million. Analysts CryptoBullet and Crypto Patel have outlined different paths for the token, with both tracking potential gains. However, CryptoBullet expects a prolonged correction, while ENA trades near $0.211 below its 200-day moving average.
https://twitter.com/CryptoPatel/status/2112959601834426860?s=20
CryptoBullet Expects a Longer Correction Before Breakout
CryptoBullet said ENA rose fourfold between July and September, describing the rally as a sign of strength. The analyst classified the move as an aggressive five-wave impulse and expects a correction before another sustained breakout.
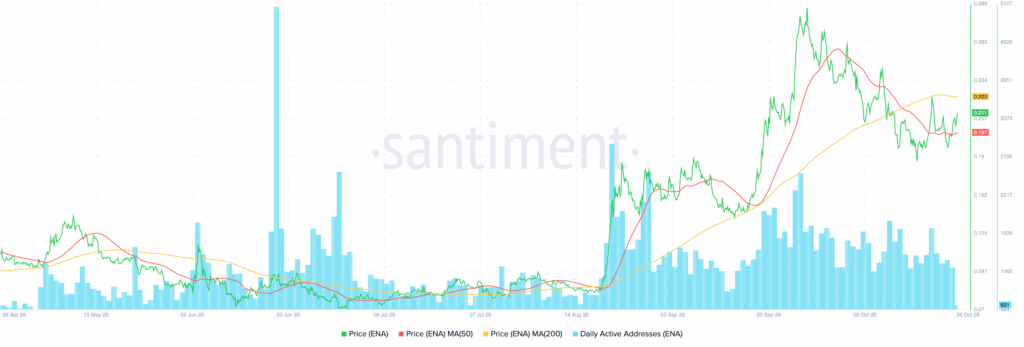
According to CryptoBullet, the pullback so far has not been sufficient. The analyst anticipates a prolonged flat correction and identified 0.122–0.172 as a potential buying zone. Meanwhile, ENA’s chart shows a decline from approximately 0.10–0.13 in late April toward 0.07–0.08 by mid-August.
The token then climbed above $0.10 in late August before accelerating toward $0.285 in September. However, October selling pushed it back toward 0.18–0.20 before the recent recovery.
Crypto Patel Maps ENA Targets From $0.13 to $3
Crypto Patel highlighted a possible trend reversal on the higher-timeframe chart and listed $0.13 and $0.25 as initial price targets. The analyst also identified longer-term targets at $0.50, $0.80, $1.25, and $3.
ENA currently trades around $0.211, above its 50-day moving average near $0.197 but below its 200-day average around $0.223. The latter level remains an important resistance area, while 0.197–0.200 provides near-term support.
ENA Network Activity and Resistance Levels Remain in Focus
The chart records major spikes in daily active addresses during June and the August–September rally. Network activity rose alongside the price advance, although recent readings alone cannot establish sustained adoption.
Source: Santiment
A move above $0.223 could open the way toward resistance between $0.234 and $0.250. Conversely, a break below $0.197 could expose ENA to further downside, with $0.180 representing another support level.
Ethena (ENA) Rebounds 8.8% as Analysts Watch $0.25 Target
ENA rebounded 8.8% after Arthur Hayes sold 14 million tokens worth about $2.7 million, but the token remains below its 200-day moving average.
CryptoBullet expects a prolonged correction and identifies 0.122–0.172 as a potential buying zone before another sustained breakout.
Crypto Patel targets $0.25 initially, with longer-term levels up to $3; a break above $0.223 could strengthen the recovery outlook.
Ethena’s ENA token has rebounded 8.8% after Arthur Hayes sold 14 million tokens worth approximately $2.7 million. Analysts CryptoBullet and Crypto Patel have outlined different paths for the token, with both tracking potential gains. However, CryptoBullet expects a prolonged correction, while ENA trades near $0.211 below its 200-day moving average.
https://twitter.com/CryptoPatel/status/2112959601834426860?s=20
CryptoBullet Expects a Longer Correction Before Breakout
CryptoBullet said ENA rose fourfold between July and September, describing the rally as a sign of strength. The analyst classified the move as an aggressive five-wave impulse and expects a correction before another sustained breakout.
According to CryptoBullet, the pullback so far has not been sufficient. The analyst anticipates a prolonged flat correction and identified 0.122–0.172 as a potential buying zone. Meanwhile, ENA’s chart shows a decline from approximately 0.10–0.13 in late April toward 0.07–0.08 by mid-August.
The token then climbed above $0.10 in late August before accelerating toward $0.285 in September. However, October selling pushed it back toward 0.18–0.20 before the recent recovery.
Crypto Patel Maps ENA Targets From $0.13 to $3
Crypto Patel highlighted a possible trend reversal on the higher-timeframe chart and listed $0.13 and $0.25 as initial price targets. The analyst also identified longer-term targets at $0.50, $0.80, $1.25, and $3.
ENA currently trades around $0.211, above its 50-day moving average near $0.197 but below its 200-day average around $0.223. The latter level remains an important resistance area, while 0.197–0.200 provides near-term support.
ENA Network Activity and Resistance Levels Remain in Focus
The chart records major spikes in daily active addresses during June and the August–September rally. Network activity rose alongside the price advance, although recent readings alone cannot establish sustained adoption.
Source: Santiment
A move above $0.223 could open the way toward resistance between $0.234 and $0.250. Conversely, a break below $0.197 could expose ENA to further downside, with $0.180 representing another support level.
CryptoBullet expects a prolonged correction and identifies 0.122–0.172 as a potential buying zone before another sustained breakout.
Crypto Patel targets $0.25 initially, with longer-term levels up to $3; a break above $0.223 could strengthen the recovery outlook.
Ethena’s ENA token has rebounded 8.8% after Arthur Hayes sold 14 million tokens worth approximately $2.7 million. Analysts CryptoBullet and Crypto Patel have outlined different paths for the token, with both tracking potential gains. However, CryptoBullet expects a prolonged correction, while ENA trades near $0.211 below its 200-day moving average.
https://twitter.com/CryptoPatel/status/2112959601834426860?s=20
CryptoBullet Expects a Longer Correction Before Breakout
CryptoBullet said ENA rose fourfold between July and September, describing the rally as a sign of strength. The analyst classified the move as an aggressive five-wave impulse and expects a correction before another sustained breakout.
According to CryptoBullet, the pullback so far has not been sufficient. The analyst anticipates a prolonged flat correction and identified 0.122–0.172 as a potential buying zone. Meanwhile, ENA’s chart shows a decline from approximately 0.10–0.13 in late April toward 0.07–0.08 by mid-August.
The token then climbed above $0.10 in late August before accelerating toward $0.285 in September. However, October selling pushed it back toward 0.18–0.20 before the recent recovery.
Crypto Patel Maps ENA Targets From $0.13 to $3
Crypto Patel highlighted a possible trend reversal on the higher-timeframe chart and listed $0.13 and $0.25 as initial price targets. The analyst also identified longer-term targets at $0.50, $0.80, $1.25, and $3.
ENA currently trades around $0.211, above its 50-day moving average near $0.197 but below its 200-day average around $0.223. The latter level remains an important resistance area, while 0.197–0.200 provides near-term support.
ENA Network Activity and Resistance Levels Remain in Focus
The chart records major spikes in daily active addresses during June and the August–September rally. Network activity rose alongside the price advance, although recent readings alone cannot establish sustained adoption.
Source: Santiment
A move above $0.223 could open the way toward resistance between $0.234 and $0.250. Conversely, a break below $0.197 could expose ENA to further downside, with $0.180 representing another support level.
121
Статья
XRP Could Fall 22% if Whales Keep Selling, Analyst WarnsXRP wallets holding 10 million–100 million tokens fell from 351 to 339, while exchange balances rose by approximately 50 million XRP.
Ali Charts warns that a break below $1.26 could expose downside targets at $1.11 and $0.98.
XRP trades below its 50-day and 200-day moving averages, while active addresses have fallen to around 23,800 despite holder numbers reaching 8.25 million.
XRP could fall toward $0.98 if large holders continue selling and the price breaks below $1.26, according to analyst Ali Charts. The analyst reported fewer wallets holding between 10 million and 100 million XRP, alongside rising exchange balances. Meanwhile, XRP traded at $1.276 on October 26, below its 50-day moving average.
Whale Wallets Decline as XRP Exchange Balances Increase
Ali Charts reported that wallets holding between 10 million and 100 million XRP declined from 351 to 339 over recent weeks. The drop suggests some large holders may be reducing their exposure.
At the same time, XRP held on exchanges increased from 11.003 billion to approximately 11.05 billion. That represents roughly 50 million additional XRP on trading platforms, where holders could sell their tokens.
Ali Charts identified these changes as part of the bearish scenario, alongside a potential break below $1.26. If that support fails, the analyst sees $1.11 as the next downside level, followed by $0.98. The latter target sits about 22% below $1.26.
XRP Chart Shows Weakness Below Key Moving Averages
XRP’s price declined from around 1.40–1.45 in late April before falling below $1.15 in June. The token briefly approached $1.00 in August, then rallied above $1.50 during mid-August. It reached nearly $1.60 in late September before reversing lower.
Source: Santiment
Since then, XRP has formed lower highs and lower lows. Its price currently sits below the 50-day moving average near $1.31 and the 200-day average around $1.41. These levels represent nearby resistance areas.
Network Activity Falls as Traders Watch $1.26 Support
Daily active addresses surged in mid-August alongside XRP’s rally, but activity later declined. The latest reading stands near 23,800 active addresses. Meanwhile, the total number of XRP holders continued rising, reaching approximately 8.25 million.
The chart identifies 1.25–1.27 as near-term support. A breakdown could expose $1.20 and potentially the August lows near $1.00. However, a recovery above $1.31 could open a move toward 1.38–1.41.
XRP Could Fall 22% if Whales Keep Selling, Analyst Warns
XRP wallets holding 10 million–100 million tokens fell from 351 to 339, while exchange balances rose by approximately 50 million XRP.
Ali Charts warns that a break below $1.26 could expose downside targets at $1.11 and $0.98.
XRP trades below its 50-day and 200-day moving averages, while active addresses have fallen to around 23,800 despite holder numbers reaching 8.25 million.
XRP could fall toward $0.98 if large holders continue selling and the price breaks below $1.26, according to analyst Ali Charts. The analyst reported fewer wallets holding between 10 million and 100 million XRP, alongside rising exchange balances. Meanwhile, XRP traded at $1.276 on October 26, below its 50-day moving average.
Whale Wallets Decline as XRP Exchange Balances Increase
Ali Charts reported that wallets holding between 10 million and 100 million XRP declined from 351 to 339 over recent weeks. The drop suggests some large holders may be reducing their exposure.
At the same time, XRP held on exchanges increased from 11.003 billion to approximately 11.05 billion. That represents roughly 50 million additional XRP on trading platforms, where holders could sell their tokens.
Ali Charts identified these changes as part of the bearish scenario, alongside a potential break below $1.26. If that support fails, the analyst sees $1.11 as the next downside level, followed by $0.98. The latter target sits about 22% below $1.26.
XRP Chart Shows Weakness Below Key Moving Averages
XRP’s price declined from around 1.40–1.45 in late April before falling below $1.15 in June. The token briefly approached $1.00 in August, then rallied above $1.50 during mid-August. It reached nearly $1.60 in late September before reversing lower.
Source: Santiment
Since then, XRP has formed lower highs and lower lows. Its price currently sits below the 50-day moving average near $1.31 and the 200-day average around $1.41. These levels represent nearby resistance areas.
Network Activity Falls as Traders Watch $1.26 Support
Daily active addresses surged in mid-August alongside XRP’s rally, but activity later declined. The latest reading stands near 23,800 active addresses. Meanwhile, the total number of XRP holders continued rising, reaching approximately 8.25 million.
The chart identifies 1.25–1.27 as near-term support. A breakdown could expose $1.20 and potentially the August lows near $1.00. However, a recovery above $1.31 could open a move toward 1.38–1.41.
Ali Charts warns that a break below $1.26 could expose downside targets at $1.11 and $0.98.
XRP trades below its 50-day and 200-day moving averages, while active addresses have fallen to around 23,800 despite holder numbers reaching 8.25 million.
XRP could fall toward $0.98 if large holders continue selling and the price breaks below $1.26, according to analyst Ali Charts. The analyst reported fewer wallets holding between 10 million and 100 million XRP, alongside rising exchange balances. Meanwhile, XRP traded at $1.276 on October 26, below its 50-day moving average.
Whale Wallets Decline as XRP Exchange Balances Increase
Ali Charts reported that wallets holding between 10 million and 100 million XRP declined from 351 to 339 over recent weeks. The drop suggests some large holders may be reducing their exposure.
At the same time, XRP held on exchanges increased from 11.003 billion to approximately 11.05 billion. That represents roughly 50 million additional XRP on trading platforms, where holders could sell their tokens.
Ali Charts identified these changes as part of the bearish scenario, alongside a potential break below $1.26. If that support fails, the analyst sees $1.11 as the next downside level, followed by $0.98. The latter target sits about 22% below $1.26.
XRP Chart Shows Weakness Below Key Moving Averages
XRP’s price declined from around 1.40–1.45 in late April before falling below $1.15 in June. The token briefly approached $1.00 in August, then rallied above $1.50 during mid-August. It reached nearly $1.60 in late September before reversing lower.
Source: Santiment
Since then, XRP has formed lower highs and lower lows. Its price currently sits below the 50-day moving average near $1.31 and the 200-day average around $1.41. These levels represent nearby resistance areas.
Network Activity Falls as Traders Watch $1.26 Support
Daily active addresses surged in mid-August alongside XRP’s rally, but activity later declined. The latest reading stands near 23,800 active addresses. Meanwhile, the total number of XRP holders continued rising, reaching approximately 8.25 million.
The chart identifies 1.25–1.27 as near-term support. A breakdown could expose $1.20 and potentially the August lows near $1.00. However, a recovery above $1.31 could open a move toward 1.38–1.41.
1
1.2k
Статья
Ethereum Market Cap Drops $54B as ETH Tests $2,300Ethereum’s market cap fell by $54 billion in three weeks as total open interest across exchanges dropped to $11.5 billion.
Binance open interest declined by $1.3 billion to $5.7 billion, while Gate, HTX and Bybit also recorded substantial monthly decreases.
ETH trades near $2,304 with bearish RSI and MACD readings; a break below $2,300 could expose $2,250 and $2,200 support.
Ethereum has lost $54 billion in market capitalization over three weeks as ETH fell about 15% and derivatives traders reduced exposure. Analyst Darkfost reported that total Ethereum open interest across exchanges dropped to $11.5 billion. Meanwhile, ETH traded near $2,304.53 on October 26, as technical indicators showed continued selling pressure.
Ethereum Open Interest Falls Across Major Exchanges
Darkfost reported that Ethereum open interest on Binance declined by $1.3 billion in one month, reaching $5.7 billion. Across other platforms, Gate recorded a $995 million decrease, HTX lost $857 million, and Bybit fell by $310 million over 30 days.
Despite the declines, Binance still accounted for 50% of Ethereum’s total open interest. Bybit held 17.5%, while Gate and OKX each accounted for 14.7%. Darkfost attributed the broader decline to falling prices, liquidations, and traders closing positions to reduce risk.
The analyst also noted that open interest fell more sharply in July. That deleveraging period preceded Ethereum’s stabilization and a technical rebound exceeding 32%, which pushed ETH above $2,800 for the first time since January.
ETH Chart Shows Bearish Momentum Near $2,300
The four-hour ETH/USD chart on Binance showed ETH trading at $2,304.53 on October 26, down $13.02, or 0.56%, on the latest candle. Ethereum traded around $2,700 in early October before falling below $2,600 and then $2,500.
Temporary rebounds lifted ETH toward $2,550 around October 12 and $2,510 on October 21. However, sellers regained control, pushing the price toward $2,300.
Source: TradingView
The Relative Strength Index stood at 36.68, below its moving average of 38.42. The MACD line also remained below its signal line, at -25.29 versus -22.21, with a histogram reading of -3.08.
Support Levels Put $2,250 and $2,200 in Focus
Ethereum is testing support near $2,300, with a breakdown potentially exposing $2,250 and $2,200. Resistance is around 2,350–2,400, followed by $2,500. Darkfost described deleveraging as part of the correction process, noting that such periods can bring fear and sometimes precede a final correction phase.
Ethereum Market Cap Drops $54B as ETH Tests $2,300
Ethereum’s market cap fell by $54 billion in three weeks as total open interest across exchanges dropped to $11.5 billion.
Binance open interest declined by $1.3 billion to $5.7 billion, while Gate, HTX and Bybit also recorded substantial monthly decreases.
ETH trades near $2,304 with bearish RSI and MACD readings; a break below $2,300 could expose $2,250 and $2,200 support.
Ethereum has lost $54 billion in market capitalization over three weeks as ETH fell about 15% and derivatives traders reduced exposure. Analyst Darkfost reported that total Ethereum open interest across exchanges dropped to $11.5 billion. Meanwhile, ETH traded near $2,304.53 on October 26, as technical indicators showed continued selling pressure.
Ethereum Open Interest Falls Across Major Exchanges
Darkfost reported that Ethereum open interest on Binance declined by $1.3 billion in one month, reaching $5.7 billion. Across other platforms, Gate recorded a $995 million decrease, HTX lost $857 million, and Bybit fell by $310 million over 30 days.
Despite the declines, Binance still accounted for 50% of Ethereum’s total open interest. Bybit held 17.5%, while Gate and OKX each accounted for 14.7%. Darkfost attributed the broader decline to falling prices, liquidations, and traders closing positions to reduce risk.
The analyst also noted that open interest fell more sharply in July. That deleveraging period preceded Ethereum’s stabilization and a technical rebound exceeding 32%, which pushed ETH above $2,800 for the first time since January.
ETH Chart Shows Bearish Momentum Near $2,300
The four-hour ETH/USD chart on Binance showed ETH trading at $2,304.53 on October 26, down $13.02, or 0.56%, on the latest candle. Ethereum traded around $2,700 in early October before falling below $2,600 and then $2,500.
Temporary rebounds lifted ETH toward $2,550 around October 12 and $2,510 on October 21. However, sellers regained control, pushing the price toward $2,300.
Source: TradingView
The Relative Strength Index stood at 36.68, below its moving average of 38.42. The MACD line also remained below its signal line, at -25.29 versus -22.21, with a histogram reading of -3.08.
Support Levels Put $2,250 and $2,200 in Focus
Ethereum is testing support near $2,300, with a breakdown potentially exposing $2,250 and $2,200. Resistance is around 2,350–2,400, followed by $2,500. Darkfost described deleveraging as part of the correction process, noting that such periods can bring fear and sometimes precede a final correction phase.
Binance open interest declined by $1.3 billion to $5.7 billion, while Gate, HTX and Bybit also recorded substantial monthly decreases.
ETH trades near $2,304 with bearish RSI and MACD readings; a break below $2,300 could expose $2,250 and $2,200 support.
Ethereum has lost $54 billion in market capitalization over three weeks as ETH fell about 15% and derivatives traders reduced exposure. Analyst Darkfost reported that total Ethereum open interest across exchanges dropped to $11.5 billion. Meanwhile, ETH traded near $2,304.53 on October 26, as technical indicators showed continued selling pressure.
Ethereum Open Interest Falls Across Major Exchanges
Darkfost reported that Ethereum open interest on Binance declined by $1.3 billion in one month, reaching $5.7 billion. Across other platforms, Gate recorded a $995 million decrease, HTX lost $857 million, and Bybit fell by $310 million over 30 days.
Despite the declines, Binance still accounted for 50% of Ethereum’s total open interest. Bybit held 17.5%, while Gate and OKX each accounted for 14.7%. Darkfost attributed the broader decline to falling prices, liquidations, and traders closing positions to reduce risk.
The analyst also noted that open interest fell more sharply in July. That deleveraging period preceded Ethereum’s stabilization and a technical rebound exceeding 32%, which pushed ETH above $2,800 for the first time since January.
ETH Chart Shows Bearish Momentum Near $2,300
The four-hour ETH/USD chart on Binance showed ETH trading at $2,304.53 on October 26, down $13.02, or 0.56%, on the latest candle. Ethereum traded around $2,700 in early October before falling below $2,600 and then $2,500.
Temporary rebounds lifted ETH toward $2,550 around October 12 and $2,510 on October 21. However, sellers regained control, pushing the price toward $2,300.
Source: TradingView
The Relative Strength Index stood at 36.68, below its moving average of 38.42. The MACD line also remained below its signal line, at -25.29 versus -22.21, with a histogram reading of -3.08.
Support Levels Put $2,250 and $2,200 in Focus
Ethereum is testing support near $2,300, with a breakdown potentially exposing $2,250 and $2,200. Resistance is around 2,350–2,400, followed by $2,500. Darkfost described deleveraging as part of the correction process, noting that such periods can bring fear and sometimes precede a final correction phase.
1
97
Статья
Bitcoin Whales Hold Back as Retail Deposits Nearly DoubleRetail Bitcoin inflows to Binance nearly doubled to $10.75 billion over 30 days, while whale deposits fell from $5.9 billion to $3.8 billion.
Ali Charts identifies $82,000 as resistance and $72,500 as a potential buying level if Bitcoin’s correction continues.
Bitcoin’s deepest drawdown in the current cycle has reached 7%, compared with declines of 28% or more in previous completed cycles.
Bitcoin faces a potential correction toward $72,500 as analyst Ali Charts tracks a breakdown below a rising channel. Meanwhile, Darkfost’s data shows retail Bitcoin inflows to Binance have reached a six-month high, while whale deposits continue declining. The contrasting trends come as BTC holds above $80,000 and analysts assess drawdowns during the current market cycle.
Retail Bitcoin Inflows Rise as Whale Deposits Decline
According to Darkfost, retail investors’ 30-day Bitcoin inflows to Binance nearly doubled from $5.5 billion to $10.75 billion. The increase marks their highest level in six months, following Bitcoin’s sustained position above $80,000 for several weeks.
Whale inflows have moved in the opposite direction. Their Bitcoin deposits to Binance declined steadily for almost two months, falling from $5.9 billion in late August to $3.8 billion.
Darkfost said retail investors may view the rebound as an opportunity to sell at more comfortable prices after a year-long decline. However, whales have shown less urgency to transfer Bitcoin to exchanges. The analyst said their reduced deposits suggest they are not rushing to distribute holdings at current levels.
Ali Charts Identifies $72,500 as Potential Buying Level
Ali Charts reported that Bitcoin appeared to break below a rising parallel channel on the four-hour chart. The analyst identified $82,000 as resistance and said BTC could continue correcting if that level holds.
https://twitter.com/alicharts/status/2114605513430462861?s=20
Under this scenario, Bitcoin could fall toward $72,500, where Ali Charts plans to look for another buying opportunity.
Darkfost Compares Bitcoin Drawdowns Across Cycles
Darkfost also examined how Bitcoin’s largest drawdowns have changed across market cycles. The first cycle recorded a 93% decline, compared with 35% in the second cycle and 53% during the 2021 cycle.
The most recent completed cycle saw drawdowns remain below 28%. Since the July 1 low, the current cycle’s deepest recorded drawdown has reached 7%.
https://twitter.com/Darkfost_Coc/status/2114478672614940895?s=20
Darkfost described pullbacks as normal during bull markets, when Bitcoin often corrects or trades sideways. The analyst said traders could use these declines to manage exposure during uptrends.
Bitcoin Whales Hold Back as Retail Deposits Nearly Double
Retail Bitcoin inflows to Binance nearly doubled to $10.75 billion over 30 days, while whale deposits fell from $5.9 billion to $3.8 billion.
Ali Charts identifies $82,000 as resistance and $72,500 as a potential buying level if Bitcoin’s correction continues.
Bitcoin’s deepest drawdown in the current cycle has reached 7%, compared with declines of 28% or more in previous completed cycles.
Bitcoin faces a potential correction toward $72,500 as analyst Ali Charts tracks a breakdown below a rising channel. Meanwhile, Darkfost’s data shows retail Bitcoin inflows to Binance have reached a six-month high, while whale deposits continue declining. The contrasting trends come as BTC holds above $80,000 and analysts assess drawdowns during the current market cycle.
Retail Bitcoin Inflows Rise as Whale Deposits Decline
According to Darkfost, retail investors’ 30-day Bitcoin inflows to Binance nearly doubled from $5.5 billion to $10.75 billion. The increase marks their highest level in six months, following Bitcoin’s sustained position above $80,000 for several weeks.
Whale inflows have moved in the opposite direction. Their Bitcoin deposits to Binance declined steadily for almost two months, falling from $5.9 billion in late August to $3.8 billion.
Darkfost said retail investors may view the rebound as an opportunity to sell at more comfortable prices after a year-long decline. However, whales have shown less urgency to transfer Bitcoin to exchanges. The analyst said their reduced deposits suggest they are not rushing to distribute holdings at current levels.
Ali Charts Identifies $72,500 as Potential Buying Level
Ali Charts reported that Bitcoin appeared to break below a rising parallel channel on the four-hour chart. The analyst identified $82,000 as resistance and said BTC could continue correcting if that level holds.
https://twitter.com/alicharts/status/2114605513430462861?s=20
Under this scenario, Bitcoin could fall toward $72,500, where Ali Charts plans to look for another buying opportunity.
Darkfost Compares Bitcoin Drawdowns Across Cycles
Darkfost also examined how Bitcoin’s largest drawdowns have changed across market cycles. The first cycle recorded a 93% decline, compared with 35% in the second cycle and 53% during the 2021 cycle.
The most recent completed cycle saw drawdowns remain below 28%. Since the July 1 low, the current cycle’s deepest recorded drawdown has reached 7%.
https://twitter.com/Darkfost_Coc/status/2114478672614940895?s=20
Darkfost described pullbacks as normal during bull markets, when Bitcoin often corrects or trades sideways. The analyst said traders could use these declines to manage exposure during uptrends.
Ali Charts identifies $82,000 as resistance and $72,500 as a potential buying level if Bitcoin’s correction continues.
Bitcoin’s deepest drawdown in the current cycle has reached 7%, compared with declines of 28% or more in previous completed cycles.
Bitcoin faces a potential correction toward $72,500 as analyst Ali Charts tracks a breakdown below a rising channel. Meanwhile, Darkfost’s data shows retail Bitcoin inflows to Binance have reached a six-month high, while whale deposits continue declining. The contrasting trends come as BTC holds above $80,000 and analysts assess drawdowns during the current market cycle.
Retail Bitcoin Inflows Rise as Whale Deposits Decline
According to Darkfost, retail investors’ 30-day Bitcoin inflows to Binance nearly doubled from $5.5 billion to $10.75 billion. The increase marks their highest level in six months, following Bitcoin’s sustained position above $80,000 for several weeks.
Whale inflows have moved in the opposite direction. Their Bitcoin deposits to Binance declined steadily for almost two months, falling from $5.9 billion in late August to $3.8 billion.
Darkfost said retail investors may view the rebound as an opportunity to sell at more comfortable prices after a year-long decline. However, whales have shown less urgency to transfer Bitcoin to exchanges. The analyst said their reduced deposits suggest they are not rushing to distribute holdings at current levels.
Ali Charts Identifies $72,500 as Potential Buying Level
Ali Charts reported that Bitcoin appeared to break below a rising parallel channel on the four-hour chart. The analyst identified $82,000 as resistance and said BTC could continue correcting if that level holds.
https://twitter.com/alicharts/status/2114605513430462861?s=20
Under this scenario, Bitcoin could fall toward $72,500, where Ali Charts plans to look for another buying opportunity.
Darkfost Compares Bitcoin Drawdowns Across Cycles
Darkfost also examined how Bitcoin’s largest drawdowns have changed across market cycles. The first cycle recorded a 93% decline, compared with 35% in the second cycle and 53% during the 2021 cycle.
The most recent completed cycle saw drawdowns remain below 28%. Since the July 1 low, the current cycle’s deepest recorded drawdown has reached 7%.
https://twitter.com/Darkfost_Coc/status/2114478672614940895?s=20
Darkfost described pullbacks as normal during bull markets, when Bitcoin often corrects or trades sideways. The analyst said traders could use these declines to manage exposure during uptrends.
1
209
Статья
Singapore, Malaysia and Thailand Advance Digital Money UseSingapore’s MAS, Bank Negara Malaysia and the Bank of Thailand will collaborate with industry on cross-border digital money settlement.
BLOOM will address digital money acceptance, cross-border settlement, network interoperability and programmable controls such as identity and sanctions checks.
Ripple, Visa, Mastercard and the World Bank Group are among participants exploring applications across payments, treasury and trade finance.
Singapore, Malaysia and Thailand will work with financial firms on cross-border digital money settlement. The Monetary Authority of Singapore announced BLOOM on October 23. Bank Negara Malaysia and the Bank of Thailand joined as policymaker members. They will help develop approaches for regulated stablecoins and tokenized deposits across institutions and jurisdictions.
https://twitter.com/WuBlockchain/status/2113611009927856338?s=20
BLOOM Sets Out Three Areas of Work
BLOOM stands for Borderless, Liquid, Open, Online, Multi-currency. It brings policymakers, financial institutions, payment networks and technology providers together on cross-border digital money.
The initiative will examine how institutions accept digital money, arrange transactions with counterparties and settle across markets. It will also consider methods for connecting networks and digital money systems.
A third workstream covers programmable controls, including identity checks, sanctions screening and transaction controls. The framework will consider international standards and local supervisory requirements while allowing jurisdictions to retain different rules.
Ripple, Visa and Mastercard Join Participants
MAS said participants include Airwallex, Mastercard, Maybank, Monee, Nium, Ripple, ShopeePay, Visa and the World Bank Group. Their work spans payments, treasury and trade finance, including tokenized deposits, regulated stablecoins and payment-network settlement.
The World Bank Group joins as a multilateral development bank, contributing experience in payment modernization, cross-border payments and financial inclusion, including developing economies' needs.
According to MAS, shared frameworks and aligned commercial arrangements could reduce the need for institutions to negotiate separately with each counterparty or market. Central bank participation will keep public policy and regulatory considerations in the work.
Central Bank Leaders Explain the Initiative
MAS Deputy Managing Director Leong Sing Chiong said digital money will operate across institutions and markets. He said policymakers and industry must address acceptance, settlement and interoperability together.
Bank Negara Malaysia Deputy Governor Aznan bin Abdul Aziz said frictionless cross-border payments using multiple digital currencies were becoming more tangible. He said Malaysia would explore this with central banks and industry partners.
Bank of Thailand Deputy Governor Daranee Saeju welcomed collaboration with MAS on regulatory approaches for tokenized money, especially cross-border payments and wholesale settlement. She said the initiative would examine innovations while keeping oversight prudent, proportionate and responsive to evolving risks.
Singapore, Malaysia and Thailand Advance Digital Money Use
Singapore’s MAS, Bank Negara Malaysia and the Bank of Thailand will collaborate with industry on cross-border digital money settlement.
BLOOM will address digital money acceptance, cross-border settlement, network interoperability and programmable controls such as identity and sanctions checks.
Ripple, Visa, Mastercard and the World Bank Group are among participants exploring applications across payments, treasury and trade finance.
Singapore, Malaysia and Thailand will work with financial firms on cross-border digital money settlement. The Monetary Authority of Singapore announced BLOOM on October 23. Bank Negara Malaysia and the Bank of Thailand joined as policymaker members. They will help develop approaches for regulated stablecoins and tokenized deposits across institutions and jurisdictions.
https://twitter.com/WuBlockchain/status/2113611009927856338?s=20
BLOOM Sets Out Three Areas of Work
BLOOM stands for Borderless, Liquid, Open, Online, Multi-currency. It brings policymakers, financial institutions, payment networks and technology providers together on cross-border digital money.
The initiative will examine how institutions accept digital money, arrange transactions with counterparties and settle across markets. It will also consider methods for connecting networks and digital money systems.
A third workstream covers programmable controls, including identity checks, sanctions screening and transaction controls. The framework will consider international standards and local supervisory requirements while allowing jurisdictions to retain different rules.
Ripple, Visa and Mastercard Join Participants
MAS said participants include Airwallex, Mastercard, Maybank, Monee, Nium, Ripple, ShopeePay, Visa and the World Bank Group. Their work spans payments, treasury and trade finance, including tokenized deposits, regulated stablecoins and payment-network settlement.
The World Bank Group joins as a multilateral development bank, contributing experience in payment modernization, cross-border payments and financial inclusion, including developing economies' needs.
According to MAS, shared frameworks and aligned commercial arrangements could reduce the need for institutions to negotiate separately with each counterparty or market. Central bank participation will keep public policy and regulatory considerations in the work.
Central Bank Leaders Explain the Initiative
MAS Deputy Managing Director Leong Sing Chiong said digital money will operate across institutions and markets. He said policymakers and industry must address acceptance, settlement and interoperability together.
Bank Negara Malaysia Deputy Governor Aznan bin Abdul Aziz said frictionless cross-border payments using multiple digital currencies were becoming more tangible. He said Malaysia would explore this with central banks and industry partners.
Bank of Thailand Deputy Governor Daranee Saeju welcomed collaboration with MAS on regulatory approaches for tokenized money, especially cross-border payments and wholesale settlement. She said the initiative would examine innovations while keeping oversight prudent, proportionate and responsive to evolving risks.
BLOOM will address digital money acceptance, cross-border settlement, network interoperability and programmable controls such as identity and sanctions checks.
Ripple, Visa, Mastercard and the World Bank Group are among participants exploring applications across payments, treasury and trade finance.
Singapore, Malaysia and Thailand will work with financial firms on cross-border digital money settlement. The Monetary Authority of Singapore announced BLOOM on October 23. Bank Negara Malaysia and the Bank of Thailand joined as policymaker members. They will help develop approaches for regulated stablecoins and tokenized deposits across institutions and jurisdictions.
https://twitter.com/WuBlockchain/status/2113611009927856338?s=20
BLOOM Sets Out Three Areas of Work
BLOOM stands for Borderless, Liquid, Open, Online, Multi-currency. It brings policymakers, financial institutions, payment networks and technology providers together on cross-border digital money.
The initiative will examine how institutions accept digital money, arrange transactions with counterparties and settle across markets. It will also consider methods for connecting networks and digital money systems.
A third workstream covers programmable controls, including identity checks, sanctions screening and transaction controls. The framework will consider international standards and local supervisory requirements while allowing jurisdictions to retain different rules.
Ripple, Visa and Mastercard Join Participants
MAS said participants include Airwallex, Mastercard, Maybank, Monee, Nium, Ripple, ShopeePay, Visa and the World Bank Group. Their work spans payments, treasury and trade finance, including tokenized deposits, regulated stablecoins and payment-network settlement.
The World Bank Group joins as a multilateral development bank, contributing experience in payment modernization, cross-border payments and financial inclusion, including developing economies' needs.
According to MAS, shared frameworks and aligned commercial arrangements could reduce the need for institutions to negotiate separately with each counterparty or market. Central bank participation will keep public policy and regulatory considerations in the work.
Central Bank Leaders Explain the Initiative
MAS Deputy Managing Director Leong Sing Chiong said digital money will operate across institutions and markets. He said policymakers and industry must address acceptance, settlement and interoperability together.
Bank Negara Malaysia Deputy Governor Aznan bin Abdul Aziz said frictionless cross-border payments using multiple digital currencies were becoming more tangible. He said Malaysia would explore this with central banks and industry partners.
Bank of Thailand Deputy Governor Daranee Saeju welcomed collaboration with MAS on regulatory approaches for tokenized money, especially cross-border payments and wholesale settlement. She said the initiative would examine innovations while keeping oversight prudent, proportionate and responsive to evolving risks.
320

Статья
HTX Adds Russia to Restricted Jurisdictions After Bitget and MEXCHTX has added Russia to its restricted jurisdictions, potentially limiting account access and withdrawals for affected individuals and businesses.
Bitget and MEXC also restricted Russian market access in October, citing prohibited jurisdictions and regulatory compliance concerns.
Analysts point to rising regulatory and sanctions risks, though there is no evidence of coordinated action among the exchanges.
HTX has added Russia to its restricted jurisdictions, allowing the cryptocurrency exchange to limit services for Russian users. According to Russian business outlet RBC, the restrictions cover individuals residing in or located in Russia, alongside companies registered or primarily operating there. The move follows similar decisions by Bitget and MEXC in October, although HTX’s effective date remains unspecified.
https://twitter.com/WuBlockchain/status/2113804669357310017?s=20
HTX Agreement Allows Account Closures and Withdrawal Suspensions
According to HTX’s user agreement, the exchange may restrict access, suspend withdrawals, or close accounts belonging to affected users. The agreement also allows HTX to change its restricted jurisdictions list without notifying customers individually.
The list includes the United States, the United Kingdom, the European Union, Singapore, Hong Kong, Iran, Syria, and other countries and territories. These restrictions apply to both individuals and businesses meeting the agreement’s location or registration criteria.
HTX maintains separate restrictions on derivatives trading, which involves financial instruments linked to asset price movements. Those limits cover users from Taiwan, Israel, Iraq, Bangladesh, Bolivia, Ecuador, Kyrgyzstan, and New Zealand.
Founded in 2013 as Huobi, the exchange adopted the HTX name in 2023. Its services include spot cryptocurrency trading, futures, other derivatives, blockchain-related services, investments, and cryptocurrency storage.
Bitget and MEXC Also Restrict Russian Market Access
HTX’s decision follows restrictions announced by Bitget and MEXC earlier in October. Bitget added Russia, Belarus, and Kazakhstan to its prohibited jurisdictions list and advised affected clients to withdraw their funds by October 21.
MEXC announced its withdrawal from the Russian and Belarusian markets on October 20. The exchange cited improvements to its regulatory compliance system as the reason for its decision.
Analysts Point to Regulatory and Sanctions Risks
Experts attributed Bitget’s and MEXC’s departures to increased regulatory and sanctions risks. Nikita Zuborev, senior analyst at Bestchange.ru, said other international exchanges could follow, although no signs indicate coordinated action.
RBC did not specify when HTX’s restrictions took effect. The exchange’s agreement states that restricted jurisdictions may change based on its policies and services in each market. It directs users to check the latest information on its platform or within the agreement.
HTX Adds Russia to Restricted Jurisdictions After Bitget and MEXC
HTX has added Russia to its restricted jurisdictions, potentially limiting account access and withdrawals for affected individuals and businesses.
Bitget and MEXC also restricted Russian market access in October, citing prohibited jurisdictions and regulatory compliance concerns.
Analysts point to rising regulatory and sanctions risks, though there is no evidence of coordinated action among the exchanges.
HTX has added Russia to its restricted jurisdictions, allowing the cryptocurrency exchange to limit services for Russian users. According to Russian business outlet RBC, the restrictions cover individuals residing in or located in Russia, alongside companies registered or primarily operating there. The move follows similar decisions by Bitget and MEXC in October, although HTX’s effective date remains unspecified.
https://twitter.com/WuBlockchain/status/2113804669357310017?s=20
HTX Agreement Allows Account Closures and Withdrawal Suspensions
According to HTX’s user agreement, the exchange may restrict access, suspend withdrawals, or close accounts belonging to affected users. The agreement also allows HTX to change its restricted jurisdictions list without notifying customers individually.
The list includes the United States, the United Kingdom, the European Union, Singapore, Hong Kong, Iran, Syria, and other countries and territories. These restrictions apply to both individuals and businesses meeting the agreement’s location or registration criteria.
HTX maintains separate restrictions on derivatives trading, which involves financial instruments linked to asset price movements. Those limits cover users from Taiwan, Israel, Iraq, Bangladesh, Bolivia, Ecuador, Kyrgyzstan, and New Zealand.
Founded in 2013 as Huobi, the exchange adopted the HTX name in 2023. Its services include spot cryptocurrency trading, futures, other derivatives, blockchain-related services, investments, and cryptocurrency storage.
Bitget and MEXC Also Restrict Russian Market Access
HTX’s decision follows restrictions announced by Bitget and MEXC earlier in October. Bitget added Russia, Belarus, and Kazakhstan to its prohibited jurisdictions list and advised affected clients to withdraw their funds by October 21.
MEXC announced its withdrawal from the Russian and Belarusian markets on October 20. The exchange cited improvements to its regulatory compliance system as the reason for its decision.
Analysts Point to Regulatory and Sanctions Risks
Experts attributed Bitget’s and MEXC’s departures to increased regulatory and sanctions risks. Nikita Zuborev, senior analyst at Bestchange.ru, said other international exchanges could follow, although no signs indicate coordinated action.
RBC did not specify when HTX’s restrictions took effect. The exchange’s agreement states that restricted jurisdictions may change based on its policies and services in each market. It directs users to check the latest information on its platform or within the agreement.
Bitget and MEXC also restricted Russian market access in October, citing prohibited jurisdictions and regulatory compliance concerns.
Analysts point to rising regulatory and sanctions risks, though there is no evidence of coordinated action among the exchanges.
HTX has added Russia to its restricted jurisdictions, allowing the cryptocurrency exchange to limit services for Russian users. According to Russian business outlet RBC, the restrictions cover individuals residing in or located in Russia, alongside companies registered or primarily operating there. The move follows similar decisions by Bitget and MEXC in October, although HTX’s effective date remains unspecified.
https://twitter.com/WuBlockchain/status/2113804669357310017?s=20
HTX Agreement Allows Account Closures and Withdrawal Suspensions
According to HTX’s user agreement, the exchange may restrict access, suspend withdrawals, or close accounts belonging to affected users. The agreement also allows HTX to change its restricted jurisdictions list without notifying customers individually.
The list includes the United States, the United Kingdom, the European Union, Singapore, Hong Kong, Iran, Syria, and other countries and territories. These restrictions apply to both individuals and businesses meeting the agreement’s location or registration criteria.
HTX maintains separate restrictions on derivatives trading, which involves financial instruments linked to asset price movements. Those limits cover users from Taiwan, Israel, Iraq, Bangladesh, Bolivia, Ecuador, Kyrgyzstan, and New Zealand.
Founded in 2013 as Huobi, the exchange adopted the HTX name in 2023. Its services include spot cryptocurrency trading, futures, other derivatives, blockchain-related services, investments, and cryptocurrency storage.
Bitget and MEXC Also Restrict Russian Market Access
HTX’s decision follows restrictions announced by Bitget and MEXC earlier in October. Bitget added Russia, Belarus, and Kazakhstan to its prohibited jurisdictions list and advised affected clients to withdraw their funds by October 21.
MEXC announced its withdrawal from the Russian and Belarusian markets on October 20. The exchange cited improvements to its regulatory compliance system as the reason for its decision.
Analysts Point to Regulatory and Sanctions Risks
Experts attributed Bitget’s and MEXC’s departures to increased regulatory and sanctions risks. Nikita Zuborev, senior analyst at Bestchange.ru, said other international exchanges could follow, although no signs indicate coordinated action.
RBC did not specify when HTX’s restrictions took effect. The exchange’s agreement states that restricted jurisdictions may change based on its policies and services in each market. It directs users to check the latest information on its platform or within the agreement.
74
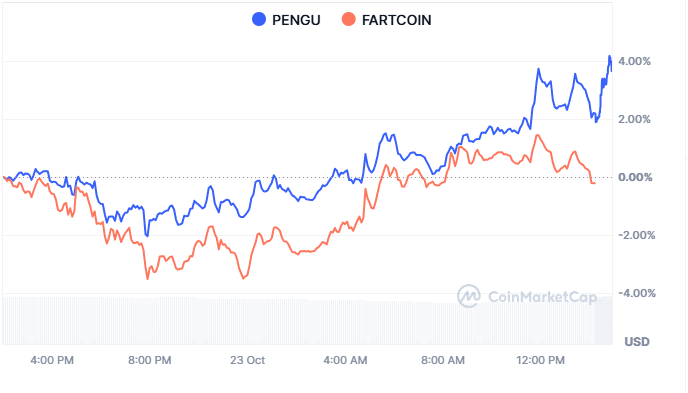
Статья
PENGU Chart Shows Signs of a Possible ReversalPENGU has rebounded twice near the $0.0067–$0.0070 area, raising the possibility of a base after months of downward pressure.
PENGU recovered better from overnight losses and came out with better daily performance in the latest session as compared to FARTCOIN.
A sustained move above nearby resistance could strengthen the reversal case, while renewed selling below support would weaken the current setup.
PENGU is showing signs of a possible reversal after months of selling, with repeated support rebounds and stronger short-term performance.
Repeated Rebounds Put Support in Focus
Pure8 described the PENGU daily chart as interesting, drawing attention to a possible change in price structure. The chart shows a decline from approximately $0.011172, followed by a low near $0.005840. Since then, buyers have pushed the token higher, although the earlier downtrend remains relevant.
Source: X
Two rounded recoveries stand out around the $0.0067–$0.0070 region. Each followed a retreat, with price subsequently climbing away from the lower range. Their resemblance suggests sellers may be losing some control, but two rebounds alone cannot establish a lasting floor.
The latest market data places PENGU near $0.007850, below its previous high. This leaves a considerable distance between the current price and the earlier peak. Buyers must produce further gains before the chart can show a convincing break from its declining structure.
The support region remains important if selling returns. However, a move below around $0.006746 would break the repeated re-bounce pattern, and the more significant low of $0.005840 is lower. If these areas were kept above, the recovery could be given more space to grow.
Resistance and Momentum Will Determine the Next Move
The chart also brings up the possibility of an inverse head and shoulders. Typically three troughs, the middle being lower than the other two. The supplied chart does not set a break above the neckline to confirm.
The first zone of interest is around $0.0078 – $0.0080. The 24-hour high is $0.007961, which brings the token closer to the nearby resistance level. If it continues to move upwards from this range, it will be more convincing that buyers are able to prolong the recovery.
The MACD panel indicates that momentum lines have reached the lower end of their range and are turning up. In addition, the histogram seems to be trending upward from a series of below-average readings. The image, however, does not validate a completed Bullish Cross, so it is not an ending evidence, but rather supporting evidence.
If PENGU hits resistance again, trading will become an issue. The price spike alone is not as strong a sign of a breakout as a breakout with increased volume. On the other hand, if the token rejects close to $0.0080, the token may stall out before another support test.
PENGU Outperforms FARTCOIN in the Latest Session
The comparison chart tracks PENGU in blue and FARTCOIN in orange across the same 24-hour period. Both assets decline during the evening, but FARTCOIN falls further, reaching below negative 3%. PENGU’s lowest reading stays closer to negative 2%, showing relative resilience during the sell-off.
Source: Coinmarketcap
Their paths begin separating more clearly during the overnight recovery. PENGU climbs into positive territory and advances through the morning, while FARTCOIN recovers more unevenly. The gap widens as the blue line rises, indicating stronger percentage performance from PENGU during this period.
PENGU briefly approaches a 4% gain before surrendering part of its advance. It finishes the displayed comparison near a 2% gain, while FARTCOIN falls back toward zero. This difference shows that PENGU retained more of its rebound despite the late pullback.
The accompanying market panel lists PENGU’s market capitalization at approximately $502.29 million. Its 24-hour trading volume stands near $95.15 million as of writing, down 2.44%. The price gain alongside lower volume means the advance did not coincide with rising turnover.
For now, PENGU has a possible reversal structure and stronger short-term performance than FARTCOIN. The next evidence must come from a sustained move above resistance, supported by continued buying. Failure near $0.0080 or a break below recent support would leave the recovery uncertain.
PENGU Chart Shows Signs of a Possible Reversal
PENGU has rebounded twice near the $0.0067–$0.0070 area, raising the possibility of a base after months of downward pressure.
PENGU recovered better from overnight losses and came out with better daily performance in the latest session as compared to FARTCOIN.
A sustained move above nearby resistance could strengthen the reversal case, while renewed selling below support would weaken the current setup.
PENGU is showing signs of a possible reversal after months of selling, with repeated support rebounds and stronger short-term performance.
Repeated Rebounds Put Support in Focus
Pure8 described the PENGU daily chart as interesting, drawing attention to a possible change in price structure. The chart shows a decline from approximately $0.011172, followed by a low near $0.005840. Since then, buyers have pushed the token higher, although the earlier downtrend remains relevant.
Source: X
Two rounded recoveries stand out around the $0.0067–$0.0070 region. Each followed a retreat, with price subsequently climbing away from the lower range. Their resemblance suggests sellers may be losing some control, but two rebounds alone cannot establish a lasting floor.
The latest market data places PENGU near $0.007850, below its previous high. This leaves a considerable distance between the current price and the earlier peak. Buyers must produce further gains before the chart can show a convincing break from its declining structure.
The support region remains important if selling returns. However, a move below around $0.006746 would break the repeated re-bounce pattern, and the more significant low of $0.005840 is lower. If these areas were kept above, the recovery could be given more space to grow.
Resistance and Momentum Will Determine the Next Move
The chart also brings up the possibility of an inverse head and shoulders. Typically three troughs, the middle being lower than the other two. The supplied chart does not set a break above the neckline to confirm.
The first zone of interest is around $0.0078 – $0.0080. The 24-hour high is $0.007961, which brings the token closer to the nearby resistance level. If it continues to move upwards from this range, it will be more convincing that buyers are able to prolong the recovery.
The MACD panel indicates that momentum lines have reached the lower end of their range and are turning up. In addition, the histogram seems to be trending upward from a series of below-average readings. The image, however, does not validate a completed Bullish Cross, so it is not an ending evidence, but rather supporting evidence.
If PENGU hits resistance again, trading will become an issue. The price spike alone is not as strong a sign of a breakout as a breakout with increased volume. On the other hand, if the token rejects close to $0.0080, the token may stall out before another support test.
PENGU Outperforms FARTCOIN in the Latest Session
The comparison chart tracks PENGU in blue and FARTCOIN in orange across the same 24-hour period. Both assets decline during the evening, but FARTCOIN falls further, reaching below negative 3%. PENGU’s lowest reading stays closer to negative 2%, showing relative resilience during the sell-off.
Source: Coinmarketcap
Their paths begin separating more clearly during the overnight recovery. PENGU climbs into positive territory and advances through the morning, while FARTCOIN recovers more unevenly. The gap widens as the blue line rises, indicating stronger percentage performance from PENGU during this period.
PENGU briefly approaches a 4% gain before surrendering part of its advance. It finishes the displayed comparison near a 2% gain, while FARTCOIN falls back toward zero. This difference shows that PENGU retained more of its rebound despite the late pullback.
The accompanying market panel lists PENGU’s market capitalization at approximately $502.29 million. Its 24-hour trading volume stands near $95.15 million as of writing, down 2.44%. The price gain alongside lower volume means the advance did not coincide with rising turnover.
For now, PENGU has a possible reversal structure and stronger short-term performance than FARTCOIN. The next evidence must come from a sustained move above resistance, supported by continued buying. Failure near $0.0080 or a break below recent support would leave the recovery uncertain.
PENGU recovered better from overnight losses and came out with better daily performance in the latest session as compared to FARTCOIN.
A sustained move above nearby resistance could strengthen the reversal case, while renewed selling below support would weaken the current setup.
PENGU is showing signs of a possible reversal after months of selling, with repeated support rebounds and stronger short-term performance.
Repeated Rebounds Put Support in Focus
Pure8 described the PENGU daily chart as interesting, drawing attention to a possible change in price structure. The chart shows a decline from approximately $0.011172, followed by a low near $0.005840. Since then, buyers have pushed the token higher, although the earlier downtrend remains relevant.
Source: X
Two rounded recoveries stand out around the $0.0067–$0.0070 region. Each followed a retreat, with price subsequently climbing away from the lower range. Their resemblance suggests sellers may be losing some control, but two rebounds alone cannot establish a lasting floor.
The latest market data places PENGU near $0.007850, below its previous high. This leaves a considerable distance between the current price and the earlier peak. Buyers must produce further gains before the chart can show a convincing break from its declining structure.
The support region remains important if selling returns. However, a move below around $0.006746 would break the repeated re-bounce pattern, and the more significant low of $0.005840 is lower. If these areas were kept above, the recovery could be given more space to grow.
Resistance and Momentum Will Determine the Next Move
The chart also brings up the possibility of an inverse head and shoulders. Typically three troughs, the middle being lower than the other two. The supplied chart does not set a break above the neckline to confirm.
The first zone of interest is around $0.0078 – $0.0080. The 24-hour high is $0.007961, which brings the token closer to the nearby resistance level. If it continues to move upwards from this range, it will be more convincing that buyers are able to prolong the recovery.
The MACD panel indicates that momentum lines have reached the lower end of their range and are turning up. In addition, the histogram seems to be trending upward from a series of below-average readings. The image, however, does not validate a completed Bullish Cross, so it is not an ending evidence, but rather supporting evidence.
If PENGU hits resistance again, trading will become an issue. The price spike alone is not as strong a sign of a breakout as a breakout with increased volume. On the other hand, if the token rejects close to $0.0080, the token may stall out before another support test.
PENGU Outperforms FARTCOIN in the Latest Session
The comparison chart tracks PENGU in blue and FARTCOIN in orange across the same 24-hour period. Both assets decline during the evening, but FARTCOIN falls further, reaching below negative 3%. PENGU’s lowest reading stays closer to negative 2%, showing relative resilience during the sell-off.
Source: Coinmarketcap
Their paths begin separating more clearly during the overnight recovery. PENGU climbs into positive territory and advances through the morning, while FARTCOIN recovers more unevenly. The gap widens as the blue line rises, indicating stronger percentage performance from PENGU during this period.
PENGU briefly approaches a 4% gain before surrendering part of its advance. It finishes the displayed comparison near a 2% gain, while FARTCOIN falls back toward zero. This difference shows that PENGU retained more of its rebound despite the late pullback.
The accompanying market panel lists PENGU’s market capitalization at approximately $502.29 million. Its 24-hour trading volume stands near $95.15 million as of writing, down 2.44%. The price gain alongside lower volume means the advance did not coincide with rising turnover.
For now, PENGU has a possible reversal structure and stronger short-term performance than FARTCOIN. The next evidence must come from a sustained move above resistance, supported by continued buying. Failure near $0.0080 or a break below recent support would leave the recovery uncertain.
478
Статья
Ethereum Faces $2,300 Test as Glamsterdam Nears TestnetETH trades near $2,335 with RSI at 38.93 and a negative MACD histogram, while support is around 2,300–2,330.
Michael van de Poppe identifies $2,320 and $2,230 as potential long-entry levels if Ethereum faces further downside.
Crypto Patel highlights $0.004 gas fees as Glamsterdam approaches a Hoodi testnet milestone, with security and compatibility still under review.
Ethereum trades near $2,335 as bearish momentum pushes ETH toward $2,300 support, while analysts watch potential entry levels and network developments. Michael van de Poppe identified $2,320 and $2,230 as possible long positions during market weakness. Meanwhile, Crypto Patel highlighted $0.004 gas fees, while developers approach a Glamsterdam testnet milestone.
ETH Tests Support as Technical Indicators Remain Bearish
The four-hour ETH/USD chart on Binance shows Ethereum down 0.45% on the latest candle, trading at $2,335.30. The candle opened at $2,332.06, reached $2,335.30, and recorded a low of $2,332.05.
Source: TradingView
Ethereum traded between $2,650 and $2,750 during late September and early October, briefly approaching $2,780. However, a breakdown around October 7 pushed ETH below $2,600 and toward $2,430. A rebound near October 12 lifted the price toward $2,550, but the recovery failed to hold.
Further selling in mid-October drove ETH toward $2,350. Another rebound reached approximately $2,500 around October 21 before sellers pushed prices lower again. The Relative Strength Index is at 38.93, below its signal average of 40.47.
Meanwhile, the MACD line is at -22.04, below the -18.52 signal line, with a negative histogram of -3.52. Immediate support sits between $2,300 and $2,330, while resistance appears around 2,400–2,430. A further decline could expose $2,250.
Van de Poppe Identifies Two Potential ETH Entry Levels
As Bitcoin falls and market fear increases, Michael van de Poppe highlighted two Ethereum price levels. He described prices below $2,320 as an interesting area for long positions.
He also identified approximately $2,230 as another potential entry if markets experience a deeper price wick. These levels place his analysis below Ethereum’s current price of $2,335.30.
Crypto Patel Highlights Low Fees as Glamsterdam Nears
Crypto Patel reported Ethereum gas fees had fallen to $0.004, raising questions about the network’s transaction costs compared with Solana. The analyst pointed to low fees and expanding Layer-2 adoption while questioning whether Ethereum could maintain those costs during periods of rising demand.
https://twitter.com/CryptoPatel/status/2114016567268929924?s=20
Separately, Glamsterdam is approaching a Hoodi testnet milestone. The upgrade discussion focuses on the changes developers are testing, potential security or compatibility risks, and whether the changes deliver their intended improvements.
Ethereum Faces $2,300 Test as Glamsterdam Nears Testnet
ETH trades near $2,335 with RSI at 38.93 and a negative MACD histogram, while support is around 2,300–2,330.
Michael van de Poppe identifies $2,320 and $2,230 as potential long-entry levels if Ethereum faces further downside.
Crypto Patel highlights $0.004 gas fees as Glamsterdam approaches a Hoodi testnet milestone, with security and compatibility still under review.
Ethereum trades near $2,335 as bearish momentum pushes ETH toward $2,300 support, while analysts watch potential entry levels and network developments. Michael van de Poppe identified $2,320 and $2,230 as possible long positions during market weakness. Meanwhile, Crypto Patel highlighted $0.004 gas fees, while developers approach a Glamsterdam testnet milestone.
ETH Tests Support as Technical Indicators Remain Bearish
The four-hour ETH/USD chart on Binance shows Ethereum down 0.45% on the latest candle, trading at $2,335.30. The candle opened at $2,332.06, reached $2,335.30, and recorded a low of $2,332.05.
Source: TradingView
Ethereum traded between $2,650 and $2,750 during late September and early October, briefly approaching $2,780. However, a breakdown around October 7 pushed ETH below $2,600 and toward $2,430. A rebound near October 12 lifted the price toward $2,550, but the recovery failed to hold.
Further selling in mid-October drove ETH toward $2,350. Another rebound reached approximately $2,500 around October 21 before sellers pushed prices lower again. The Relative Strength Index is at 38.93, below its signal average of 40.47.
Meanwhile, the MACD line is at -22.04, below the -18.52 signal line, with a negative histogram of -3.52. Immediate support sits between $2,300 and $2,330, while resistance appears around 2,400–2,430. A further decline could expose $2,250.
Van de Poppe Identifies Two Potential ETH Entry Levels
As Bitcoin falls and market fear increases, Michael van de Poppe highlighted two Ethereum price levels. He described prices below $2,320 as an interesting area for long positions.
He also identified approximately $2,230 as another potential entry if markets experience a deeper price wick. These levels place his analysis below Ethereum’s current price of $2,335.30.
Crypto Patel Highlights Low Fees as Glamsterdam Nears
Crypto Patel reported Ethereum gas fees had fallen to $0.004, raising questions about the network’s transaction costs compared with Solana. The analyst pointed to low fees and expanding Layer-2 adoption while questioning whether Ethereum could maintain those costs during periods of rising demand.
https://twitter.com/CryptoPatel/status/2114016567268929924?s=20
Separately, Glamsterdam is approaching a Hoodi testnet milestone. The upgrade discussion focuses on the changes developers are testing, potential security or compatibility risks, and whether the changes deliver their intended improvements.
Michael van de Poppe identifies $2,320 and $2,230 as potential long-entry levels if Ethereum faces further downside.
Crypto Patel highlights $0.004 gas fees as Glamsterdam approaches a Hoodi testnet milestone, with security and compatibility still under review.
Ethereum trades near $2,335 as bearish momentum pushes ETH toward $2,300 support, while analysts watch potential entry levels and network developments. Michael van de Poppe identified $2,320 and $2,230 as possible long positions during market weakness. Meanwhile, Crypto Patel highlighted $0.004 gas fees, while developers approach a Glamsterdam testnet milestone.
ETH Tests Support as Technical Indicators Remain Bearish
The four-hour ETH/USD chart on Binance shows Ethereum down 0.45% on the latest candle, trading at $2,335.30. The candle opened at $2,332.06, reached $2,335.30, and recorded a low of $2,332.05.
Source: TradingView
Ethereum traded between $2,650 and $2,750 during late September and early October, briefly approaching $2,780. However, a breakdown around October 7 pushed ETH below $2,600 and toward $2,430. A rebound near October 12 lifted the price toward $2,550, but the recovery failed to hold.
Further selling in mid-October drove ETH toward $2,350. Another rebound reached approximately $2,500 around October 21 before sellers pushed prices lower again. The Relative Strength Index is at 38.93, below its signal average of 40.47.
Meanwhile, the MACD line is at -22.04, below the -18.52 signal line, with a negative histogram of -3.52. Immediate support sits between $2,300 and $2,330, while resistance appears around 2,400–2,430. A further decline could expose $2,250.
Van de Poppe Identifies Two Potential ETH Entry Levels
As Bitcoin falls and market fear increases, Michael van de Poppe highlighted two Ethereum price levels. He described prices below $2,320 as an interesting area for long positions.
He also identified approximately $2,230 as another potential entry if markets experience a deeper price wick. These levels place his analysis below Ethereum’s current price of $2,335.30.
Crypto Patel Highlights Low Fees as Glamsterdam Nears
Crypto Patel reported Ethereum gas fees had fallen to $0.004, raising questions about the network’s transaction costs compared with Solana. The analyst pointed to low fees and expanding Layer-2 adoption while questioning whether Ethereum could maintain those costs during periods of rising demand.
https://twitter.com/CryptoPatel/status/2114016567268929924?s=20
Separately, Glamsterdam is approaching a Hoodi testnet milestone. The upgrade discussion focuses on the changes developers are testing, potential security or compatibility risks, and whether the changes deliver their intended improvements.
165
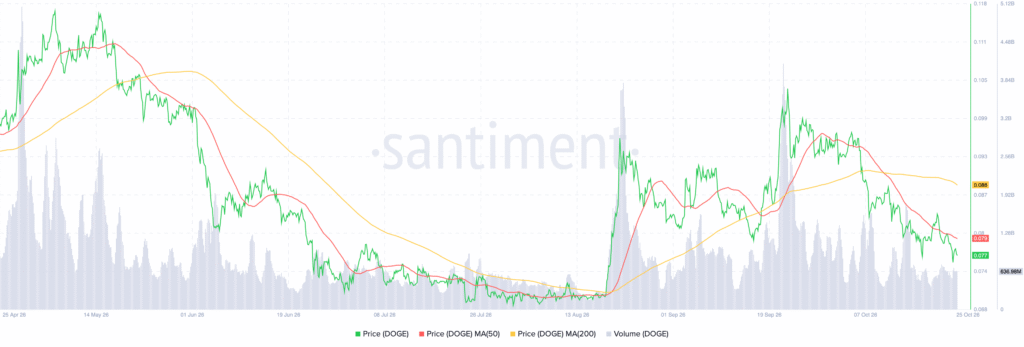
Статья
Dogecoin Eyes $0.70 as Analysts Track Breakout Patterns and Key ResistanceDOGE trades near $0.077, below its 50-day and 200-day moving averages, with immediate support between $0.075 and $0.077.
Giannis Andreou sees a potential path toward $0.70 if DOGE defends 0.07–0.08 and breaks successive resistance levels.
Trader Tardigrade compares Dogecoin’s monthly chart with its 2015–2017 structure, suggesting a possible breakout without setting a target date.
Dogecoin trades near $0.077 after October losses erased much of its August and September recovery, while analysts track potential longer-term breakout patterns. Giannis Andreou outlined a possible path toward $0.70 if DOGE clears several resistance levels. Meanwhile, Trader Tardigrade compared Dogecoin’s monthly structure with its 2015–2017 price pattern.
DOGE Chart Shows Pressure Near $0.075 Support
Dogecoin climbed toward $0.117 in late April and May before falling sharply in June. The decline continued through July and early August, bringing DOGE toward 0.070–0.072.
Source: Santiment
A recovery began in mid-August, lifting the price from approximately $0.071 to $0.093. Another rally briefly pushed DOGE above $0.100 in late September. However, selling intensified during October, taking the price below $0.093 and $0.087.
The latest chart places DOGE around $0.077, below its 50-day moving average at $0.079 and 200-day moving average at $0.088. The 50-day average also remains below the 200-day average, reflecting the current bearish structure.
Immediate support lies between $0.075 and $0.077, followed by 0.070–0.072. Resistance is around 0.079–0.080, with another barrier near 0.087–0.088. Trading volume increased during June’s decline and the August–September rallies, although those rallies failed to sustain their gains.
Giannis Andreou Maps a Potential Route Toward $0.70
Andreou said DOGE broke above a steeper descending trendline on the weekly chart, although the broader downtrend remains overhead. He identified 0.07–0.08 as the base DOGE needs to defend for a recovery toward $0.20.
Beyond that level, resistance is at $0.2795. A breakout above the broader trendline, followed by a successful retest, could open a path toward $0.4837. Holding that level as support would place 0.70–0.7372 in focus. However, losing the recent base would weaken this scenario.
https://twitter.com/TATrader_Alan/status/2113940822056149482?s=20
Trader Tardigrade said Dogecoin’s monthly chart resembles its 2015–2017 pattern, featuring a prolonged base followed by a falling wedge. The analyst suggested another breakout could occur, without specifying a date or price target.
Dogecoin Eyes $0.70 as Analysts Track Breakout Patterns and Key Resistance
DOGE trades near $0.077, below its 50-day and 200-day moving averages, with immediate support between $0.075 and $0.077.
Giannis Andreou sees a potential path toward $0.70 if DOGE defends 0.07–0.08 and breaks successive resistance levels.
Trader Tardigrade compares Dogecoin’s monthly chart with its 2015–2017 structure, suggesting a possible breakout without setting a target date.
Dogecoin trades near $0.077 after October losses erased much of its August and September recovery, while analysts track potential longer-term breakout patterns. Giannis Andreou outlined a possible path toward $0.70 if DOGE clears several resistance levels. Meanwhile, Trader Tardigrade compared Dogecoin’s monthly structure with its 2015–2017 price pattern.
DOGE Chart Shows Pressure Near $0.075 Support
Dogecoin climbed toward $0.117 in late April and May before falling sharply in June. The decline continued through July and early August, bringing DOGE toward 0.070–0.072.
Source: Santiment
A recovery began in mid-August, lifting the price from approximately $0.071 to $0.093. Another rally briefly pushed DOGE above $0.100 in late September. However, selling intensified during October, taking the price below $0.093 and $0.087.
The latest chart places DOGE around $0.077, below its 50-day moving average at $0.079 and 200-day moving average at $0.088. The 50-day average also remains below the 200-day average, reflecting the current bearish structure.
Immediate support lies between $0.075 and $0.077, followed by 0.070–0.072. Resistance is around 0.079–0.080, with another barrier near 0.087–0.088. Trading volume increased during June’s decline and the August–September rallies, although those rallies failed to sustain their gains.
Giannis Andreou Maps a Potential Route Toward $0.70
Andreou said DOGE broke above a steeper descending trendline on the weekly chart, although the broader downtrend remains overhead. He identified 0.07–0.08 as the base DOGE needs to defend for a recovery toward $0.20.
Beyond that level, resistance is at $0.2795. A breakout above the broader trendline, followed by a successful retest, could open a path toward $0.4837. Holding that level as support would place 0.70–0.7372 in focus. However, losing the recent base would weaken this scenario.
https://twitter.com/TATrader_Alan/status/2113940822056149482?s=20
Trader Tardigrade said Dogecoin’s monthly chart resembles its 2015–2017 pattern, featuring a prolonged base followed by a falling wedge. The analyst suggested another breakout could occur, without specifying a date or price target.
Giannis Andreou sees a potential path toward $0.70 if DOGE defends 0.07–0.08 and breaks successive resistance levels.
Trader Tardigrade compares Dogecoin’s monthly chart with its 2015–2017 structure, suggesting a possible breakout without setting a target date.
Dogecoin trades near $0.077 after October losses erased much of its August and September recovery, while analysts track potential longer-term breakout patterns. Giannis Andreou outlined a possible path toward $0.70 if DOGE clears several resistance levels. Meanwhile, Trader Tardigrade compared Dogecoin’s monthly structure with its 2015–2017 price pattern.
DOGE Chart Shows Pressure Near $0.075 Support
Dogecoin climbed toward $0.117 in late April and May before falling sharply in June. The decline continued through July and early August, bringing DOGE toward 0.070–0.072.
Source: Santiment
A recovery began in mid-August, lifting the price from approximately $0.071 to $0.093. Another rally briefly pushed DOGE above $0.100 in late September. However, selling intensified during October, taking the price below $0.093 and $0.087.
The latest chart places DOGE around $0.077, below its 50-day moving average at $0.079 and 200-day moving average at $0.088. The 50-day average also remains below the 200-day average, reflecting the current bearish structure.
Immediate support lies between $0.075 and $0.077, followed by 0.070–0.072. Resistance is around 0.079–0.080, with another barrier near 0.087–0.088. Trading volume increased during June’s decline and the August–September rallies, although those rallies failed to sustain their gains.
Giannis Andreou Maps a Potential Route Toward $0.70
Andreou said DOGE broke above a steeper descending trendline on the weekly chart, although the broader downtrend remains overhead. He identified 0.07–0.08 as the base DOGE needs to defend for a recovery toward $0.20.
Beyond that level, resistance is at $0.2795. A breakout above the broader trendline, followed by a successful retest, could open a path toward $0.4837. Holding that level as support would place 0.70–0.7372 in focus. However, losing the recent base would weaken this scenario.
https://twitter.com/TATrader_Alan/status/2113940822056149482?s=20
Trader Tardigrade said Dogecoin’s monthly chart resembles its 2015–2017 pattern, featuring a prolonged base followed by a falling wedge. The analyst suggested another breakout could occur, without specifying a date or price target.
2
434
Статья
Bitcoin Long-Term Holders Sell as BTC Tests $80K SupportBitcoin long-term holder supply has fallen by 300,000 BTC since August, with its 30-day average change reaching minus 195,000 BTC.
BTC trades near $80,535 as RSI remains below 50 and MACD stays negative, reflecting weak momentum and continued selling pressure.
Bitcoin faces support at $80,000 and $79,000, while reclaiming $82,000 could open a recovery toward 83,000–84,000.
Bitcoin is approaching $80,000 as long-term holders reduce their holdings, adding selling pressure to an already weakening market. Analyst Darkfost reported that long-term holder supply has fallen by 300,000 BTC since August, while its 30-day average change stands at minus 195,000 BTC. Meanwhile, Bitcoin’s four-hour chart shows repeated resistance rejections and weak momentum.
Long-Term Holder Supply Declines Despite Earlier Growth
Darkfost said approximately 15.6 million BTC currently belong to long-term holders, defined as investors holding coins for more than 155 days. In December 2025, this group held around 14 million BTC, meaning another 1.6 million BTC have since entered the category.
However, long-term holder supply has declined by 300,000 BTC since August as Bitcoin rebounded. Darkfost said these holders generally sell less readily than short-term holders, but recent outflows indicate some have taken profits.
The 30-day average supply change now stands at minus 195,000 BTC. This means long-term holders are selling more Bitcoin than the amount entering their cohort through the 155-day holding threshold.
Bitcoin Price Slides Toward $80,000 Support
Bitcoin traded between $83,000 and $86,000 in late September, briefly approaching $87,000. However, selling intensified around October 6–9, pushing BTC toward $81,000. A recovery toward $84,000 between October 19 and 21 failed to hold.
By October 25, Bitcoin approached $80,000, with a sharp wick briefly extending below $79,000 before prices recovered modestly. The latest four-hour candle showed BTC at $80,535.56, down 0.51%. It opened at $80,805.42, reached $80,900.51 and dropped to $80,404.82.
Technical Indicators Show Weak Momentum
Bitcoin’s Relative Strength Index is at 41.79, above its 40.21 moving average but below the neutral 50 threshold. This indicates weak momentum despite a possible short-term recovery attempt.
Source: TradingView
The MACD line remains at minus 479.10, below the signal line at minus 420.24. Its histogram reads minus 58.86, reflecting continued downward momentum.
Immediate support is around $80,000, followed by $79,000. A break below those levels could expose further downside, while reclaiming $82,000 could open a recovery toward 83,000–84,000.
Bitcoin Long-Term Holders Sell as BTC Tests $80K Support
Bitcoin long-term holder supply has fallen by 300,000 BTC since August, with its 30-day average change reaching minus 195,000 BTC.
BTC trades near $80,535 as RSI remains below 50 and MACD stays negative, reflecting weak momentum and continued selling pressure.
Bitcoin faces support at $80,000 and $79,000, while reclaiming $82,000 could open a recovery toward 83,000–84,000.
Bitcoin is approaching $80,000 as long-term holders reduce their holdings, adding selling pressure to an already weakening market. Analyst Darkfost reported that long-term holder supply has fallen by 300,000 BTC since August, while its 30-day average change stands at minus 195,000 BTC. Meanwhile, Bitcoin’s four-hour chart shows repeated resistance rejections and weak momentum.
Long-Term Holder Supply Declines Despite Earlier Growth
Darkfost said approximately 15.6 million BTC currently belong to long-term holders, defined as investors holding coins for more than 155 days. In December 2025, this group held around 14 million BTC, meaning another 1.6 million BTC have since entered the category.
However, long-term holder supply has declined by 300,000 BTC since August as Bitcoin rebounded. Darkfost said these holders generally sell less readily than short-term holders, but recent outflows indicate some have taken profits.
The 30-day average supply change now stands at minus 195,000 BTC. This means long-term holders are selling more Bitcoin than the amount entering their cohort through the 155-day holding threshold.
Bitcoin Price Slides Toward $80,000 Support
Bitcoin traded between $83,000 and $86,000 in late September, briefly approaching $87,000. However, selling intensified around October 6–9, pushing BTC toward $81,000. A recovery toward $84,000 between October 19 and 21 failed to hold.
By October 25, Bitcoin approached $80,000, with a sharp wick briefly extending below $79,000 before prices recovered modestly. The latest four-hour candle showed BTC at $80,535.56, down 0.51%. It opened at $80,805.42, reached $80,900.51 and dropped to $80,404.82.
Technical Indicators Show Weak Momentum
Bitcoin’s Relative Strength Index is at 41.79, above its 40.21 moving average but below the neutral 50 threshold. This indicates weak momentum despite a possible short-term recovery attempt.
Source: TradingView
The MACD line remains at minus 479.10, below the signal line at minus 420.24. Its histogram reads minus 58.86, reflecting continued downward momentum.
Immediate support is around $80,000, followed by $79,000. A break below those levels could expose further downside, while reclaiming $82,000 could open a recovery toward 83,000–84,000.
BTC trades near $80,535 as RSI remains below 50 and MACD stays negative, reflecting weak momentum and continued selling pressure.
Bitcoin faces support at $80,000 and $79,000, while reclaiming $82,000 could open a recovery toward 83,000–84,000.
Bitcoin is approaching $80,000 as long-term holders reduce their holdings, adding selling pressure to an already weakening market. Analyst Darkfost reported that long-term holder supply has fallen by 300,000 BTC since August, while its 30-day average change stands at minus 195,000 BTC. Meanwhile, Bitcoin’s four-hour chart shows repeated resistance rejections and weak momentum.
Long-Term Holder Supply Declines Despite Earlier Growth
Darkfost said approximately 15.6 million BTC currently belong to long-term holders, defined as investors holding coins for more than 155 days. In December 2025, this group held around 14 million BTC, meaning another 1.6 million BTC have since entered the category.
However, long-term holder supply has declined by 300,000 BTC since August as Bitcoin rebounded. Darkfost said these holders generally sell less readily than short-term holders, but recent outflows indicate some have taken profits.
The 30-day average supply change now stands at minus 195,000 BTC. This means long-term holders are selling more Bitcoin than the amount entering their cohort through the 155-day holding threshold.
Bitcoin Price Slides Toward $80,000 Support
Bitcoin traded between $83,000 and $86,000 in late September, briefly approaching $87,000. However, selling intensified around October 6–9, pushing BTC toward $81,000. A recovery toward $84,000 between October 19 and 21 failed to hold.
By October 25, Bitcoin approached $80,000, with a sharp wick briefly extending below $79,000 before prices recovered modestly. The latest four-hour candle showed BTC at $80,535.56, down 0.51%. It opened at $80,805.42, reached $80,900.51 and dropped to $80,404.82.
Technical Indicators Show Weak Momentum
Bitcoin’s Relative Strength Index is at 41.79, above its 40.21 moving average but below the neutral 50 threshold. This indicates weak momentum despite a possible short-term recovery attempt.
Source: TradingView
The MACD line remains at minus 479.10, below the signal line at minus 420.24. Its histogram reads minus 58.86, reflecting continued downward momentum.
Immediate support is around $80,000, followed by $79,000. A break below those levels could expose further downside, while reclaiming $82,000 could open a recovery toward 83,000–84,000.
581

Статья
Cardano Risks 20% Drop as ADA Breaks Key Support, Says AnalystAnalyst warns ADA could fall 20% toward $0.166 if $0.220 resistance holds following a breakdown below its rising price channel.
Cardano’s RSI sits at 34.77 and MACD remains negative, signaling continued selling pressure as ADA trades near $0.2056.
Germany’s DZ BANK includes Cardano alongside Bitcoin, Ethereum and Litecoin on meinKrypto, subject to participating banks’ adoption decisions.
Cardano faces a potential 20% decline toward $0.166 after analyst Ali Charts reported a breakdown below its rising price channel. ADA also continues to trade near $0.20, with bearish momentum appearing across its four-hour chart. Meanwhile, Germany’s DZ BANK has included Cardano among four cryptocurrencies available through its meinKrypto platform.
Ali Charts Identifies $0.220 as Resistance
Ali Charts said ADA traded inside a rising parallel channel from late June, climbing from $0.138 to $0.282. However, the token has now fallen below the channel’s lower boundary, raising the possibility of a deeper correction.
The analyst identified $0.220 as the level that could limit recovery attempts. If that price continues to act as resistance, ADA could decline approximately 20% toward $0.166.
Recent price action supports the reported weakness. ADA previously traded around 0.24–0.26 before reaching approximately $0.28 around October 6. It then fell below $0.25, $0.24 and $0.23, forming lower highs and lower lows.
A recovery toward $0.23 around October 21 failed, and renewed selling pushed the price toward $0.20. The latest four-hour candle closed at $0.2056, down 1.15%, with volume reaching 4.44 million ADA.
RSI and MACD Show Continued Selling Pressure
ADA’s Relative Strength Index is at 34.77, below its moving average of 37.40. The reading places momentum near the oversold threshold of 30, although it has not crossed that level.
Source: TradingView
The MACD line is at -0.0038, below its -0.0033 signal line. Its histogram reads -0.0005, indicating continued downside momentum. Immediate support lies between $0.2040 and $0.2000, while resistance stands around 0.22–0.23. A recovery above $0.21 could provide initial relief.
DZ BANK Adds Cardano to Its Crypto Offering
Separately, DZ BANK’s meinKrypto platform selected ADA alongside Bitcoin, Ethereum and Litecoin for its initial offering. The MiCA-authorized service integrates cryptocurrency trading and custody into the VR Banking App.
https://twitter.com/gandreou007/status/2113963717742203371?s=20
Participating cooperative banks can offer the service through existing banking infrastructure. However, each bank must decide whether to adopt it and complete the required regulatory notification.
Cardano Risks 20% Drop as ADA Breaks Key Support, Says Analyst
Analyst warns ADA could fall 20% toward $0.166 if $0.220 resistance holds following a breakdown below its rising price channel.
Cardano’s RSI sits at 34.77 and MACD remains negative, signaling continued selling pressure as ADA trades near $0.2056.
Germany’s DZ BANK includes Cardano alongside Bitcoin, Ethereum and Litecoin on meinKrypto, subject to participating banks’ adoption decisions.
Cardano faces a potential 20% decline toward $0.166 after analyst Ali Charts reported a breakdown below its rising price channel. ADA also continues to trade near $0.20, with bearish momentum appearing across its four-hour chart. Meanwhile, Germany’s DZ BANK has included Cardano among four cryptocurrencies available through its meinKrypto platform.
Ali Charts Identifies $0.220 as Resistance
Ali Charts said ADA traded inside a rising parallel channel from late June, climbing from $0.138 to $0.282. However, the token has now fallen below the channel’s lower boundary, raising the possibility of a deeper correction.
The analyst identified $0.220 as the level that could limit recovery attempts. If that price continues to act as resistance, ADA could decline approximately 20% toward $0.166.
Recent price action supports the reported weakness. ADA previously traded around 0.24–0.26 before reaching approximately $0.28 around October 6. It then fell below $0.25, $0.24 and $0.23, forming lower highs and lower lows.
A recovery toward $0.23 around October 21 failed, and renewed selling pushed the price toward $0.20. The latest four-hour candle closed at $0.2056, down 1.15%, with volume reaching 4.44 million ADA.
RSI and MACD Show Continued Selling Pressure
ADA’s Relative Strength Index is at 34.77, below its moving average of 37.40. The reading places momentum near the oversold threshold of 30, although it has not crossed that level.
Source: TradingView
The MACD line is at -0.0038, below its -0.0033 signal line. Its histogram reads -0.0005, indicating continued downside momentum. Immediate support lies between $0.2040 and $0.2000, while resistance stands around 0.22–0.23. A recovery above $0.21 could provide initial relief.
DZ BANK Adds Cardano to Its Crypto Offering
Separately, DZ BANK’s meinKrypto platform selected ADA alongside Bitcoin, Ethereum and Litecoin for its initial offering. The MiCA-authorized service integrates cryptocurrency trading and custody into the VR Banking App.
https://twitter.com/gandreou007/status/2113963717742203371?s=20
Participating cooperative banks can offer the service through existing banking infrastructure. However, each bank must decide whether to adopt it and complete the required regulatory notification.
Cardano’s RSI sits at 34.77 and MACD remains negative, signaling continued selling pressure as ADA trades near $0.2056.
Germany’s DZ BANK includes Cardano alongside Bitcoin, Ethereum and Litecoin on meinKrypto, subject to participating banks’ adoption decisions.
Cardano faces a potential 20% decline toward $0.166 after analyst Ali Charts reported a breakdown below its rising price channel. ADA also continues to trade near $0.20, with bearish momentum appearing across its four-hour chart. Meanwhile, Germany’s DZ BANK has included Cardano among four cryptocurrencies available through its meinKrypto platform.
Ali Charts Identifies $0.220 as Resistance
Ali Charts said ADA traded inside a rising parallel channel from late June, climbing from $0.138 to $0.282. However, the token has now fallen below the channel’s lower boundary, raising the possibility of a deeper correction.
The analyst identified $0.220 as the level that could limit recovery attempts. If that price continues to act as resistance, ADA could decline approximately 20% toward $0.166.
Recent price action supports the reported weakness. ADA previously traded around 0.24–0.26 before reaching approximately $0.28 around October 6. It then fell below $0.25, $0.24 and $0.23, forming lower highs and lower lows.
A recovery toward $0.23 around October 21 failed, and renewed selling pushed the price toward $0.20. The latest four-hour candle closed at $0.2056, down 1.15%, with volume reaching 4.44 million ADA.
RSI and MACD Show Continued Selling Pressure
ADA’s Relative Strength Index is at 34.77, below its moving average of 37.40. The reading places momentum near the oversold threshold of 30, although it has not crossed that level.
Source: TradingView
The MACD line is at -0.0038, below its -0.0033 signal line. Its histogram reads -0.0005, indicating continued downside momentum. Immediate support lies between $0.2040 and $0.2000, while resistance stands around 0.22–0.23. A recovery above $0.21 could provide initial relief.
DZ BANK Adds Cardano to Its Crypto Offering
Separately, DZ BANK’s meinKrypto platform selected ADA alongside Bitcoin, Ethereum and Litecoin for its initial offering. The MiCA-authorized service integrates cryptocurrency trading and custody into the VR Banking App.
https://twitter.com/gandreou007/status/2113963717742203371?s=20
Participating cooperative banks can offer the service through existing banking infrastructure. However, each bank must decide whether to adopt it and complete the required regulatory notification.
2
367
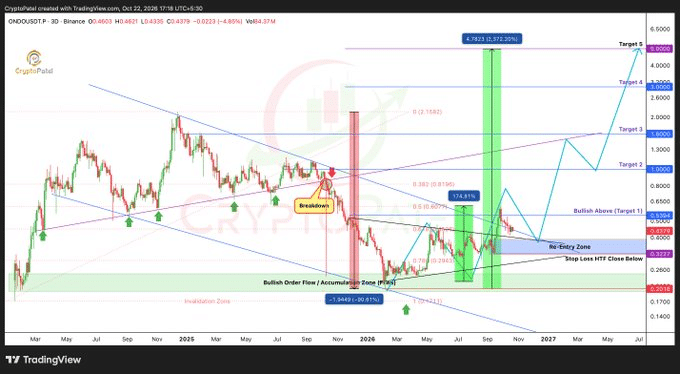
Статья
ONDO Faces Resistance as Recovery SlowsONDO trades near $0.433 after losing ground, with the $0.435 level acting as a short-term barrier for buyers seeking a recovery.
Exchange flows show sharp inflows and outflows during recent rallies, leaving ONDO’s market direction uncertain as price retreats from its peak.
The $0.39–$0.33 re-entry zone remains important, while a higher-timeframe close below $0.32 would invalidate the stated setup.
ONDO price action continues to be bearish as it bounced off of a high without sustaining it, with traders trading off nearby support and resistance levels.
ONDO Retreats After an Uneven Intraday Recovery
ONDO as of the time of writing, traded at around $0.4330 in the latest 24-hour snapshot, down 0.9%. The chart shows an evening sell-off followed by a gradual overnight recovery. However, sellers returned near midday, pushing the token below $0.435 again.
Price initially moved between $0.437 and $0.439 before weakening through the afternoon. Selling accelerated around 8 p.m., sending ONDO toward $0.423–$0.424. That range marked the lowest visible area during the session.
Buyers later lifted the price toward $0.430 before another series of small swings. Early on October 23, ONDO climbed above $0.435 and approached $0.439. The recovery then faded, leaving the price near $0.433.
The market data shows a capitalization of roughly $2.1 billion and daily volume near $120.7 million. Reported volume fell 19.89%, alongside the daily price decline. Lower turnover indicates quieter trading, but it does not establish what comes next.
Exchange Flows Show Heavy Activity
The spot-flow chart records sharp changes in exchange transfers across the year. Green bars represent net inflows, while red bars show net outflows. The orange line tracks ONDO’s price against those movements.
Source: Coinglass
Activity increased sharply in May, when a green bar approached $9 million. ONDO also rose from roughly $0.30 toward $0.40 during that period. Large red bars followed, showing that transfers continued in both directions.
Trading flows stayed uneven through the summer, with occasional spikes interrupting quieter stretches. In late September, ONDO climbed toward $0.60 as another large inflow appeared. Several substantial outflows followed, and the price retreated from its peak.
The exchange treemaps show Upbit leading the displayed figures, with Binance and Bybit also recording notable totals. However, the image does not clearly establish the right treemap’s metric or measurement period. Exchange transfers alone cannot confirm whether investors are buying, selling, or moving tokens for other reasons.
Key Price Levels Remain in Focus
Crypto Patel’s longer-term plan identifies $0.39–$0.33 as a possible re-entry zone. The stated risk boundary is a higher-timeframe candle close below $0.32. These levels describe the proposed trading setup, not guaranteed entry or exit prices.
Source: X
The chart also marks approximately $0.53 as an early bullish threshold. A sustained move above that area would strengthen the recovery attempt. Until then, ONDO remains below the resistance needed to support the projected advance.
The longer-term targets stand at $1, $1.60, $3 and $5. Crypto Patel says the earlier $0.20–$0.24 accumulation zone produced about 175% profit. Reaching the higher targets would require several advances through resistance, rather than one uninterrupted rally.
In the shorter term, $0.435 is the immediate level to reclaim. The session low around $0.423–$0.424 remains a reference if selling resumes. A move toward $0.438–$0.440 would show buyers regaining ground, though it would not confirm a lasting trend change.
ONDO’s next direction depends on whether buyers can hold support and recover nearby resistance. Falling volume and the retreat from recent highs leave the current rebound unconfirmed. The stated long-term targets remain projections, while price action around the nearer levels will provide the next useful evidence.
ONDO Faces Resistance as Recovery Slows
ONDO trades near $0.433 after losing ground, with the $0.435 level acting as a short-term barrier for buyers seeking a recovery.
Exchange flows show sharp inflows and outflows during recent rallies, leaving ONDO’s market direction uncertain as price retreats from its peak.
The $0.39–$0.33 re-entry zone remains important, while a higher-timeframe close below $0.32 would invalidate the stated setup.
ONDO price action continues to be bearish as it bounced off of a high without sustaining it, with traders trading off nearby support and resistance levels.
ONDO Retreats After an Uneven Intraday Recovery
ONDO as of the time of writing, traded at around $0.4330 in the latest 24-hour snapshot, down 0.9%. The chart shows an evening sell-off followed by a gradual overnight recovery. However, sellers returned near midday, pushing the token below $0.435 again.
Price initially moved between $0.437 and $0.439 before weakening through the afternoon. Selling accelerated around 8 p.m., sending ONDO toward $0.423–$0.424. That range marked the lowest visible area during the session.
Buyers later lifted the price toward $0.430 before another series of small swings. Early on October 23, ONDO climbed above $0.435 and approached $0.439. The recovery then faded, leaving the price near $0.433.
The market data shows a capitalization of roughly $2.1 billion and daily volume near $120.7 million. Reported volume fell 19.89%, alongside the daily price decline. Lower turnover indicates quieter trading, but it does not establish what comes next.
Exchange Flows Show Heavy Activity
The spot-flow chart records sharp changes in exchange transfers across the year. Green bars represent net inflows, while red bars show net outflows. The orange line tracks ONDO’s price against those movements.
Source: Coinglass
Activity increased sharply in May, when a green bar approached $9 million. ONDO also rose from roughly $0.30 toward $0.40 during that period. Large red bars followed, showing that transfers continued in both directions.
Trading flows stayed uneven through the summer, with occasional spikes interrupting quieter stretches. In late September, ONDO climbed toward $0.60 as another large inflow appeared. Several substantial outflows followed, and the price retreated from its peak.
The exchange treemaps show Upbit leading the displayed figures, with Binance and Bybit also recording notable totals. However, the image does not clearly establish the right treemap’s metric or measurement period. Exchange transfers alone cannot confirm whether investors are buying, selling, or moving tokens for other reasons.
Key Price Levels Remain in Focus
Crypto Patel’s longer-term plan identifies $0.39–$0.33 as a possible re-entry zone. The stated risk boundary is a higher-timeframe candle close below $0.32. These levels describe the proposed trading setup, not guaranteed entry or exit prices.
Source: X
The chart also marks approximately $0.53 as an early bullish threshold. A sustained move above that area would strengthen the recovery attempt. Until then, ONDO remains below the resistance needed to support the projected advance.
The longer-term targets stand at $1, $1.60, $3 and $5. Crypto Patel says the earlier $0.20–$0.24 accumulation zone produced about 175% profit. Reaching the higher targets would require several advances through resistance, rather than one uninterrupted rally.
In the shorter term, $0.435 is the immediate level to reclaim. The session low around $0.423–$0.424 remains a reference if selling resumes. A move toward $0.438–$0.440 would show buyers regaining ground, though it would not confirm a lasting trend change.
ONDO’s next direction depends on whether buyers can hold support and recover nearby resistance. Falling volume and the retreat from recent highs leave the current rebound unconfirmed. The stated long-term targets remain projections, while price action around the nearer levels will provide the next useful evidence.
Exchange flows show sharp inflows and outflows during recent rallies, leaving ONDO’s market direction uncertain as price retreats from its peak.
The $0.39–$0.33 re-entry zone remains important, while a higher-timeframe close below $0.32 would invalidate the stated setup.
ONDO price action continues to be bearish as it bounced off of a high without sustaining it, with traders trading off nearby support and resistance levels.
ONDO Retreats After an Uneven Intraday Recovery
ONDO as of the time of writing, traded at around $0.4330 in the latest 24-hour snapshot, down 0.9%. The chart shows an evening sell-off followed by a gradual overnight recovery. However, sellers returned near midday, pushing the token below $0.435 again.
Price initially moved between $0.437 and $0.439 before weakening through the afternoon. Selling accelerated around 8 p.m., sending ONDO toward $0.423–$0.424. That range marked the lowest visible area during the session.
Buyers later lifted the price toward $0.430 before another series of small swings. Early on October 23, ONDO climbed above $0.435 and approached $0.439. The recovery then faded, leaving the price near $0.433.
The market data shows a capitalization of roughly $2.1 billion and daily volume near $120.7 million. Reported volume fell 19.89%, alongside the daily price decline. Lower turnover indicates quieter trading, but it does not establish what comes next.
Exchange Flows Show Heavy Activity
The spot-flow chart records sharp changes in exchange transfers across the year. Green bars represent net inflows, while red bars show net outflows. The orange line tracks ONDO’s price against those movements.
Source: Coinglass
Activity increased sharply in May, when a green bar approached $9 million. ONDO also rose from roughly $0.30 toward $0.40 during that period. Large red bars followed, showing that transfers continued in both directions.
Trading flows stayed uneven through the summer, with occasional spikes interrupting quieter stretches. In late September, ONDO climbed toward $0.60 as another large inflow appeared. Several substantial outflows followed, and the price retreated from its peak.
The exchange treemaps show Upbit leading the displayed figures, with Binance and Bybit also recording notable totals. However, the image does not clearly establish the right treemap’s metric or measurement period. Exchange transfers alone cannot confirm whether investors are buying, selling, or moving tokens for other reasons.
Key Price Levels Remain in Focus
Crypto Patel’s longer-term plan identifies $0.39–$0.33 as a possible re-entry zone. The stated risk boundary is a higher-timeframe candle close below $0.32. These levels describe the proposed trading setup, not guaranteed entry or exit prices.
Source: X
The chart also marks approximately $0.53 as an early bullish threshold. A sustained move above that area would strengthen the recovery attempt. Until then, ONDO remains below the resistance needed to support the projected advance.
The longer-term targets stand at $1, $1.60, $3 and $5. Crypto Patel says the earlier $0.20–$0.24 accumulation zone produced about 175% profit. Reaching the higher targets would require several advances through resistance, rather than one uninterrupted rally.
In the shorter term, $0.435 is the immediate level to reclaim. The session low around $0.423–$0.424 remains a reference if selling resumes. A move toward $0.438–$0.440 would show buyers regaining ground, though it would not confirm a lasting trend change.
ONDO’s next direction depends on whether buyers can hold support and recover nearby resistance. Falling volume and the retreat from recent highs leave the current rebound unconfirmed. The stated long-term targets remain projections, while price action around the nearer levels will provide the next useful evidence.
400
Проверено
Статья
Arf and Ripple Bring RLUSD Settlement Liquidity to XRPLArf and Ripple plan to use RLUSD on XRPL to provide short-term settlement liquidity for licensed cross-border payment companies.
Arf reports approximately $10 billion in annual settlement volume, with liquidity typically repaid within one to five days.
Future integration with XRPL’s native Lending Protocol depends on approval of amendments XLS-65 and XLS-66 before mainnet activation.
Arf and Ripple are partnering to provide RLUSD-powered settlement liquidity to licensed cross-border payment companies on the XRP Ledger (XRPL). The arrangement will provide short-term working capital while international payments settle, addressing funding needs across markets. Arf reports about $10 billion in annual settlement volume, with capital turning over four times monthly.
https://twitter.com/Ripple/status/2113260588574843090?s=20
Arf Uses RLUSD to Support Payment Settlement
Payment companies often need working capital available across multiple markets to pre-fund transfers while awaiting settlement. However, traditional bank credit lines can take months to establish and typically require substantial collateral.
Arf and Ripple plan to use RLUSD, Ripple’s dollar-backed stablecoin, to provide short-duration liquidity on XRPL. According to Arf co-founder and CEO Ali Erhat Nalbant, the company’s model helps payment firms access capital while funds remain in transit.
Arf launched in November 2022 and has since reached approximately $10 billion in annual global settlement volume. The Zug, Switzerland-based company is a regulated financial institution and member of VQF. Its settlement liquidity typically repays within one to five days, allowing capital to support repeated payment flows.
XRPL Lending Protocol Could Expand the Arrangement
In the partnership’s first phase, Arf will provide direct RLUSD settlement liquidity on XRPL. However, the companies also plan to use the ledger’s native lending infrastructure when it becomes available.
The proposed system includes Single Asset Vaults for pooling and managing capital onchain. The Lending Protocol would allow that capital to support structured loans. Arf would continue handling underwriting and working capital decisions offchain.
Arf has already developed an implementation using the proposed protocol. However, the relevant amendments, XLS-65 and XLS-66, must pass XRPL’s amendment process before activation on mainnet.
RLUSD and XRP Have Different Roles
RippleX Head of Product Jasmine Cooper said XRPL offers settlement infrastructure, while RLUSD provides a dollar-denominated asset for working capital. RLUSD would support loan disbursements and repayments.
Meanwhile, XRP pays network transaction fees, and accounts and certain ledger objects require XRP reserves. Payment companies would not need to operate directly onchain. Arf supports treasury management between fiat currencies and stablecoins through bank accounts in major financial hubs.
Arf will continue advising on the Single Asset Vault and Lending Protocol specifications before any planned transition to the native infrastructure.
Arf and Ripple Bring RLUSD Settlement Liquidity to XRPL
Arf and Ripple plan to use RLUSD on XRPL to provide short-term settlement liquidity for licensed cross-border payment companies.
Arf reports approximately $10 billion in annual settlement volume, with liquidity typically repaid within one to five days.
Future integration with XRPL’s native Lending Protocol depends on approval of amendments XLS-65 and XLS-66 before mainnet activation.
Arf and Ripple are partnering to provide RLUSD-powered settlement liquidity to licensed cross-border payment companies on the XRP Ledger (XRPL). The arrangement will provide short-term working capital while international payments settle, addressing funding needs across markets. Arf reports about $10 billion in annual settlement volume, with capital turning over four times monthly.
https://twitter.com/Ripple/status/2113260588574843090?s=20
Arf Uses RLUSD to Support Payment Settlement
Payment companies often need working capital available across multiple markets to pre-fund transfers while awaiting settlement. However, traditional bank credit lines can take months to establish and typically require substantial collateral.
Arf and Ripple plan to use RLUSD, Ripple’s dollar-backed stablecoin, to provide short-duration liquidity on XRPL. According to Arf co-founder and CEO Ali Erhat Nalbant, the company’s model helps payment firms access capital while funds remain in transit.
Arf launched in November 2022 and has since reached approximately $10 billion in annual global settlement volume. The Zug, Switzerland-based company is a regulated financial institution and member of VQF. Its settlement liquidity typically repays within one to five days, allowing capital to support repeated payment flows.
XRPL Lending Protocol Could Expand the Arrangement
In the partnership’s first phase, Arf will provide direct RLUSD settlement liquidity on XRPL. However, the companies also plan to use the ledger’s native lending infrastructure when it becomes available.
The proposed system includes Single Asset Vaults for pooling and managing capital onchain. The Lending Protocol would allow that capital to support structured loans. Arf would continue handling underwriting and working capital decisions offchain.
Arf has already developed an implementation using the proposed protocol. However, the relevant amendments, XLS-65 and XLS-66, must pass XRPL’s amendment process before activation on mainnet.
RLUSD and XRP Have Different Roles
RippleX Head of Product Jasmine Cooper said XRPL offers settlement infrastructure, while RLUSD provides a dollar-denominated asset for working capital. RLUSD would support loan disbursements and repayments.
Meanwhile, XRP pays network transaction fees, and accounts and certain ledger objects require XRP reserves. Payment companies would not need to operate directly onchain. Arf supports treasury management between fiat currencies and stablecoins through bank accounts in major financial hubs.
Arf will continue advising on the Single Asset Vault and Lending Protocol specifications before any planned transition to the native infrastructure.
Arf reports approximately $10 billion in annual settlement volume, with liquidity typically repaid within one to five days.
Future integration with XRPL’s native Lending Protocol depends on approval of amendments XLS-65 and XLS-66 before mainnet activation.
Arf and Ripple are partnering to provide RLUSD-powered settlement liquidity to licensed cross-border payment companies on the XRP Ledger (XRPL). The arrangement will provide short-term working capital while international payments settle, addressing funding needs across markets. Arf reports about $10 billion in annual settlement volume, with capital turning over four times monthly.
https://twitter.com/Ripple/status/2113260588574843090?s=20
Arf Uses RLUSD to Support Payment Settlement
Payment companies often need working capital available across multiple markets to pre-fund transfers while awaiting settlement. However, traditional bank credit lines can take months to establish and typically require substantial collateral.
Arf and Ripple plan to use RLUSD, Ripple’s dollar-backed stablecoin, to provide short-duration liquidity on XRPL. According to Arf co-founder and CEO Ali Erhat Nalbant, the company’s model helps payment firms access capital while funds remain in transit.
Arf launched in November 2022 and has since reached approximately $10 billion in annual global settlement volume. The Zug, Switzerland-based company is a regulated financial institution and member of VQF. Its settlement liquidity typically repays within one to five days, allowing capital to support repeated payment flows.
XRPL Lending Protocol Could Expand the Arrangement
In the partnership’s first phase, Arf will provide direct RLUSD settlement liquidity on XRPL. However, the companies also plan to use the ledger’s native lending infrastructure when it becomes available.
The proposed system includes Single Asset Vaults for pooling and managing capital onchain. The Lending Protocol would allow that capital to support structured loans. Arf would continue handling underwriting and working capital decisions offchain.
Arf has already developed an implementation using the proposed protocol. However, the relevant amendments, XLS-65 and XLS-66, must pass XRPL’s amendment process before activation on mainnet.
RLUSD and XRP Have Different Roles
RippleX Head of Product Jasmine Cooper said XRPL offers settlement infrastructure, while RLUSD provides a dollar-denominated asset for working capital. RLUSD would support loan disbursements and repayments.
Meanwhile, XRP pays network transaction fees, and accounts and certain ledger objects require XRP reserves. Payment companies would not need to operate directly onchain. Arf supports treasury management between fiat currencies and stablecoins through bank accounts in major financial hubs.
Arf will continue advising on the Single Asset Vault and Lending Protocol specifications before any planned transition to the native infrastructure.
110
Частичная правда

Статья
NEAR Faces ICP Founder’s Privacy Criticism as TVL Reaches $244MNEAR holds $244 million in total value locked versus ICP’s $12 million, while Confidential Intents accounts for $171 million, according to the report.
ICP founder Dom criticized NEAR’s confidentiality model and raised concerns about vetKeys, though the allegations remain disputed.
NEAR retreated toward support after failing to sustain October rallies, with 29%–30% marking support and 45%–50% remaining resistance.
NEAR holds $244 million in chain total value locked, compared with ICP’s $12 million, as debate over privacy technology intensifies. Our Crypto Talk highlighted the gap alongside criticism from ICP founder Dom, who challenged NEAR’s Confidential Intents and raised concerns about vetKeys. Meanwhile, NEAR’s chart shows weakening momentum after a correction from its October highs.
Dom Questions NEAR’s Confidentiality Model
According to Our Crypto Talk, Dom shared an engineer’s review describing Confidential Intents as a permissioned system with trusted operators, no public code, and no public operator list. He later called the project “snake oil” and raised the possibility of legal action over vetKeys, though these remain allegations.
The criticism centers on NEAR’s trust model, including a private shard, a limited group of permissioned validators, and a trusted execution environment bridge. Our Crypto Talk said these components do not constitute threshold cryptography.
However, the commentary described disclosure as a weaker criticism because NEAR publicly outlined its permissioned shard and TEE bridge when launching in February. It also noted that ICP documentation says node operators can read standard subnet state.
NEAR Leads ICP in Locked Value and Performance
Confidential Intents holds $171 million, according to Our Crypto Talk, representing a 6.4-fold increase since June. The source noted that incentives contributed to part of that growth, while ICP’s entire ecosystem holds approximately $12 million.
The comparison also showed NEAR down 76% from its all-time high, against ICP’s 99.7% decline. Since February, NEAR has gained 4.3 times, while ICP has remained roughly flat. Their market-cap-to-TVL ratios stand at approximately 25 times for NEAR and 100 times for ICP.
NEAR Chart Shows Selling Pressure Near Support
On the four-hour chart, NEAR has retreated toward the 29%–30% cumulative-gain zone after failing to sustain rallies above 50%. Its latest candle closed at $4.570, down 0.04%, with trading volume at 209,500 NEAR.
Source: TradingView
Repeated recoveries failed to establish higher highs following an October 11–12 surge toward 68%–70%. Support is around 29%–30%, with the 20%–25% region below. A recovery toward 35%–40% could indicate improving buying interest, while 45%–50% remains resistance. ICP’s comparison line has fallen 6.46% below its starting baseline.
NEAR Faces ICP Founder’s Privacy Criticism as TVL Reaches $244M
NEAR holds $244 million in total value locked versus ICP’s $12 million, while Confidential Intents accounts for $171 million, according to the report.
ICP founder Dom criticized NEAR’s confidentiality model and raised concerns about vetKeys, though the allegations remain disputed.
NEAR retreated toward support after failing to sustain October rallies, with 29%–30% marking support and 45%–50% remaining resistance.
NEAR holds $244 million in chain total value locked, compared with ICP’s $12 million, as debate over privacy technology intensifies. Our Crypto Talk highlighted the gap alongside criticism from ICP founder Dom, who challenged NEAR’s Confidential Intents and raised concerns about vetKeys. Meanwhile, NEAR’s chart shows weakening momentum after a correction from its October highs.
Dom Questions NEAR’s Confidentiality Model
According to Our Crypto Talk, Dom shared an engineer’s review describing Confidential Intents as a permissioned system with trusted operators, no public code, and no public operator list. He later called the project “snake oil” and raised the possibility of legal action over vetKeys, though these remain allegations.
The criticism centers on NEAR’s trust model, including a private shard, a limited group of permissioned validators, and a trusted execution environment bridge. Our Crypto Talk said these components do not constitute threshold cryptography.
However, the commentary described disclosure as a weaker criticism because NEAR publicly outlined its permissioned shard and TEE bridge when launching in February. It also noted that ICP documentation says node operators can read standard subnet state.
NEAR Leads ICP in Locked Value and Performance
Confidential Intents holds $171 million, according to Our Crypto Talk, representing a 6.4-fold increase since June. The source noted that incentives contributed to part of that growth, while ICP’s entire ecosystem holds approximately $12 million.
The comparison also showed NEAR down 76% from its all-time high, against ICP’s 99.7% decline. Since February, NEAR has gained 4.3 times, while ICP has remained roughly flat. Their market-cap-to-TVL ratios stand at approximately 25 times for NEAR and 100 times for ICP.
NEAR Chart Shows Selling Pressure Near Support
On the four-hour chart, NEAR has retreated toward the 29%–30% cumulative-gain zone after failing to sustain rallies above 50%. Its latest candle closed at $4.570, down 0.04%, with trading volume at 209,500 NEAR.
Source: TradingView
Repeated recoveries failed to establish higher highs following an October 11–12 surge toward 68%–70%. Support is around 29%–30%, with the 20%–25% region below. A recovery toward 35%–40% could indicate improving buying interest, while 45%–50% remains resistance. ICP’s comparison line has fallen 6.46% below its starting baseline.
ICP founder Dom criticized NEAR’s confidentiality model and raised concerns about vetKeys, though the allegations remain disputed.
NEAR retreated toward support after failing to sustain October rallies, with 29%–30% marking support and 45%–50% remaining resistance.
NEAR holds $244 million in chain total value locked, compared with ICP’s $12 million, as debate over privacy technology intensifies. Our Crypto Talk highlighted the gap alongside criticism from ICP founder Dom, who challenged NEAR’s Confidential Intents and raised concerns about vetKeys. Meanwhile, NEAR’s chart shows weakening momentum after a correction from its October highs.
Dom Questions NEAR’s Confidentiality Model
According to Our Crypto Talk, Dom shared an engineer’s review describing Confidential Intents as a permissioned system with trusted operators, no public code, and no public operator list. He later called the project “snake oil” and raised the possibility of legal action over vetKeys, though these remain allegations.
The criticism centers on NEAR’s trust model, including a private shard, a limited group of permissioned validators, and a trusted execution environment bridge. Our Crypto Talk said these components do not constitute threshold cryptography.
However, the commentary described disclosure as a weaker criticism because NEAR publicly outlined its permissioned shard and TEE bridge when launching in February. It also noted that ICP documentation says node operators can read standard subnet state.
NEAR Leads ICP in Locked Value and Performance
Confidential Intents holds $171 million, according to Our Crypto Talk, representing a 6.4-fold increase since June. The source noted that incentives contributed to part of that growth, while ICP’s entire ecosystem holds approximately $12 million.
The comparison also showed NEAR down 76% from its all-time high, against ICP’s 99.7% decline. Since February, NEAR has gained 4.3 times, while ICP has remained roughly flat. Their market-cap-to-TVL ratios stand at approximately 25 times for NEAR and 100 times for ICP.
NEAR Chart Shows Selling Pressure Near Support
On the four-hour chart, NEAR has retreated toward the 29%–30% cumulative-gain zone after failing to sustain rallies above 50%. Its latest candle closed at $4.570, down 0.04%, with trading volume at 209,500 NEAR.
Source: TradingView
Repeated recoveries failed to establish higher highs following an October 11–12 surge toward 68%–70%. Support is around 29%–30%, with the 20%–25% region below. A recovery toward 35%–40% could indicate improving buying interest, while 45%–50% remains resistance. ICP’s comparison line has fallen 6.46% below its starting baseline.
1
913
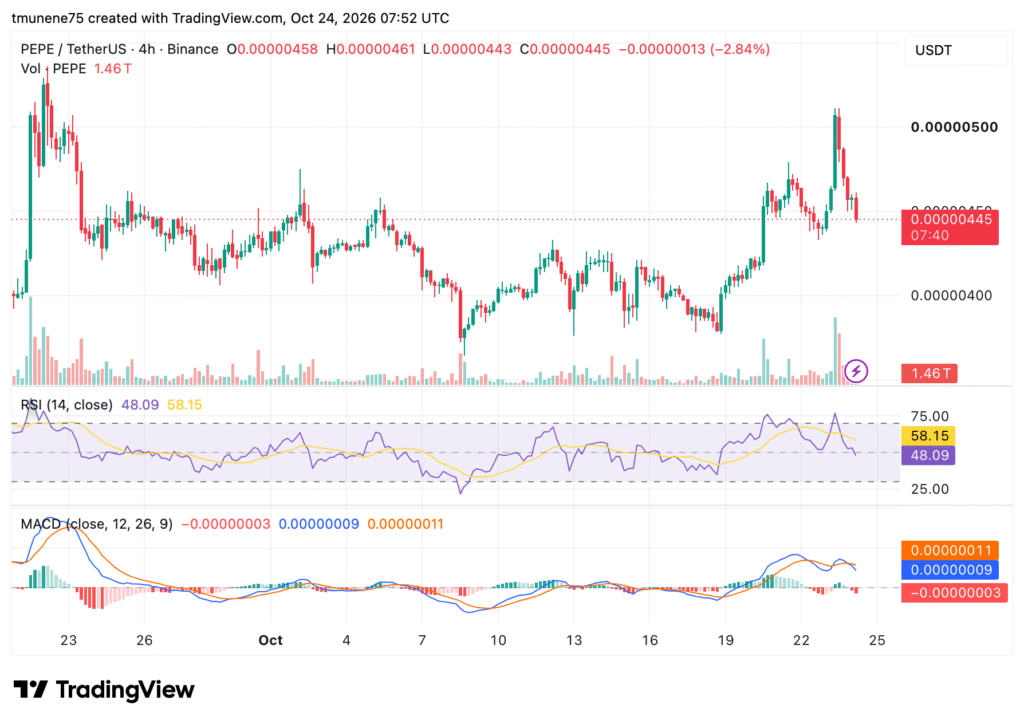
Статья
PEPE Rally Faces $0.00000440 Test as Exchange Flows ShiftPEPE rose about 13% from October 17–22, but exchanges regained 2.11 trillion tokens, reversing over 40% of October 16 withdrawals.
PEPE retreated from $0.00000510 to $0.00000445 as RSI fell to 48.09 and MACD turned negative, signaling weaker momentum.
Analyst Giannis Andreou sees $0.00000500 as a breakout level, with $0.00000727 possible if resistance breaks and holds on a retest.
PEPE gained about 13% between October 17 and 22, but renewed exchange inflows and weakening technical momentum now challenge the rally. Santiment Intelligence reported that exchanges recovered more than 40% of the 4.77 trillion tokens withdrawn on October 16. Meanwhile, analyst Giannis Andreou identified a symmetrical triangle, as PEPE retreated from $0.00000510 toward immediate support.
Exchange Inflows Reverse Part of PEPE’s Supply Decline
Santiment reported that PEPE’s exchange supply fell by 4.77 trillion tokens on October 16, a 6% decline and its largest daily drop since at least October 2. The same day recorded 15 transfers exceeding $1 million and approximately $20 million in net exchange outflows.
Those outflows ran about eight times the October 11–15 average. Subsequently, PEPE rose around 13% from its October 17 close to its October 22 close, while Bitcoin and Ethereum finished roughly flat.
However, exchange supply increased by 2.11 trillion PEPE between October 19 and 22. Net inflows occurred on October 20, 21 and 22, reversing more than 40% of October 16’s withdrawals.
PEPE Price Rejection Weakens Short-Term Momentum
PEPE recently climbed from around 0.00000380–0.00000400, briefly breaking above $0.00000500 before facing resistance near $0.00000510. The four-hour chart shows a pullback to $0.00000445, with the latest candle declining 2.84%.
Source: TradingView
Trading volume reached 1.46 trillion PEPE amid elevated activity during the rally and subsequent sell-off. Immediate support sits at 0.00000440–0.00000445, followed by $0.00000420 and $0.00000400. Buyers would need to reclaim 0.00000460–0.00000470 to challenge the recent peak.
The Relative Strength Index is at 48.09, below its 58.15 moving average and the neutral 50 threshold. Meanwhile, the MACD line at 0.00000009 remains below its 0.00000011 signal line, with a negative histogram of -0.00000003.
Analyst Maps Triangle Breakout Levels
Andreou said PEPE is consolidating between falling resistance and rising support. A pullback toward $0.00000410 could precede a breakout attempt.
https://twitter.com/gandreou007/status/2113654178576728267?s=20
A daily close above descending resistance would put $0.00000500 in focus. If PEPE holds that trendline during a retest, $0.00000727 becomes the next target. However, a daily breakdown below rising support followed by a failed reclaim would weaken the setup.
PEPE Rally Faces $0.00000440 Test as Exchange Flows Shift
PEPE rose about 13% from October 17–22, but exchanges regained 2.11 trillion tokens, reversing over 40% of October 16 withdrawals.
PEPE retreated from $0.00000510 to $0.00000445 as RSI fell to 48.09 and MACD turned negative, signaling weaker momentum.
Analyst Giannis Andreou sees $0.00000500 as a breakout level, with $0.00000727 possible if resistance breaks and holds on a retest.
PEPE gained about 13% between October 17 and 22, but renewed exchange inflows and weakening technical momentum now challenge the rally. Santiment Intelligence reported that exchanges recovered more than 40% of the 4.77 trillion tokens withdrawn on October 16. Meanwhile, analyst Giannis Andreou identified a symmetrical triangle, as PEPE retreated from $0.00000510 toward immediate support.
Exchange Inflows Reverse Part of PEPE’s Supply Decline
Santiment reported that PEPE’s exchange supply fell by 4.77 trillion tokens on October 16, a 6% decline and its largest daily drop since at least October 2. The same day recorded 15 transfers exceeding $1 million and approximately $20 million in net exchange outflows.
Those outflows ran about eight times the October 11–15 average. Subsequently, PEPE rose around 13% from its October 17 close to its October 22 close, while Bitcoin and Ethereum finished roughly flat.
However, exchange supply increased by 2.11 trillion PEPE between October 19 and 22. Net inflows occurred on October 20, 21 and 22, reversing more than 40% of October 16’s withdrawals.
PEPE Price Rejection Weakens Short-Term Momentum
PEPE recently climbed from around 0.00000380–0.00000400, briefly breaking above $0.00000500 before facing resistance near $0.00000510. The four-hour chart shows a pullback to $0.00000445, with the latest candle declining 2.84%.
Source: TradingView
Trading volume reached 1.46 trillion PEPE amid elevated activity during the rally and subsequent sell-off. Immediate support sits at 0.00000440–0.00000445, followed by $0.00000420 and $0.00000400. Buyers would need to reclaim 0.00000460–0.00000470 to challenge the recent peak.
The Relative Strength Index is at 48.09, below its 58.15 moving average and the neutral 50 threshold. Meanwhile, the MACD line at 0.00000009 remains below its 0.00000011 signal line, with a negative histogram of -0.00000003.
Analyst Maps Triangle Breakout Levels
Andreou said PEPE is consolidating between falling resistance and rising support. A pullback toward $0.00000410 could precede a breakout attempt.
https://twitter.com/gandreou007/status/2113654178576728267?s=20
A daily close above descending resistance would put $0.00000500 in focus. If PEPE holds that trendline during a retest, $0.00000727 becomes the next target. However, a daily breakdown below rising support followed by a failed reclaim would weaken the setup.
PEPE retreated from $0.00000510 to $0.00000445 as RSI fell to 48.09 and MACD turned negative, signaling weaker momentum.
Analyst Giannis Andreou sees $0.00000500 as a breakout level, with $0.00000727 possible if resistance breaks and holds on a retest.
PEPE gained about 13% between October 17 and 22, but renewed exchange inflows and weakening technical momentum now challenge the rally. Santiment Intelligence reported that exchanges recovered more than 40% of the 4.77 trillion tokens withdrawn on October 16. Meanwhile, analyst Giannis Andreou identified a symmetrical triangle, as PEPE retreated from $0.00000510 toward immediate support.
Exchange Inflows Reverse Part of PEPE’s Supply Decline
Santiment reported that PEPE’s exchange supply fell by 4.77 trillion tokens on October 16, a 6% decline and its largest daily drop since at least October 2. The same day recorded 15 transfers exceeding $1 million and approximately $20 million in net exchange outflows.
Those outflows ran about eight times the October 11–15 average. Subsequently, PEPE rose around 13% from its October 17 close to its October 22 close, while Bitcoin and Ethereum finished roughly flat.
However, exchange supply increased by 2.11 trillion PEPE between October 19 and 22. Net inflows occurred on October 20, 21 and 22, reversing more than 40% of October 16’s withdrawals.
PEPE Price Rejection Weakens Short-Term Momentum
PEPE recently climbed from around 0.00000380–0.00000400, briefly breaking above $0.00000500 before facing resistance near $0.00000510. The four-hour chart shows a pullback to $0.00000445, with the latest candle declining 2.84%.
Source: TradingView
Trading volume reached 1.46 trillion PEPE amid elevated activity during the rally and subsequent sell-off. Immediate support sits at 0.00000440–0.00000445, followed by $0.00000420 and $0.00000400. Buyers would need to reclaim 0.00000460–0.00000470 to challenge the recent peak.
The Relative Strength Index is at 48.09, below its 58.15 moving average and the neutral 50 threshold. Meanwhile, the MACD line at 0.00000009 remains below its 0.00000011 signal line, with a negative histogram of -0.00000003.
Analyst Maps Triangle Breakout Levels
Andreou said PEPE is consolidating between falling resistance and rising support. A pullback toward $0.00000410 could precede a breakout attempt.
https://twitter.com/gandreou007/status/2113654178576728267?s=20
A daily close above descending resistance would put $0.00000500 in focus. If PEPE holds that trendline during a retest, $0.00000727 becomes the next target. However, a daily breakdown below rising support followed by a failed reclaim would weaken the setup.
299
Войдите, чтобы посмотреть больше материала
Присоединяйтесь к пользователям криптовалют по всему миру на Binance Square
⚡️ Получайте новейшую и полезную информацию о криптоактивах.
💬 Нам доверяет крупнейшая в мире криптобиржа.
👍 Получите достоверные аналитические данные от верифицированных создателей контента.
Эл. почта/номер телефона
В тренде
BinancePick
Просмотров: 3M
152,141 обсуждают
Join #EarningsSeason: Predict Earnings on Binance Pick, Share Your Take on Binance Square!
Binance Square Official
·Лайков: 409
·Просмотров: 342.6k
EarningsSeason
Просмотров: 5.2M
25,849 обсуждают
AnthropicTTMRevenueGrewAbout1200%
Просмотров: 23,009
356 обсуждают