
Crypto AnalyserX
3 Публикации

Crypto AnalyserX
Отправить жалобу
Заблокировать пользователя
Crypto Market Analysis & Insights. BTC • ETH • Altcoins • Web3 . Simplifying Crypto for a Global Community. X(Twitter) @CryptoAnalyserX
Открытая сделка
Случайный трейдер
2.3 г
1 подписок(и/а)
0 подписчиков(а)
0 понравилось
Посты
Портфель
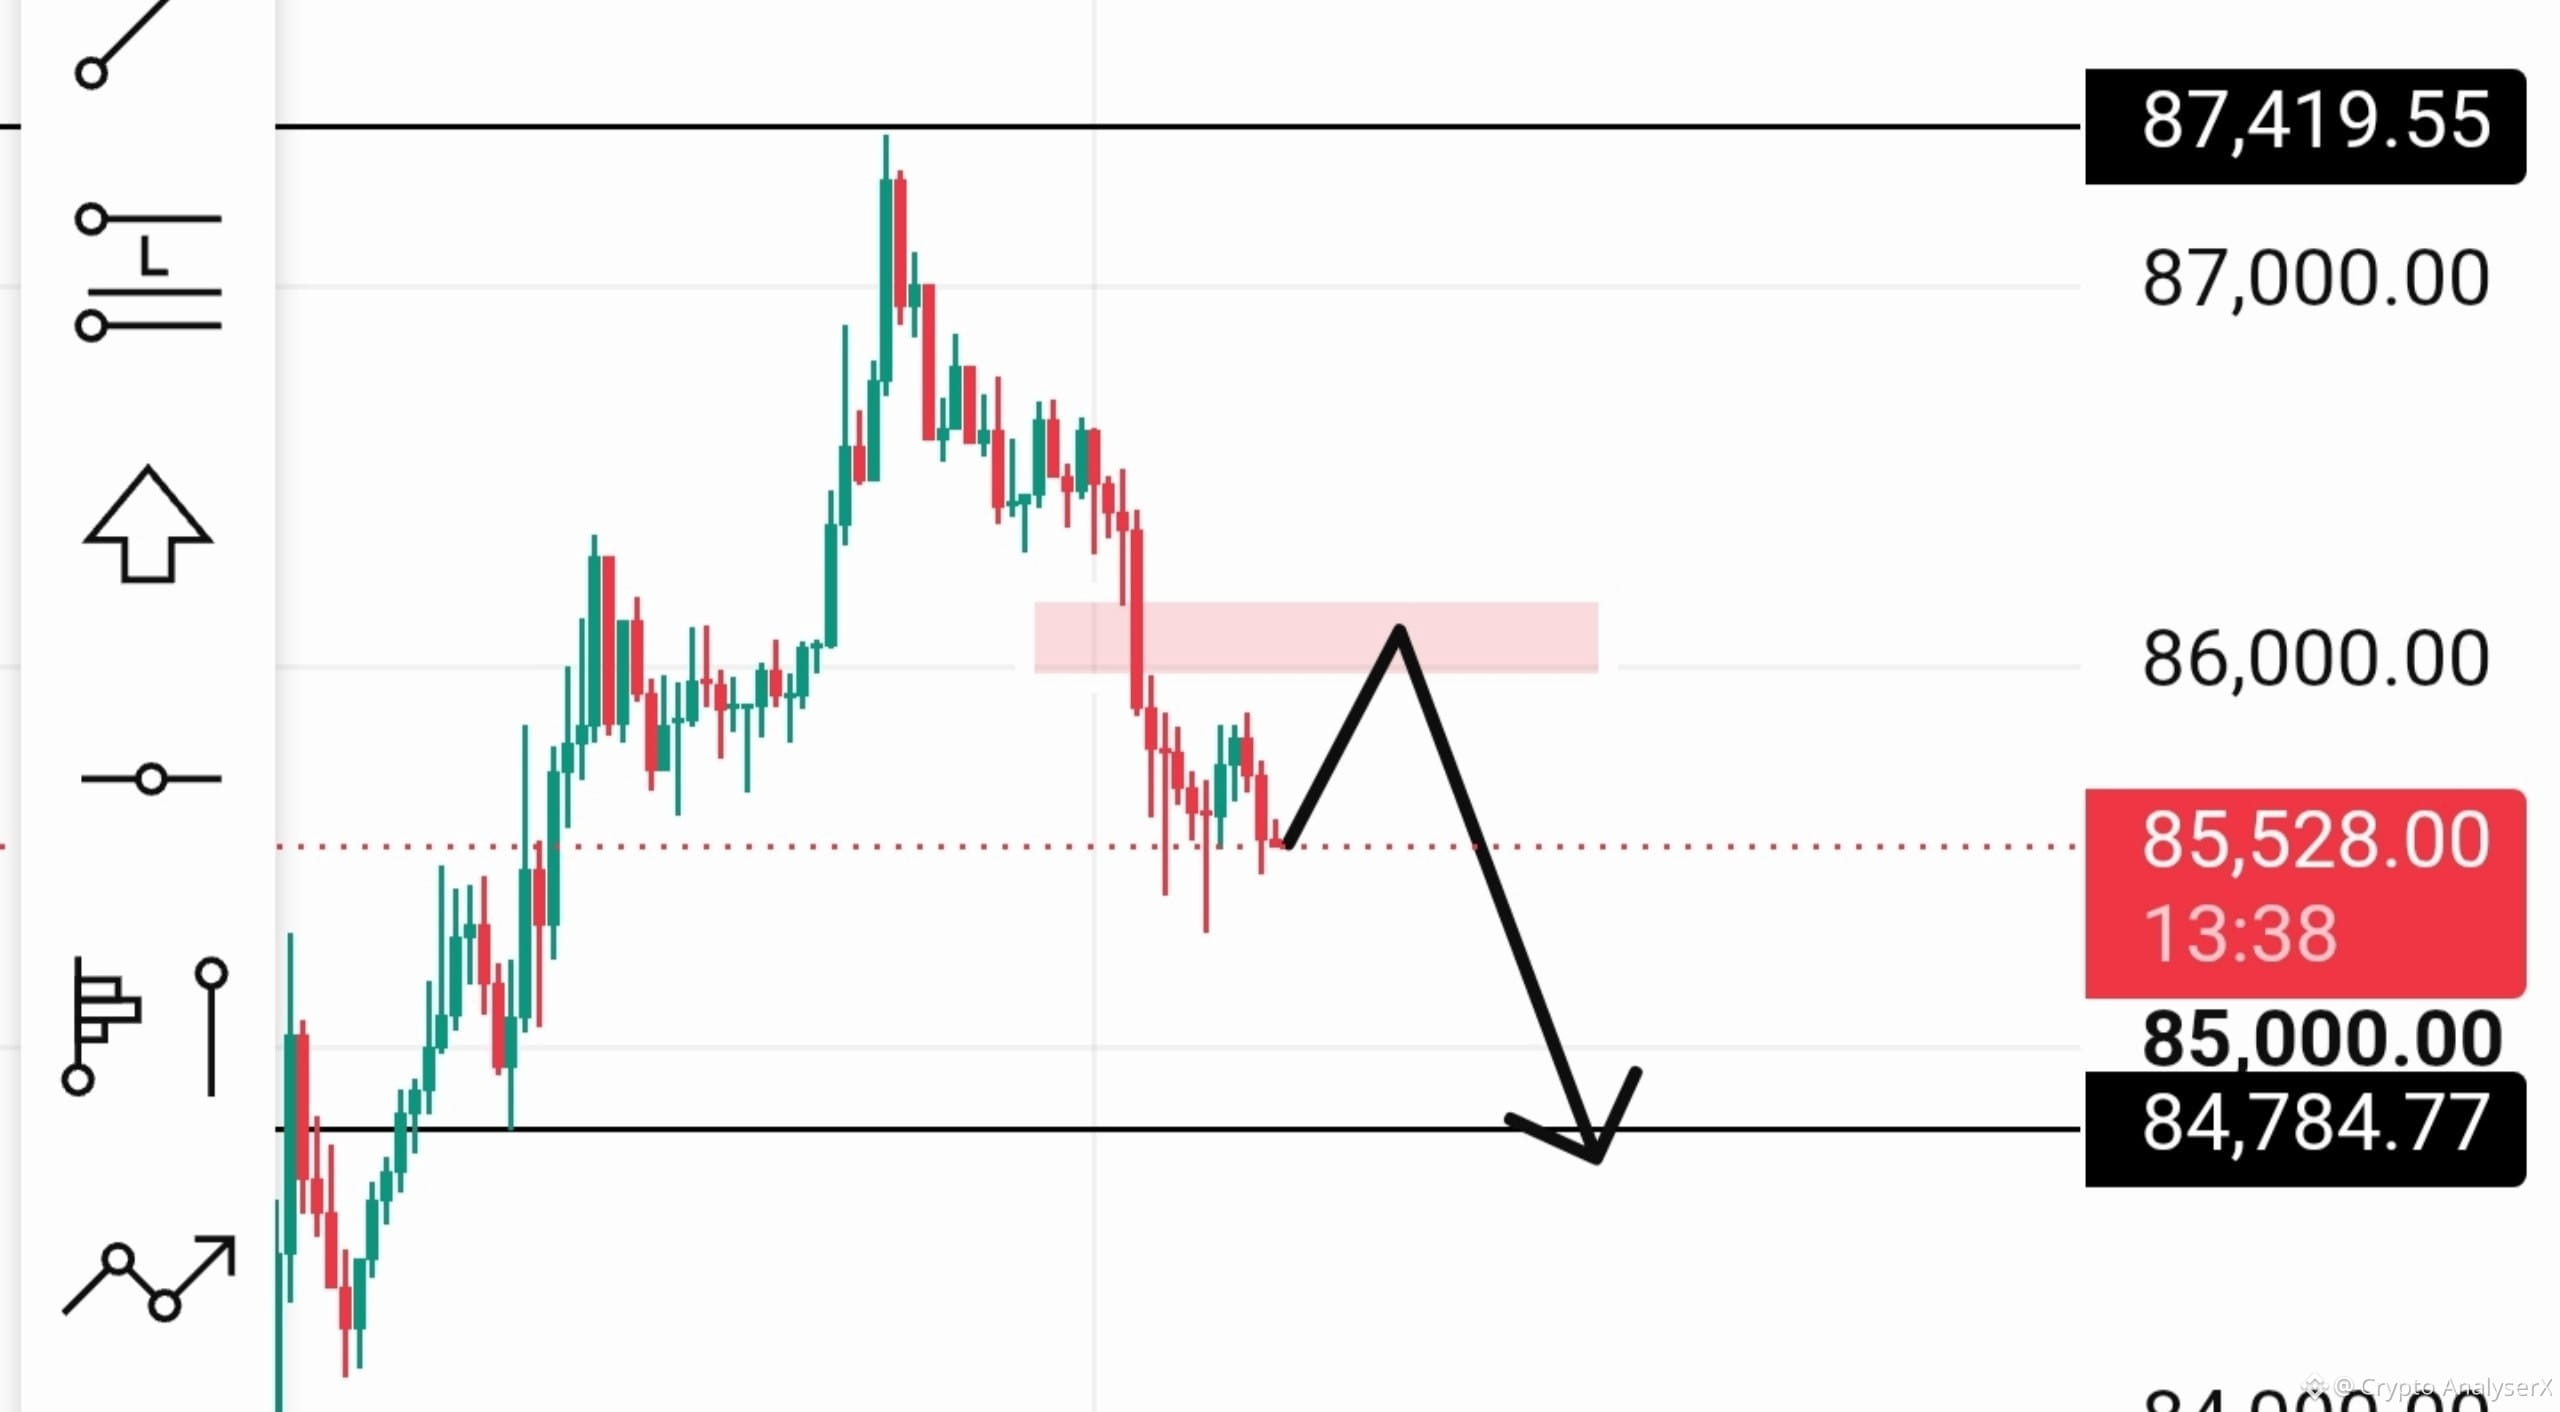
🚨 BTC SIGNAL | SHORT BIAS
₿ Bitcoin
📍 Entry Zone: $85,500–$86,000
🎯 Target: $84,785
🛑 Invalidation: Above $86,000
📊 Bias: SELL / SHORT
🔎 Reason: Price is showing rejection around the $86K resistance zone. A move back below the current area could open the way toward ~$84.8K support.
⚠️ Scenario, not a guaranteed signal. Confirm price action before acting.
#BTC #Bitcoin #Crypto #BTCSignal $BTC
{spot}(BTCUSDT)
🚨 BTC SIGNAL | SHORT BIAS
₿ Bitcoin
📍 Entry Zone: $85,500–$86,000
🎯 Target: $84,785
🛑 Invalidation: Above $86,000
📊 Bias: SELL / SHORT
🔎 Reason: Price is showing rejection around the $86K resistance zone. A move back below the current area could open the way toward ~$84.8K support.
⚠️ Scenario, not a guaranteed signal. Confirm price action before acting.
#BTC #Bitcoin #Crypto #BTCSignal $BTC
₿ Bitcoin
📍 Entry Zone: $85,500–$86,000
🎯 Target: $84,785
🛑 Invalidation: Above $86,000
📊 Bias: SELL / SHORT
🔎 Reason: Price is showing rejection around the $86K resistance zone. A move back below the current area could open the way toward ~$84.8K support.
⚠️ Scenario, not a guaranteed signal. Confirm price action before acting.
#BTC #Bitcoin #Crypto #BTCSignal $BTC
91
🚨 BITCOIN: Before Looking at Altcoins, Watch This
Many traders watch BTC price alone. But there’s another metric that can tell us a lot about where the broader crypto market may be heading:
📊 Bitcoin Dominance (BTC.D)
What is it?
Bitcoin Dominance shows Bitcoin’s share of the total crypto market capitalization.
🔎 Why does it matter?
• BTC.D rising → capital may be concentrating more in Bitcoin.
• BTC.D falling → capital may be rotating toward Ethereum and altcoins.
• BTC.D + BTC rising → often reflects stronger Bitcoin-led market conditions.
• BTC.D falling while BTC remains strong → can indicate broader market participation.
🧠 My Take
BTC price tells us what Bitcoin is doing.
BTC Dominance helps us understand where crypto-market capital may be concentrating.
So instead of watching BTC alone, keep an eye on:
BTC Price + BTC Dominance + Total Market Cap
That combination can provide a clearer picture of the market structure.
📌 Follow Crypto AnalyserX for concise crypto analysis, market insights & education.
#Bitcoin #BTC #Crypto #BTCDominance #CryptoAnalysis #Altcoins #Web3
🚨 BITCOIN: Before Looking at Altcoins, Watch This
Many traders watch BTC price alone. But there’s another metric that can tell us a lot about where the broader crypto market may be heading:
📊 Bitcoin Dominance (BTC.D)
What is it?
Bitcoin Dominance shows Bitcoin’s share of the total crypto market capitalization.
🔎 Why does it matter?
• BTC.D rising → capital may be concentrating more in Bitcoin.
• BTC.D falling → capital may be rotating toward Ethereum and altcoins.
• BTC.D + BTC rising → often reflects stronger Bitcoin-led market conditions.
• BTC.D falling while BTC remains strong → can indicate broader market participation.
🧠 My Take
BTC price tells us what Bitcoin is doing.
BTC Dominance helps us understand where crypto-market capital may be concentrating.
So instead of watching BTC alone, keep an eye on:
BTC Price + BTC Dominance + Total Market Cap
That combination can provide a clearer picture of the market structure.
📌 Follow Crypto AnalyserX for concise crypto analysis, market insights & education.
#Bitcoin #BTC #Crypto #BTCDominance #CryptoAnalysis #Altcoins #Web3
Many traders watch BTC price alone. But there’s another metric that can tell us a lot about where the broader crypto market may be heading:
📊 Bitcoin Dominance (BTC.D)
What is it?
Bitcoin Dominance shows Bitcoin’s share of the total crypto market capitalization.
🔎 Why does it matter?
• BTC.D rising → capital may be concentrating more in Bitcoin.
• BTC.D falling → capital may be rotating toward Ethereum and altcoins.
• BTC.D + BTC rising → often reflects stronger Bitcoin-led market conditions.
• BTC.D falling while BTC remains strong → can indicate broader market participation.
🧠 My Take
BTC price tells us what Bitcoin is doing.
BTC Dominance helps us understand where crypto-market capital may be concentrating.
So instead of watching BTC alone, keep an eye on:
BTC Price + BTC Dominance + Total Market Cap
That combination can provide a clearer picture of the market structure.
📌 Follow Crypto AnalyserX for concise crypto analysis, market insights & education.
#Bitcoin #BTC #Crypto #BTCDominance #CryptoAnalysis #Altcoins #Web3

95
BITCOIN: Is This the Breakout Bears Didn’t Expect?🚨 BITCOIN: Is This the Breakout Bears Didn’t Expect?$
Bitcoin has just moved back above a level that has been closely watched by the market: the Weekly MA50.
But is this the beginning of a new bullish phase—or just another temporary recovery? Let’s break it down. 👇
✪ Key Market Levels
• Weekly MA50: ~$78,700
• Current BTC zone: ~$80,375
• Major range: $71K–$82K
• Key breakout zone: $82.5K–$83K
• Potential upside level: $88K
✪ What the Chart Is Showing
Bitcoin has reclaimed the Weekly MA50 after several weeks of weakness.
Historically, reclaiming this moving average has sometimes preceded stronger bullish periods. The current structure also has similarities to the 2022–23 recovery phase, where repeated rejections were followed by a recovery and eventual breakout.
However, history does not guarantee the same outcome this time.
° The Bear Trap Question
Recent weakness created expectations of another major decline. Instead, BTC recovered and moved back above the MA50.
That makes the recent move interesting—but the real confirmation has not arrived yet.
✪ The Level That Matters Most
The bigger test is around $82.5K–$83K.
A sustained breakout above this area would provide stronger evidence that Bitcoin is leaving the current $71K–$82K range.
Until then, the market can still remain range-bound.
✪ MA50 Historical Context
The original analysis points to 7 previous occasions when Bitcoin moved below the Weekly MA50 and later reclaimed it:
• 5 were associated with major bullish phases
• 2 became failed signals, including periods mentioned around 2011 and the 2020 COVID crash
This suggests MA50 reclaiming can be useful context—but it is not a guaranteed bull-market signal.
🧠 My Take
The structure is becoming more constructive while BTC remains above the Weekly MA50.
But I would separate “bullish setup” from “confirmed breakout.”
The key sequence to watch is:
$78.7K reclaim → hold above MA50 → $82.5K–$83K breakout → confirmation of stronger momentum
If BTC fails to hold the MA50, the bullish thesis becomes weaker and the $71K–$82K range remains relevant.
🎯 $88K is the target mentioned in the original analysis, not a guaranteed outcome.
#Bitcoin #BTC #Crypto #BTCAnalysis #CryptoMarket #Web3
$BTC
{spot}(BTCUSDT)
BITCOIN: Is This the Breakout Bears Didn’t Expect?
🚨 BITCOIN: Is This the Breakout Bears Didn’t Expect?$
Bitcoin has just moved back above a level that has been closely watched by the market: the Weekly MA50.
But is this the beginning of a new bullish phase—or just another temporary recovery? Let’s break it down. 👇
✪ Key Market Levels
• Weekly MA50: ~$78,700
• Current BTC zone: ~$80,375
• Major range: $71K–$82K
• Key breakout zone: $82.5K–$83K
• Potential upside level: $88K
✪ What the Chart Is Showing
Bitcoin has reclaimed the Weekly MA50 after several weeks of weakness.
Historically, reclaiming this moving average has sometimes preceded stronger bullish periods. The current structure also has similarities to the 2022–23 recovery phase, where repeated rejections were followed by a recovery and eventual breakout.
However, history does not guarantee the same outcome this time.
° The Bear Trap Question
Recent weakness created expectations of another major decline. Instead, BTC recovered and moved back above the MA50.
That makes the recent move interesting—but the real confirmation has not arrived yet.
✪ The Level That Matters Most
The bigger test is around $82.5K–$83K.
A sustained breakout above this area would provide stronger evidence that Bitcoin is leaving the current $71K–$82K range.
Until then, the market can still remain range-bound.
✪ MA50 Historical Context
The original analysis points to 7 previous occasions when Bitcoin moved below the Weekly MA50 and later reclaimed it:
• 5 were associated with major bullish phases
• 2 became failed signals, including periods mentioned around 2011 and the 2020 COVID crash
This suggests MA50 reclaiming can be useful context—but it is not a guaranteed bull-market signal.
🧠 My Take
The structure is becoming more constructive while BTC remains above the Weekly MA50.
But I would separate “bullish setup” from “confirmed breakout.”
The key sequence to watch is:
$78.7K reclaim → hold above MA50 → $82.5K–$83K breakout → confirmation of stronger momentum
If BTC fails to hold the MA50, the bullish thesis becomes weaker and the $71K–$82K range remains relevant.
🎯 $88K is the target mentioned in the original analysis, not a guaranteed outcome.
#Bitcoin #BTC #Crypto #BTCAnalysis #CryptoMarket #Web3
$BTC
Bitcoin has just moved back above a level that has been closely watched by the market: the Weekly MA50.
But is this the beginning of a new bullish phase—or just another temporary recovery? Let’s break it down. 👇
✪ Key Market Levels
• Weekly MA50: ~$78,700
• Current BTC zone: ~$80,375
• Major range: $71K–$82K
• Key breakout zone: $82.5K–$83K
• Potential upside level: $88K
✪ What the Chart Is Showing
Bitcoin has reclaimed the Weekly MA50 after several weeks of weakness.
Historically, reclaiming this moving average has sometimes preceded stronger bullish periods. The current structure also has similarities to the 2022–23 recovery phase, where repeated rejections were followed by a recovery and eventual breakout.
However, history does not guarantee the same outcome this time.
° The Bear Trap Question
Recent weakness created expectations of another major decline. Instead, BTC recovered and moved back above the MA50.
That makes the recent move interesting—but the real confirmation has not arrived yet.
✪ The Level That Matters Most
The bigger test is around $82.5K–$83K.
A sustained breakout above this area would provide stronger evidence that Bitcoin is leaving the current $71K–$82K range.
Until then, the market can still remain range-bound.
✪ MA50 Historical Context
The original analysis points to 7 previous occasions when Bitcoin moved below the Weekly MA50 and later reclaimed it:
• 5 were associated with major bullish phases
• 2 became failed signals, including periods mentioned around 2011 and the 2020 COVID crash
This suggests MA50 reclaiming can be useful context—but it is not a guaranteed bull-market signal.
🧠 My Take
The structure is becoming more constructive while BTC remains above the Weekly MA50.
But I would separate “bullish setup” from “confirmed breakout.”
The key sequence to watch is:
$78.7K reclaim → hold above MA50 → $82.5K–$83K breakout → confirmation of stronger momentum
If BTC fails to hold the MA50, the bullish thesis becomes weaker and the $71K–$82K range remains relevant.
🎯 $88K is the target mentioned in the original analysis, not a guaranteed outcome.
#Bitcoin #BTC #Crypto #BTCAnalysis #CryptoMarket #Web3
$BTC
112
Войдите, чтобы посмотреть больше материала
Присоединяйтесь к пользователям криптовалют по всему миру на Binance Square
⚡️ Получайте новейшую и полезную информацию о криптоактивах.
💬 Нам доверяет крупнейшая в мире криптобиржа.
👍 Получите достоверные аналитические данные от верифицированных создателей контента.
Эл. почта/номер телефона