
Yiz54m
694 Публикации

Yiz54m
📶 Signals Provider 📊 Market analysis📈📉
Открытая сделка
Трейдер с регулярными сделками
3.4 г
90 подписок(и/а)
557 подписчиков(а)
353 понравилось
Посты
Портфель
Все
Цитирования
Видео
Активно
$XRP Long setup.
Entry zone: 1.25 - 1.29
Take profit:
🎯TP1: 1.330
🎯TP2: 1.365
🎯TP3: 1.435
Stop loss: 1.205
Trade $XRP
XRPUSDT
Perp
Entry zone: 1.25 - 1.29
Take profit:
🎯TP1: 1.330
🎯TP2: 1.365
🎯TP3: 1.435
Stop loss: 1.205
Trade $XRP
XRPUSDT
Perp
$BTC now longs are closed as we pushed the shorts Open Interest to close on this move up. Expecting the 64,000 level as first short price level which coincides with range POC to be act as resistance level. Optional entry can be placed at 64,500 also. Final short entry would be at 65,200 level.
Spot CVD is the key here, it needs to cool at our short entry levels for a move towards 62,500 and 60,800 level.
Invalidation would be at 66,000, but I'll be reducing the position if price reaches my invalidation level. And after that I'll look for optimal shorts at 68,000-69,000 level.$BTC #DollarFallsTo10WeekLow
Spot CVD is the key here, it needs to cool at our short entry levels for a move towards 62,500 and 60,800 level.
Invalidation would be at 66,000, but I'll be reducing the position if price reaches my invalidation level. And after that I'll look for optimal shorts at 68,000-69,000 level.$BTC #DollarFallsTo10WeekLow
62800


Binance News
·
--
Crypto News Today: Bitcoin Tests $62,800 Ichimoku Cloud Support as 30-Year Treasury Yields Hit 5.22% — the Highest Since 2001 — and US Debt Approaches $40 Trillion
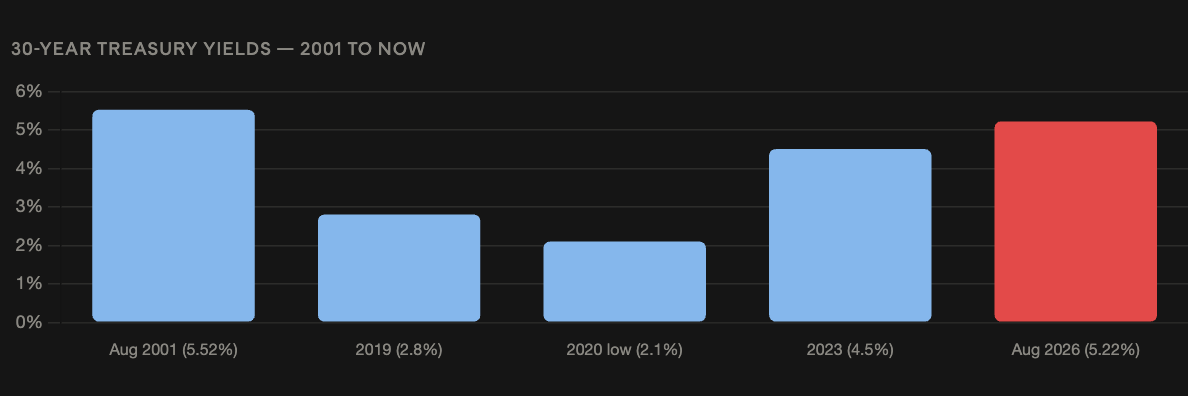
Bitcoin fell below $63,000 and is trading near $62,800 — the lower edge of the Ichimoku cloud — as WTI crude climbed above $82 per barrel and the 10-year Treasury yield advanced to 4.66%. A $25 billion auction of 30-year US Treasury bonds drew a yield of 5.22% — the highest since the 5.52% recorded in August 2001 — according to the Financial Times, signaling that long-duration investors are demanding significantly higher compensation to hold US government debt. The US national debt has reached $39.91 trillion, less than $100 billion from the $40 trillion mark, according to the US Debt Clock. A break below $62,800 would push Bitcoin below the Ichimoku cloud — a technically significant bearish signal that would represent the first cloud breakdown since the June 30 low. Strive's SATA preferred stock closed at $99.65 — its highest close since June 18 — while STRC closed above $95, its highest level since June 12.The $62,800 Ichimoku Level — What a Break Below MeansBitcoin at $62,800 is sitting on the lower edge of the Ichimoku cloud — a technical analysis framework developed by Japanese journalist Goichi Hosoda in the 1960s that identifies trend direction, support, resistance, and momentum through a shaded area on price charts. The cloud's lower edge at $62,800 is functioning as a coincident technical support level alongside the 200-week SMA at $62,873 — two independently derived support levels within $73 of each other, creating a compressed technical floor of exceptional density at the $62,800-$62,873 zone.A break below the Ichimoku cloud lower edge is specifically bearish in the framework's logic: prices below the cloud represent a confirmed downtrend, while prices above the cloud represent a confirmed uptrend. Bitcoin has been trading within or above the cloud throughout the recovery from the June 30 low — a position that represents neutral-to-bullish momentum in Ichimoku terms. A sustained close below $62,800 would flip that reading to confirmed bearish, potentially triggering additional selling from technical traders who use the cloud as a systematic signal.The convergence of the Ichimoku cloud lower edge at $62,800 and the 200-week SMA at $62,873 means that both technical systems are pointing at the same $73-wide zone as the last line of structural defense before the $60,000 target that Deribit put buyers have been positioning for throughout the recovery period. Every prior test of this zone since June has held — but those tests occurred without the concurrent pressure of a 30-year Treasury auction drawing 5.22%, WTI at $82, and Brent at $90 simultaneously.The 30-Year Treasury at 5.22% — The Highest Since 2001 and What It SignalsThursday's $25 billion 30-year Treasury auction drawing 5.22% — the highest auction yield since the 5.52% recorded in August 2001 — is the most significant macro development of the week beyond CPI. The 30-year yield is the market's deepest expression of long-duration inflation expectations and fiscal risk premium. A 5.22% 30-year yield says that investors requiring compensation for holding US government debt for three decades demand 5.22% annually — and that compensation level has not been required since 2001, before two decades of post-financial-crisis quantitative easing compressed long-duration yields to historic lows.The 5.22% 30-year yield connects directly to the US national debt approaching $40 trillion. With $39.91 trillion in outstanding debt and a 30-year borrowing cost of 5.22%, the US government's interest cost on new long-duration issuance is at its highest in 24 years. The fiscal arithmetic — $40 trillion in debt at rates not seen since 2001 — is the structural context for the "reverse crowding out" effect that Fidelity's Timmer identified: AI company financing demand and government borrowing are simultaneously competing for long-duration capital, pushing yields higher in a self-reinforcing cycle. For Bitcoin, the 5.22% 30-year yield is a 24-year high in the risk-free rate against which Bitcoin's return potential is measured — the highest-ever competition from the baseline safe haven for any capital considering Bitcoin as an alternative store of value.US National Debt at $39.91 Trillion — The Bitcoin Macro ContextThe US national debt reaching $39.91 trillion — less than $100 billion from the $40 trillion milestone — is the specific macro backdrop against which Bitcoin's store-of-value narrative is most directly relevant. The $40 trillion threshold is a psychological milestone that highlights the cumulative fiscal expansion that has coincided with Bitcoin's entire existence: when Bitcoin was created in 2009, US national debt was approximately $11.9 trillion. The 236% increase in nominal national debt over Bitcoin's 17-year history is the macro context for the institutional conviction that has driven 20,000 BTC in whale accumulation since July 29 and 842,138 BTC in Strategy's treasury despite a 34% unrealized loss.For the near-term market, the $40 trillion debt milestone approaching as 30-year yields hit 5.22% describes a fiscal environment where the US government's borrowing costs are rising toward levels not seen since 2001 at the same time that total debt is at an all-time high. That combination — peak debt, peak borrowing cost — is precisely the long-duration solvency concern that Bitcoin's fixed supply and no-counterparty-risk architecture is designed to address. Whether the fiscal pressure translates into Bitcoin price appreciation depends on whether institutional capital interprets the combination as a Bitcoin buying signal or as a general risk-off environment that suppresses all non-Treasury assets including Bitcoin.Strive's SATA and STRC Recovery — The Preferred Stock Market's Stability SignalStrive's SATA perpetual preferred stock closing at $99.65 — its highest close since June 18 when it last traded at $100 par — and STRC closing above $95 at its highest level since June 12 provide the preferred stock market's read on the Bitcoin treasury company ecosystem's stability. SATA's 25% rebound from its $79 low and STRC's 34% rebound from its $71 low — occurring simultaneously with Bitcoin's test of $62,800 — suggest that preferred stock investors are more confident in the underlying treasury companies' balance sheets than the spot price action implies.The preferred stock recovery matters for Strategy specifically: STRC's recovery toward par reduces the implicit cost of Strategy's preferred dividend obligations and reduces the urgency of Bitcoin sales to fund those obligations. If STRC reaches par at $100, Strategy's preferred stock market is fully pricing in the 12% annual dividend without the distress premium that drove the $71 low — removing one of the near-term selling pressures that produced the three 2026 Bitcoin sales below the $75,419 cost basis.The Confluence of Supports — $62,800 Ichimoku and $62,873 SMABitcoin at $62,800 is sitting in a $73-wide zone where the Ichimoku cloud lower edge and the 200-week SMA converge — two technical systems independently identifying the same support cluster. That convergence is either the strongest possible technical floor — multiple systems confirming a support — or the most consequential breakdown level, where a breach below both simultaneously sends unambiguous bearish signals across multiple analytical frameworks.The 30-year Treasury at 5.22%, WTI at $82, Brent at $90, and US debt approaching $40 trillion are the macro inputs that are testing whether that confluence holds. A CPI print that surprised to the downside Wednesday would have relieved this pressure. Whatever the CPI delivered, Thursday's 30-year auction at 5.22% has added fresh long-duration yield pressure that compounds the oil-inflation-yields chain. Whether the $62,800-$62,873 confluence holds through Thursday's session will determine whether the market enters Friday's close with structural support intact or with a technical breakdown that resets targets toward $60,000.
Follow, post and trade to earn 240,000 DUSK token rewards from the global leaderboard. To qualify for the leaderboard and reward, you must complete each task type at least once during the event.
- Red Packet/giveaway posts earn 0 points. Participants found engaging in suspicious views, interactions, or suspected use of automated bots will be disqualified from the activity. Modification of previously published posts with high impression, high engagement or irrelevant content to repurpose them as project submissions will result in 0 points in posts, repeated abuse leads to disqualification. Posts must align with project and its talking points. Irrelevant view-farming content will reduce points; repeated abuse leads to disqualification.
- The project leaderboard displays data with a T+2 delay. For example, data of 2026-08-25 will be shown on the leaderboard page after 2026-08-27 09:00 (UTC). Voucher rewards will be distributed before 2026-09-16. For details, please refer to campaign announcement.#dusk $DUSK @Dusk
- Red Packet/giveaway posts earn 0 points. Participants found engaging in suspicious views, interactions, or suspected use of automated bots will be disqualified from the activity. Modification of previously published posts with high impression, high engagement or irrelevant content to repurpose them as project submissions will result in 0 points in posts, repeated abuse leads to disqualification. Posts must align with project and its talking points. Irrelevant view-farming content will reduce points; repeated abuse leads to disqualification.
- The project leaderboard displays data with a T+2 delay. For example, data of 2026-08-25 will be shown on the leaderboard page after 2026-08-27 09:00 (UTC). Voucher rewards will be distributed before 2026-09-16. For details, please refer to campaign announcement.#dusk $DUSK @Dusk
$PLUME is still stuck inside a descending triangle, trading below that resistance trendline.
Price is holding just above the 50MA, that's the support zone to watch.
Key levels:
- Resistance: the downward trendline
- Support: 50MA & green demand zone below
A clean breakout above resistance with good volume is a bullish confirmation.
Until that happens, it's just range play. No rush, no chasing, let the chart confirm first.
#SpaceXShortInterestFallsTo11% #ETHStakingRatioHitsRecord34.4%
Price is holding just above the 50MA, that's the support zone to watch.
Key levels:
- Resistance: the downward trendline
- Support: 50MA & green demand zone below
A clean breakout above resistance with good volume is a bullish confirmation.
Until that happens, it's just range play. No rush, no chasing, let the chart confirm first.
#SpaceXShortInterestFallsTo11% #ETHStakingRatioHitsRecord34.4%
$DOGE
USDT Bounces From Support, Possible Move Up
Signal Action: Long DOGE
Entry Range: $0.06980 – $0.07030
Stop Loss: $0.06850
Take Profit: TP1 $0.07120, TP2 $0.07230, TP3 $0.07310
DOGE dropped hard but bounced from the $0.0690 area, showing buyers are stepping in. If $0.0690 holds, the price could move toward $0.07120 first, then $0.07230 and $0.07310. If DOGE breaks below $0.0690, this setup may fail.#DogecoinLeadsMajorsUpNearly3%
USDT Bounces From Support, Possible Move Up
Signal Action: Long DOGE
Entry Range: $0.06980 – $0.07030
Stop Loss: $0.06850
Take Profit: TP1 $0.07120, TP2 $0.07230, TP3 $0.07310
DOGE dropped hard but bounced from the $0.0690 area, showing buyers are stepping in. If $0.0690 holds, the price could move toward $0.07120 first, then $0.07230 and $0.07310. If DOGE breaks below $0.0690, this setup may fail.#DogecoinLeadsMajorsUpNearly3%
$VELVET The retest is complete, it’s time to move higher. Long setup.
Entry: $0.7 - $0.71
TP: $0.74 - $0.77 - $0.8 - $0.9 - $1
SL: $0.636
#USJulyCPI&PPIDueThisWeek
Entry: $0.7 - $0.71
TP: $0.74 - $0.77 - $0.8 - $0.9 - $1
SL: $0.636
#USJulyCPI&PPIDueThisWeek
$RARE /USDT LONG 🟢
⚡️ TRADING SETUP (1H) 🚀
Entry - MARKET PRICE / 0.01293
Entry Price - 0.01290
🛑 Stop Loss - 0.01150
🎯 TP1 - 0.01420
🎯 TP2 - 0.01520
📈 LONG SETUP — Watching for bullish continuation after a possible pullback. 🚀
⚠️ Disclaimer: Always use proper risk management. Never risk more than you can afford to lose.
#RARE #Crypto #TradingSignal
⚡️ TRADING SETUP (1H) 🚀
Entry - MARKET PRICE / 0.01293
Entry Price - 0.01290
🛑 Stop Loss - 0.01150
🎯 TP1 - 0.01420
🎯 TP2 - 0.01520
📈 LONG SETUP — Watching for bullish continuation after a possible pullback. 🚀
⚠️ Disclaimer: Always use proper risk management. Never risk more than you can afford to lose.
#RARE #Crypto #TradingSignal
$NIL
BOOM 🤯💥
CONGRATULATIONS 👏🎉 Rabbit traders 🐇 Chatroom Members ☺️🤩
ALL DOne 👍✅ and what a Dump.....
Good profit 🤑🤩🥳
Join.... Chatroom become Profitable... For free...
BOOM 🤯💥
CONGRATULATIONS 👏🎉 Rabbit traders 🐇 Chatroom Members ☺️🤩
ALL DOne 👍✅ and what a Dump.....
Good profit 🤑🤩🥳
Join.... Chatroom become Profitable... For free...
#SenateDelaysCLARITYActVoteToSeptember $BTC has now spent 67 days in the $58K–$67K range.
The previous two ranges lasted 67 and 113 days.
If history rhymes, we could be getting clos…
The previous two ranges lasted 67 and 113 days.
If history rhymes, we could be getting clos…
$CYS No need to FOMO, and this is not a Short recommendation! The $1 level is a strong trendline support for CYS, and I believe it will continue to retest that level many more times. Look for Long entries there! Long setup.
Entry: $0.98 - $1
TP: $1.1 - $1.2 - $1.3 - $1.5 - $2
SL: $0.89 #MoneyGramExpandsCashCryptoServiceToSolana #TrumpDemandsCompensationFromIran
Entry: $0.98 - $1
TP: $1.1 - $1.2 - $1.3 - $1.5 - $2
SL: $0.89 #MoneyGramExpandsCashCryptoServiceToSolana #TrumpDemandsCompensationFromIran
Time to average $1000CAT guys 🙋♂️
You can see my new entry point on the screenshot.
I still believe this setup has much more upside, and I’m expecting the coin to move toward:
🎯 $0.002
🎯 $0.003
I’m continuing to hold the position and using this pullback to improve my average entry
#SenateDelaysCLARITYActVoteToSeptember #SouthKoreaTopCourtProposesCryptoFreeze
You can see my new entry point on the screenshot.
I still believe this setup has much more upside, and I’m expecting the coin to move toward:
🎯 $0.002
🎯 $0.003
I’m continuing to hold the position and using this pullback to improve my average entry
#SenateDelaysCLARITYActVoteToSeptember #SouthKoreaTopCourtProposesCryptoFreeze
$HEI
trade exit suddenly but set another limit order at around 0.16
for Short trade may be it will hit within hours
The reason of this short trade is price rejection from 0.18
#SenateDelaysCLARITYActVoteToSeptember #SouthKoreaTopCourtProposesCryptoFreeze
trade exit suddenly but set another limit order at around 0.16
for Short trade may be it will hit within hours
The reason of this short trade is price rejection from 0.18
#SenateDelaysCLARITYActVoteToSeptember #SouthKoreaTopCourtProposesCryptoFreeze
Traders, pay a little attention. A few days ago, $BANK also pumped strongly like $TUT and then crashed heavily after a similar pullback. Now $TUT has also pumped a lot, and I think it has started entering crashing mode. Its downside target is $0.05500, with SL at $0.08530.
#BlackRockCanadaLaunchesBitcoinLinkedETF #BarrickMiningFalls8%
#BlackRockCanadaLaunchesBitcoinLinkedETF #BarrickMiningFalls8%
good news📰
Binance News
·
--
Crypto News: Bitcoin's Fourth Failed $65,000 Attempt — Oil at $87.73 and CPI Wednesday Keep the Macro Chain Intact While Traders Eye $70,000
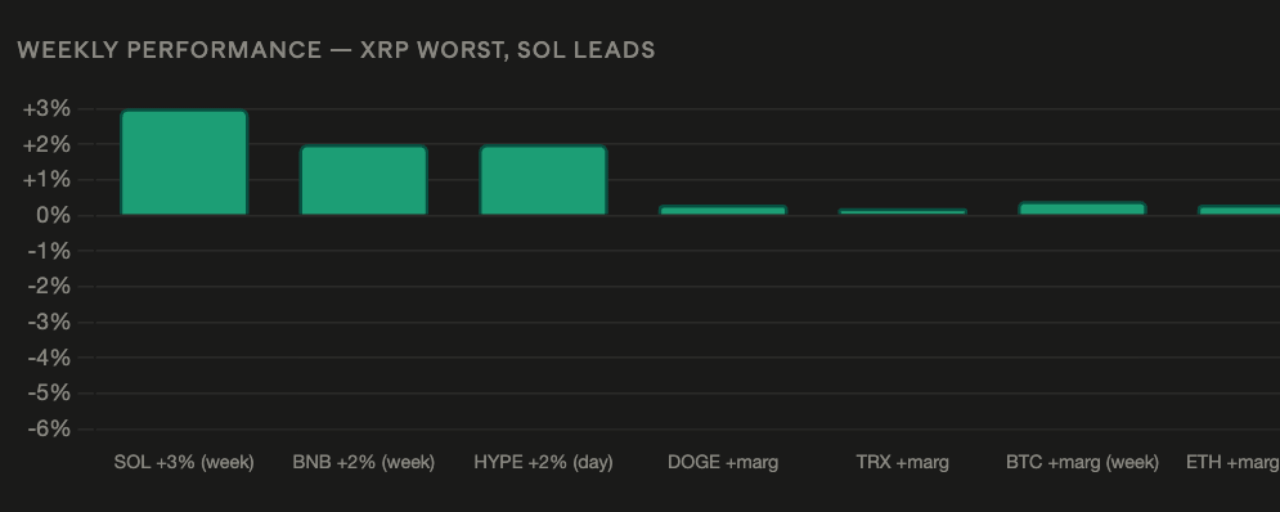
Bitcoin slipped to near $64,000 on Tuesday — down over 1% on the day but marginally positive on the week — after a fourth consecutive failed attempt to hold above $65,000, reaching a 24-hour high just above $65,300 before sliding through the Asian afternoon. Ether was the weakest major, down over 2% to $1,878. XRP fell almost 2% to $1.01 and is down almost 6% on the week — the worst major by a significant margin. Solana eased under 1% to $76 but leads the week at +3%. BNB slipped to $600, holding a 2% weekly gain. Three majors bucked the trend: HYPE rose almost 2% to $55, Tron gained slightly to 33 cents, and Dogecoin was marginally higher at 7 cents. Brent crude held at $87.73 after jumping 5% on Monday when Trump made fresh demands on Iran and dimmed hopes of a Hormuz deal. Gold rose for a third consecutive session above $4,400. US 10-year Treasury yields rose 6 basis points on Monday to 4.71%. US CPI data arrives Wednesday at 8:30 a.m. ET — the most direct scheduled catalyst for whether the oil-driven inflation worry that is suppressing risk assets eases or intensifies.
Four Failed $65,000 Tests — FxPro's Kuptsikevich Reads Shorts Building, Not Profit-Taking
FxPro chief market analyst Alex Kuptsikevich's interpretation of the four-day $65,000 test is the most analytically useful framing of Bitcoin's current price behavior. The standard interpretation of repeated tests of a level without a breakout is that sellers are absorbing buying attempts — profit-taking by existing holders who purchased at lower prices. Kuptsikevich's reading is different and more constructive: the absence of selling into the $65,000 level — rather than sellers actively capping the price — suggests that what is being built above $65,000 is short positions, not supply from holders exiting.
The distinction matters for what happens next. If $65,000 is a level where profit-takers are selling, a breakout requires those sellers to exhaust their positions — a gradual absorption process. If $65,000 is a level where short sellers are accumulating positions, a breakout above it triggers short-covering — a rapid, self-reinforcing move as shorts are forced to buy to close positions. Kuptsikevich's "build-up of short positions well above this level" framing implies that a decisive break above $65,000 would be amplified by forced short covering rather than merely testing the next layer of seller supply.
The $70,000 Target — 200-Day Moving Average and the March-April Range
Kuptsikevich identified $70,000 as the next area to watch, with the 200-day moving average sitting nearby and clearing it representing a move above the range where buyers and sellers contested price through March and April. The $70,000 level has multiple simultaneous technical and analytical significances: it is a major round number psychological resistance, it aligns with the pre-correction consolidation zone from March-April 2026, it sits above the CryptoQuant STH realized price at $67,523 and the Bitfinex STH cost basis at $68,500, and it is the lower bound of the Deribit bull call spread cluster where $68,000 and $70,000 calls are currently dominating volume.
Kuptsikevich said clearing $70,000 would "shift sentiment meaningfully" — the specific threshold that converts the current fear-zone sentiment reading of 30 into something more constructive. The crypto sentiment index sitting at 30 — in the fear zone since mid-July with occasional dips toward extreme fear — is the psychological constraint that has prevented the $1.2 billion in whale accumulation and $865 million in five-session ETF inflows from translating into sustained price appreciation. A move through $70,000 and the 200-day MA would be the technical confirmation event that converts tactical buyers into convicted buyers — precisely the threshold Nexo's Kalchev identified when she said a decisive close above $65,000 was needed for recovery, except now the goalposts have been raised by four days of $65,000 failure to $70,000 as the sentiment-shifting level.
Oil at $87.73 — Trump's Iran Demands Reverse Monday's Oman Deal Optimism
Brent crude jumping 5% on Monday to $87.73 — reversing the Iran-Oman deal optimism that had lifted Bitcoin to $65,209 on Monday morning — is the most direct expression of the macro chain's resilience. Trump making fresh demands on Iran and dimming hopes of a Hormuz deal activated the same oil-up-yields-up-dollar-up-BTC-down chain that Fidelity's Jurrien Timmer identified as the "danger zone" mechanism. The 10-year yield rising 6 basis points on Monday to 4.71% — well above Timmer's 4.5% danger threshold — is the bond market's immediate translation of higher oil into higher inflation expectations and higher rate-hike probability.
For Wednesday's CPI print arriving at 8:30 a.m. ET, Brent at $87.73 is the most important input variable. Higher oil feeds directly into the CPI's energy component — fuel prices already running 15.7% above year-ago levels — and a CPI print that comes in above expectations on energy-driven inflation would validate the hawkish scenario where the September rate hike probability above 50% is maintained or increases. A below-expectations CPI print — if the June energy price decline relative to last year's elevated levels provides a base effect benefit — could reduce September hike odds despite current oil levels and provide Bitcoin with the macro relief that the Iran-Oman deal was supposed to deliver before Trump's Monday demands reversed that narrative.
ETF Flows — $865 Million Over Five Sessions, $91 Million Provisional Monday Outflow
The five-session $865 million inflow through August 7 — which included the $754 million week that was the best since April — reversed to a provisional $91 million outflow on Monday as the Iran deal reversal and oil jump reduced risk appetite. The $91 million outflow on a single session after $865 million over five sessions is a 10.5% single-day reversal of the week's institutional accumulation — significant in percentage terms but not catastrophic in absolute terms. It confirms that the ETF bid that has been building is not unconditional — it is sensitive to the same macro headwinds that capped Bitcoin at $65,000 four consecutive days.
The $91 million outflow's cause — Trump's fresh Iran demands and 5% oil jump rather than any crypto-specific negative development — means the ETF bid can return as quickly as the macro deteriorated if Wednesday's CPI provides a dovish surprise or Iran deal negotiations produce a credible Oman-mediated framework. Institutional allocators using ETFs as their Bitcoin exposure vehicle are managing macro risk, not changing their Bitcoin conviction.
The CPI Wednesday Setup — The Week's Defining Catalyst
Wednesday's US CPI print is the scheduled catalyst that will determine whether Bitcoin's fourth $65,000 failure is followed by a fifth or by the breakout that forces Kuptsikevich's short-covering dynamic. The specific inputs: Brent crude at $87.73 with a 5% Monday jump adding oil cost pressure, the base effect from June 2025's elevated energy prices potentially providing a favorable year-over-year comparison, core CPI excluding food and energy as the Fed's preferred inflation signal, and the overall headline number that will directly impact September rate hike probability from its current elevated level.
A CPI below 3.5% — particularly if core CPI shows deceleration — would reduce September hike odds, soften the 10-year yield from 4.71%, weaken the dollar, and provide Bitcoin with the macro permission to attempt a fifth $65,000 test with the short-covering fuel that Kuptsikevich identified. A CPI above 4.0% on energy-driven headline inflation would validate the hawks, send yields above 4.75%, and push Bitcoin back toward the 200-week SMA at $62,873.
Four Failed $65,000 Tests — FxPro's Kuptsikevich Reads Shorts Building, Not Profit-Taking
FxPro chief market analyst Alex Kuptsikevich's interpretation of the four-day $65,000 test is the most analytically useful framing of Bitcoin's current price behavior. The standard interpretation of repeated tests of a level without a breakout is that sellers are absorbing buying attempts — profit-taking by existing holders who purchased at lower prices. Kuptsikevich's reading is different and more constructive: the absence of selling into the $65,000 level — rather than sellers actively capping the price — suggests that what is being built above $65,000 is short positions, not supply from holders exiting.
The distinction matters for what happens next. If $65,000 is a level where profit-takers are selling, a breakout requires those sellers to exhaust their positions — a gradual absorption process. If $65,000 is a level where short sellers are accumulating positions, a breakout above it triggers short-covering — a rapid, self-reinforcing move as shorts are forced to buy to close positions. Kuptsikevich's "build-up of short positions well above this level" framing implies that a decisive break above $65,000 would be amplified by forced short covering rather than merely testing the next layer of seller supply.
The $70,000 Target — 200-Day Moving Average and the March-April Range
Kuptsikevich identified $70,000 as the next area to watch, with the 200-day moving average sitting nearby and clearing it representing a move above the range where buyers and sellers contested price through March and April. The $70,000 level has multiple simultaneous technical and analytical significances: it is a major round number psychological resistance, it aligns with the pre-correction consolidation zone from March-April 2026, it sits above the CryptoQuant STH realized price at $67,523 and the Bitfinex STH cost basis at $68,500, and it is the lower bound of the Deribit bull call spread cluster where $68,000 and $70,000 calls are currently dominating volume.
Kuptsikevich said clearing $70,000 would "shift sentiment meaningfully" — the specific threshold that converts the current fear-zone sentiment reading of 30 into something more constructive. The crypto sentiment index sitting at 30 — in the fear zone since mid-July with occasional dips toward extreme fear — is the psychological constraint that has prevented the $1.2 billion in whale accumulation and $865 million in five-session ETF inflows from translating into sustained price appreciation. A move through $70,000 and the 200-day MA would be the technical confirmation event that converts tactical buyers into convicted buyers — precisely the threshold Nexo's Kalchev identified when she said a decisive close above $65,000 was needed for recovery, except now the goalposts have been raised by four days of $65,000 failure to $70,000 as the sentiment-shifting level.
Oil at $87.73 — Trump's Iran Demands Reverse Monday's Oman Deal Optimism
Brent crude jumping 5% on Monday to $87.73 — reversing the Iran-Oman deal optimism that had lifted Bitcoin to $65,209 on Monday morning — is the most direct expression of the macro chain's resilience. Trump making fresh demands on Iran and dimming hopes of a Hormuz deal activated the same oil-up-yields-up-dollar-up-BTC-down chain that Fidelity's Jurrien Timmer identified as the "danger zone" mechanism. The 10-year yield rising 6 basis points on Monday to 4.71% — well above Timmer's 4.5% danger threshold — is the bond market's immediate translation of higher oil into higher inflation expectations and higher rate-hike probability.
For Wednesday's CPI print arriving at 8:30 a.m. ET, Brent at $87.73 is the most important input variable. Higher oil feeds directly into the CPI's energy component — fuel prices already running 15.7% above year-ago levels — and a CPI print that comes in above expectations on energy-driven inflation would validate the hawkish scenario where the September rate hike probability above 50% is maintained or increases. A below-expectations CPI print — if the June energy price decline relative to last year's elevated levels provides a base effect benefit — could reduce September hike odds despite current oil levels and provide Bitcoin with the macro relief that the Iran-Oman deal was supposed to deliver before Trump's Monday demands reversed that narrative.
ETF Flows — $865 Million Over Five Sessions, $91 Million Provisional Monday Outflow
The five-session $865 million inflow through August 7 — which included the $754 million week that was the best since April — reversed to a provisional $91 million outflow on Monday as the Iran deal reversal and oil jump reduced risk appetite. The $91 million outflow on a single session after $865 million over five sessions is a 10.5% single-day reversal of the week's institutional accumulation — significant in percentage terms but not catastrophic in absolute terms. It confirms that the ETF bid that has been building is not unconditional — it is sensitive to the same macro headwinds that capped Bitcoin at $65,000 four consecutive days.
The $91 million outflow's cause — Trump's fresh Iran demands and 5% oil jump rather than any crypto-specific negative development — means the ETF bid can return as quickly as the macro deteriorated if Wednesday's CPI provides a dovish surprise or Iran deal negotiations produce a credible Oman-mediated framework. Institutional allocators using ETFs as their Bitcoin exposure vehicle are managing macro risk, not changing their Bitcoin conviction.
The CPI Wednesday Setup — The Week's Defining Catalyst
Wednesday's US CPI print is the scheduled catalyst that will determine whether Bitcoin's fourth $65,000 failure is followed by a fifth or by the breakout that forces Kuptsikevich's short-covering dynamic. The specific inputs: Brent crude at $87.73 with a 5% Monday jump adding oil cost pressure, the base effect from June 2025's elevated energy prices potentially providing a favorable year-over-year comparison, core CPI excluding food and energy as the Fed's preferred inflation signal, and the overall headline number that will directly impact September rate hike probability from its current elevated level.
A CPI below 3.5% — particularly if core CPI shows deceleration — would reduce September hike odds, soften the 10-year yield from 4.71%, weaken the dollar, and provide Bitcoin with the macro permission to attempt a fifth $65,000 test with the short-covering fuel that Kuptsikevich identified. A CPI above 4.0% on energy-driven headline inflation would validate the hawks, send yields above 4.75%, and push Bitcoin back toward the 200-week SMA at $62,873.
$PRL — +75% in 15 days, slowly but surely:
🟢 Up ~75% in 15 days, steady climb (no hype candle)
✅ Move stop-loss to entry:
1️⃣ Big win if it runs
2️⃣ Break-even if it doesn’t
💰 Or take profit — your call
🎯 And $KERNEL — just shared 1 day ago, still in Oldman’s buy zone.
Patience pays. 👀#RobinhoodToOfferCryptoTradingInUK #SouthKoreaTopCourtProposesCryptoFreeze
🟢 Up ~75% in 15 days, steady climb (no hype candle)
✅ Move stop-loss to entry:
1️⃣ Big win if it runs
2️⃣ Break-even if it doesn’t
💰 Or take profit — your call
🎯 And $KERNEL — just shared 1 day ago, still in Oldman’s buy zone.
Patience pays. 👀#RobinhoodToOfferCryptoTradingInUK #SouthKoreaTopCourtProposesCryptoFreeze
Nice😊 beautiful😍


Yi He
·
--
OOTD today:Binance Yellow.
黄袍不是皇袍,迄今大清灭国已114年。
黄袍不是皇袍,迄今大清灭国已114年。

$BLESS
LONG bias, but only on confirmation.
4H shows a sharp pump, deep retracement, then base formation around 0.012–0.014. Price is starting to recover, so I prefer long rather than short.
Current: 0.01395
Long entry: 0.0132–0.0137
SL: 0.0118
TP1: 0.0180 TP2: 0.0220 TP3: 0.0280
#RobinhoodToOfferCryptoTradingInUK #USRedirects55VesselsUnderHormuzBlockade
LONG bias, but only on confirmation.
4H shows a sharp pump, deep retracement, then base formation around 0.012–0.014. Price is starting to recover, so I prefer long rather than short.
Current: 0.01395
Long entry: 0.0132–0.0137
SL: 0.0118
TP1: 0.0180 TP2: 0.0220 TP3: 0.0280
#RobinhoodToOfferCryptoTradingInUK #USRedirects55VesselsUnderHormuzBlockade
Войдите, чтобы посмотреть больше материала