

Chumba Money
6.6k Публикации

Chumba Money
 Square Verified
Отправить жалобу
Заблокировать пользователя
Research & Analysis | Crypto Education | Chumba Labs Dev

Top Voices

Level 2 Creator
1 подписок(и/а)
49.8K+ подписчиков(а)
18.1K понравилось
2 Значки
Посты
Все
Цитирования
·
--
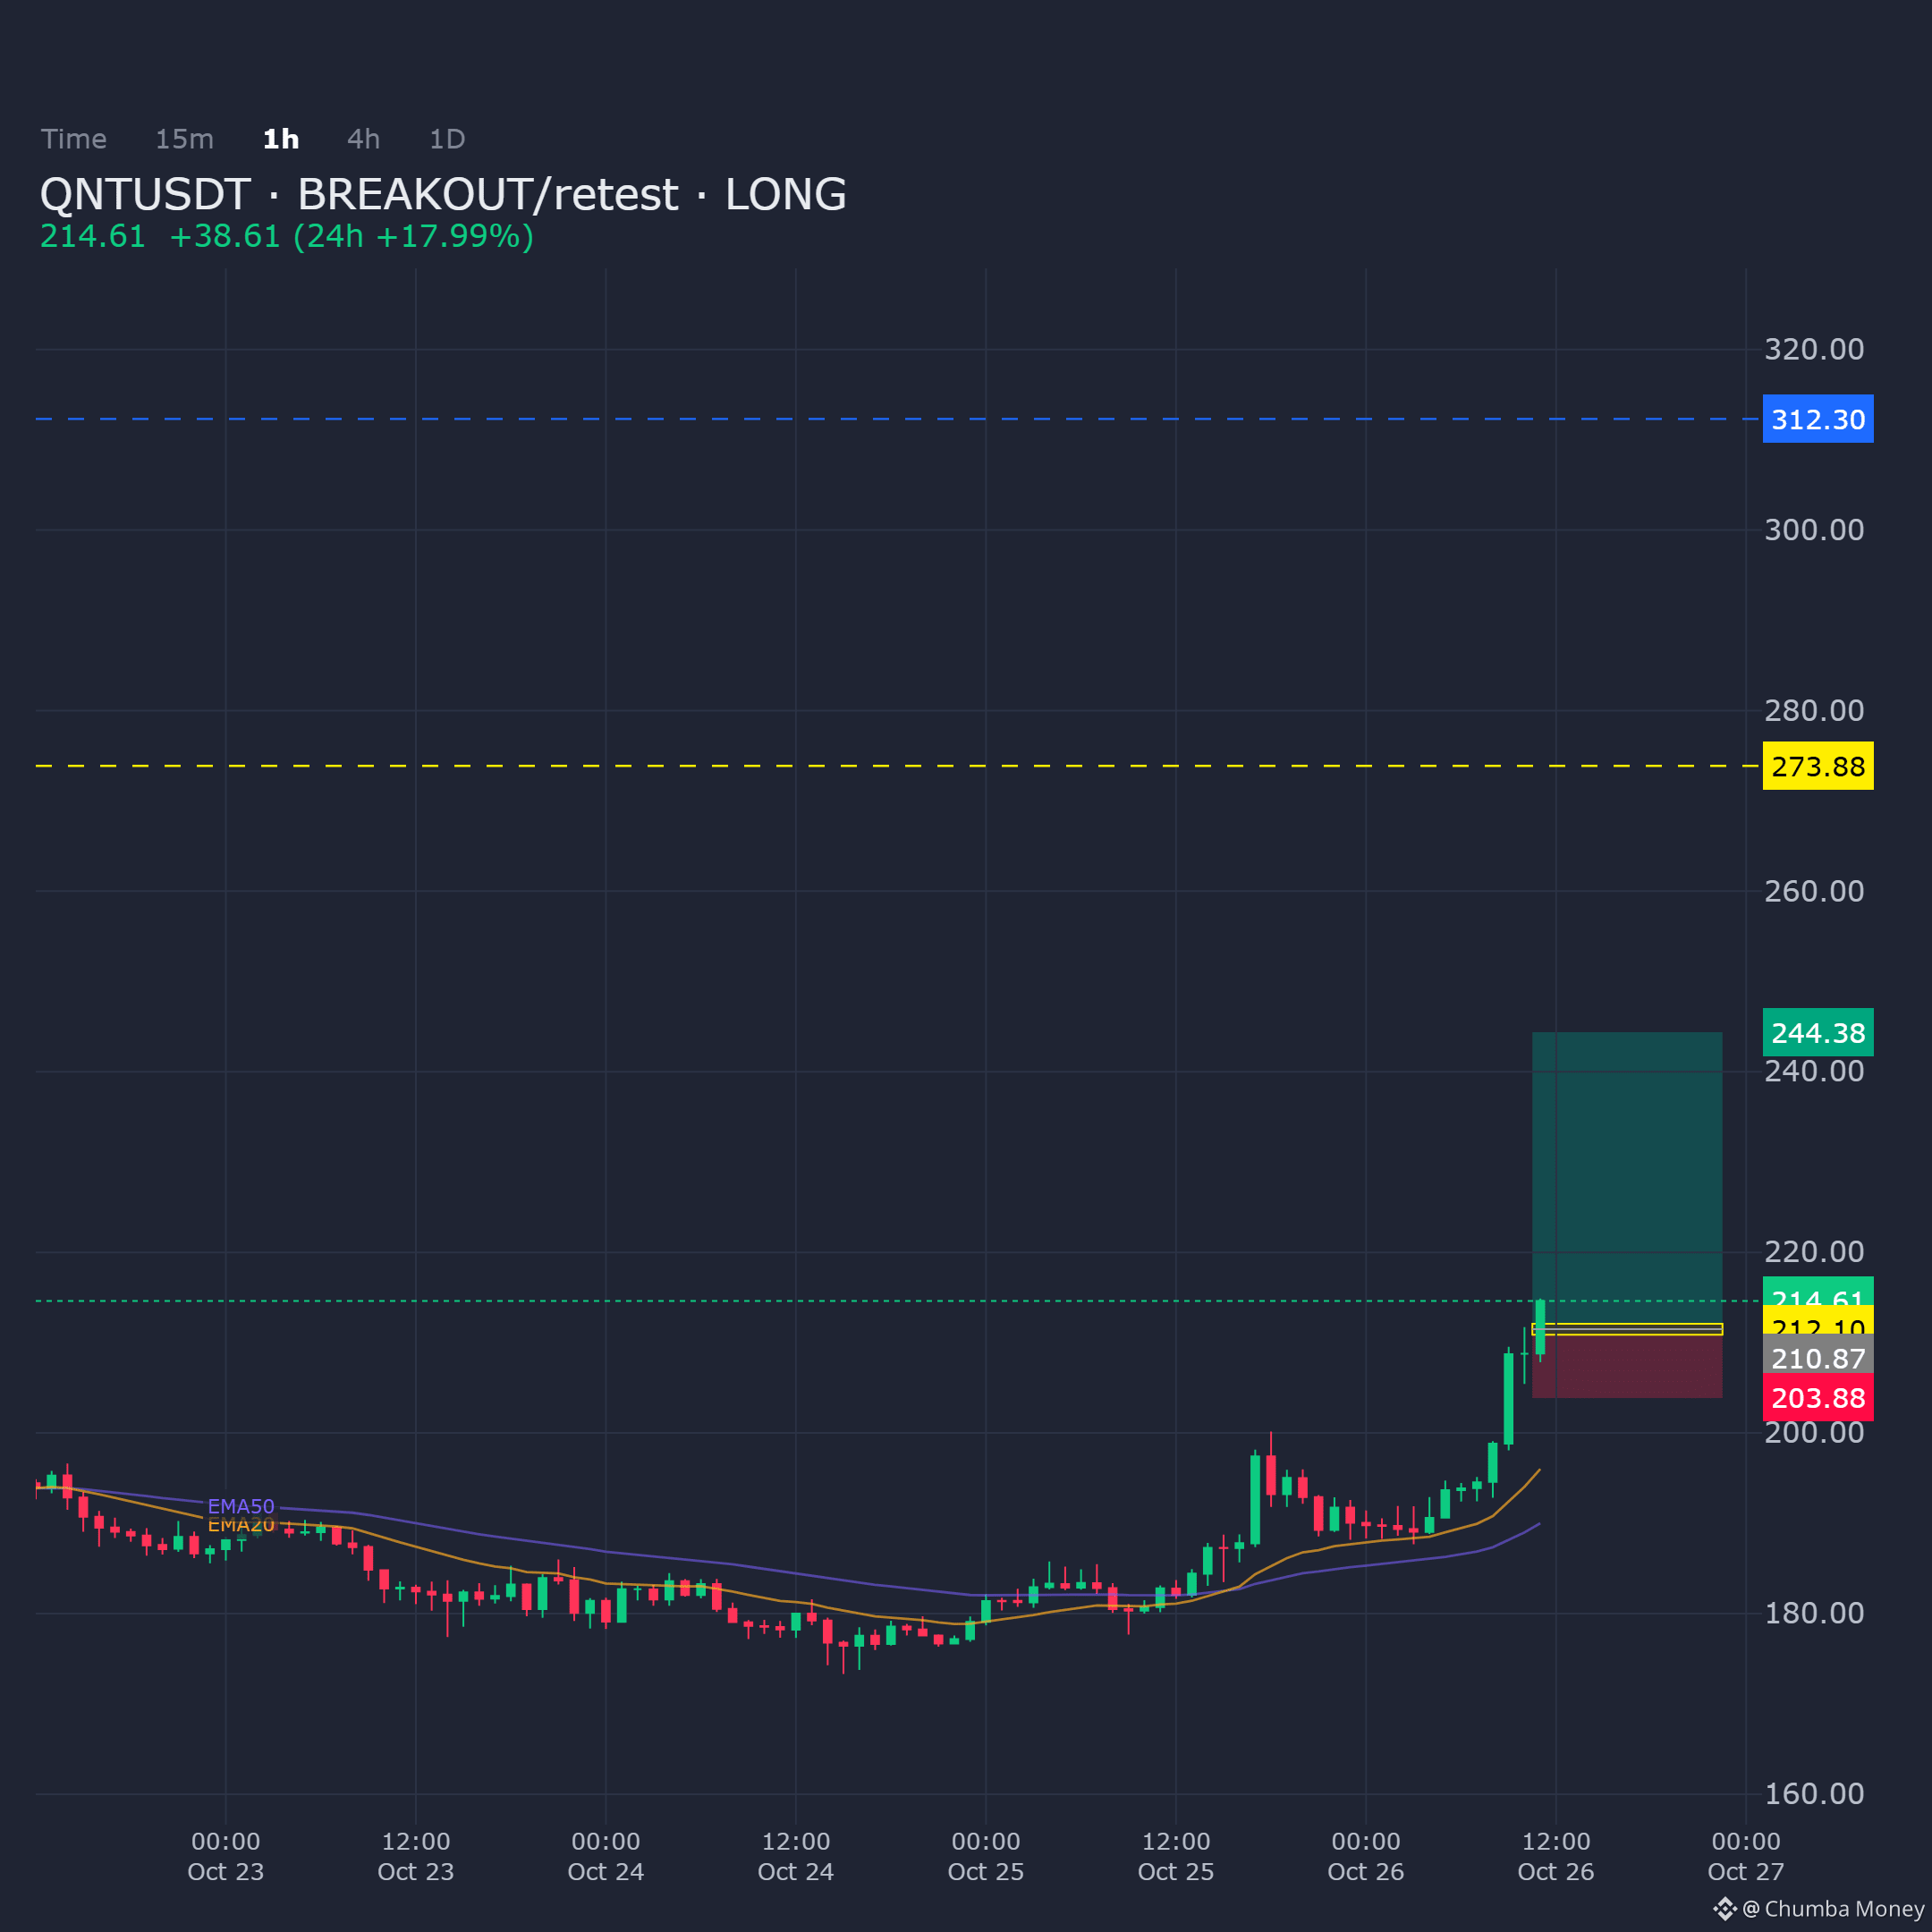
QNTUSDT on the 1H chart is holding structure into demand, with a breakout and retest setup forming for a long bias.
Entry: 210.87 - 212.1
Targets: TP1: 244.38, TP2: 273.88, TP3: 312.3
Stop Loss: 203.88
$QNT
QNTUSDT on the 1H chart is holding structure into demand, with a breakout and retest setup forming for a long bias.
Entry: 210.87 - 212.1
Targets: TP1: 244.38, TP2: 273.88, TP3: 312.3
Stop Loss: 203.88
$QNT
Entry: 210.87 - 212.1
Targets: TP1: 244.38, TP2: 273.88, TP3: 312.3
Stop Loss: 203.88
$QNT
6
·
--
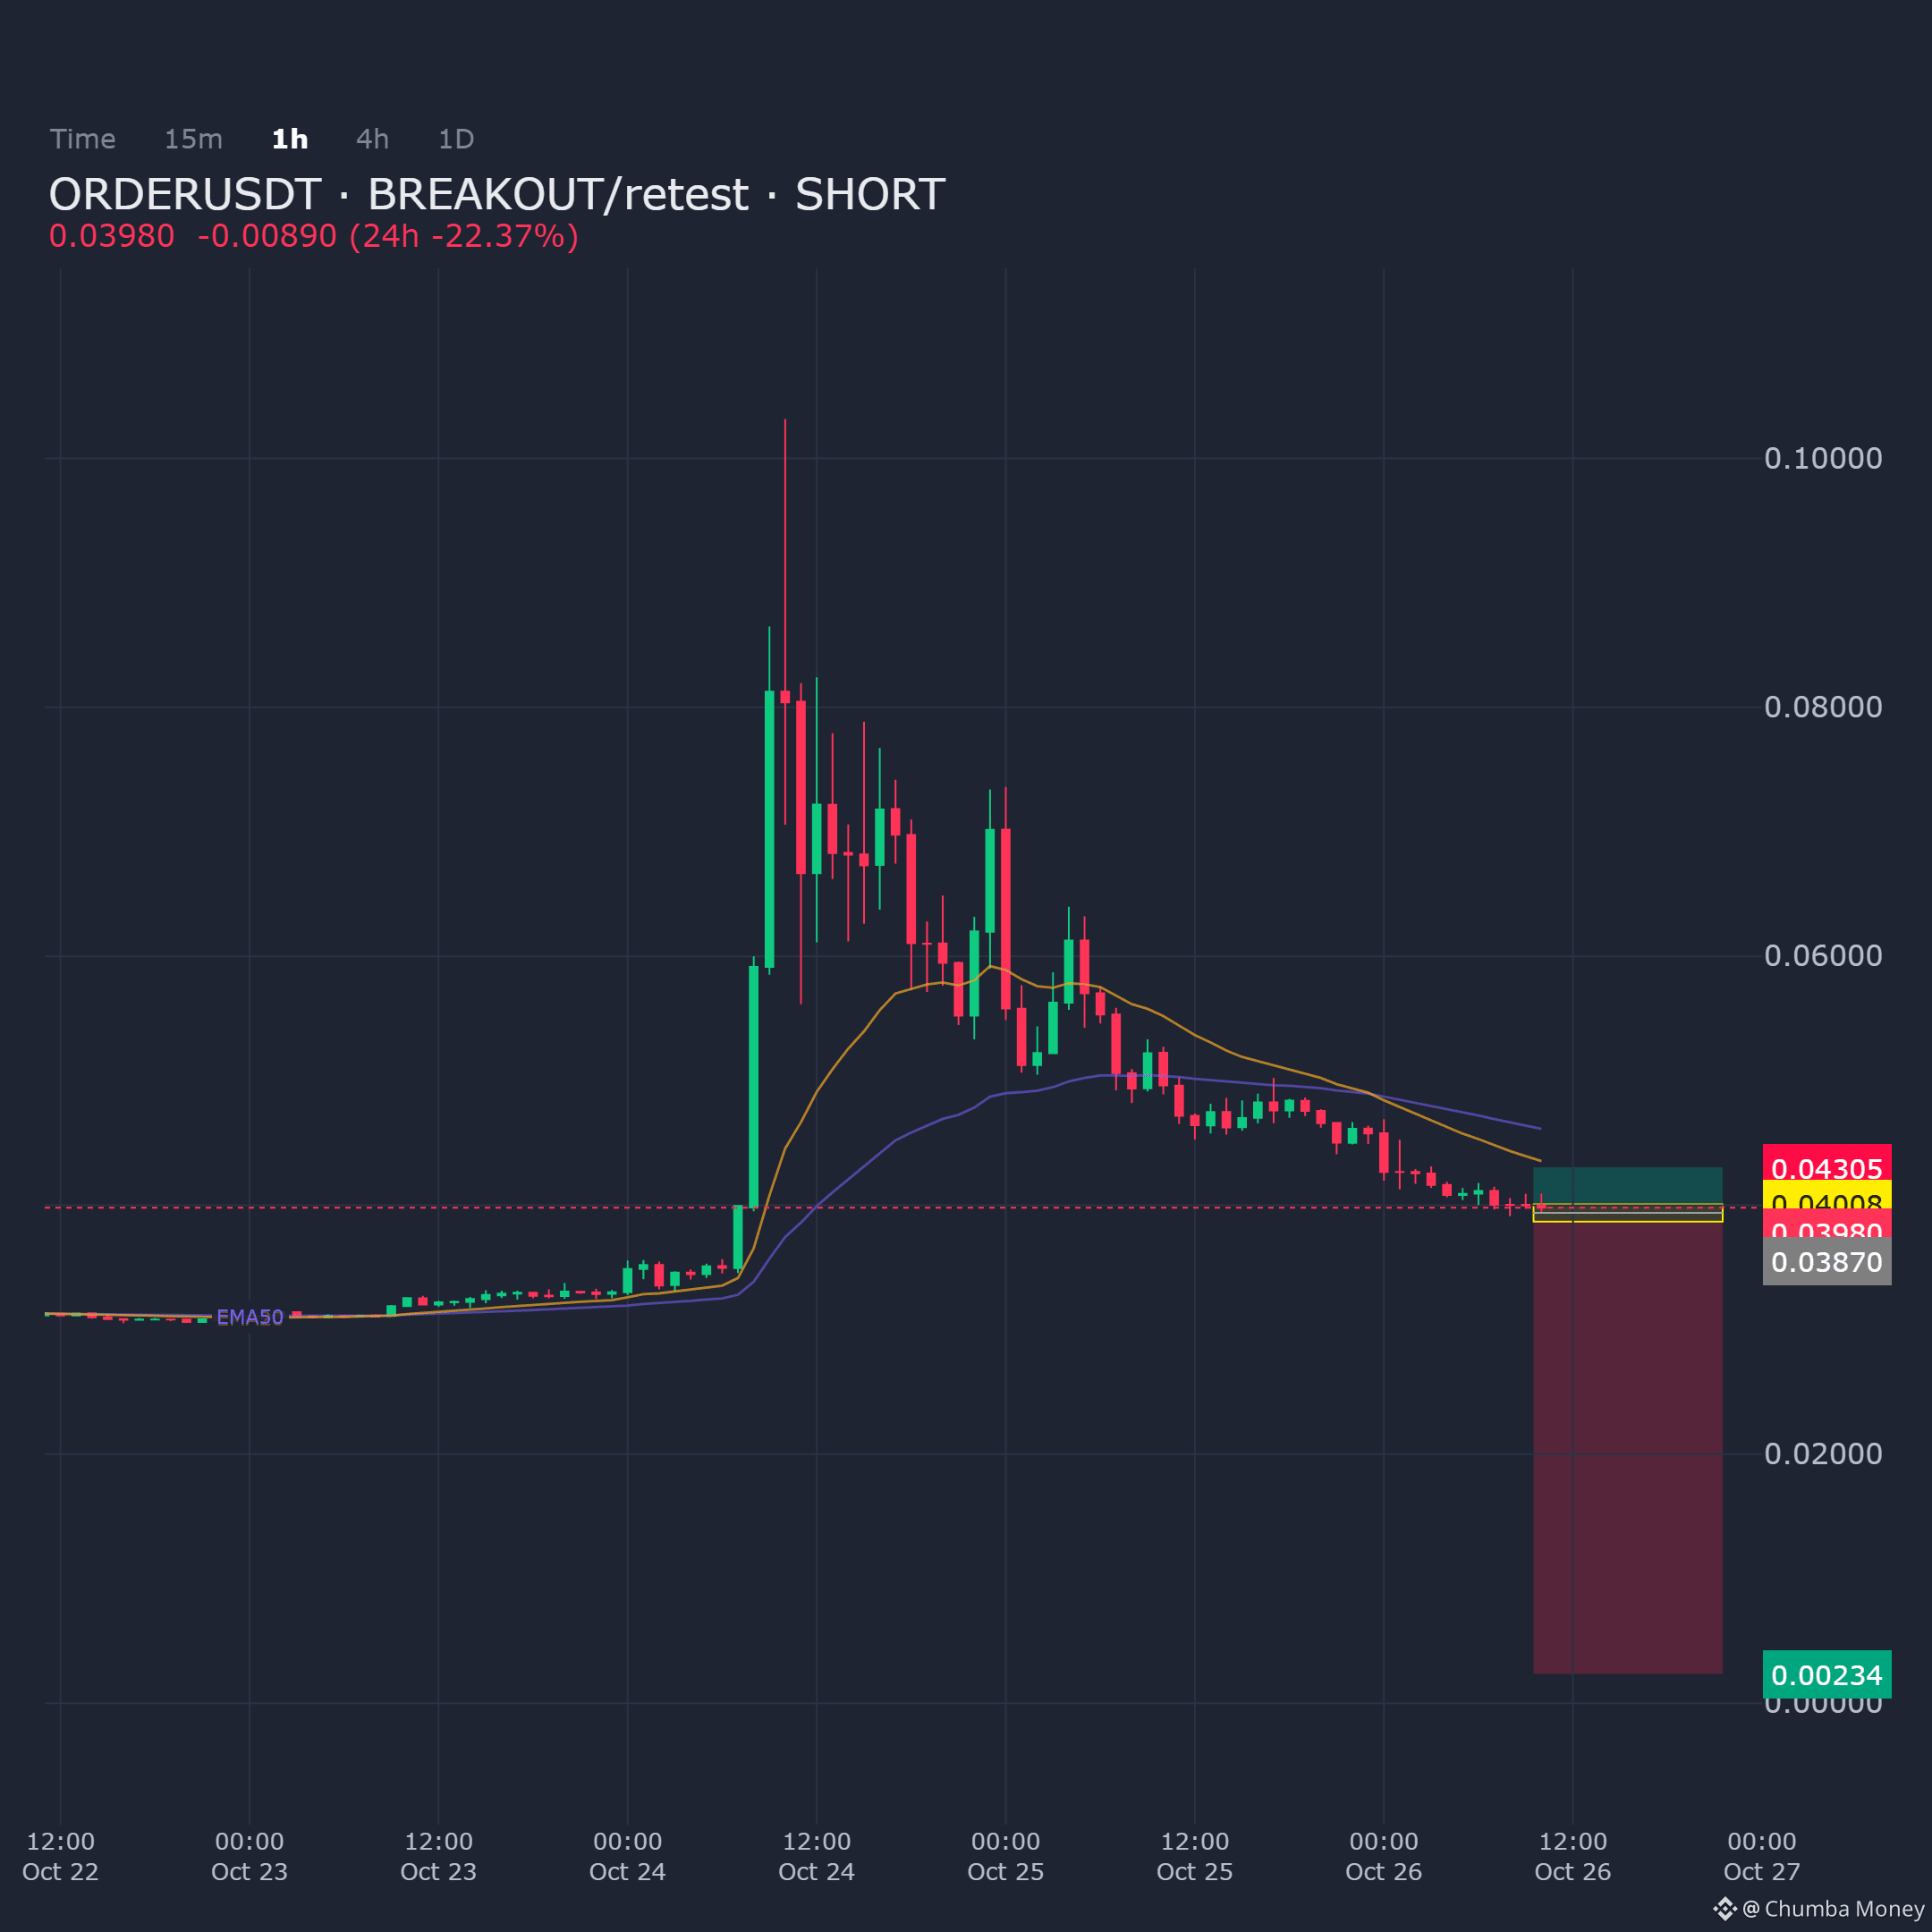
ORDERUSDT on the 1H chart shows price pushing into supply, maintaining a short bias from this area.
Entry: 0.038697 - 0.040082
Targets: TP1: 0.002342, TP2: 0.002342, TP3: 0.002342
Stop Loss: 0.043049
$ORDER
ORDERUSDT on the 1H chart shows price pushing into supply, maintaining a short bias from this area.
Entry: 0.038697 - 0.040082
Targets: TP1: 0.002342, TP2: 0.002342, TP3: 0.002342
Stop Loss: 0.043049
$ORDER
Entry: 0.038697 - 0.040082
Targets: TP1: 0.002342, TP2: 0.002342, TP3: 0.002342
Stop Loss: 0.043049
$ORDER
21
·
--
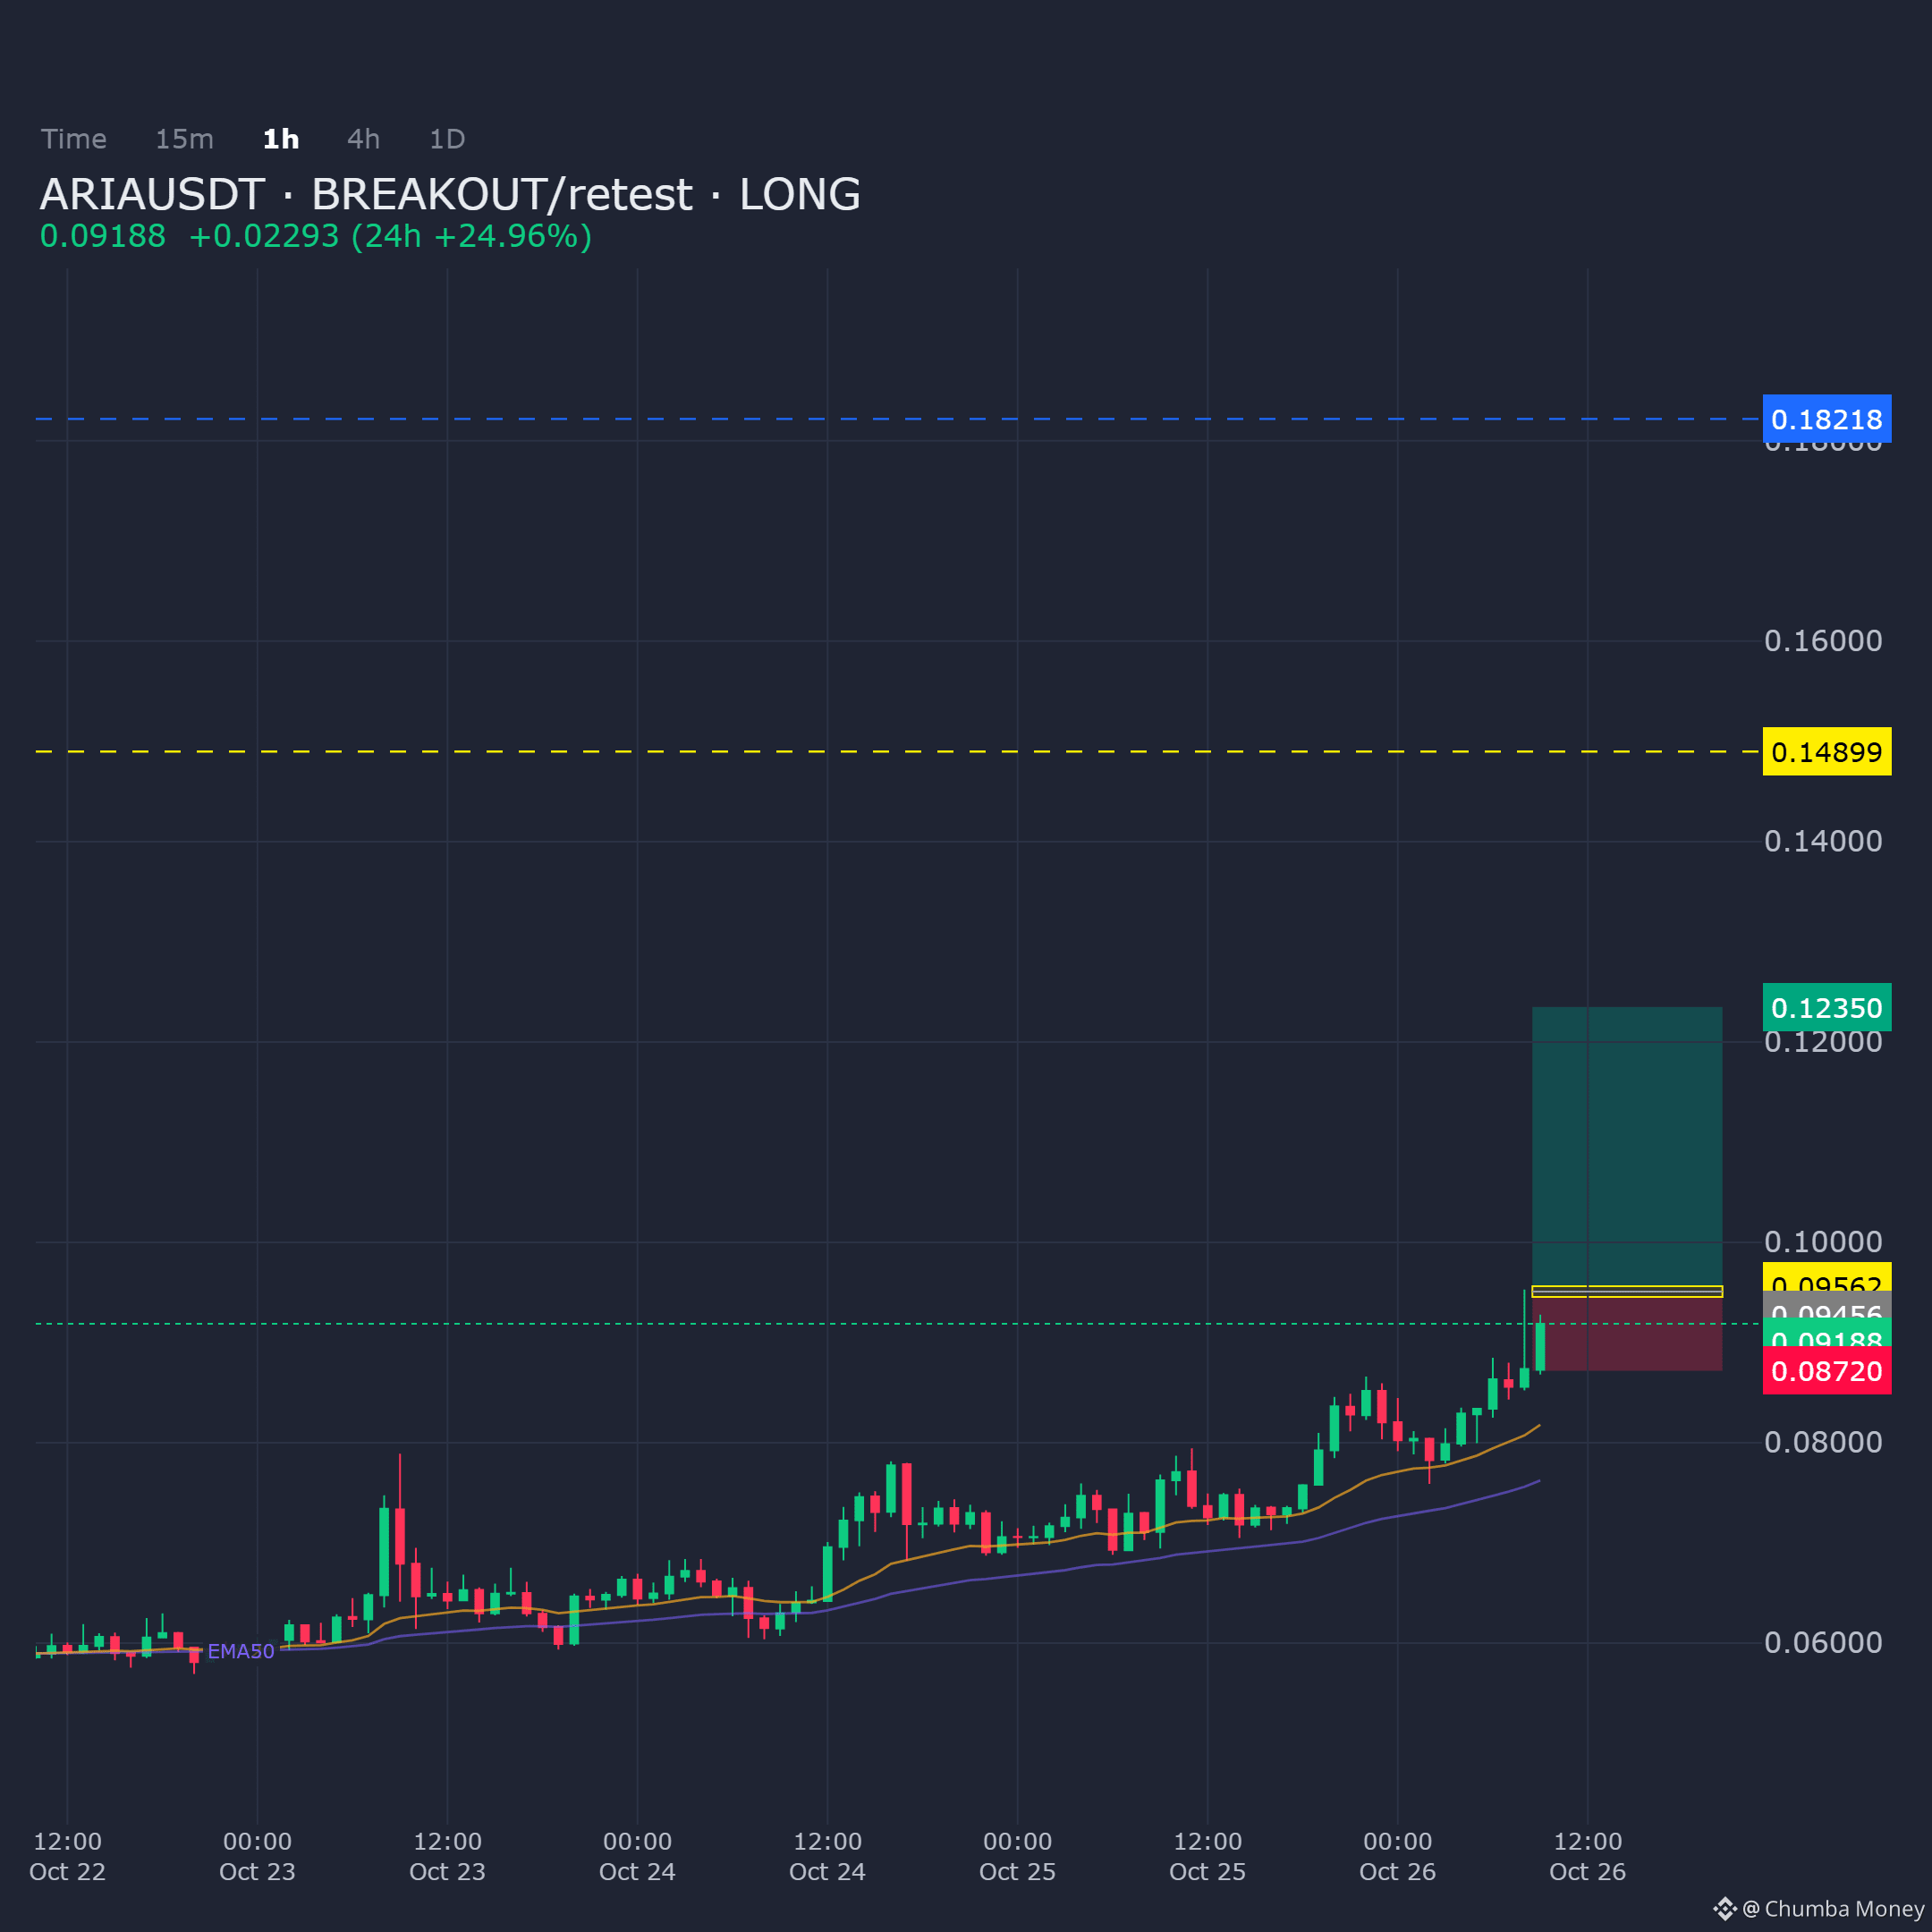
ARIAUSDT on the 1H chart shows a bullish bias, with price approaching a key breakout zone awaiting retest confirmation. Structure aligns with the long setup below.
Entry: 0.09456 - 0.095622
Targets: TP1: 0.123502, TP2: 0.148991, TP3: 0.182181
Stop Loss: 0.087202
$ARIA
ARIAUSDT on the 1H chart shows a bullish bias, with price approaching a key breakout zone awaiting retest confirmation. Structure aligns with the long setup below.
Entry: 0.09456 - 0.095622
Targets: TP1: 0.123502, TP2: 0.148991, TP3: 0.182181
Stop Loss: 0.087202
$ARIA
Entry: 0.09456 - 0.095622
Targets: TP1: 0.123502, TP2: 0.148991, TP3: 0.182181
Stop Loss: 0.087202
$ARIA
21
·
--

Статья
BITCOIN ETF INFLOWS AND THE LIMITS OF A SINGLE-WEEK REBOUNDUS spot Bitcoin ETFs ended the week with approximately $301 million in net inflows, according to reporting from Cointelegraph and Decrypt. This ended a two-week losing streak. However, both outlets note that October remains in the red and that the week concluded with two consecutive days of outflows. The headline inflow figure should be read as a partial reversal, not a confirmed trend change.
Bitcoin traded near $80,455 at the time of this research, up 0.29% over 24 hours but down roughly 3% over seven days. Ethereum was near $2,333, down about 4.3% over seven days. Total crypto market capitalization fell 2.41% over 24 hours. These price movements suggest that ETF flows did not translate into broad spot-market strength.
The under-priced narrative is that one positive weekly print signals renewed institutional demand. The evidence is thin. A single $301 million inflow is small relative to Bitcoin’s market cap and to the scale of prior outflows. Late-week withdrawals indicate that investor sentiment remained fragile even as the weekly total turned positive.
Key catalysts to watch include Federal Reserve, ECB, and Bank of Japan interest-rate decisions, plus Coinbase earnings. Macro policy shifts typically drive ETF flows more than isolated weekly flow data. Risks include further late-week outflows, negative October monthly totals, and continued security incidents at exchanges and custodians, such as the reported $16 million loss at CoinDCX and the Keystone data-breach allegations.
Falsifiers for the recovery narrative would be a return to weekly outflows, a deeper monthly decline for October, or Bitcoin failing to hold the $80,000 area amid macro volatility. A sustained multi-week inflow streak accompanied by spot-price resilience would be required to upgrade the interpretation from technical bounce to structural demand shift.
Takeaway: The $301 million ETF inflow is a useful observation, not a trend confirmation. Treat it as a pause in outflows rather than evidence of renewed institutional conviction.
BITCOIN ETF INFLOWS AND THE LIMITS OF A SINGLE-WEEK REBOUND
US spot Bitcoin ETFs ended the week with approximately $301 million in net inflows, according to reporting from Cointelegraph and Decrypt. This ended a two-week losing streak. However, both outlets note that October remains in the red and that the week concluded with two consecutive days of outflows. The headline inflow figure should be read as a partial reversal, not a confirmed trend change.
Bitcoin traded near $80,455 at the time of this research, up 0.29% over 24 hours but down roughly 3% over seven days. Ethereum was near $2,333, down about 4.3% over seven days. Total crypto market capitalization fell 2.41% over 24 hours. These price movements suggest that ETF flows did not translate into broad spot-market strength.
The under-priced narrative is that one positive weekly print signals renewed institutional demand. The evidence is thin. A single $301 million inflow is small relative to Bitcoin’s market cap and to the scale of prior outflows. Late-week withdrawals indicate that investor sentiment remained fragile even as the weekly total turned positive.
Key catalysts to watch include Federal Reserve, ECB, and Bank of Japan interest-rate decisions, plus Coinbase earnings. Macro policy shifts typically drive ETF flows more than isolated weekly flow data. Risks include further late-week outflows, negative October monthly totals, and continued security incidents at exchanges and custodians, such as the reported $16 million loss at CoinDCX and the Keystone data-breach allegations.
Falsifiers for the recovery narrative would be a return to weekly outflows, a deeper monthly decline for October, or Bitcoin failing to hold the $80,000 area amid macro volatility. A sustained multi-week inflow streak accompanied by spot-price resilience would be required to upgrade the interpretation from technical bounce to structural demand shift.
Takeaway: The $301 million ETF inflow is a useful observation, not a trend confirmation. Treat it as a pause in outflows rather than evidence of renewed institutional conviction.
14
·
--
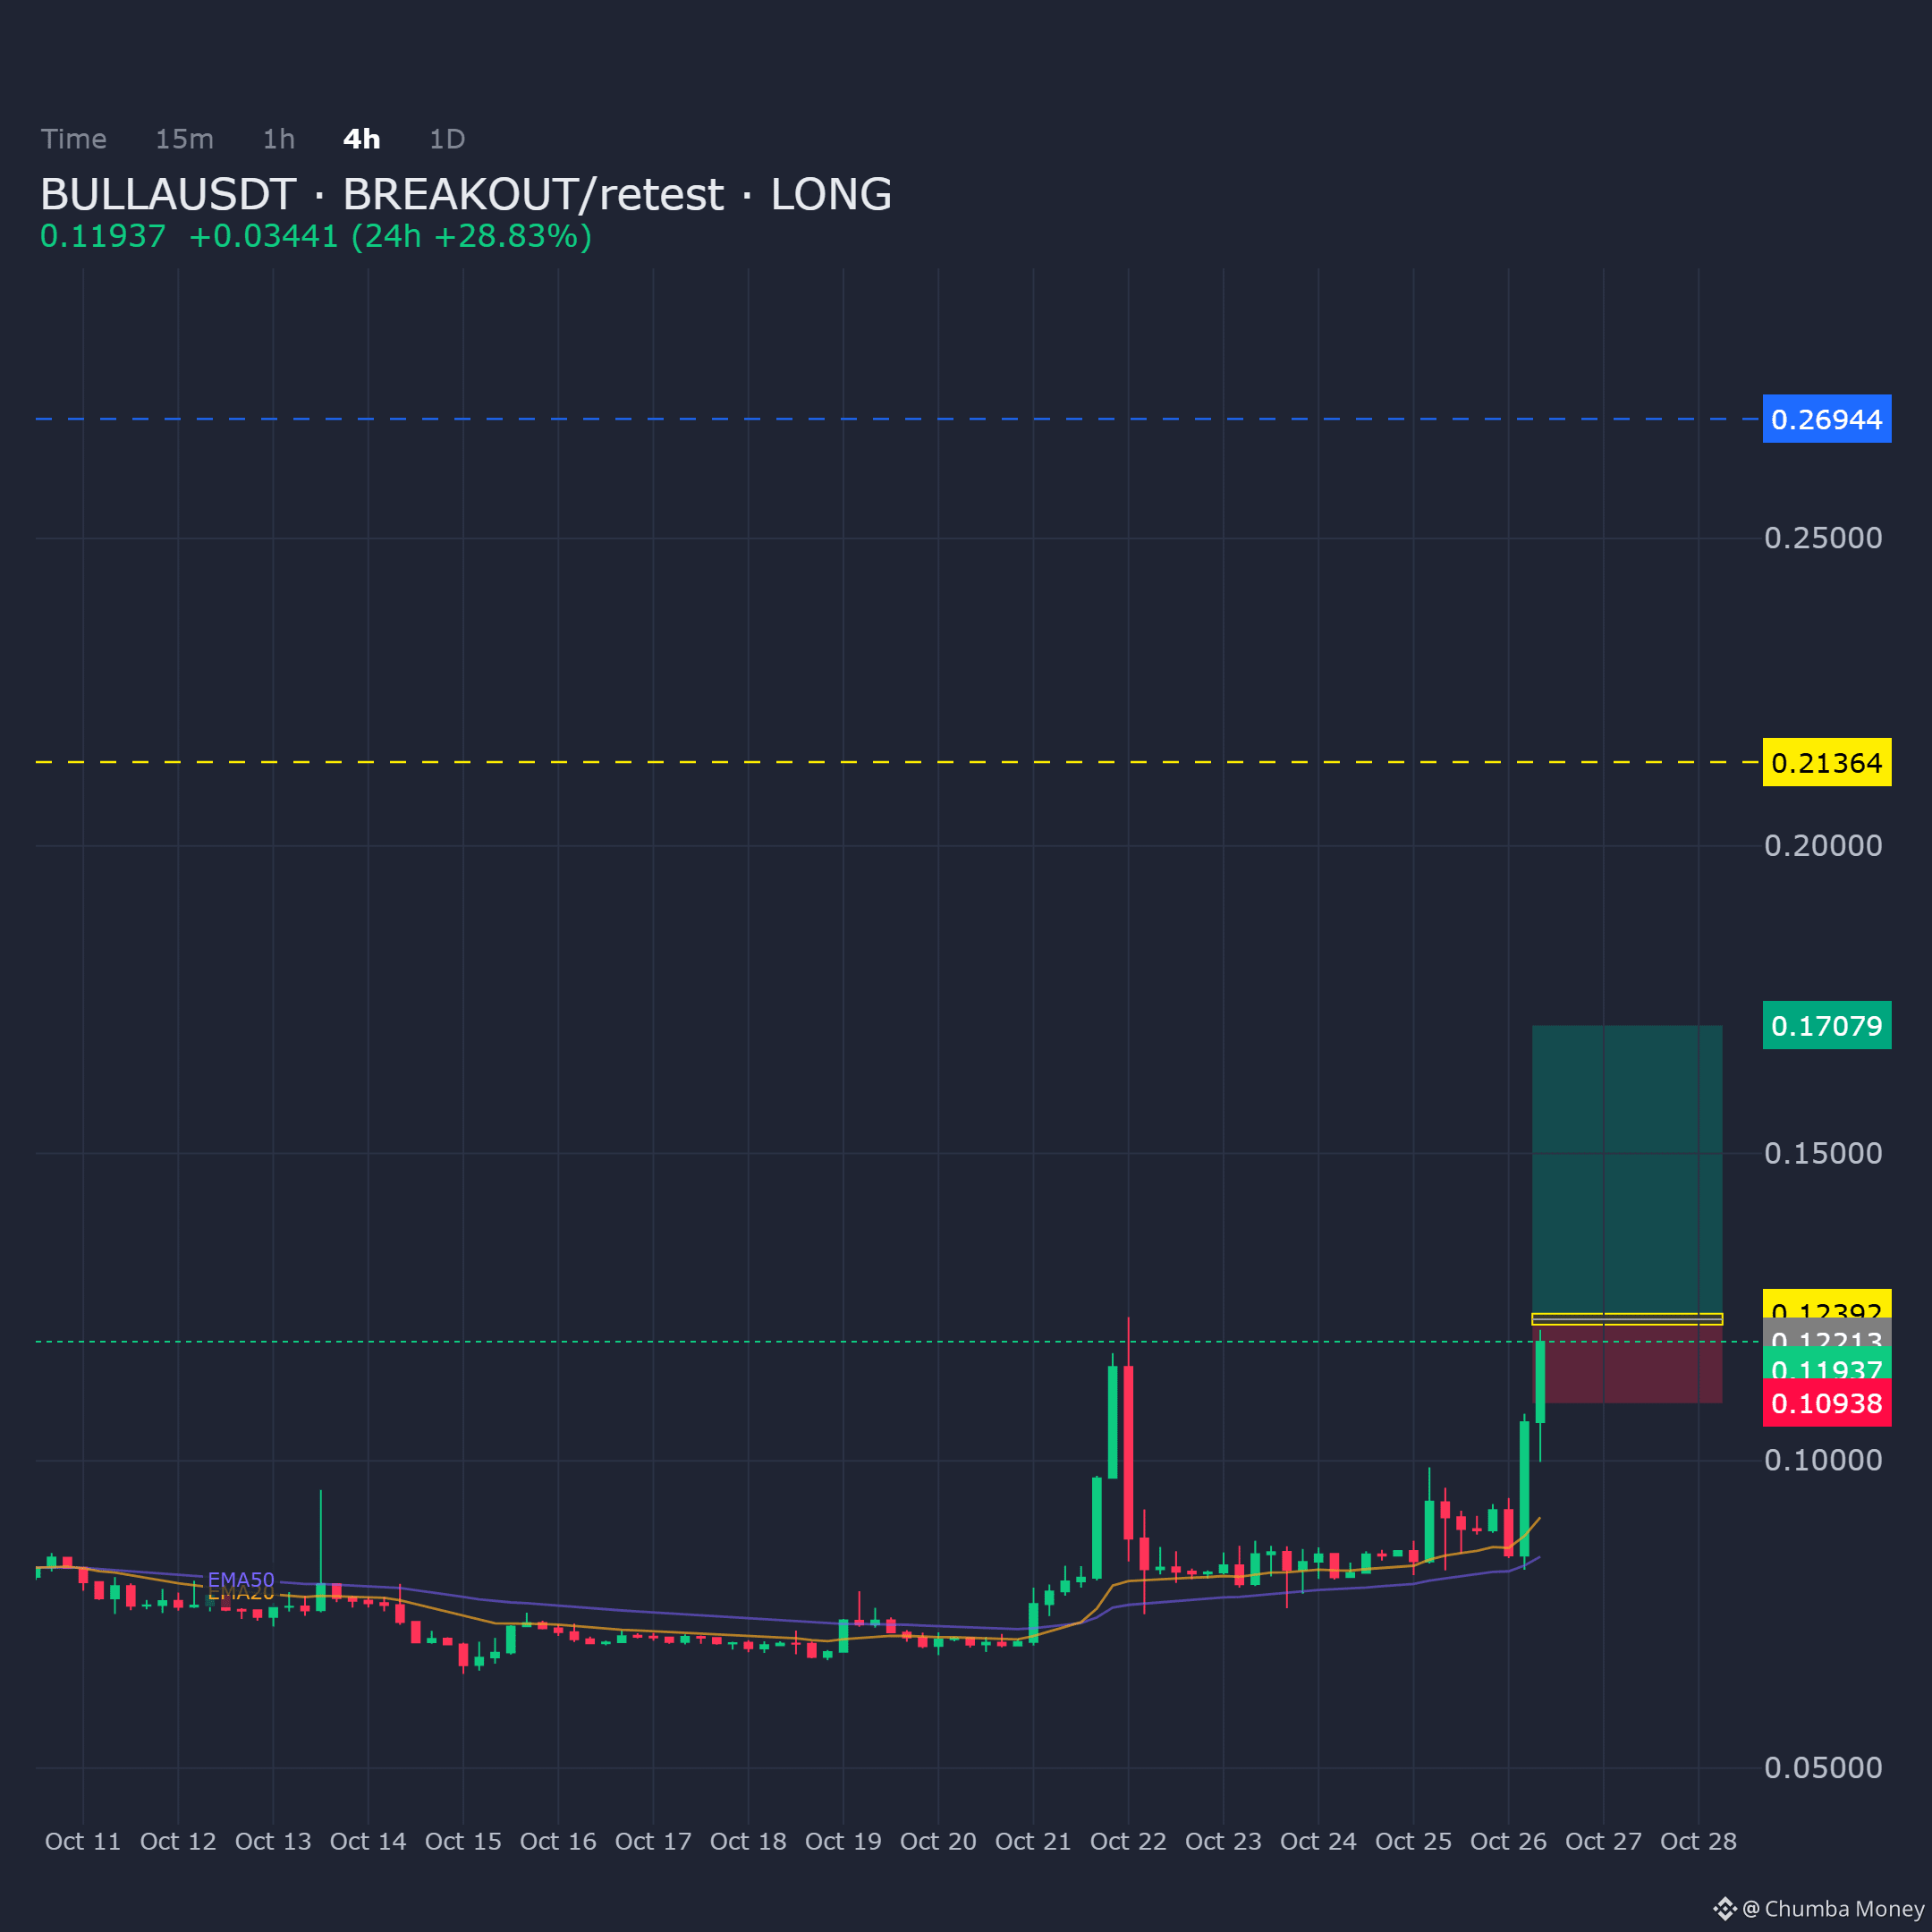
BULLAUSDT on the 4H timeframe shows confluence supporting a long bias via breakout-retest structure. Price is approaching the key demand zone.
Entry: 0.122132 - 0.123918
Targets: TP1: 0.17079, TP2: 0.213644, TP3: 0.269444
Stop Loss: 0.10938
$BULLA
BULLAUSDT on the 4H timeframe shows confluence supporting a long bias via breakout-retest structure. Price is approaching the key demand zone.
Entry: 0.122132 - 0.123918
Targets: TP1: 0.17079, TP2: 0.213644, TP3: 0.269444
Stop Loss: 0.10938
$BULLA
Entry: 0.122132 - 0.123918
Targets: TP1: 0.17079, TP2: 0.213644, TP3: 0.269444
Stop Loss: 0.10938
$BULLA
52
·
--
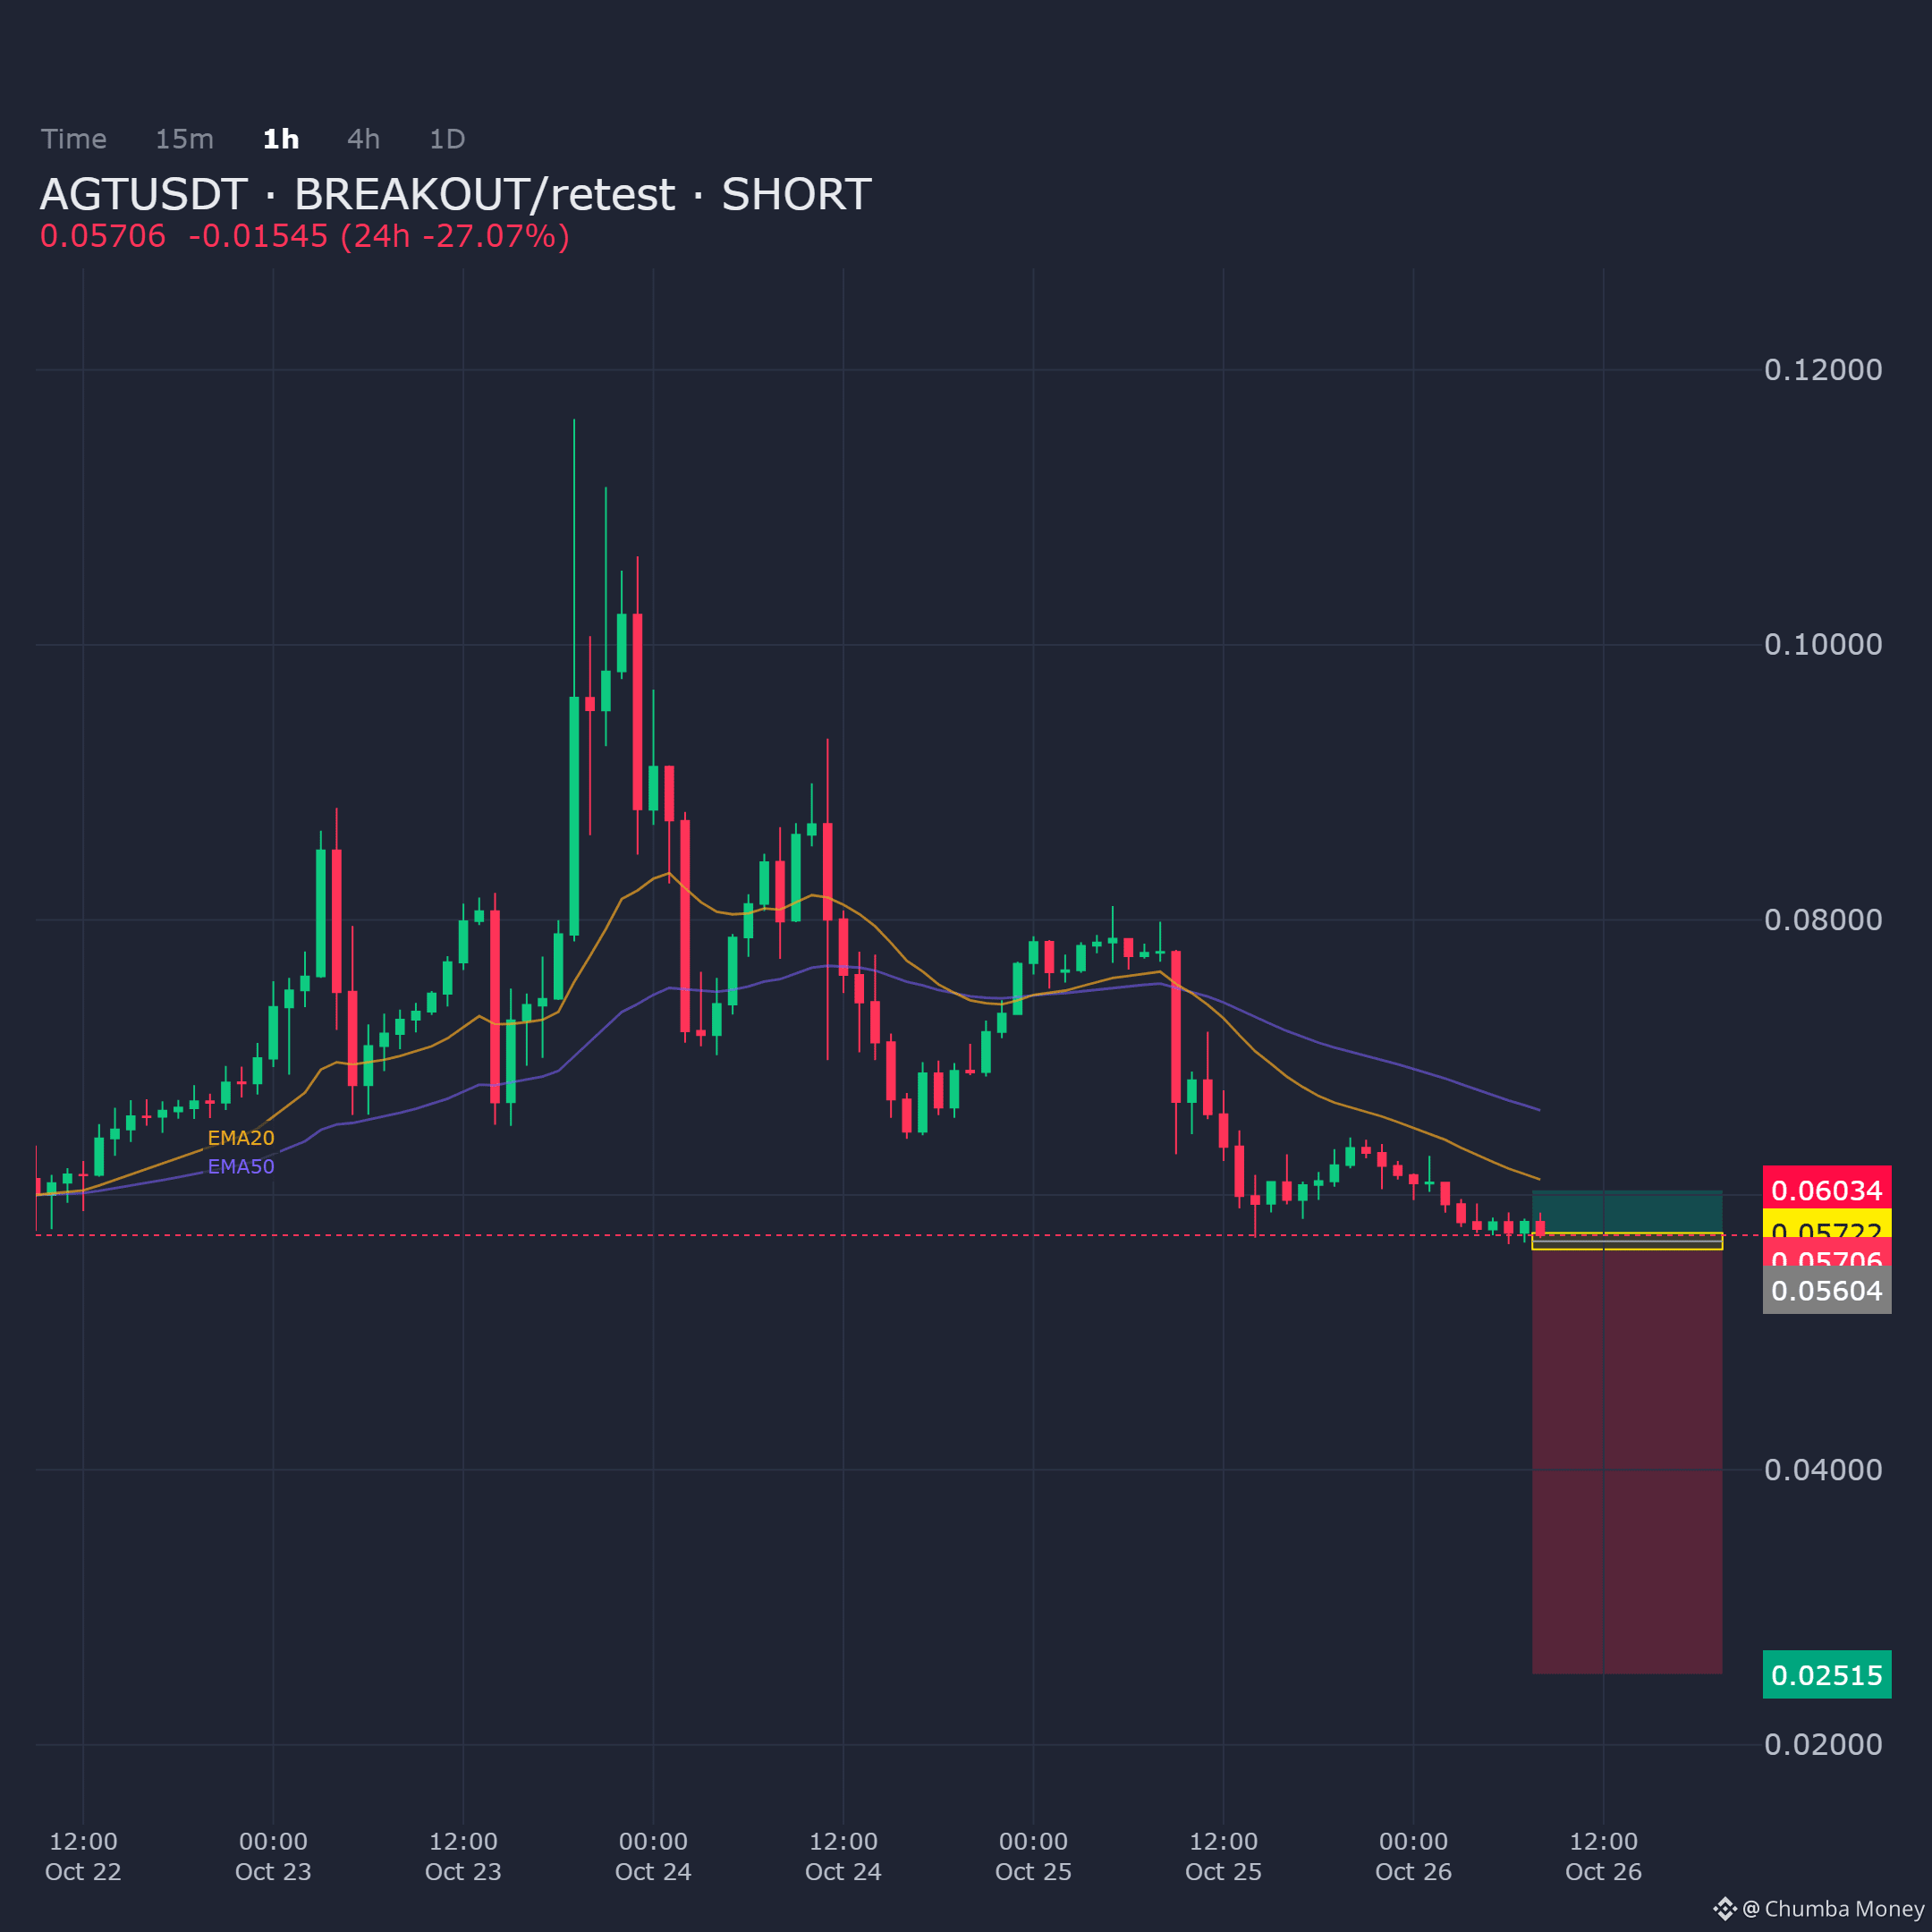
AGTUSDT on the 1H shows momentum fading at resistance with a breakout/retest structure forming. Bias remains short as price approaches the reaction zone.
Entry: 0.056042 - 0.057219
Targets: TP1: 0.025147, TP2: 0.025147, TP3: 0.025147
Stop Loss: 0.060336
$AGT
AGTUSDT on the 1H shows momentum fading at resistance with a breakout/retest structure forming. Bias remains short as price approaches the reaction zone.
Entry: 0.056042 - 0.057219
Targets: TP1: 0.025147, TP2: 0.025147, TP3: 0.025147
Stop Loss: 0.060336
$AGT
Entry: 0.056042 - 0.057219
Targets: TP1: 0.025147, TP2: 0.025147, TP3: 0.025147
Stop Loss: 0.060336
$AGT
34
·
--
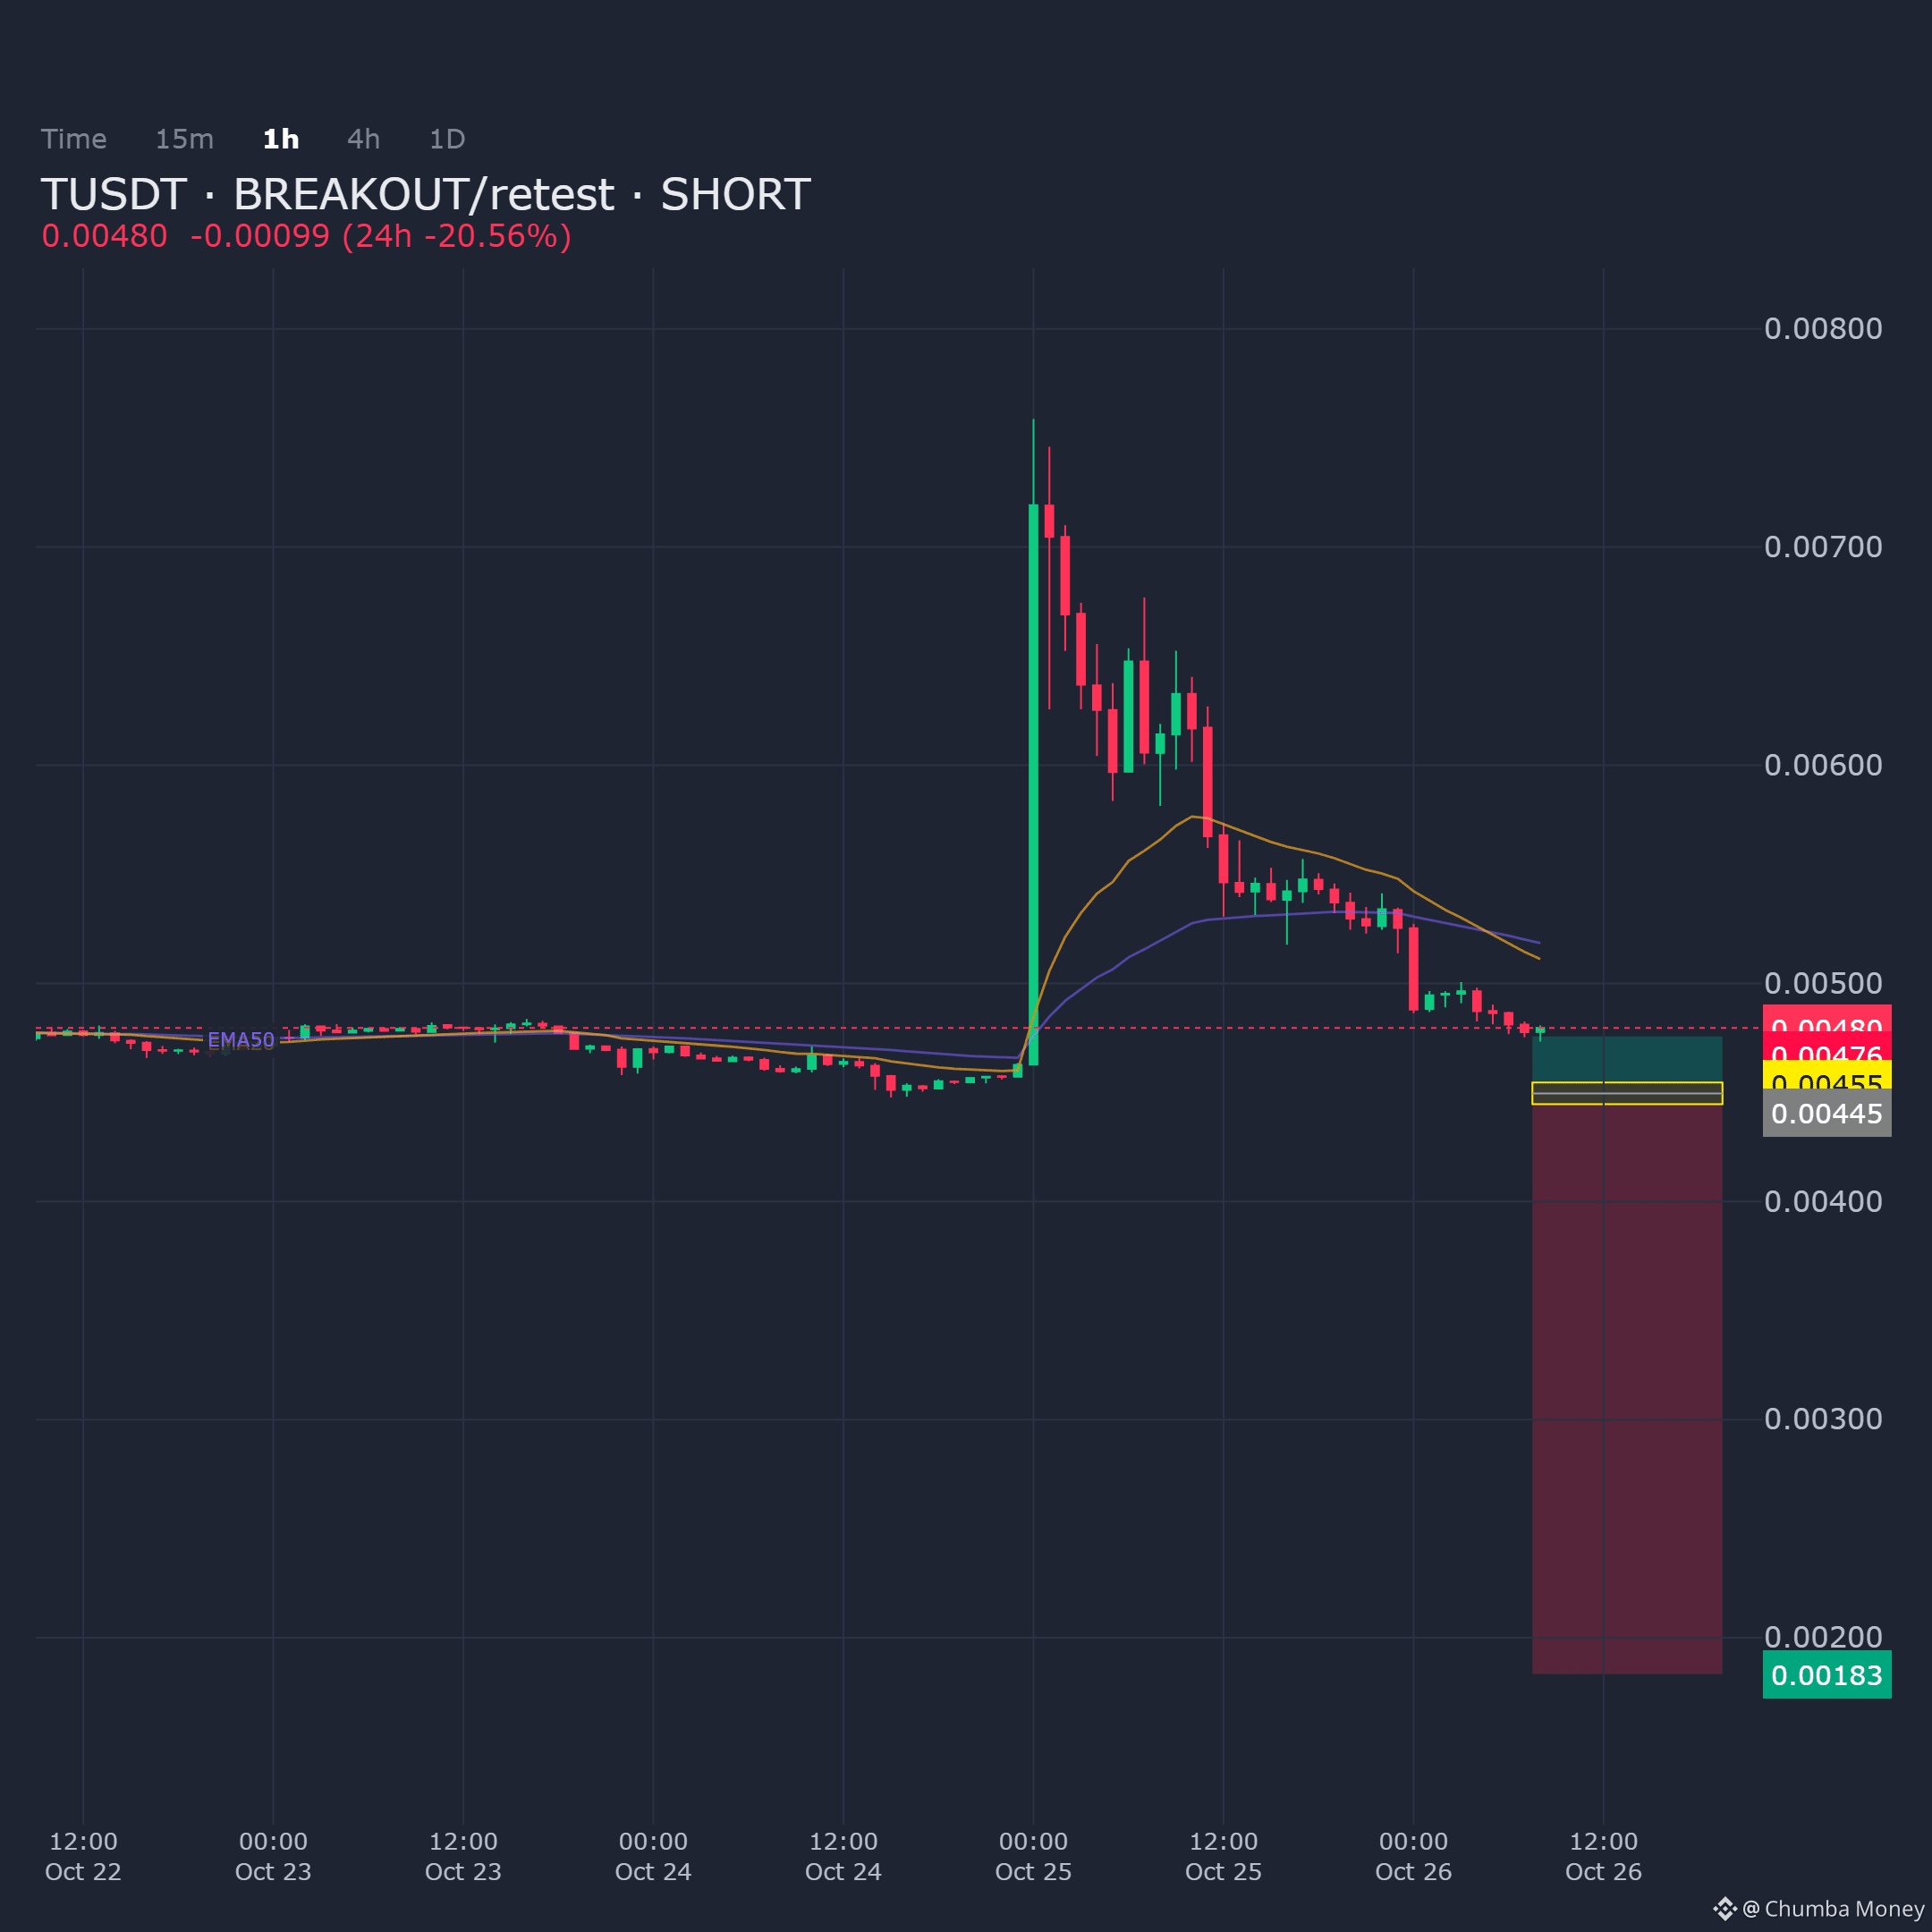
TUSDT on the 1H timeframe is extending into a supply zone following a breakout move, suggesting a potential retest before downward continuation.
Entry: 0.004446 - 0.004545
Targets: TP1: 0.001834, TP2: 0.001834, TP3: 0.001834
Stop Loss: 0.004757
$T
TUSDT on the 1H timeframe is extending into a supply zone following a breakout move, suggesting a potential retest before downward continuation.
Entry: 0.004446 - 0.004545
Targets: TP1: 0.001834, TP2: 0.001834, TP3: 0.001834
Stop Loss: 0.004757
$T
Entry: 0.004446 - 0.004545
Targets: TP1: 0.001834, TP2: 0.001834, TP3: 0.001834
Stop Loss: 0.004757
$T
13
·
--
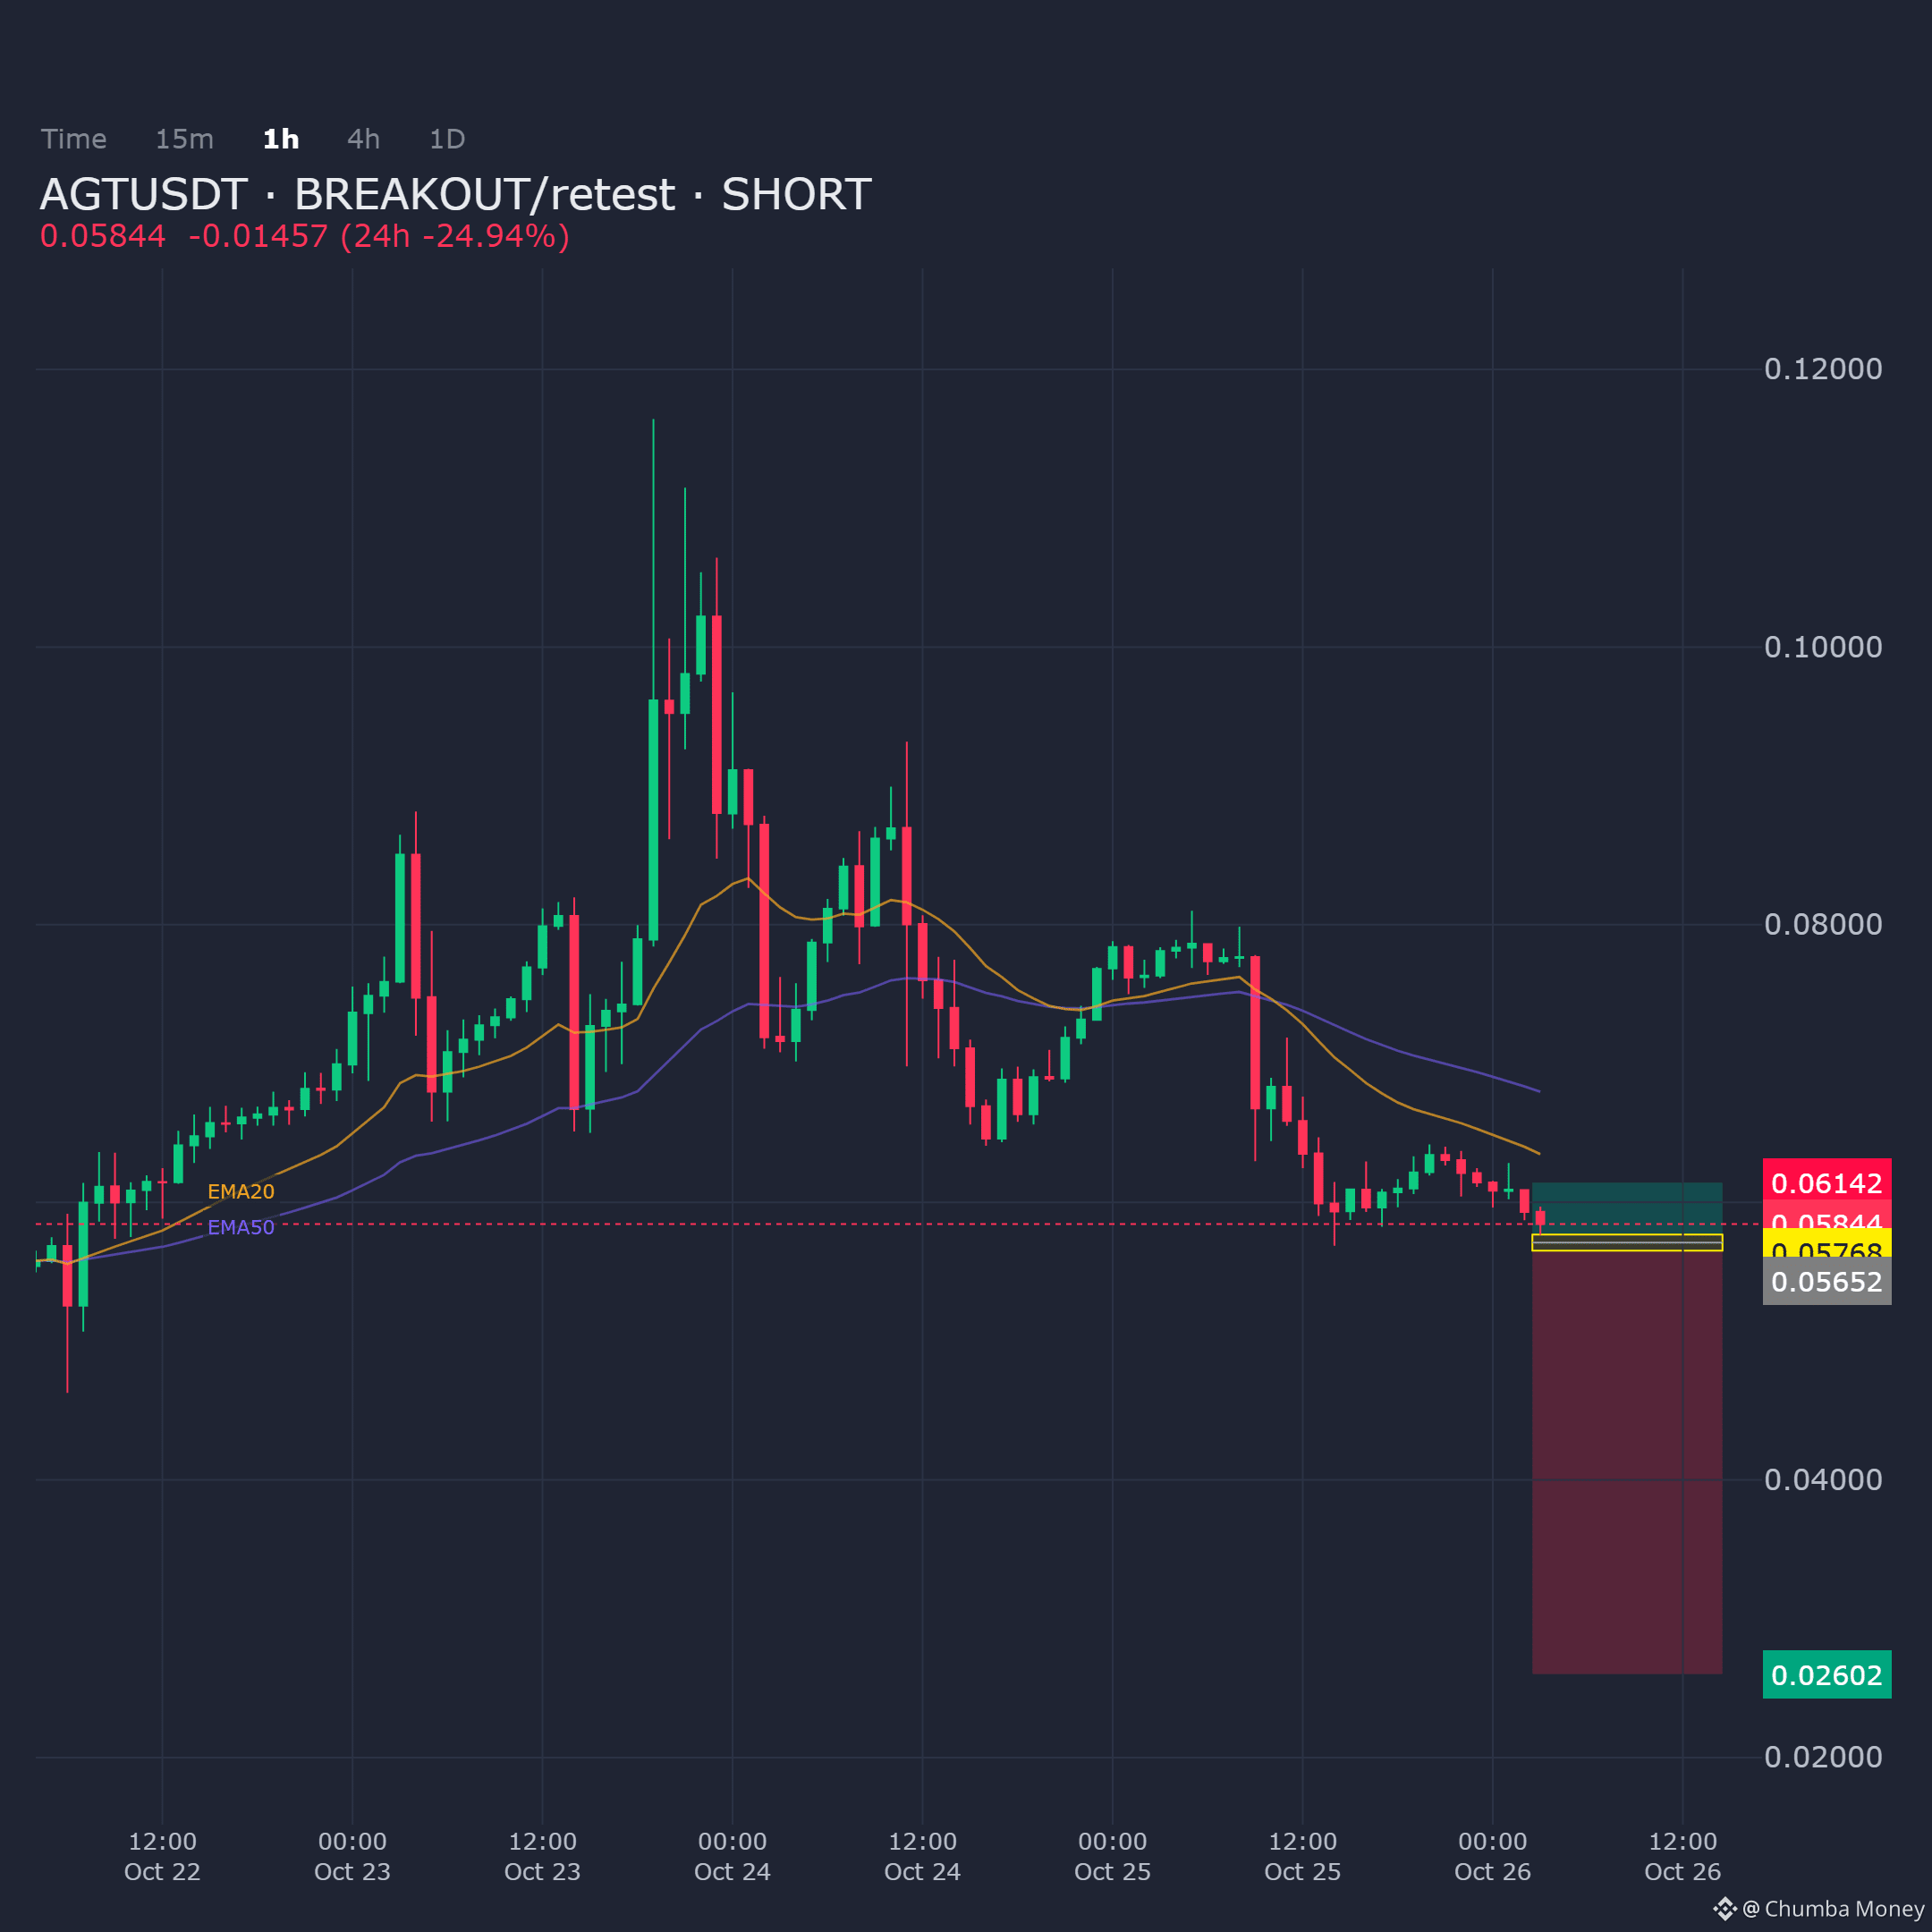
AGTUSDT on the 1H chart shows momentum weakening at resistance, favoring a breakout-and-retest short structure.
Entry: 0.056517 - 0.057679
Targets: TP1: 0.026017, TP2: 0.026017, TP3: 0.026017
Stop Loss: 0.061418
$AGT
AGTUSDT on the 1H chart shows momentum weakening at resistance, favoring a breakout-and-retest short structure.
Entry: 0.056517 - 0.057679
Targets: TP1: 0.026017, TP2: 0.026017, TP3: 0.026017
Stop Loss: 0.061418
$AGT
Entry: 0.056517 - 0.057679
Targets: TP1: 0.026017, TP2: 0.026017, TP3: 0.026017
Stop Loss: 0.061418
$AGT
36
·
--
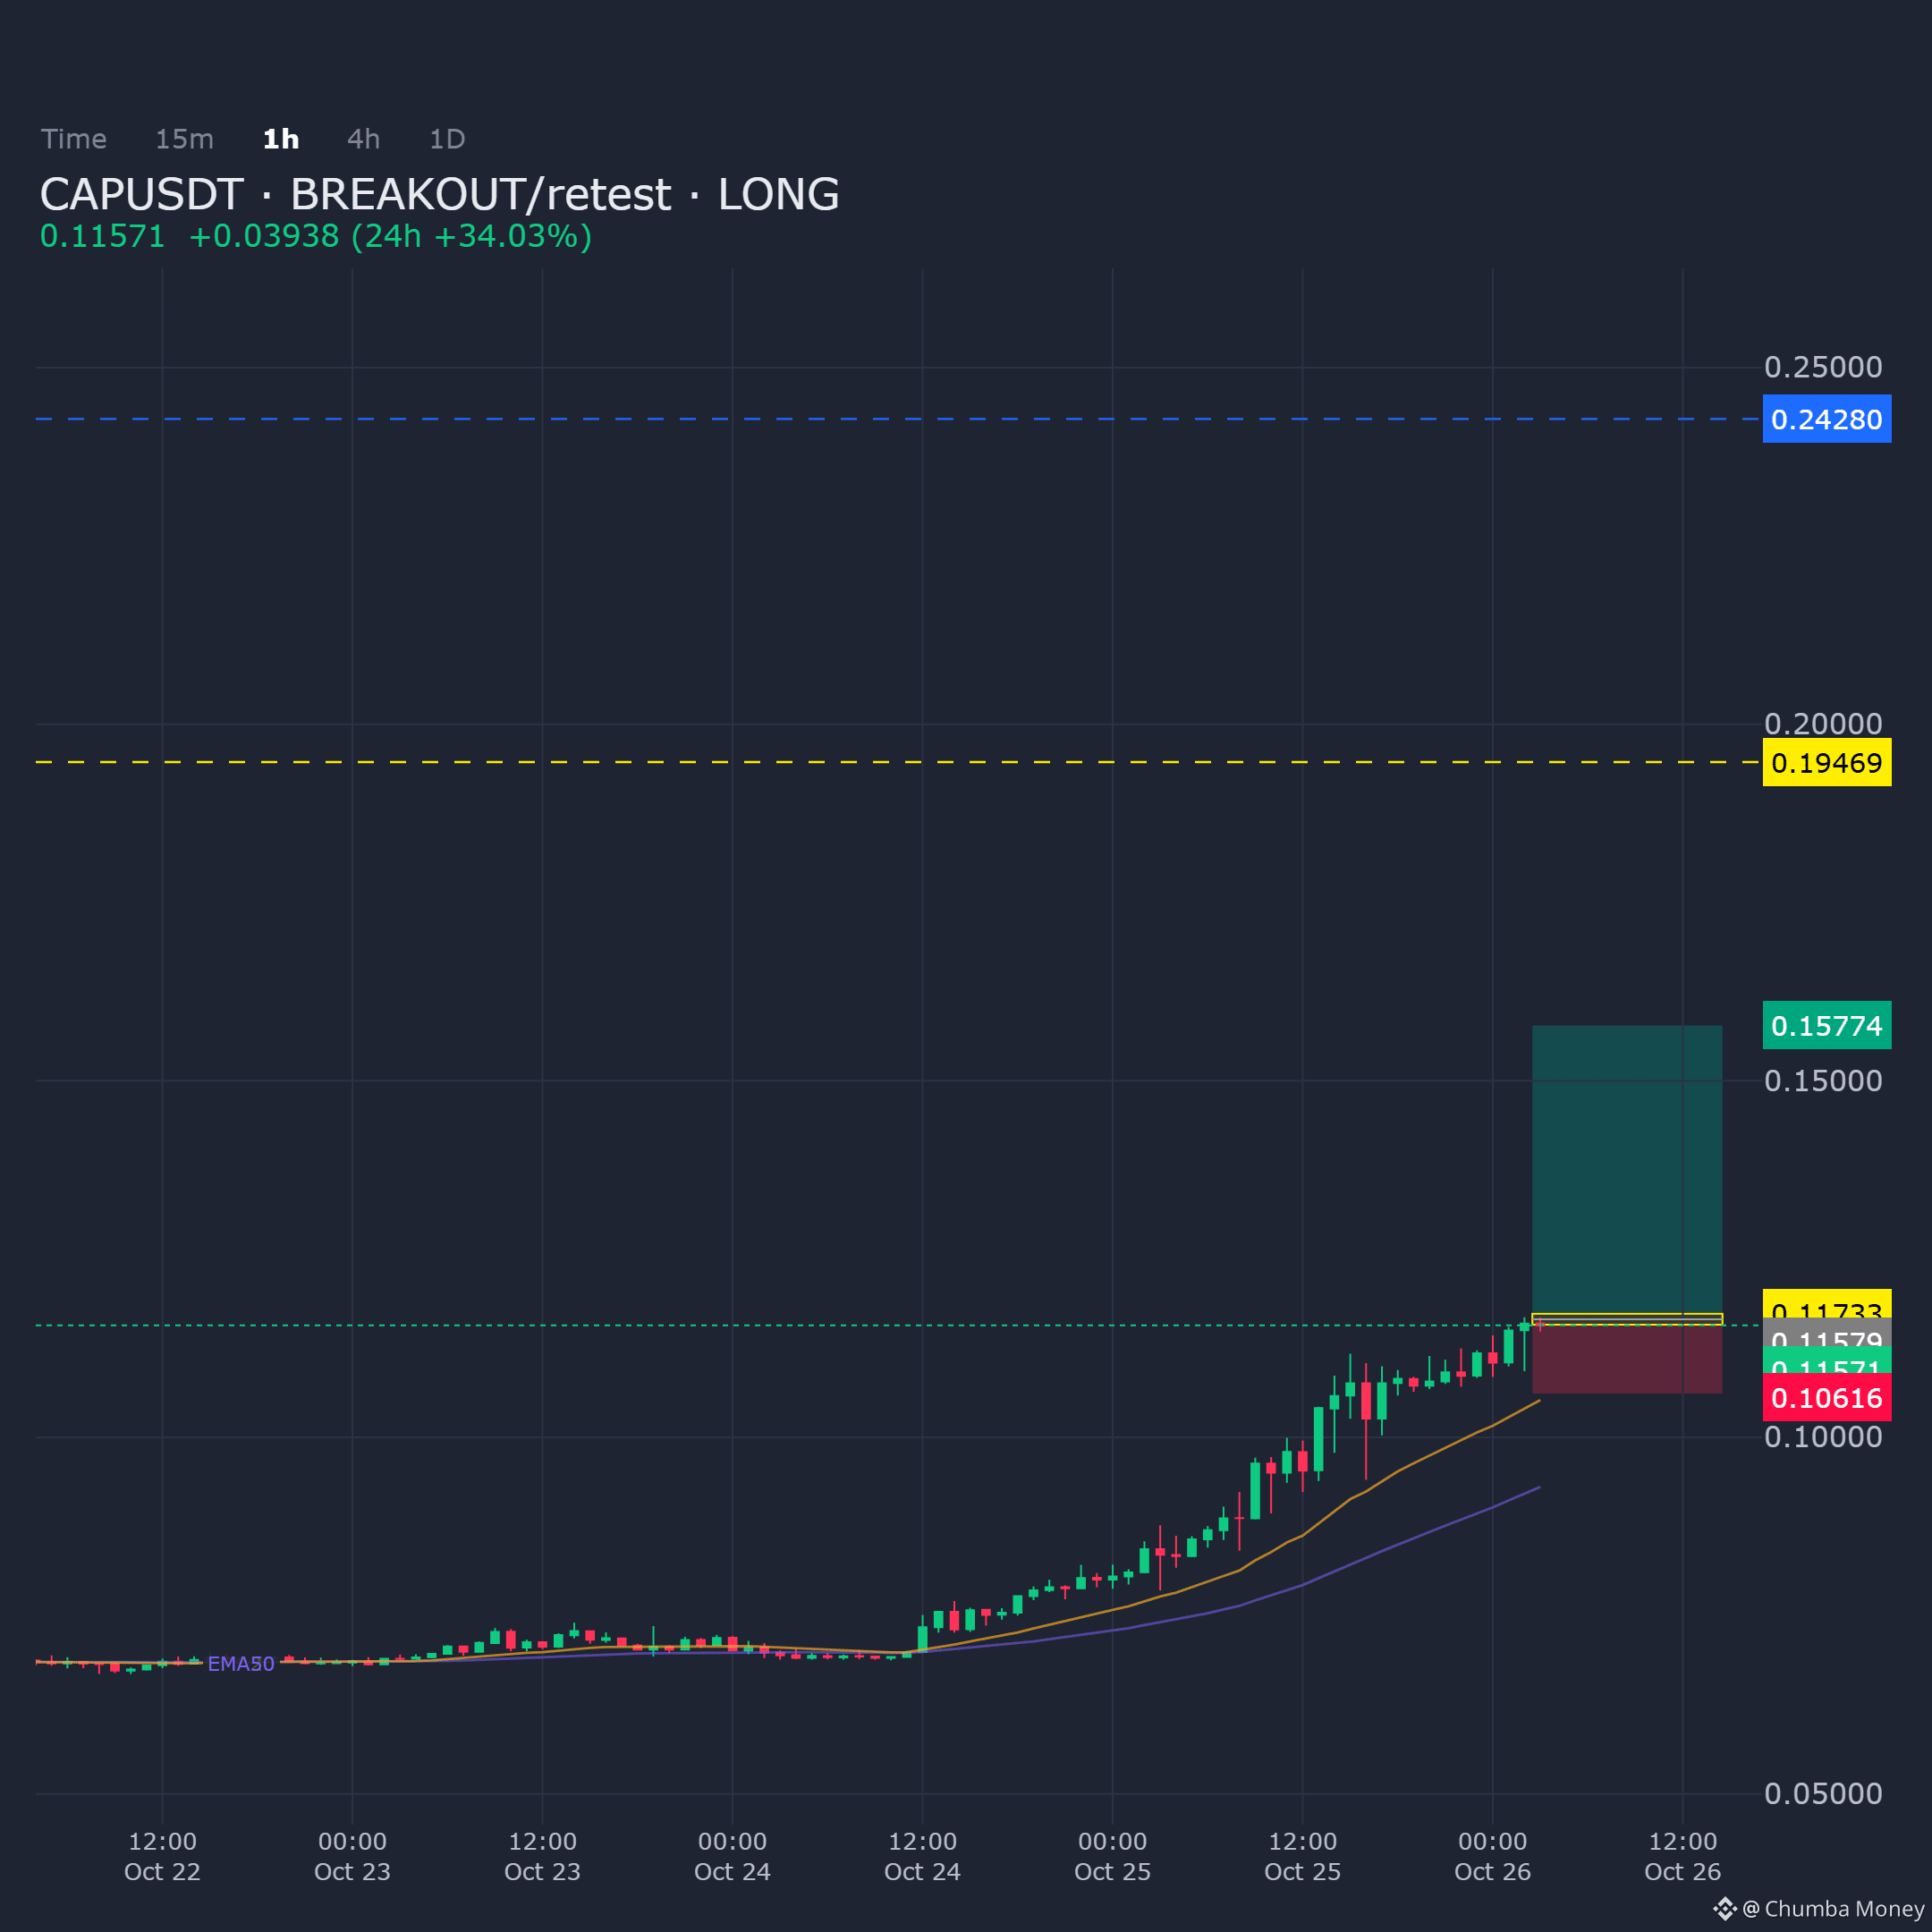
CAPUSDT (1H): Price is holding structure into demand, presenting a workable breakout/retest setup for longs.
Entry: 0.115792 - 0.117331
Targets: TP1: 0.157743, TP2: 0.194692, TP3: 0.242802
Stop Loss: 0.106162
$CAP
CAPUSDT (1H): Price is holding structure into demand, presenting a workable breakout/retest setup for longs.
Entry: 0.115792 - 0.117331
Targets: TP1: 0.157743, TP2: 0.194692, TP3: 0.242802
Stop Loss: 0.106162
$CAP
Entry: 0.115792 - 0.117331
Targets: TP1: 0.157743, TP2: 0.194692, TP3: 0.242802
Stop Loss: 0.106162
$CAP
38
·
--
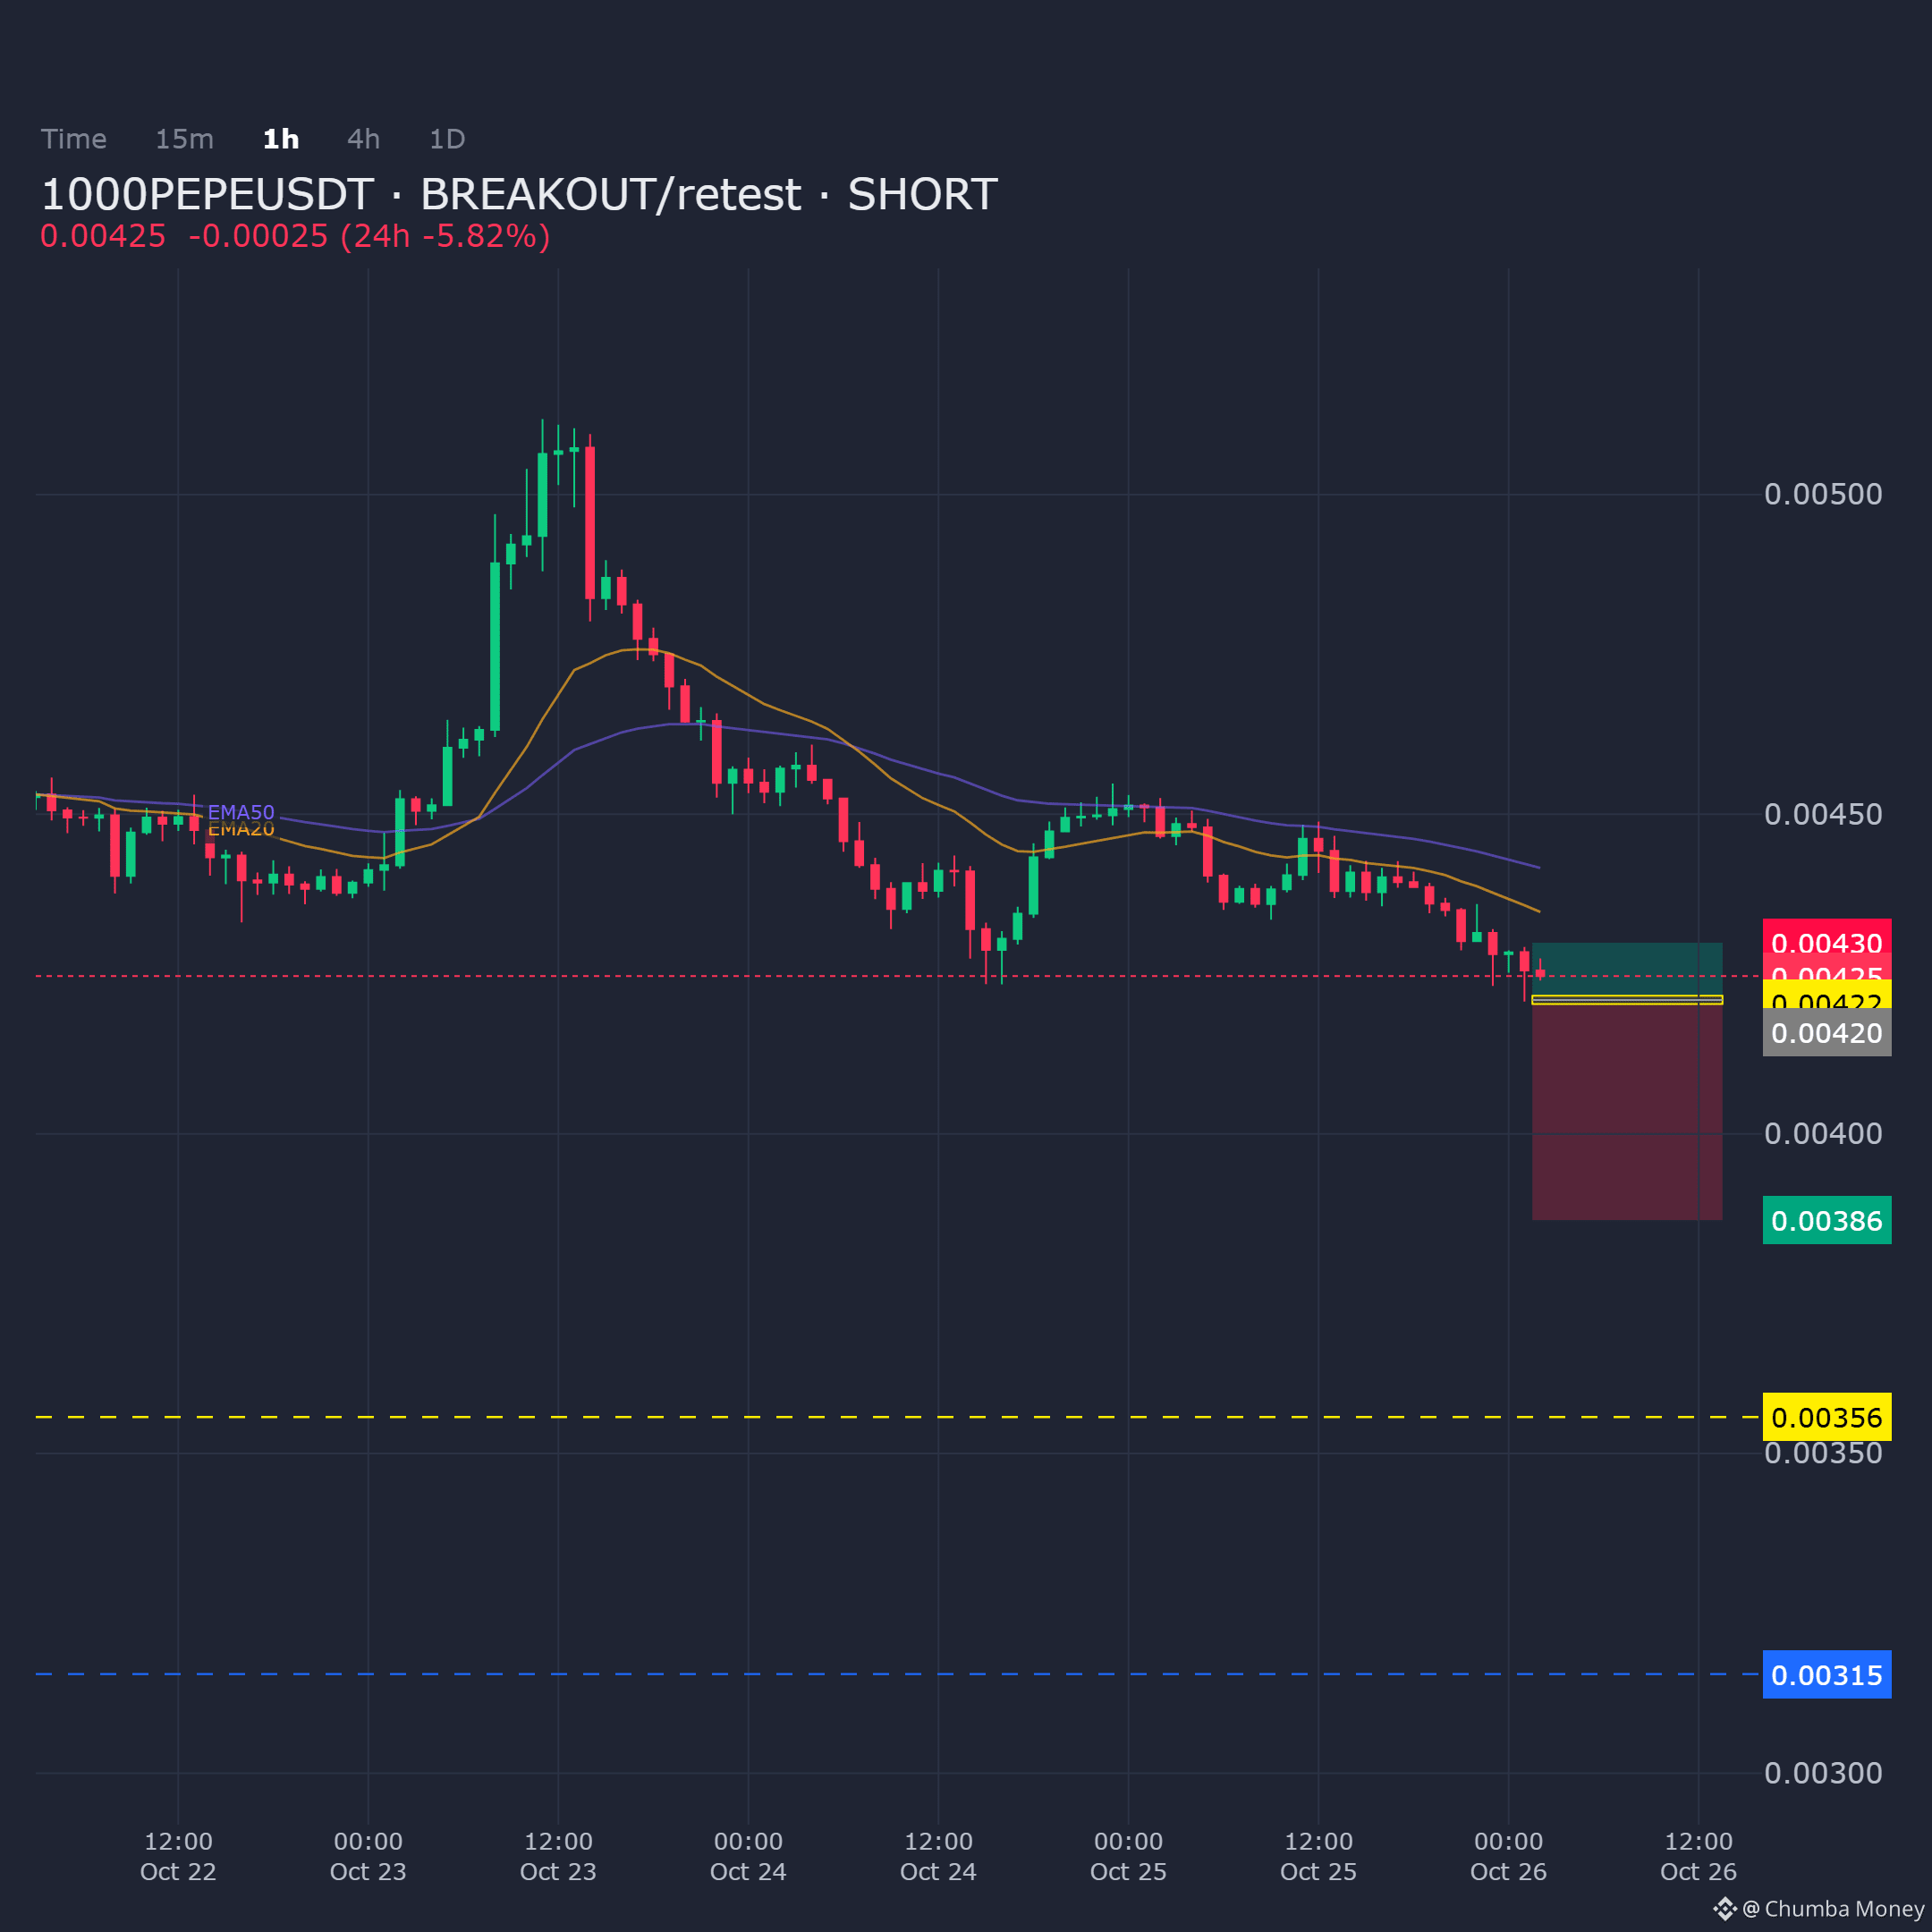
1000PEPEUSDT on the 1H chart is stretched into supply, confirming a breakout-retest structure. Bias remains bearish for a short entry from this zone.
Entry: 0.004203 - 0.004216
Targets: TP1: 0.003865, TP2: 0.003557, TP3: 0.003155
Stop Loss: 0.004299
$1000PEPE
1000PEPEUSDT on the 1H chart is stretched into supply, confirming a breakout-retest structure. Bias remains bearish for a short entry from this zone.
Entry: 0.004203 - 0.004216
Targets: TP1: 0.003865, TP2: 0.003557, TP3: 0.003155
Stop Loss: 0.004299
$1000PEPE
Entry: 0.004203 - 0.004216
Targets: TP1: 0.003865, TP2: 0.003557, TP3: 0.003155
Stop Loss: 0.004299
$1000PEPE
20
·
--
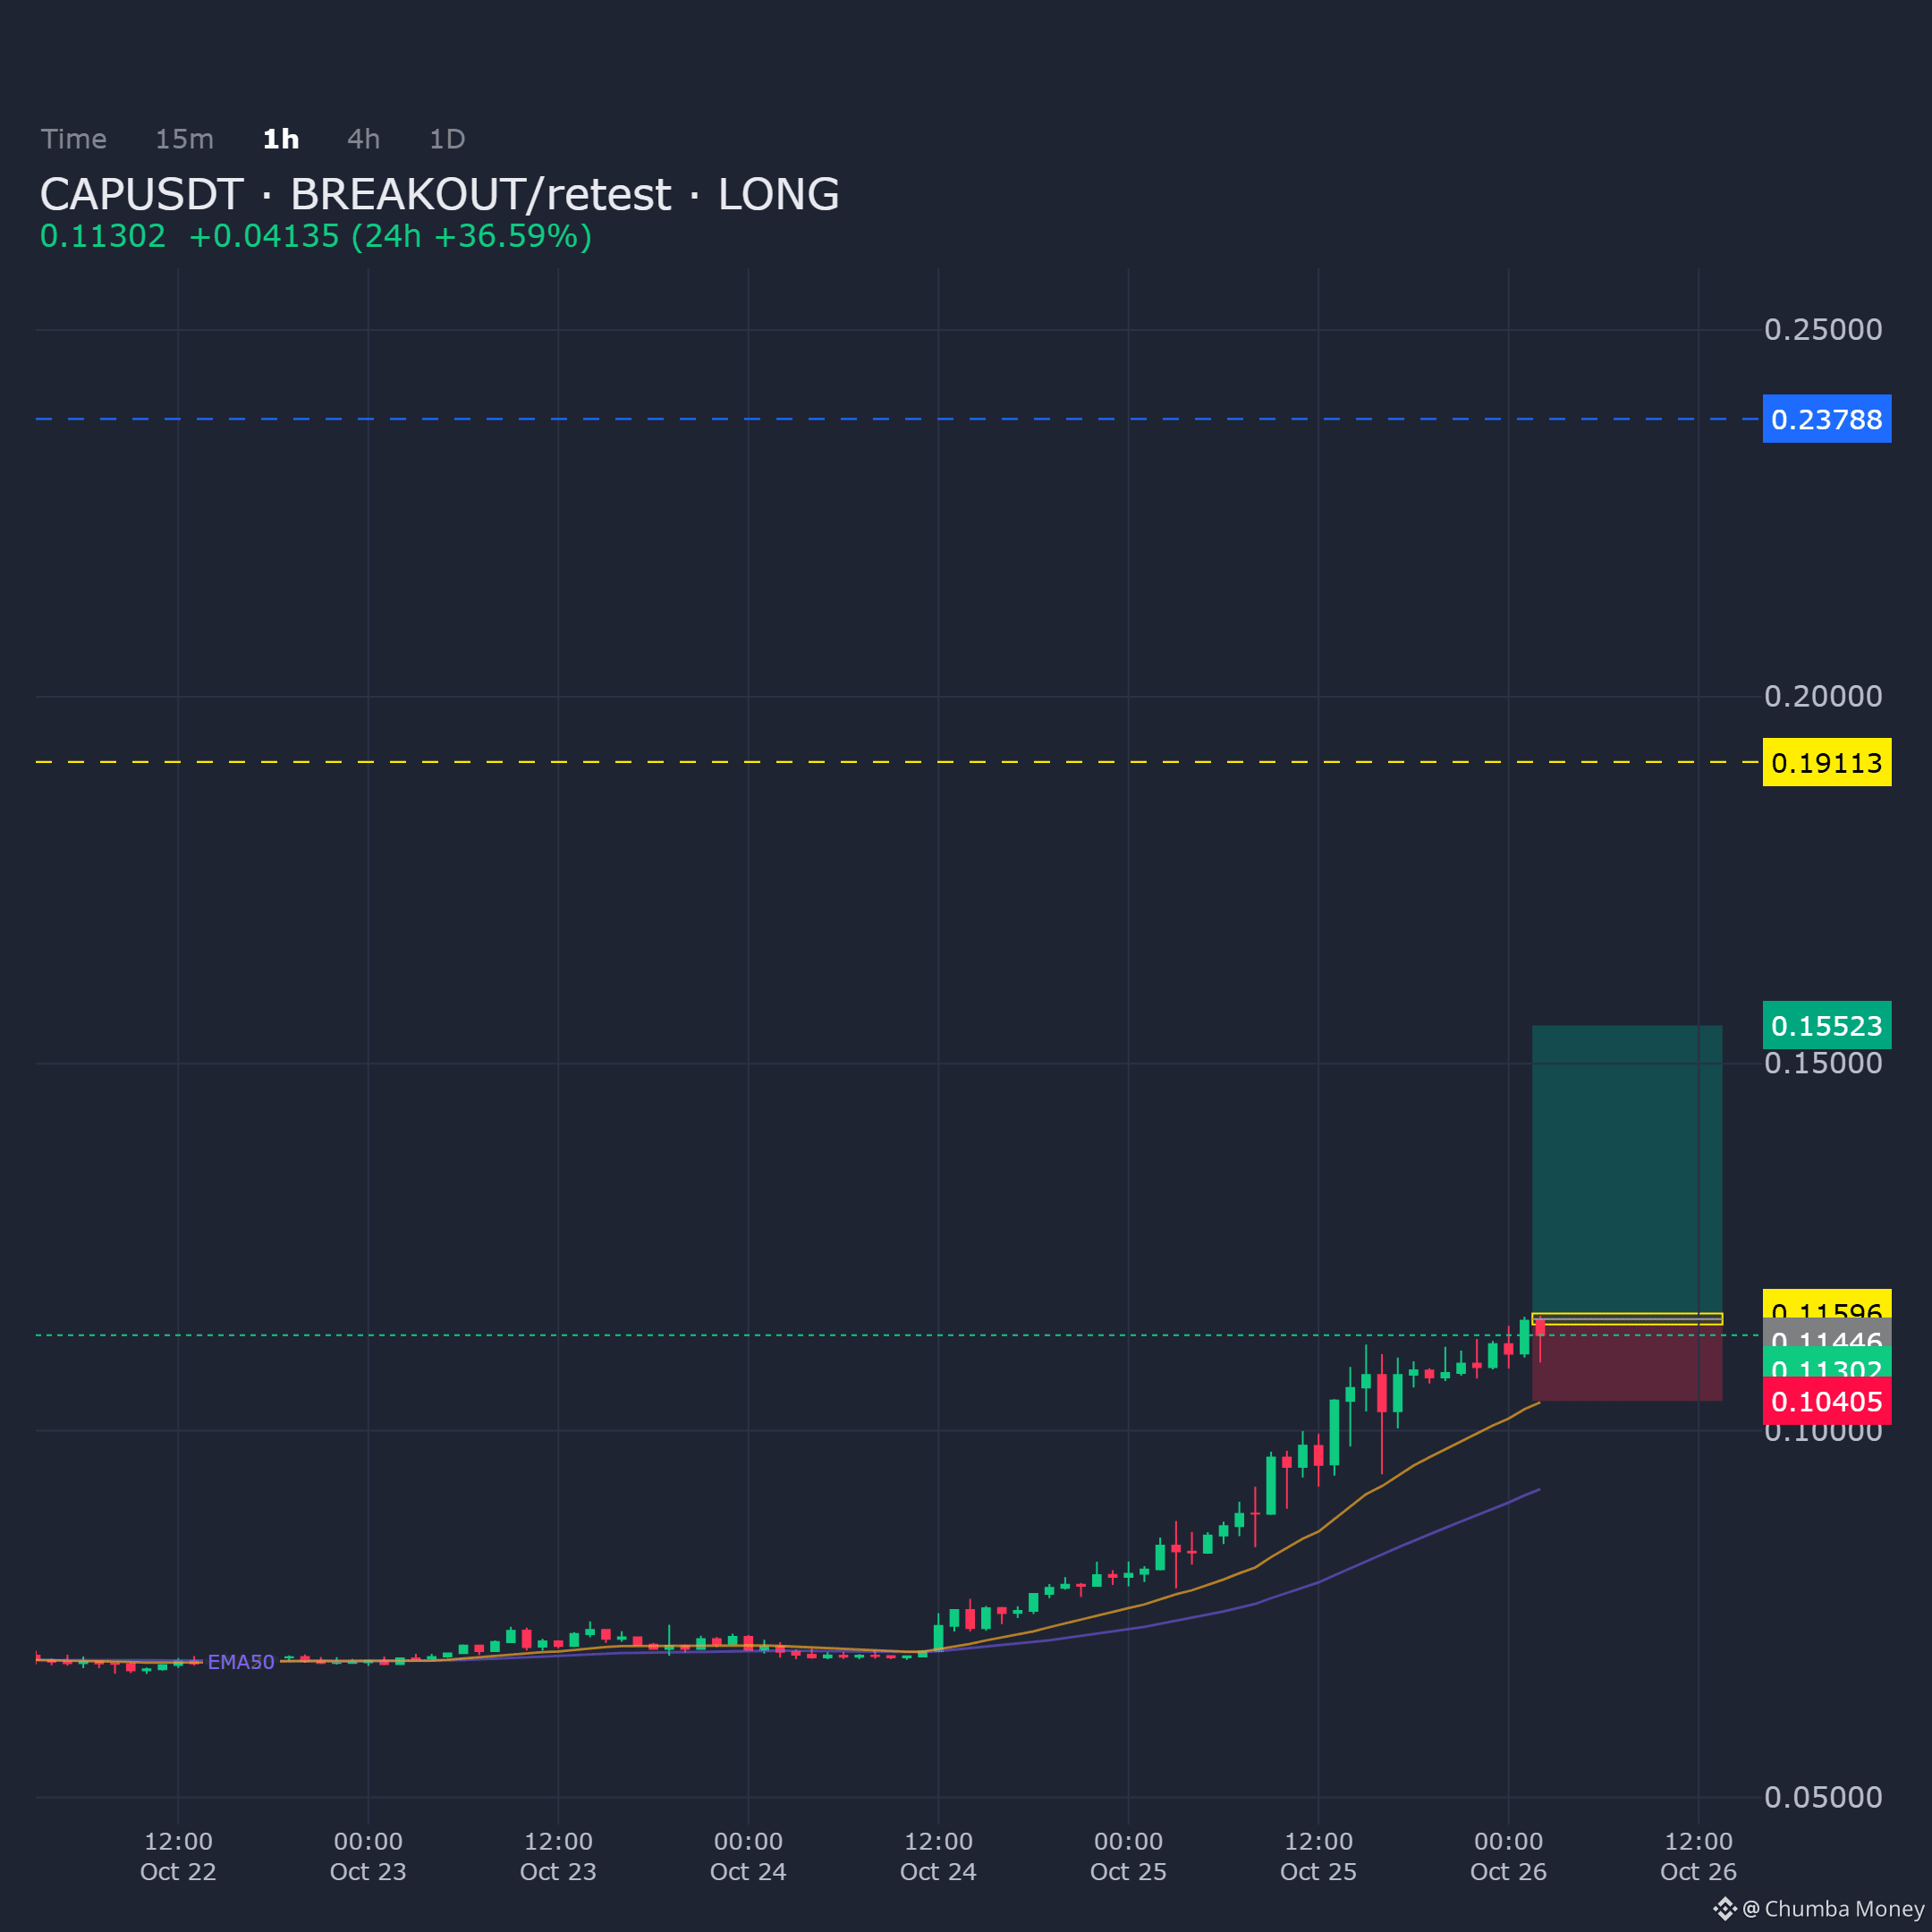
CAPUSDT on the 1H chart — structure holding into demand with a breakout/retest setup shaping up for a long bias.
Entry: 0.114461 - 0.115957
Targets: TP1: 0.155227, TP2: 0.191132, TP3: 0.237881
Stop Loss: 0.104051
$CAP
CAPUSDT on the 1H chart — structure holding into demand with a breakout/retest setup shaping up for a long bias.
Entry: 0.114461 - 0.115957
Targets: TP1: 0.155227, TP2: 0.191132, TP3: 0.237881
Stop Loss: 0.104051
$CAP
Entry: 0.114461 - 0.115957
Targets: TP1: 0.155227, TP2: 0.191132, TP3: 0.237881
Stop Loss: 0.104051
$CAP
6
·
--
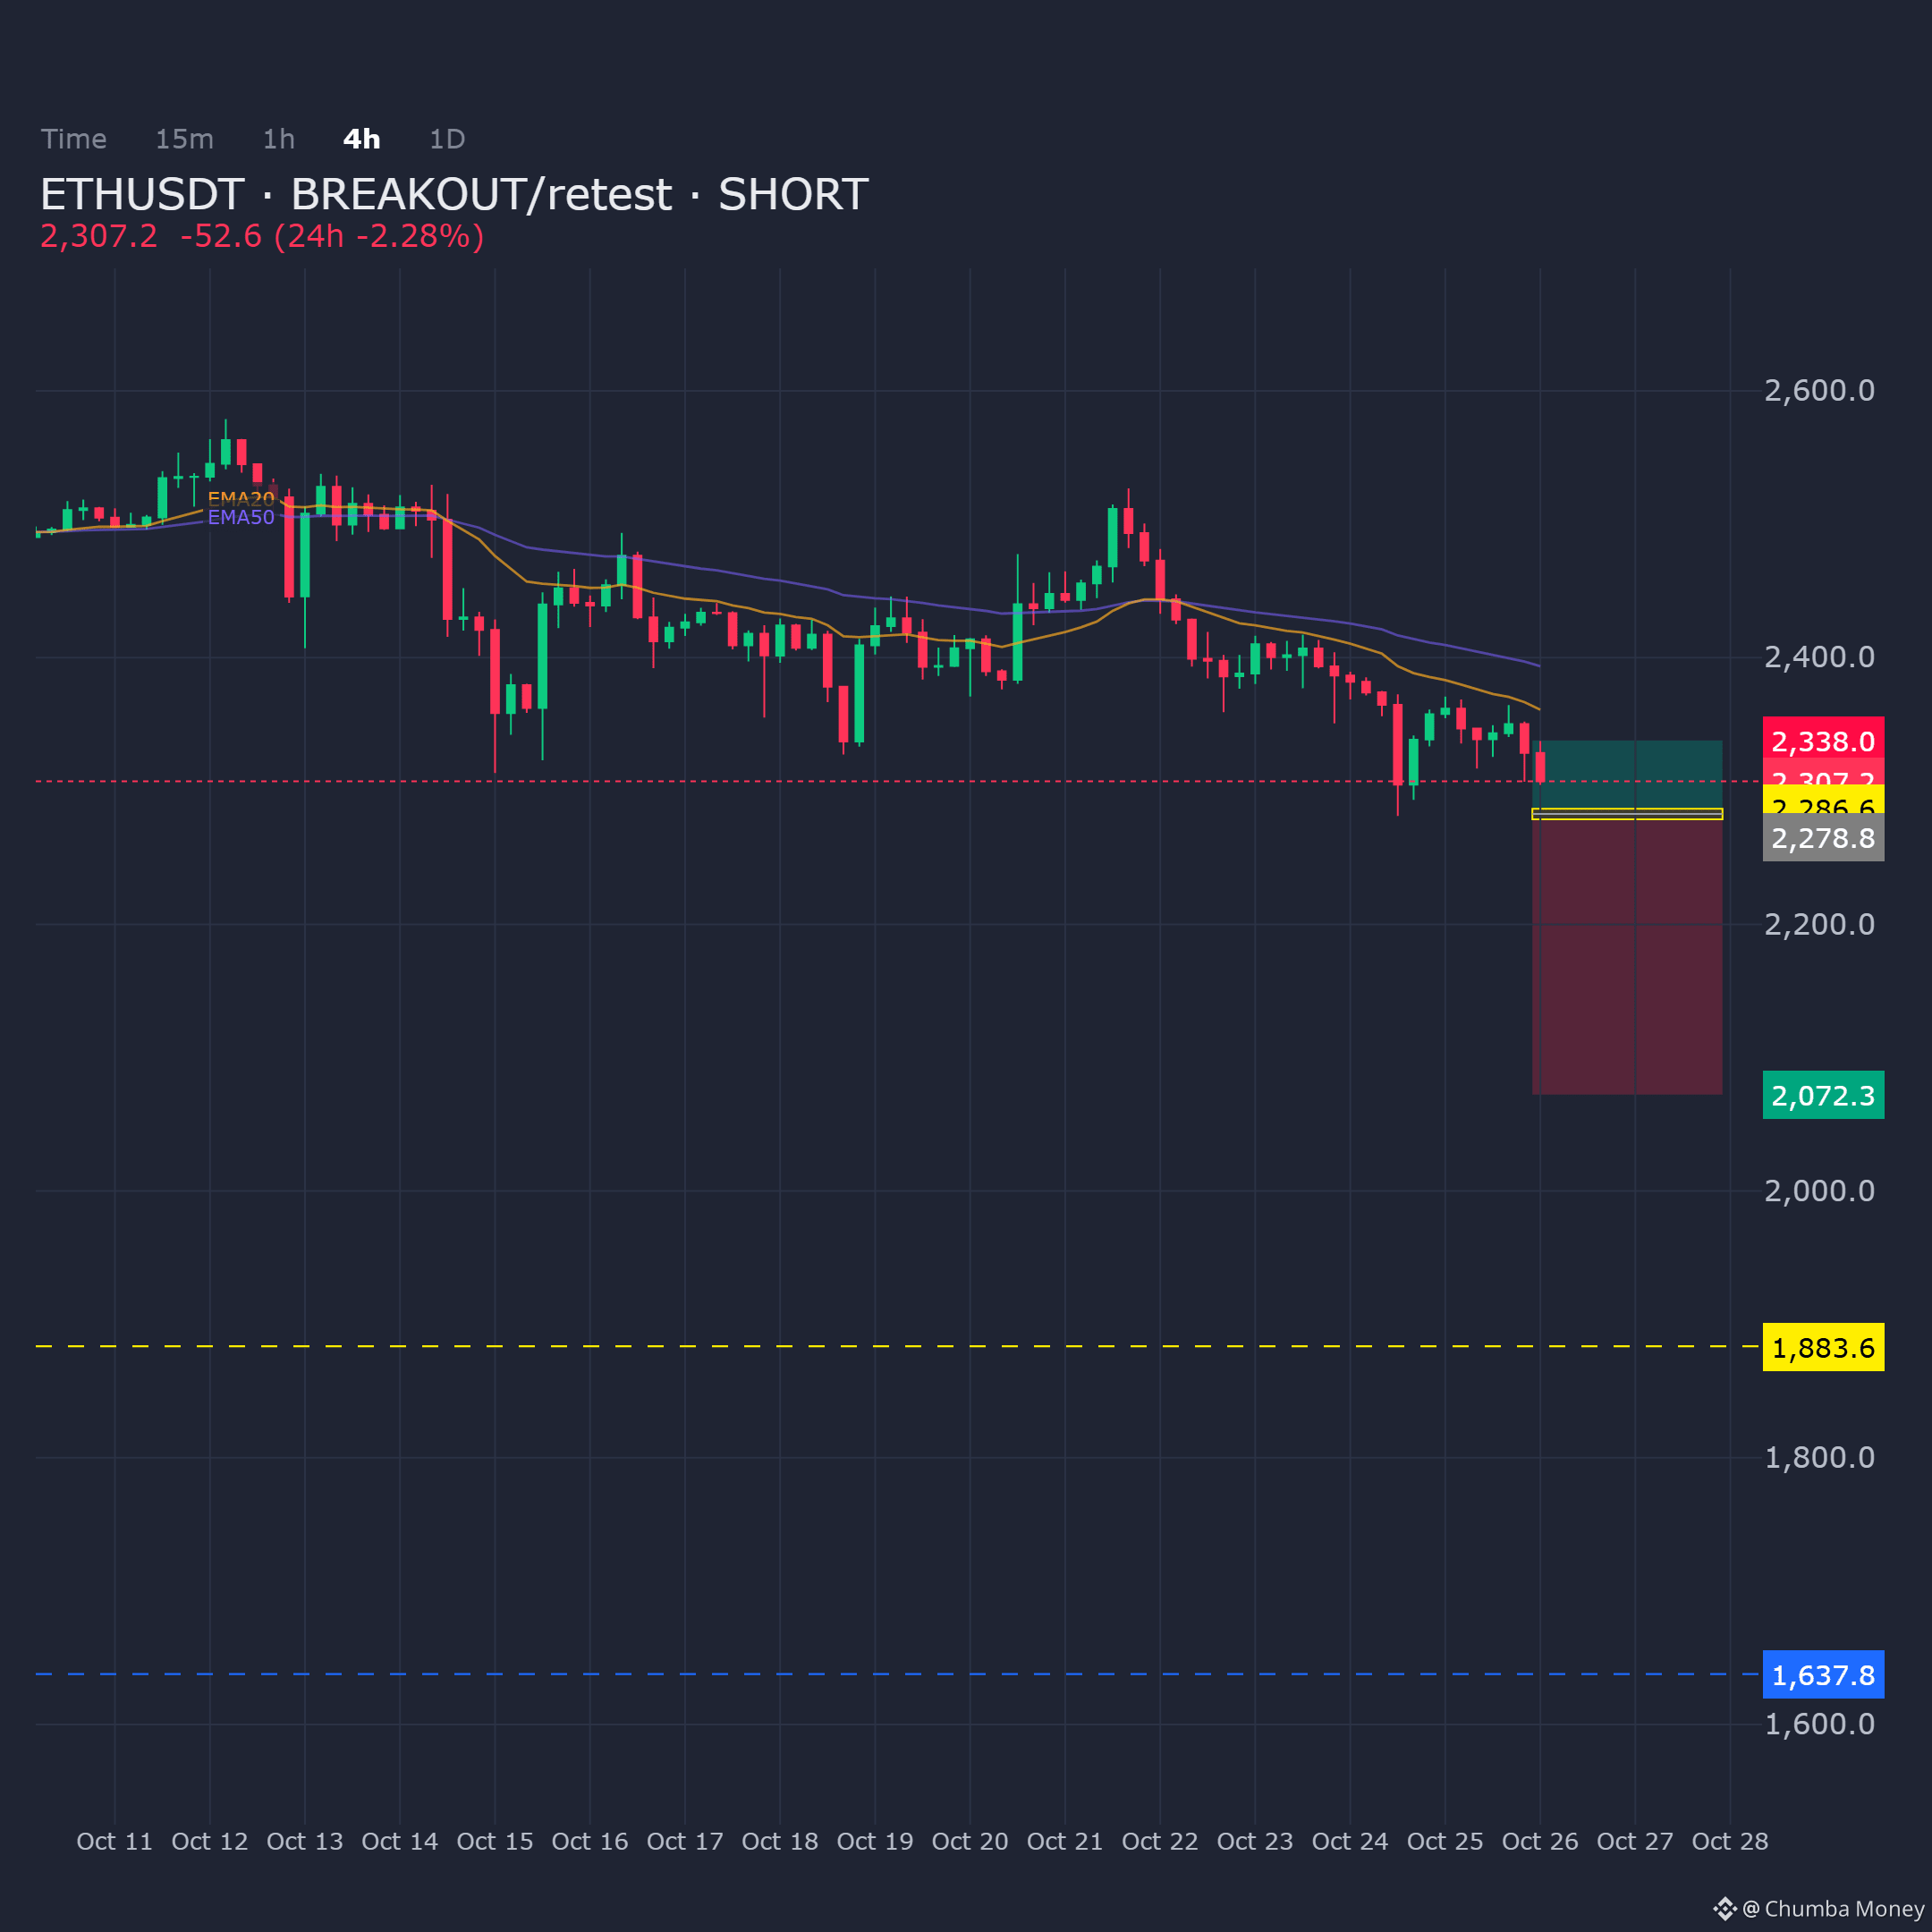
ETHUSDT on the 4H shows momentum fading at key resistance, framing a short-biased breakout-and-retest setup.
Entry: 2278.8 - 2286.6
Targets: TP1: 2072.3, TP2: 1883.6, TP3: 1637.8
Stop Loss: 2338.0
$ETH
ETHUSDT on the 4H shows momentum fading at key resistance, framing a short-biased breakout-and-retest setup.
Entry: 2278.8 - 2286.6
Targets: TP1: 2072.3, TP2: 1883.6, TP3: 1637.8
Stop Loss: 2338.0
$ETH
Entry: 2278.8 - 2286.6
Targets: TP1: 2072.3, TP2: 1883.6, TP3: 1637.8
Stop Loss: 2338.0
$ETH
21
·
--
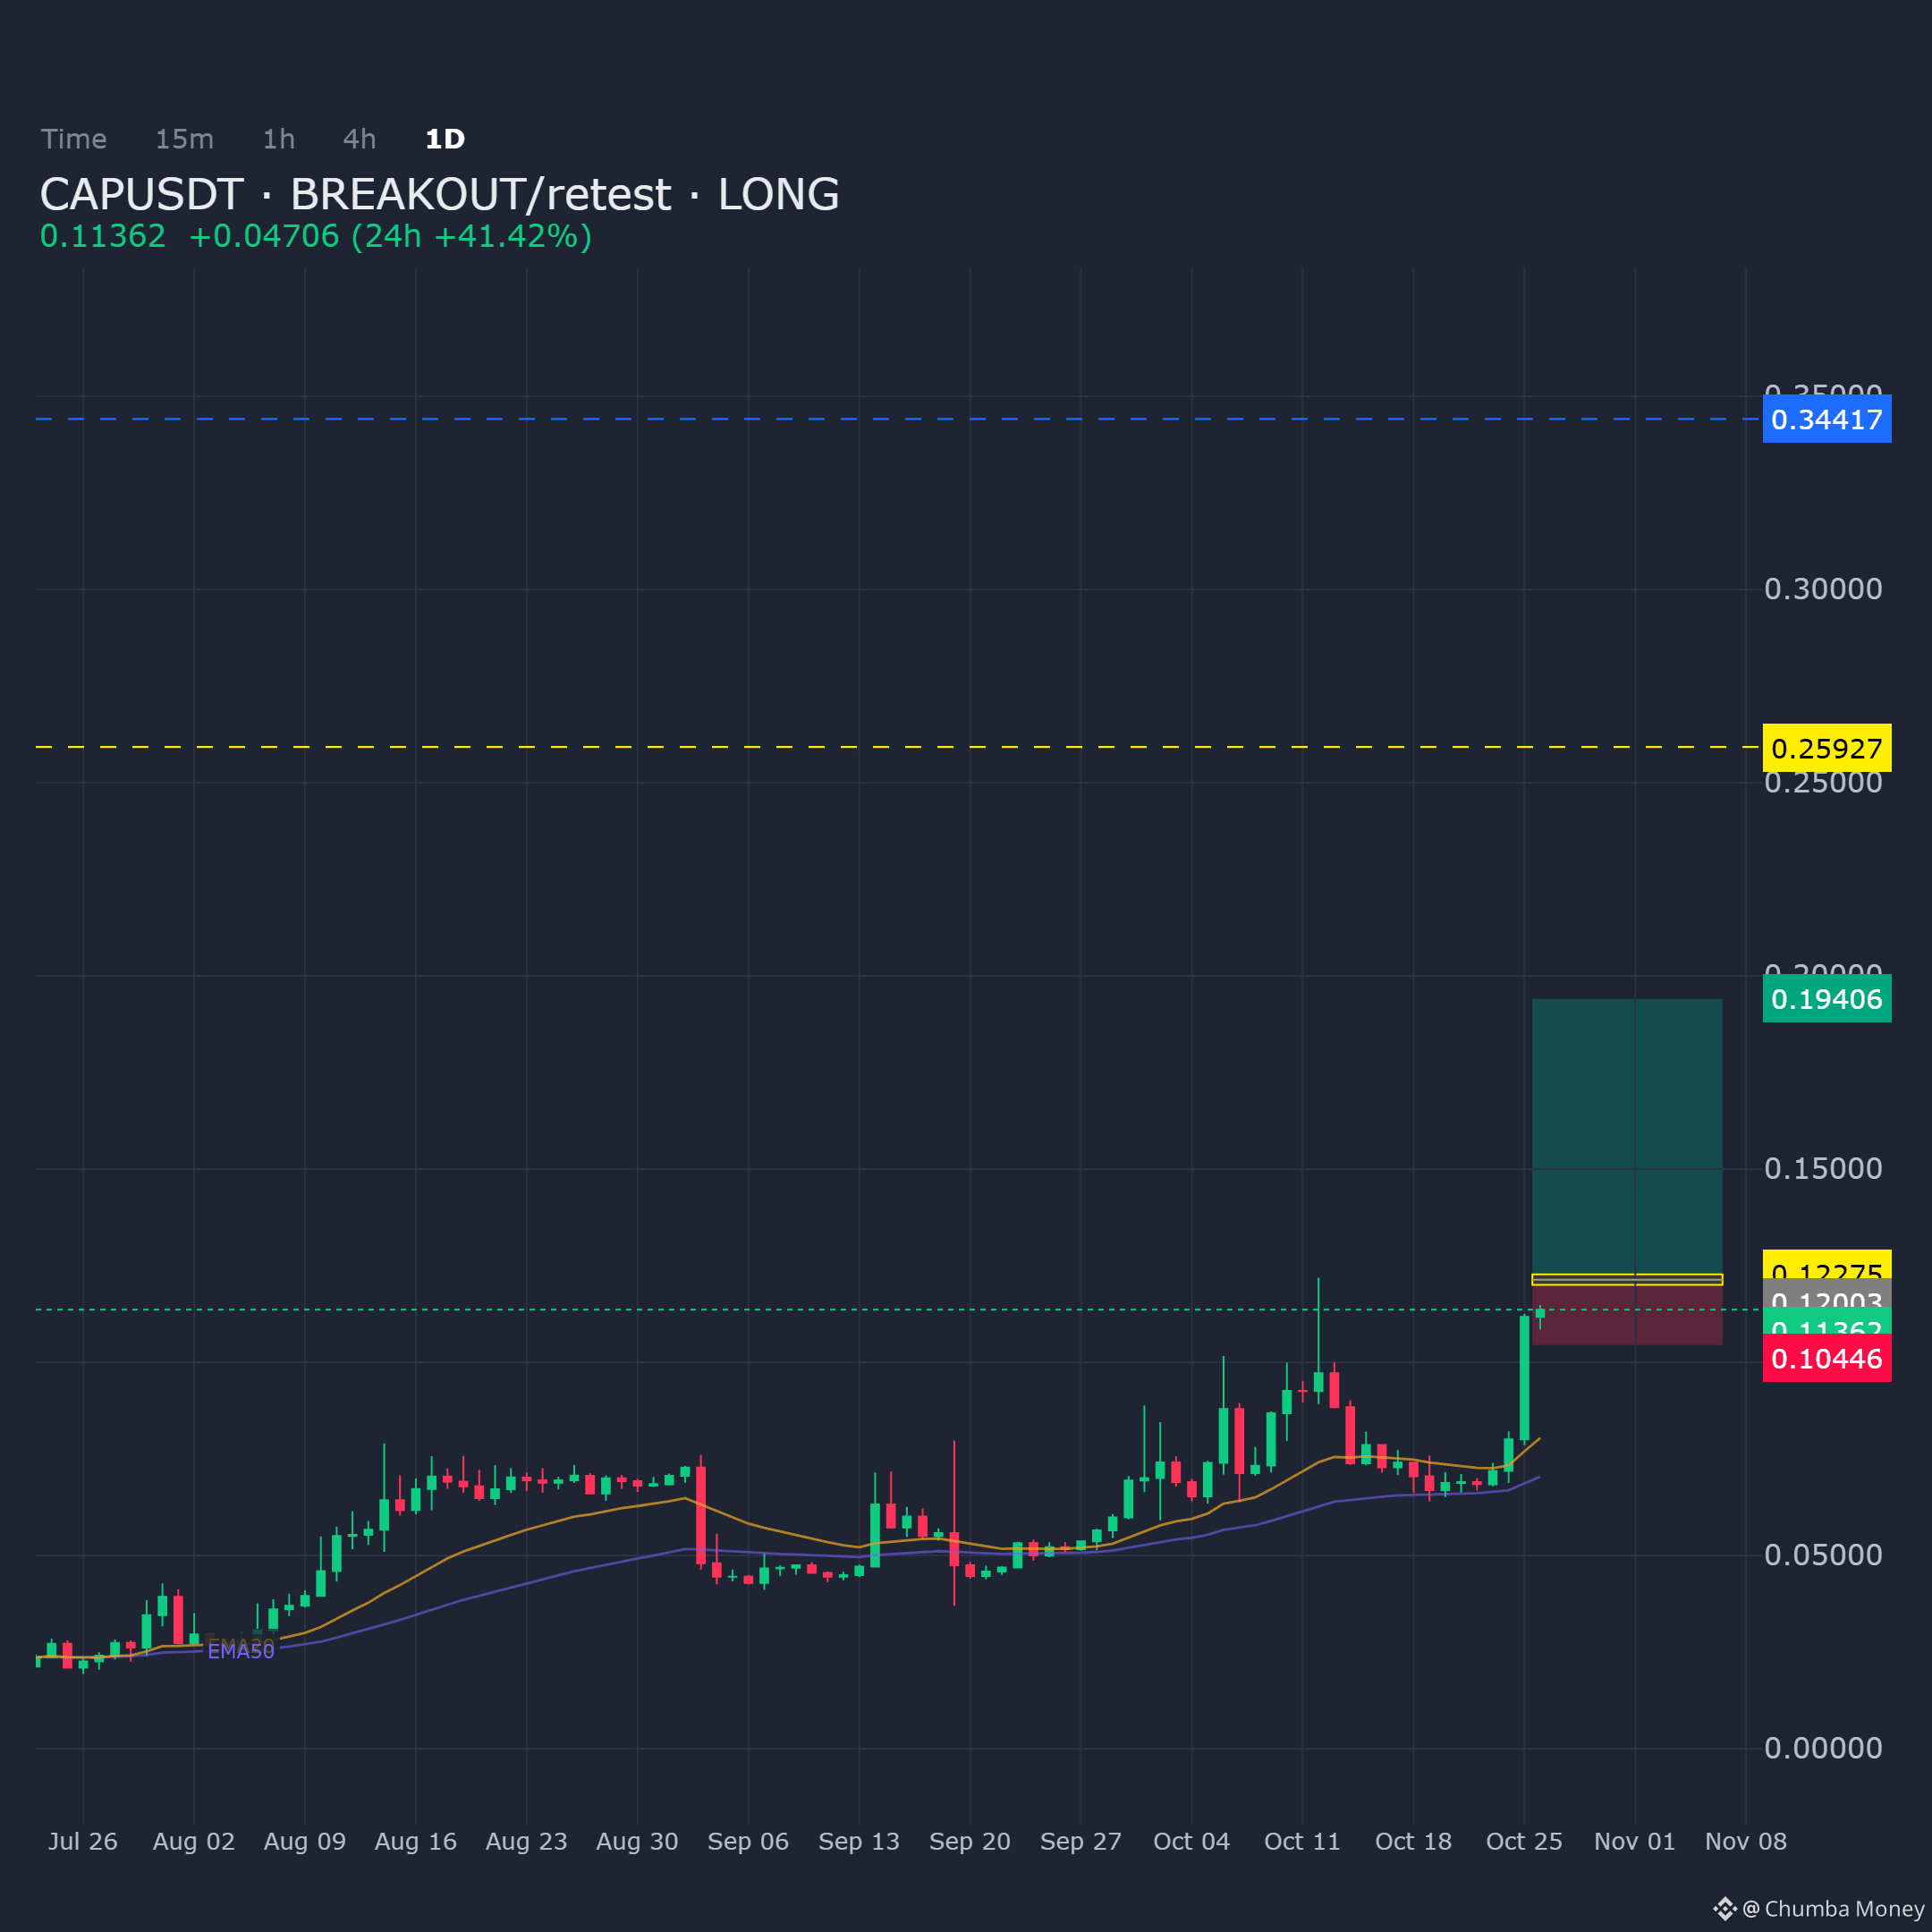
CAPUSDT on the Daily — structure holding into demand; BREAKOUT/retest setup looks workable for a long.
Entry: 0.120032 - 0.122749
Targets: TP1: 0.194065, TP2: 0.259268, TP3: 0.344168
Stop Loss: 0.104459
$CAP
CAPUSDT on the Daily — structure holding into demand; BREAKOUT/retest setup looks workable for a long.
Entry: 0.120032 - 0.122749
Targets: TP1: 0.194065, TP2: 0.259268, TP3: 0.344168
Stop Loss: 0.104459
$CAP
Entry: 0.120032 - 0.122749
Targets: TP1: 0.194065, TP2: 0.259268, TP3: 0.344168
Stop Loss: 0.104459
$CAP
50
·
--
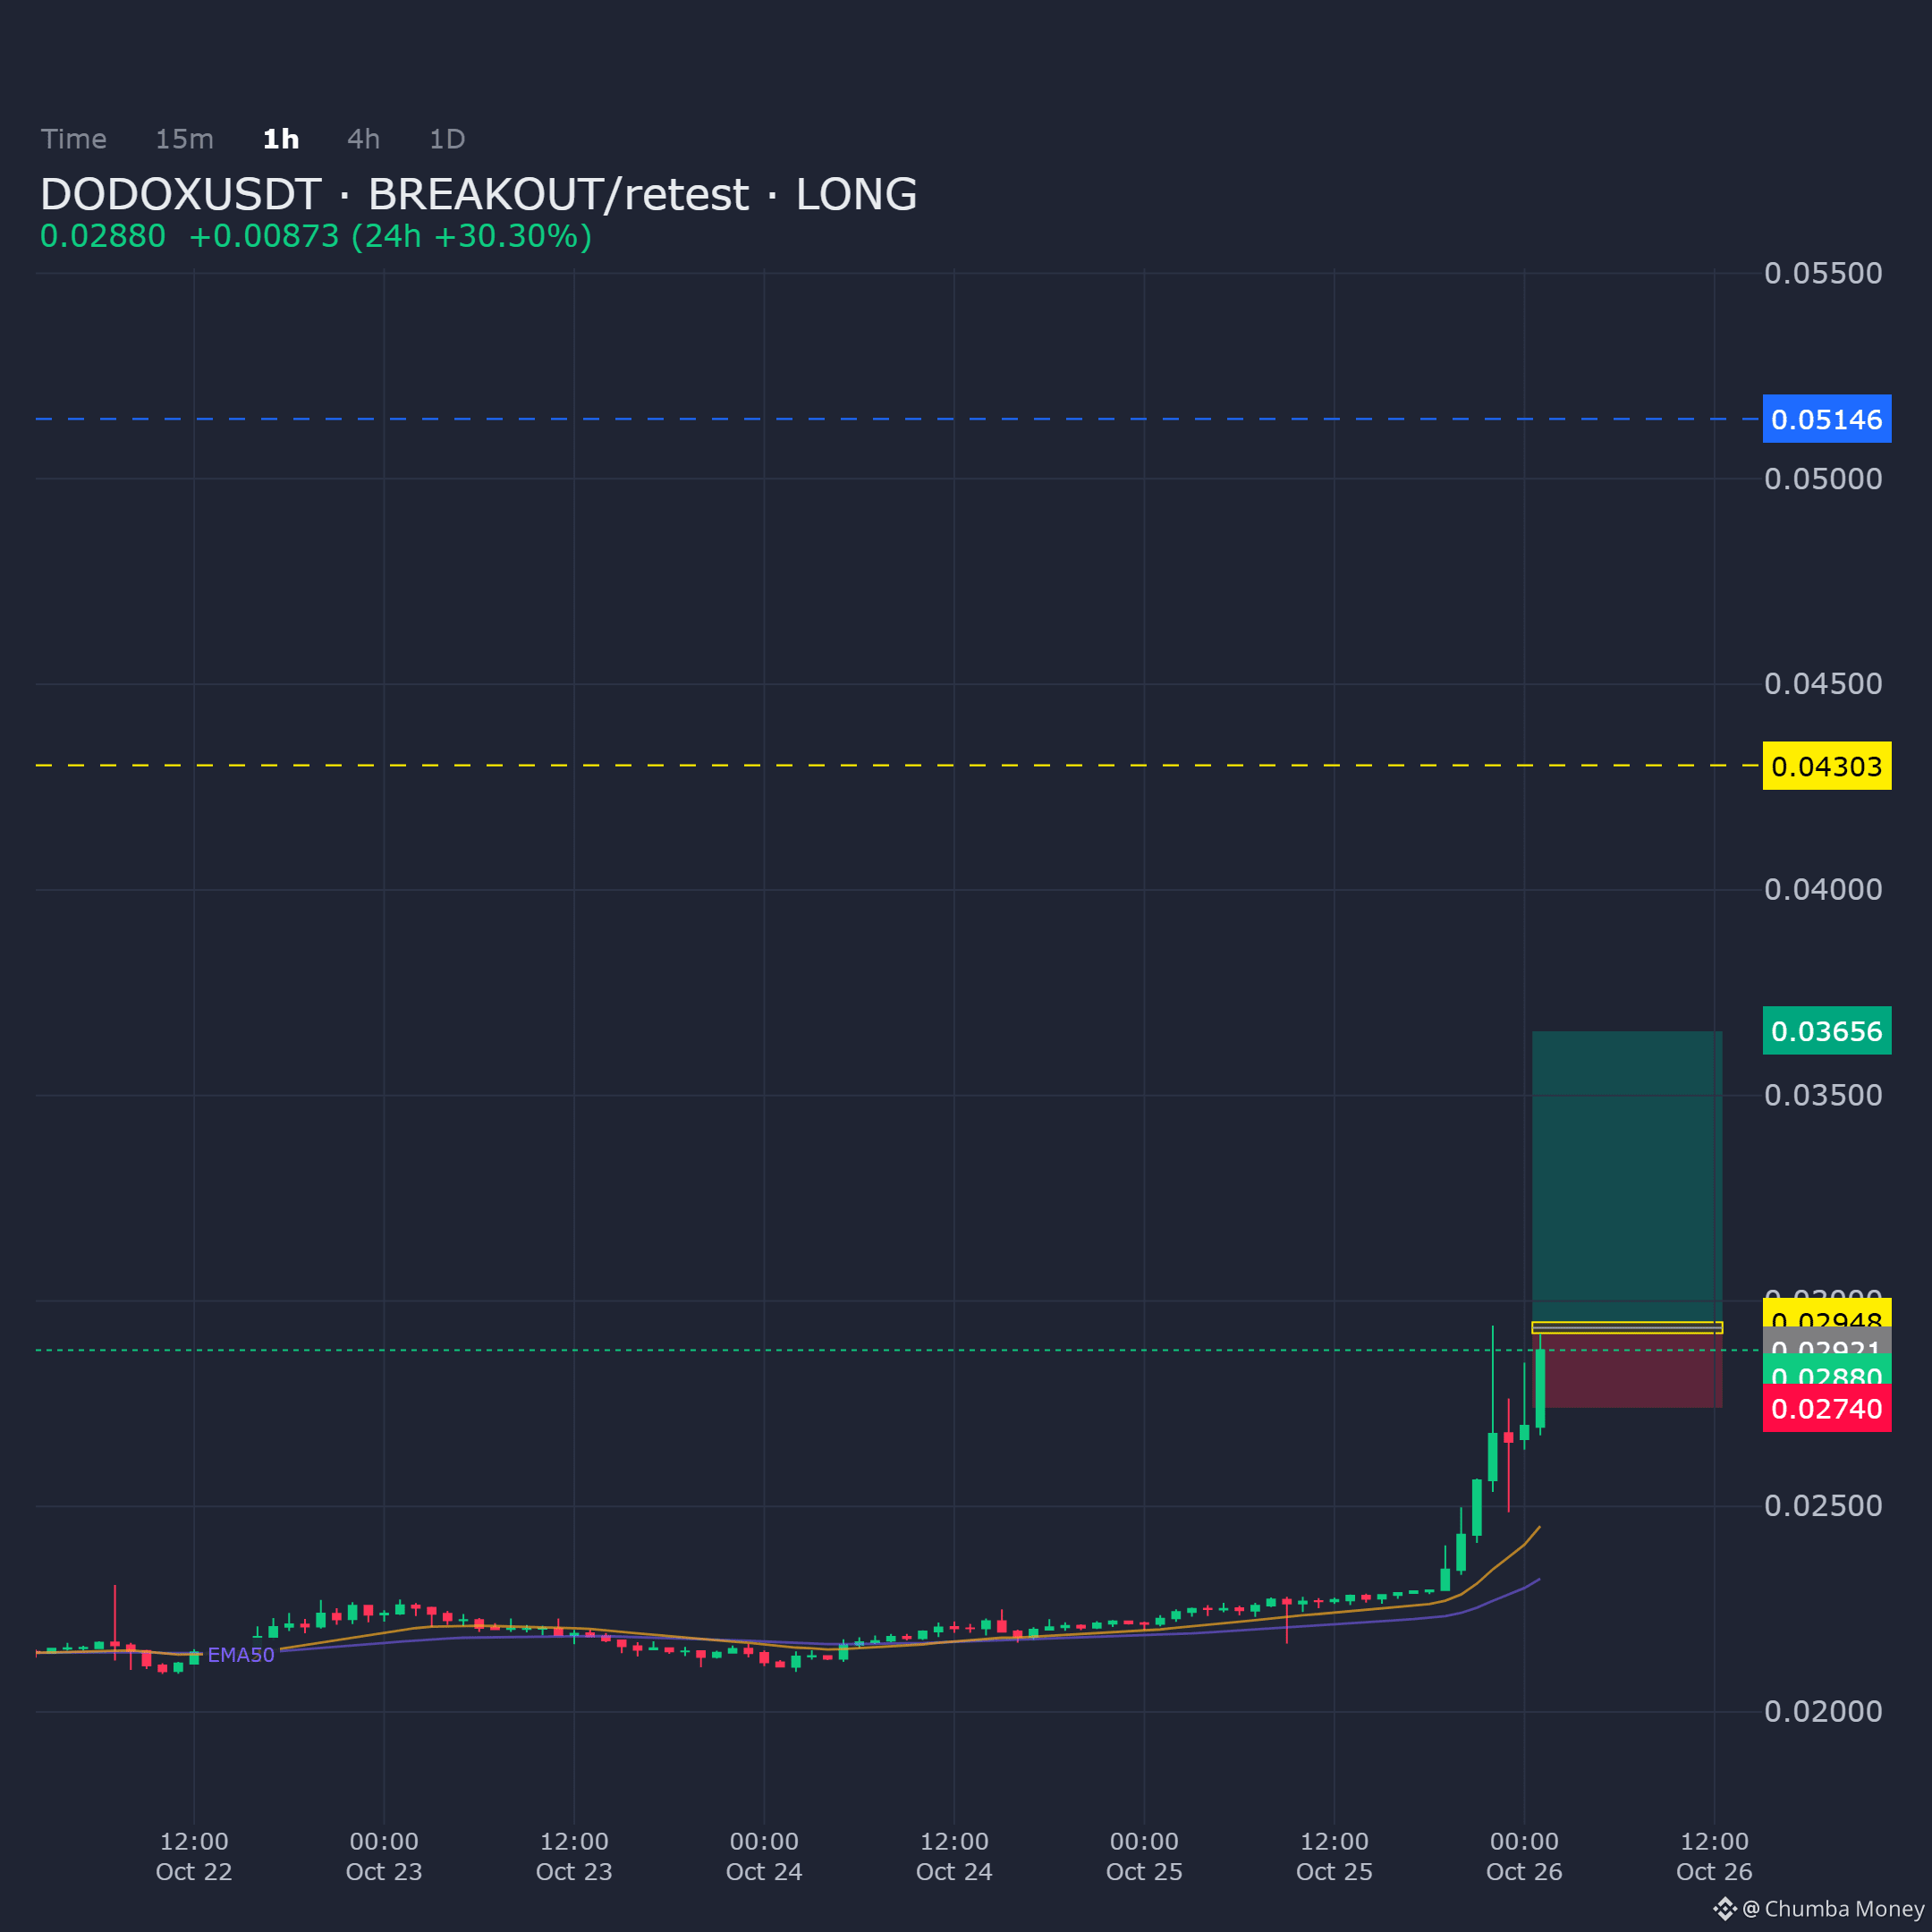
DODOXUSDT on the 1H chart shows price retreating toward a demand zone following the breakout. Bias remains long as long as this support area holds.
Entry: 0.029214 - 0.029483
Targets: TP1: 0.03656, TP2: 0.043031, TP3: 0.051456
Stop Loss: 0.027403
$DODOX
DODOXUSDT on the 1H chart shows price retreating toward a demand zone following the breakout. Bias remains long as long as this support area holds.
Entry: 0.029214 - 0.029483
Targets: TP1: 0.03656, TP2: 0.043031, TP3: 0.051456
Stop Loss: 0.027403
$DODOX
Entry: 0.029214 - 0.029483
Targets: TP1: 0.03656, TP2: 0.043031, TP3: 0.051456
Stop Loss: 0.027403
$DODOX
45
·
--
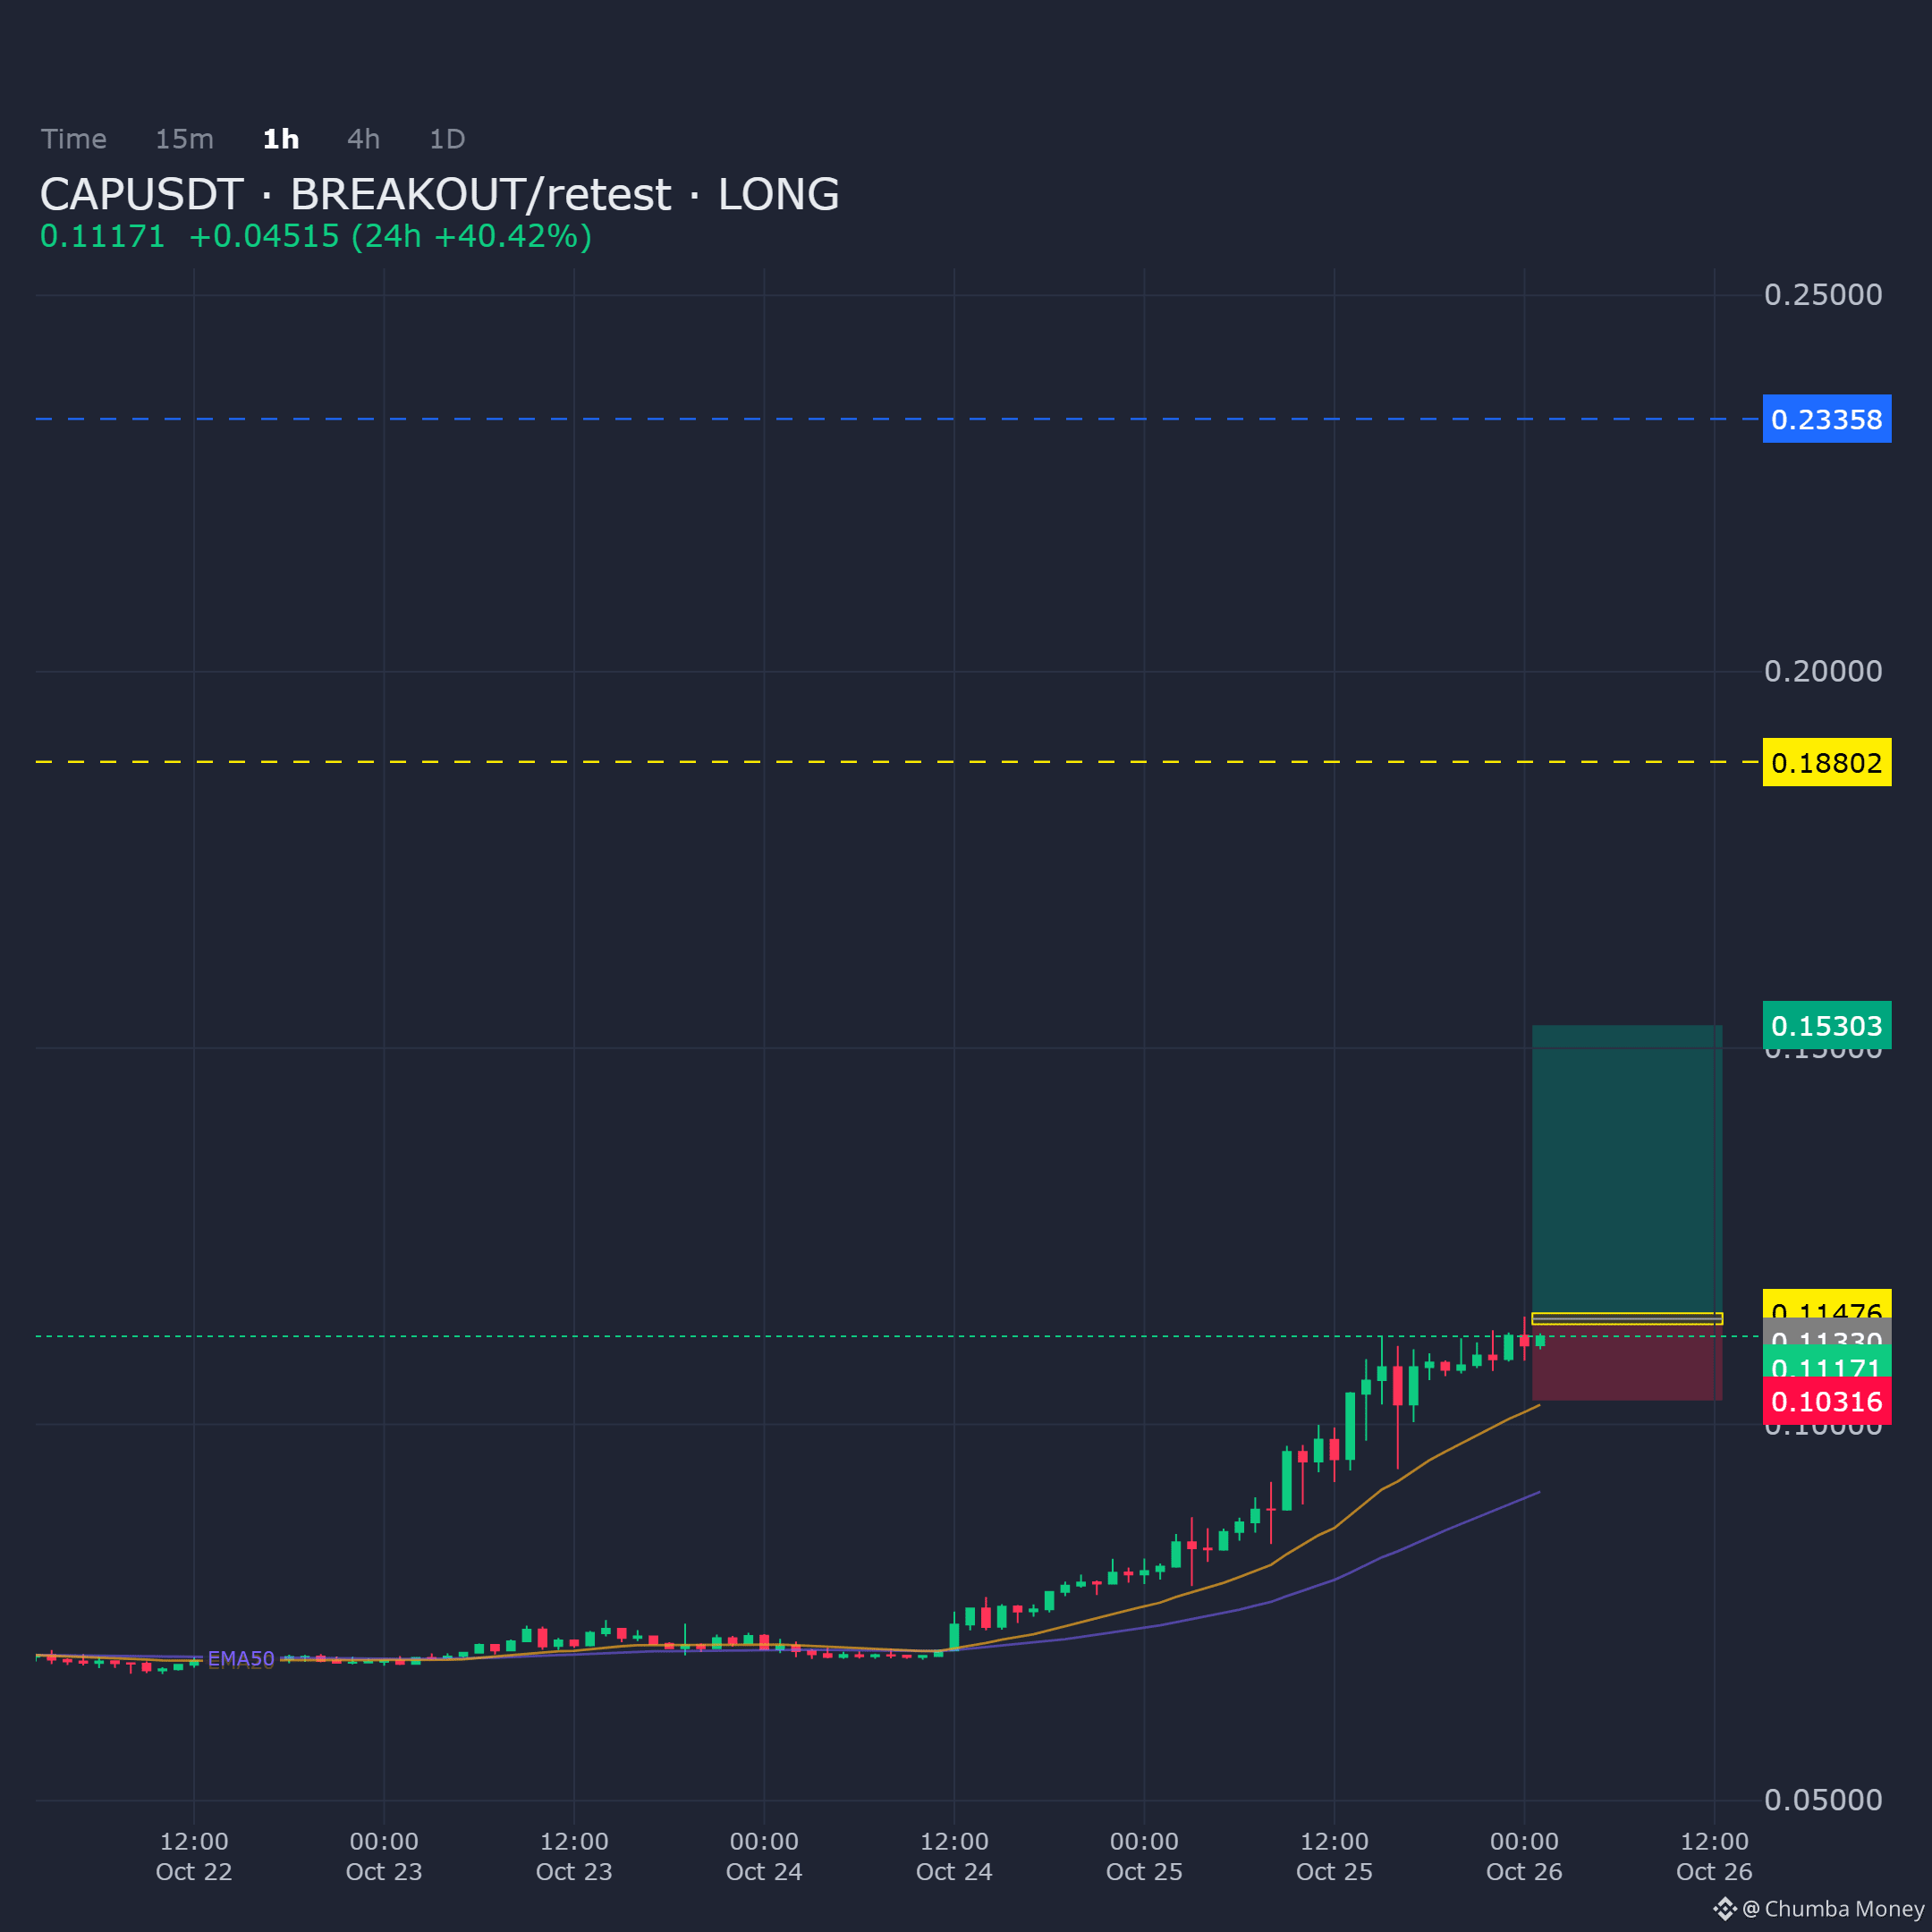
CAPUSDT on the 1H shows structure holding into demand with a workable breakout-retest setup for a long bias.
Entry: 0.113298 - 0.114756
Targets: TP1: 0.153026, TP2: 0.188016, TP3: 0.233576
Stop Loss: 0.10316
$CAP
CAPUSDT on the 1H shows structure holding into demand with a workable breakout-retest setup for a long bias.
Entry: 0.113298 - 0.114756
Targets: TP1: 0.153026, TP2: 0.188016, TP3: 0.233576
Stop Loss: 0.10316
$CAP
Entry: 0.113298 - 0.114756
Targets: TP1: 0.153026, TP2: 0.188016, TP3: 0.233576
Stop Loss: 0.10316
$CAP
56
·
--
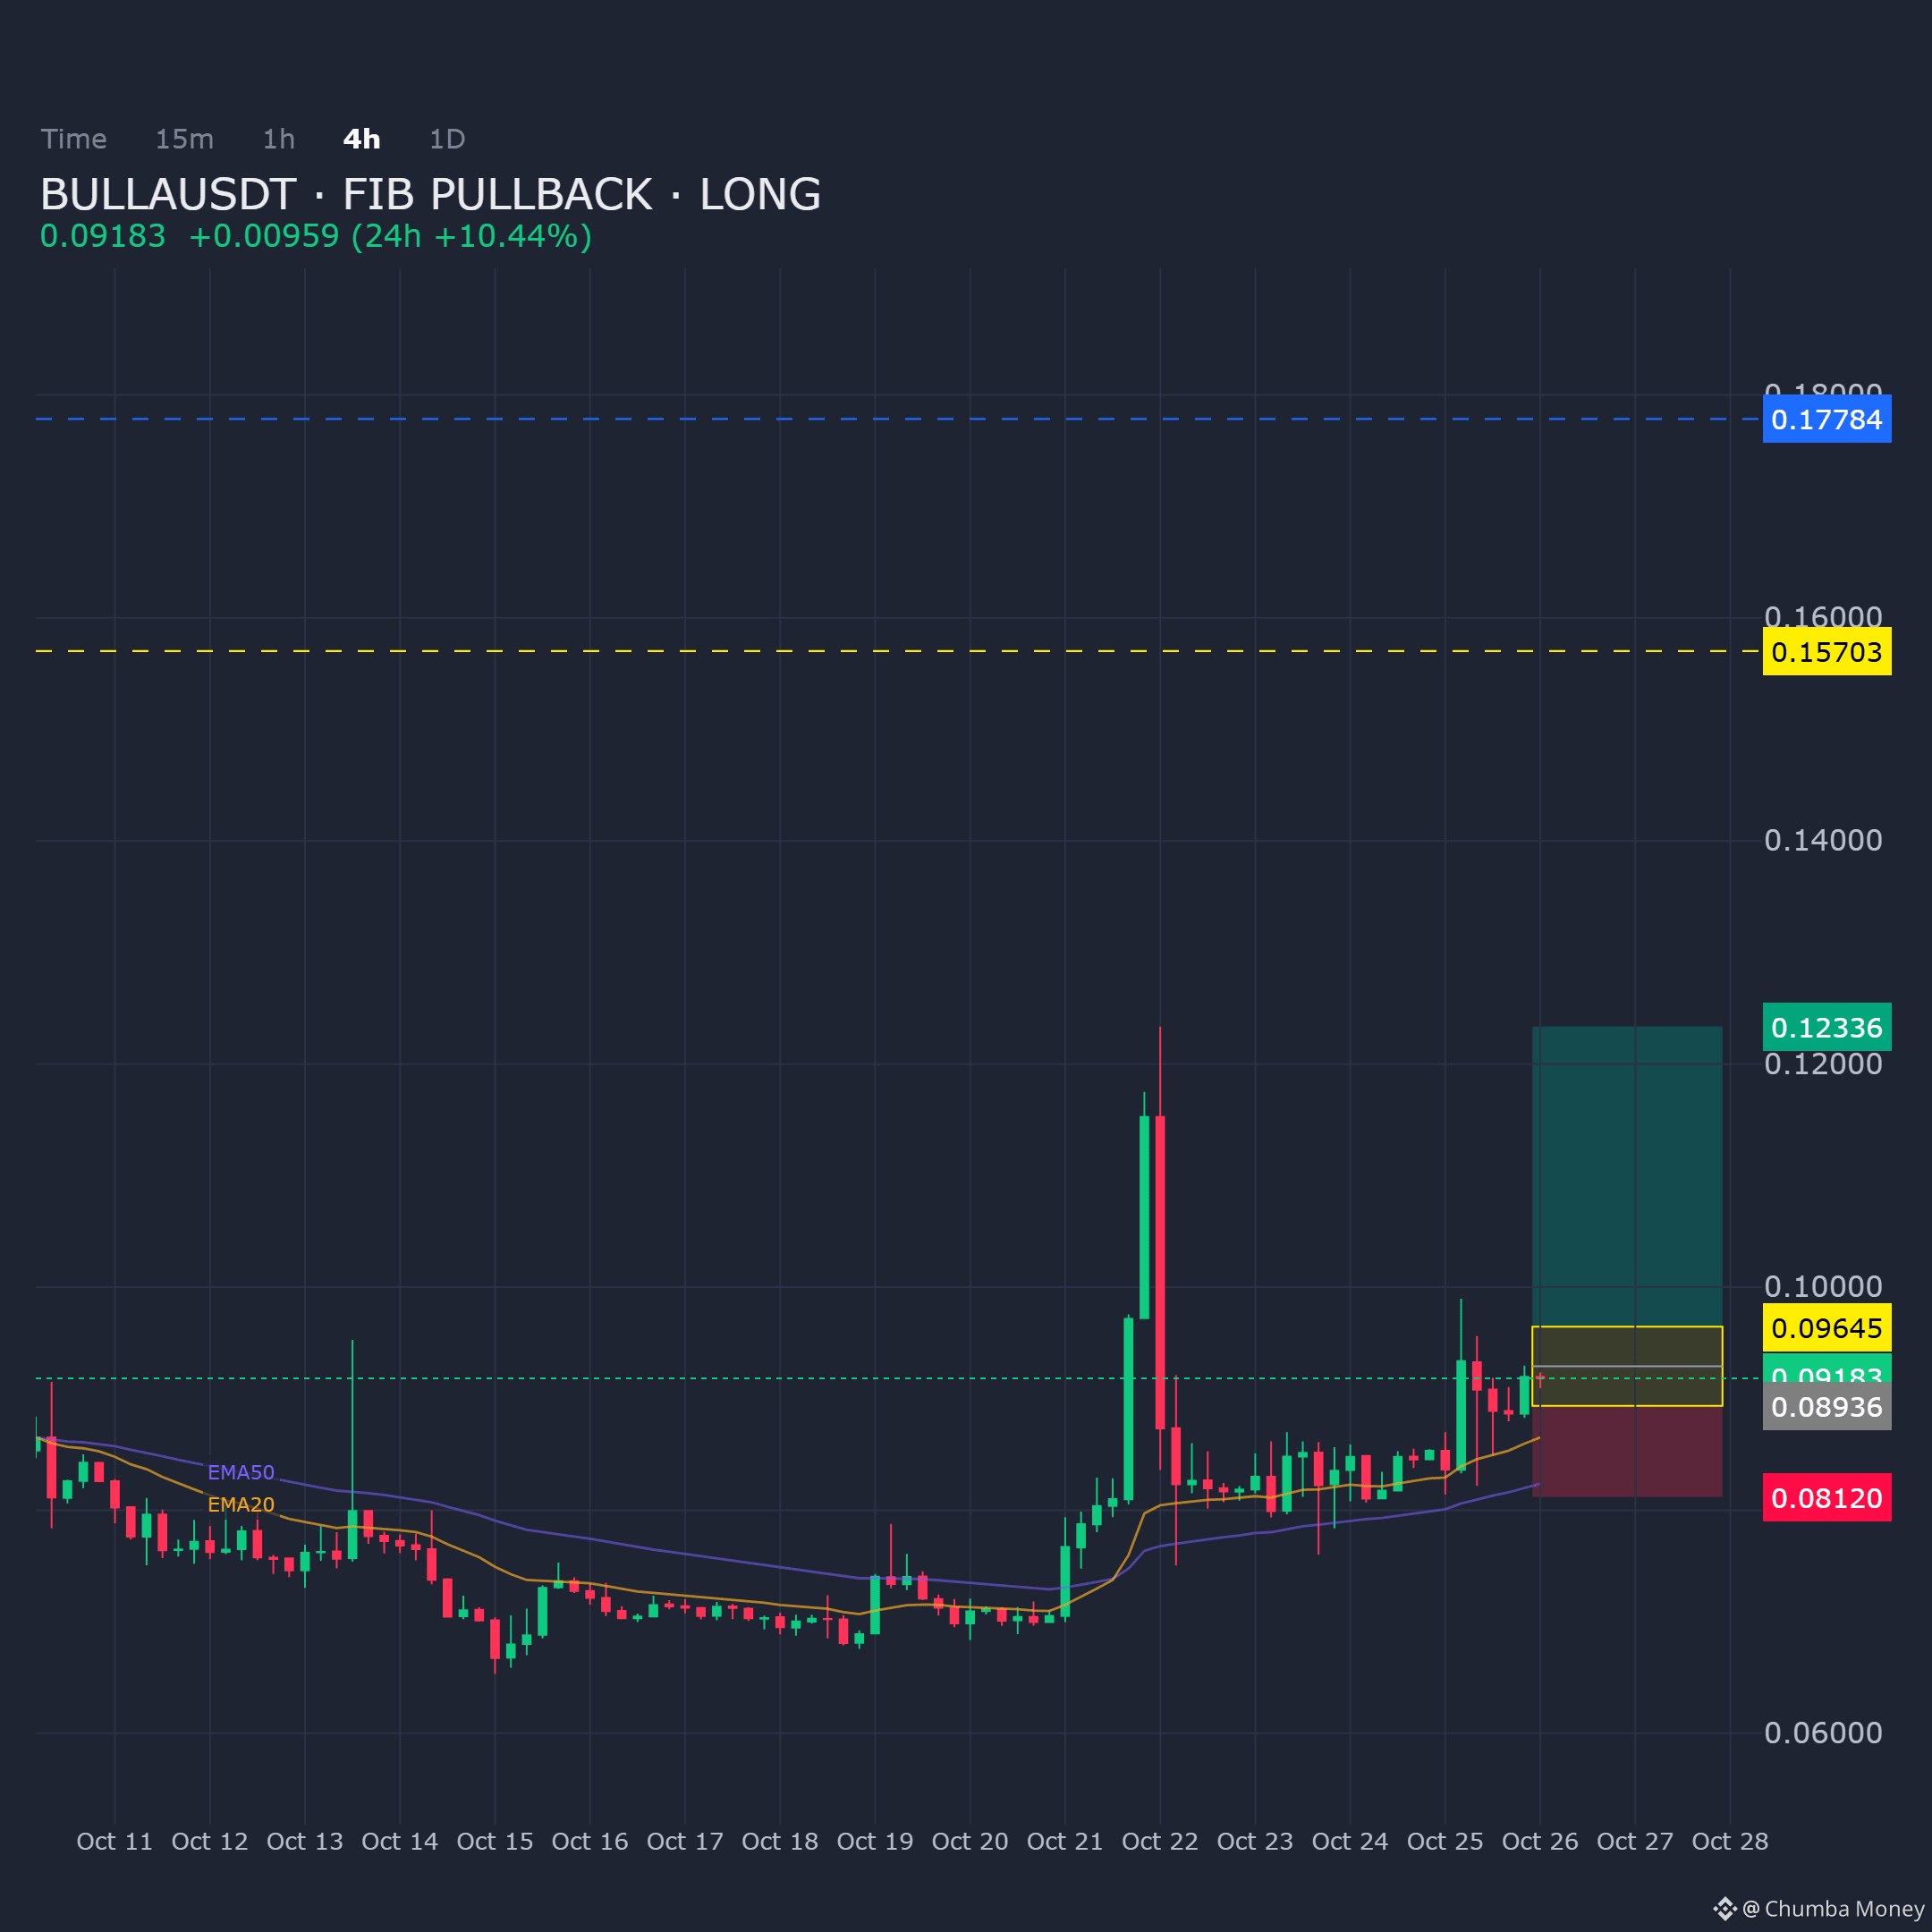
BULLAUSDT on the 4H chart is holding a clear bullish structure. Price is retracing into the Fibonacci pullback zone, aligning with a long bias ahead of the next move.
Entry: 0.089364 - 0.096447
Targets: TP1: 0.12336, TP2: 0.157029, TP3: 0.17784
Stop Loss: 0.081204
$BULLA
BULLAUSDT on the 4H chart is holding a clear bullish structure. Price is retracing into the Fibonacci pullback zone, aligning with a long bias ahead of the next move.
Entry: 0.089364 - 0.096447
Targets: TP1: 0.12336, TP2: 0.157029, TP3: 0.17784
Stop Loss: 0.081204
$BULLA
Entry: 0.089364 - 0.096447
Targets: TP1: 0.12336, TP2: 0.157029, TP3: 0.17784
Stop Loss: 0.081204
$BULLA
96
·
--
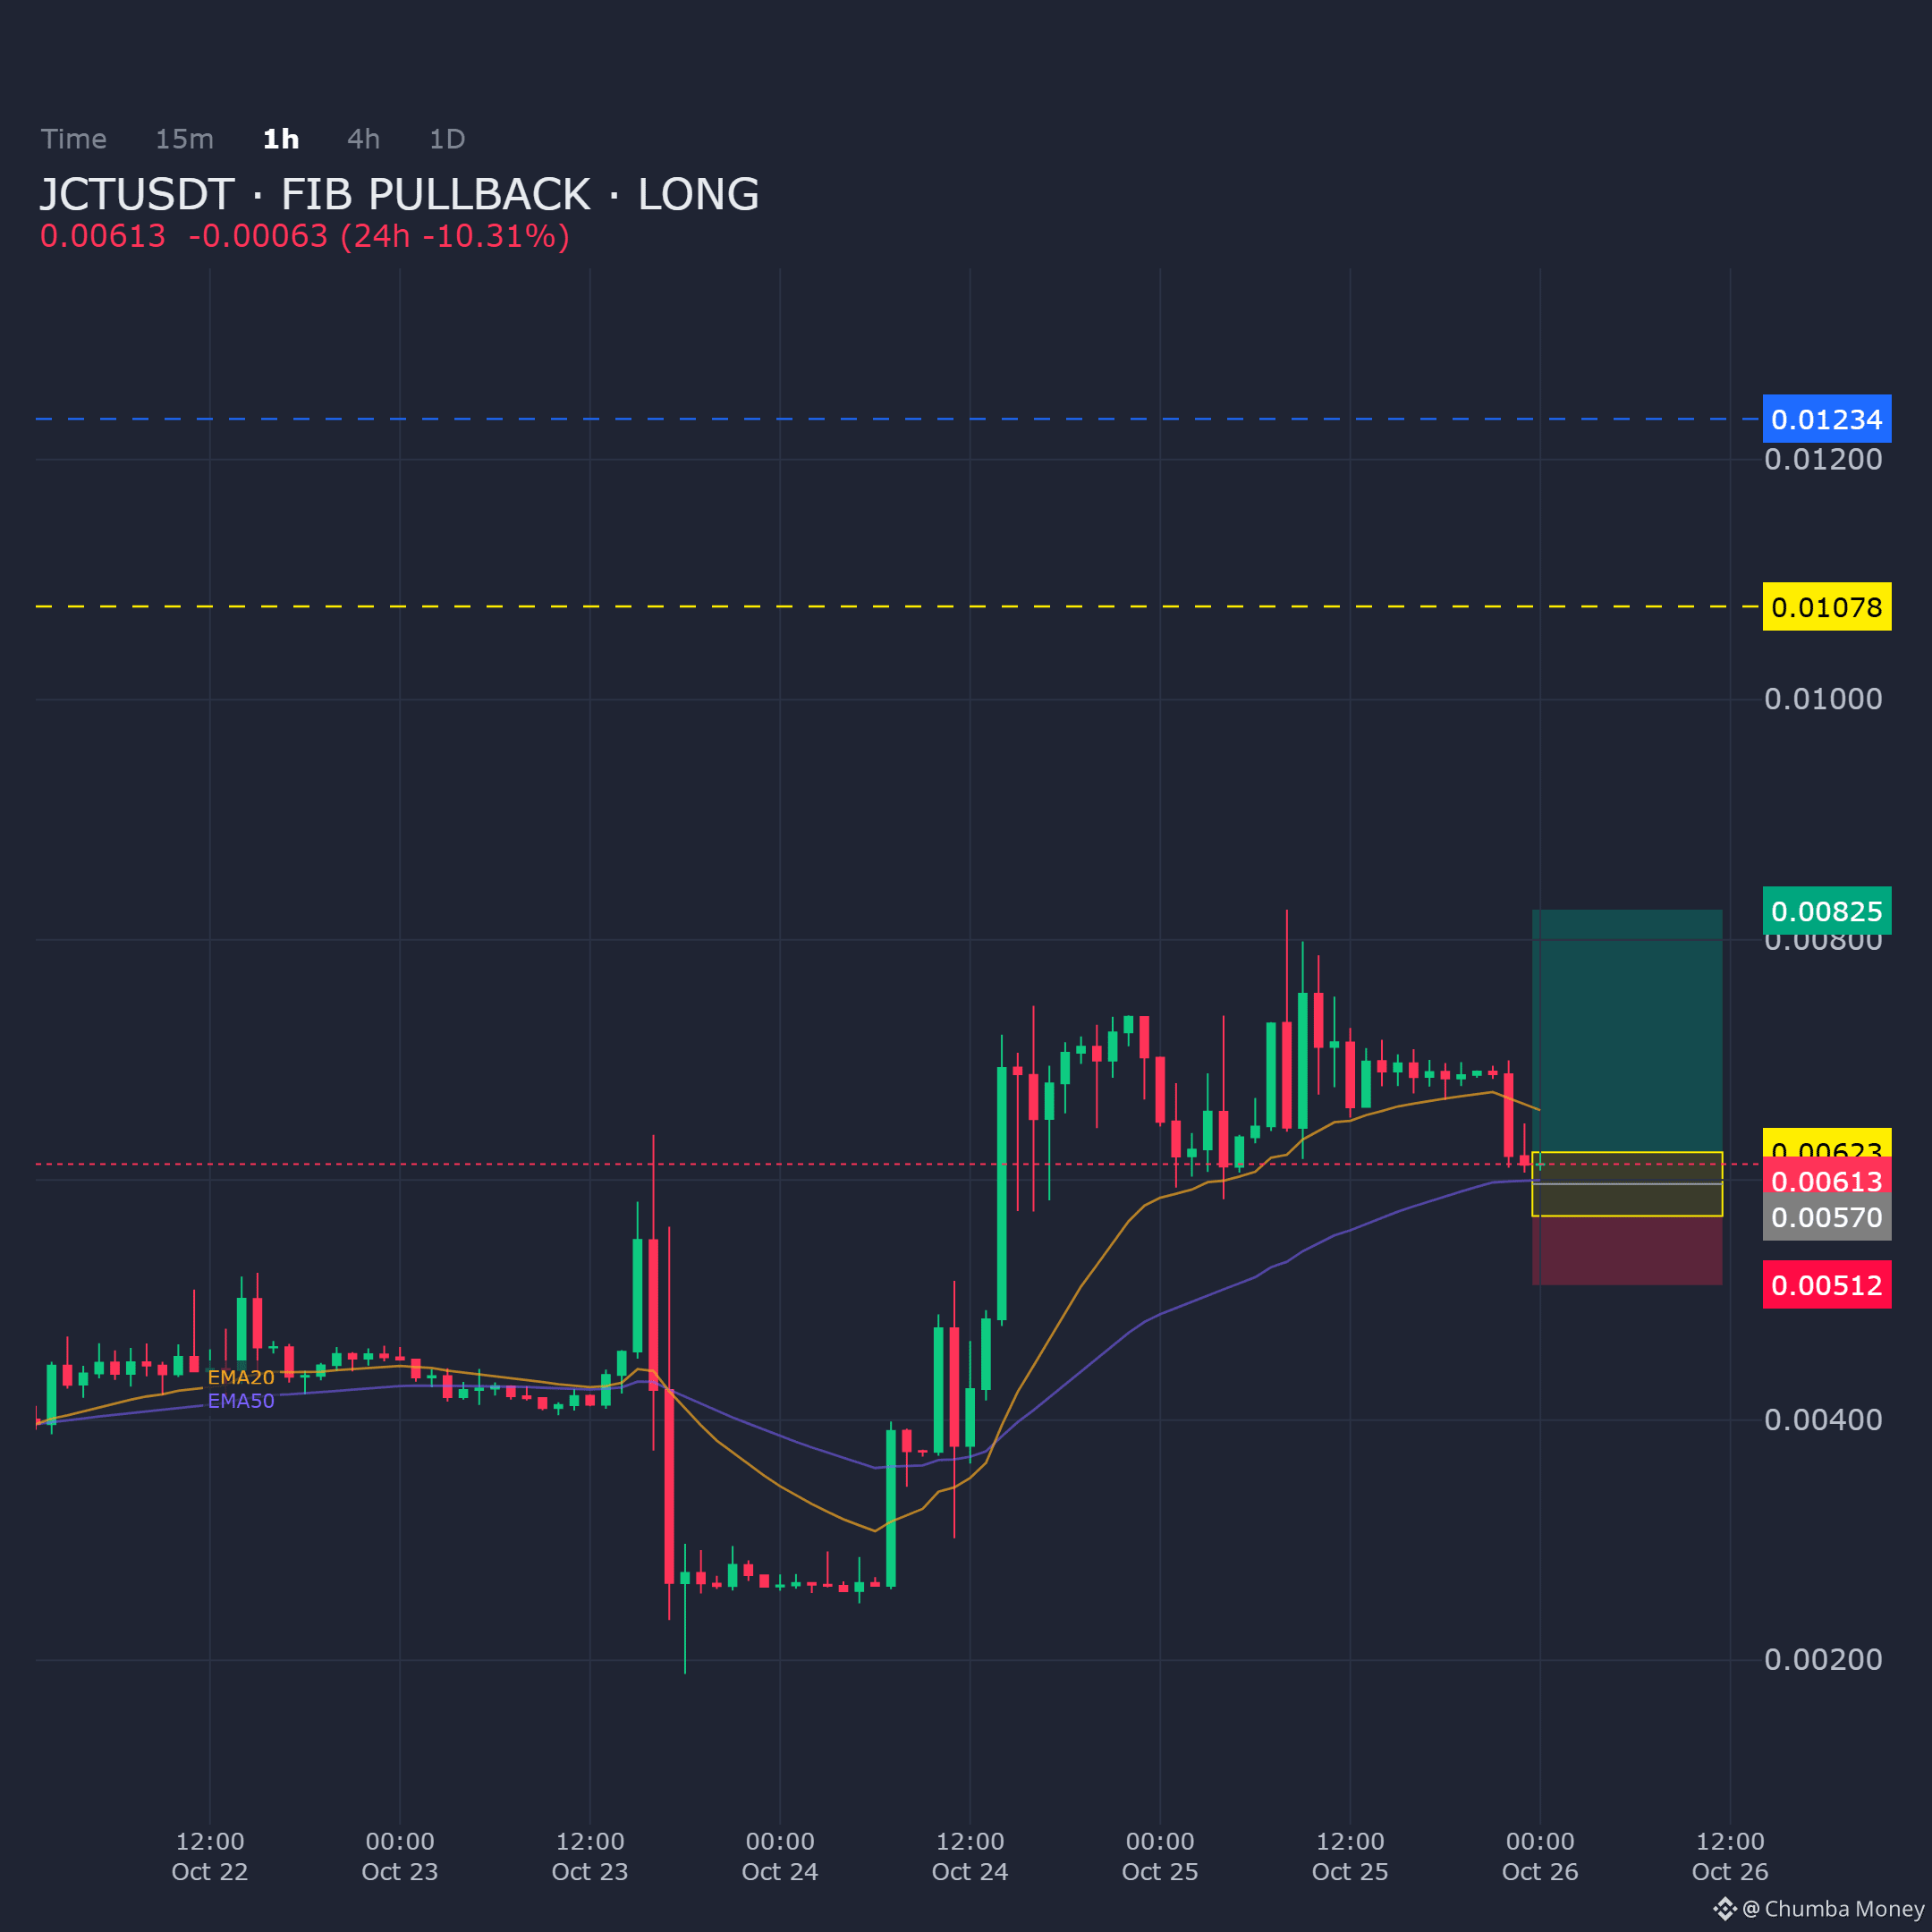
JCTUSDT on the 1H chart is pulling into a Fibonacci demand zone; the long bias remains intact as long as this support area holds.
Entry: 0.0057 - 0.006231
Targets: TP1: 0.00825, TP2: 0.010776, TP3: 0.012337
Stop Loss: 0.005124
$JCT
JCTUSDT on the 1H chart is pulling into a Fibonacci demand zone; the long bias remains intact as long as this support area holds.
Entry: 0.0057 - 0.006231
Targets: TP1: 0.00825, TP2: 0.010776, TP3: 0.012337
Stop Loss: 0.005124
$JCT
Entry: 0.0057 - 0.006231
Targets: TP1: 0.00825, TP2: 0.010776, TP3: 0.012337
Stop Loss: 0.005124
$JCT
91
·
--
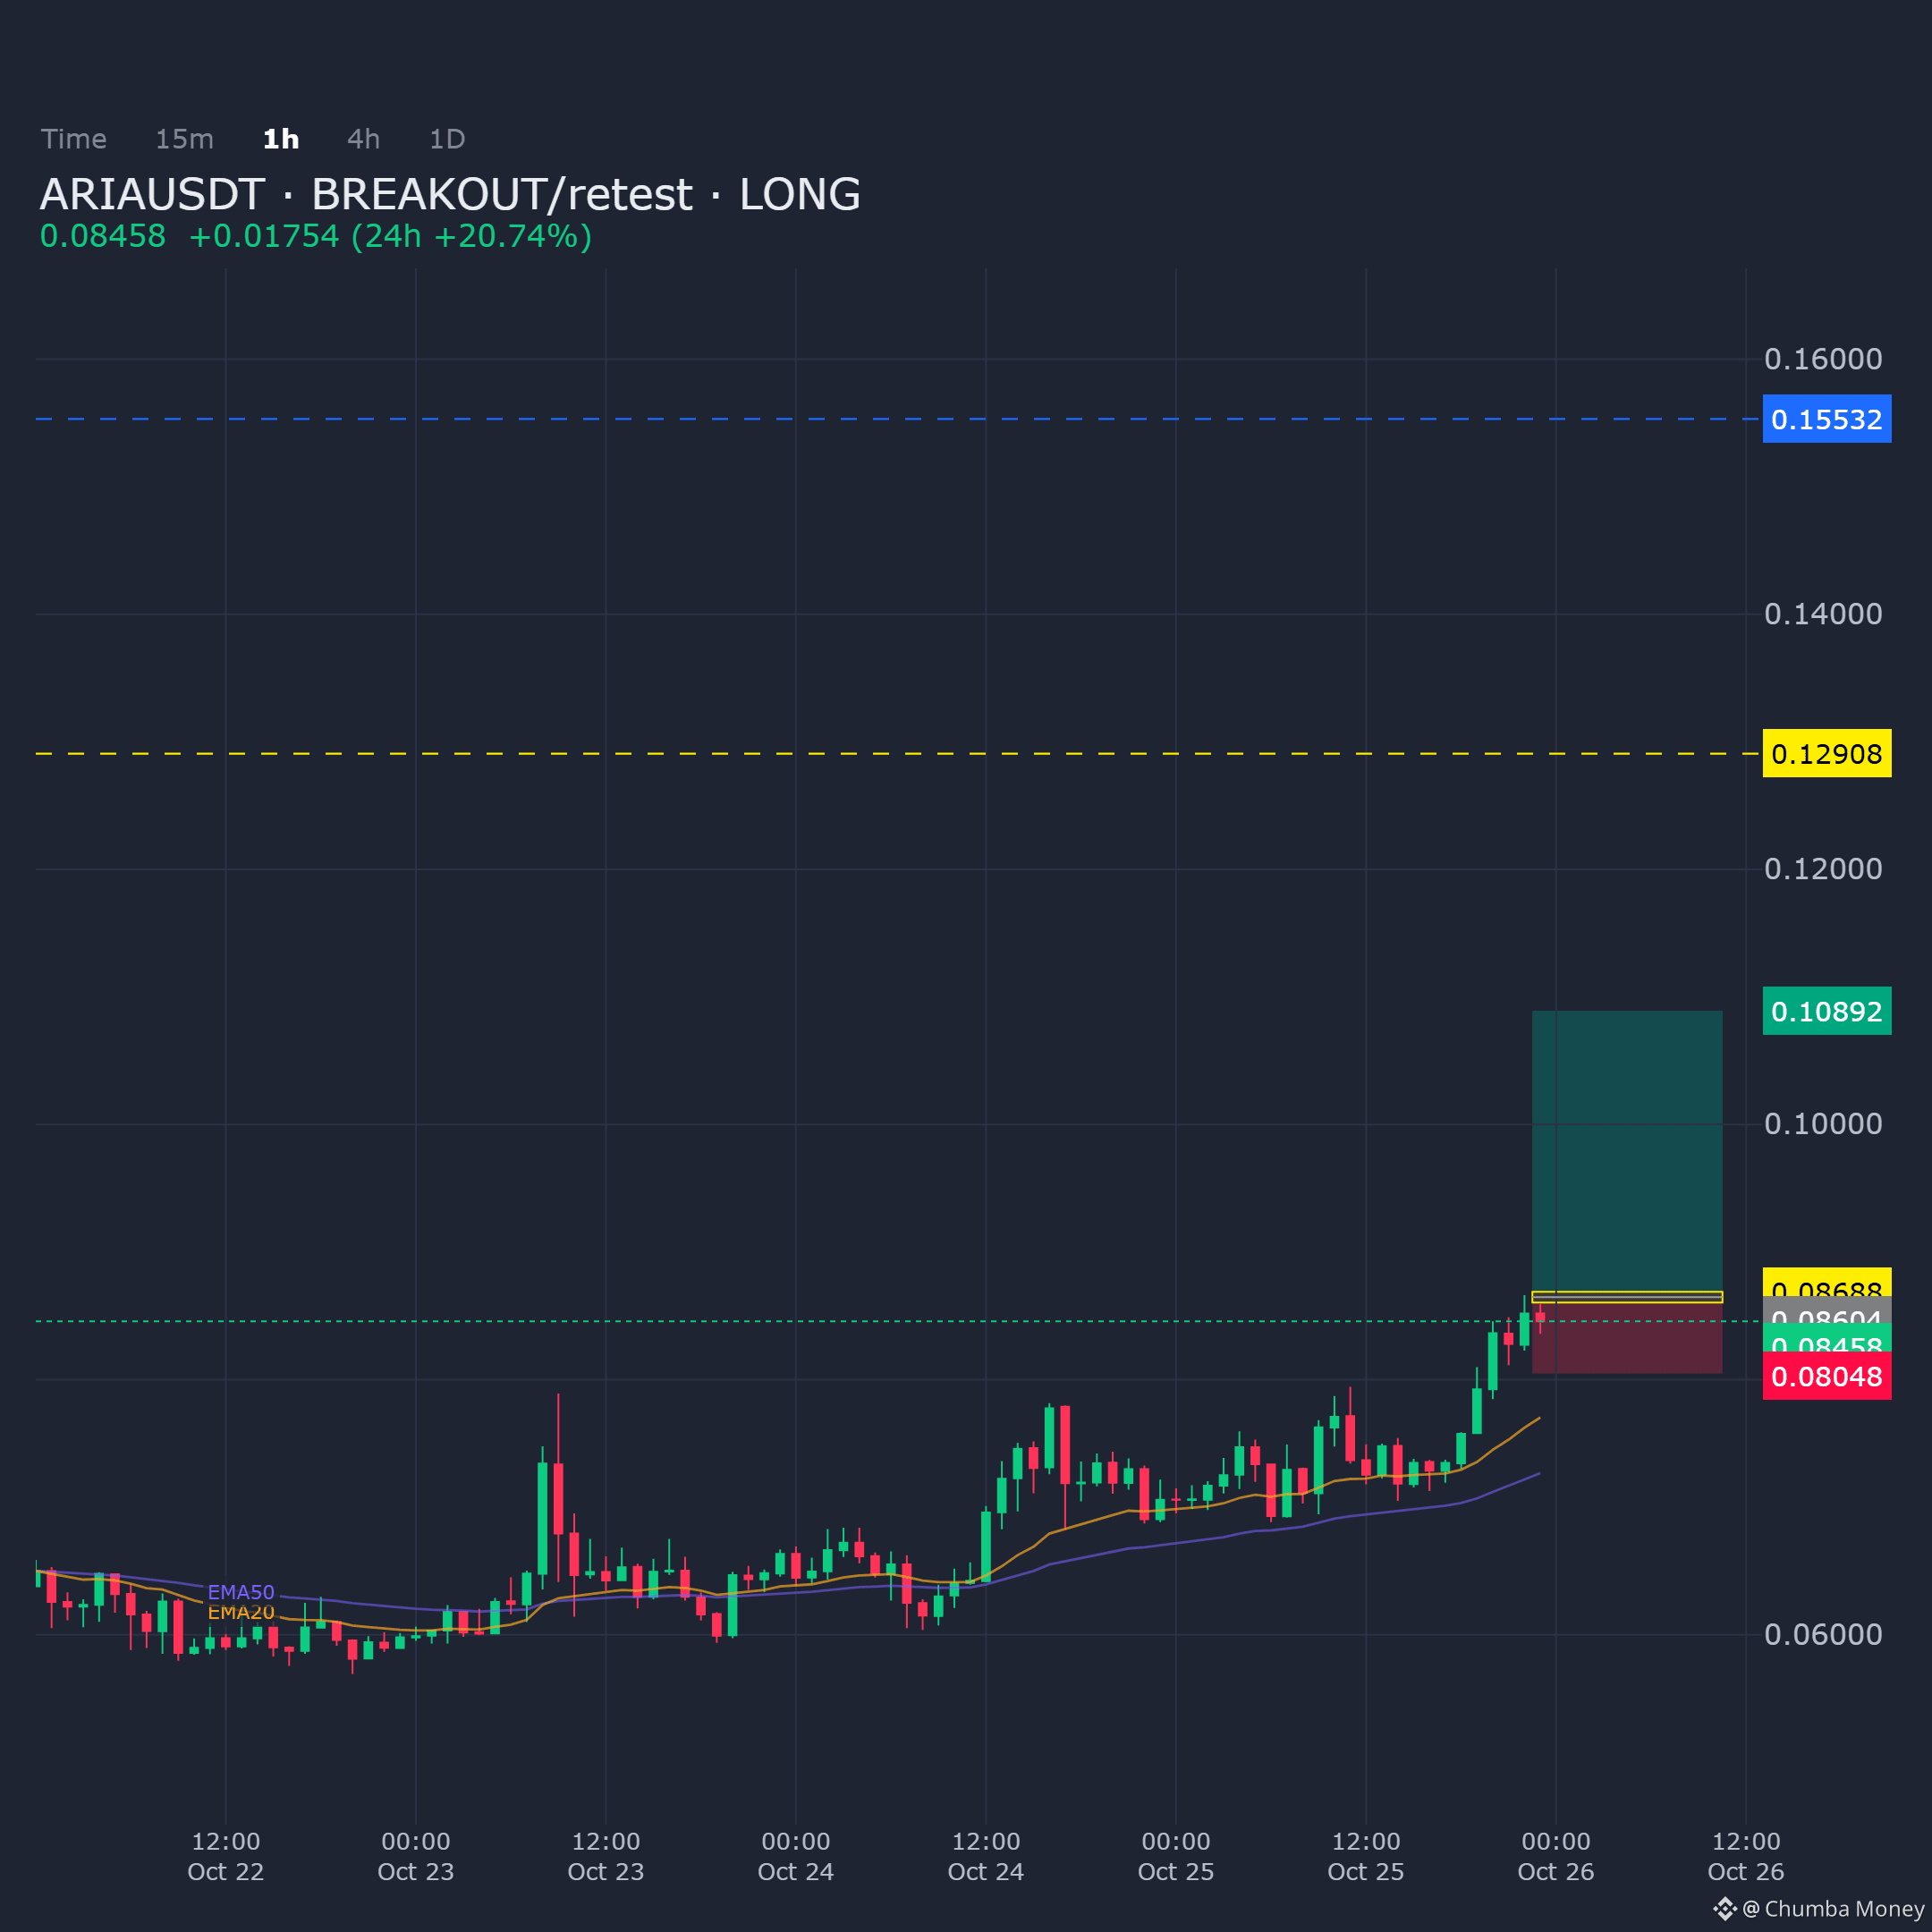
ARIAUSDT on the 1H chart is approaching a breakout/retest zone with a bullish bias. Confluence factors are aligning for a long entry at current levels.
Entry: 0.086043 - 0.086882
Targets: TP1: 0.108924, TP2: 0.129076, TP3: 0.155316
Stop Loss: 0.08048
$ARIA
ARIAUSDT on the 1H chart is approaching a breakout/retest zone with a bullish bias. Confluence factors are aligning for a long entry at current levels.
Entry: 0.086043 - 0.086882
Targets: TP1: 0.108924, TP2: 0.129076, TP3: 0.155316
Stop Loss: 0.08048
$ARIA
Entry: 0.086043 - 0.086882
Targets: TP1: 0.108924, TP2: 0.129076, TP3: 0.155316
Stop Loss: 0.08048
$ARIA
20
·
--
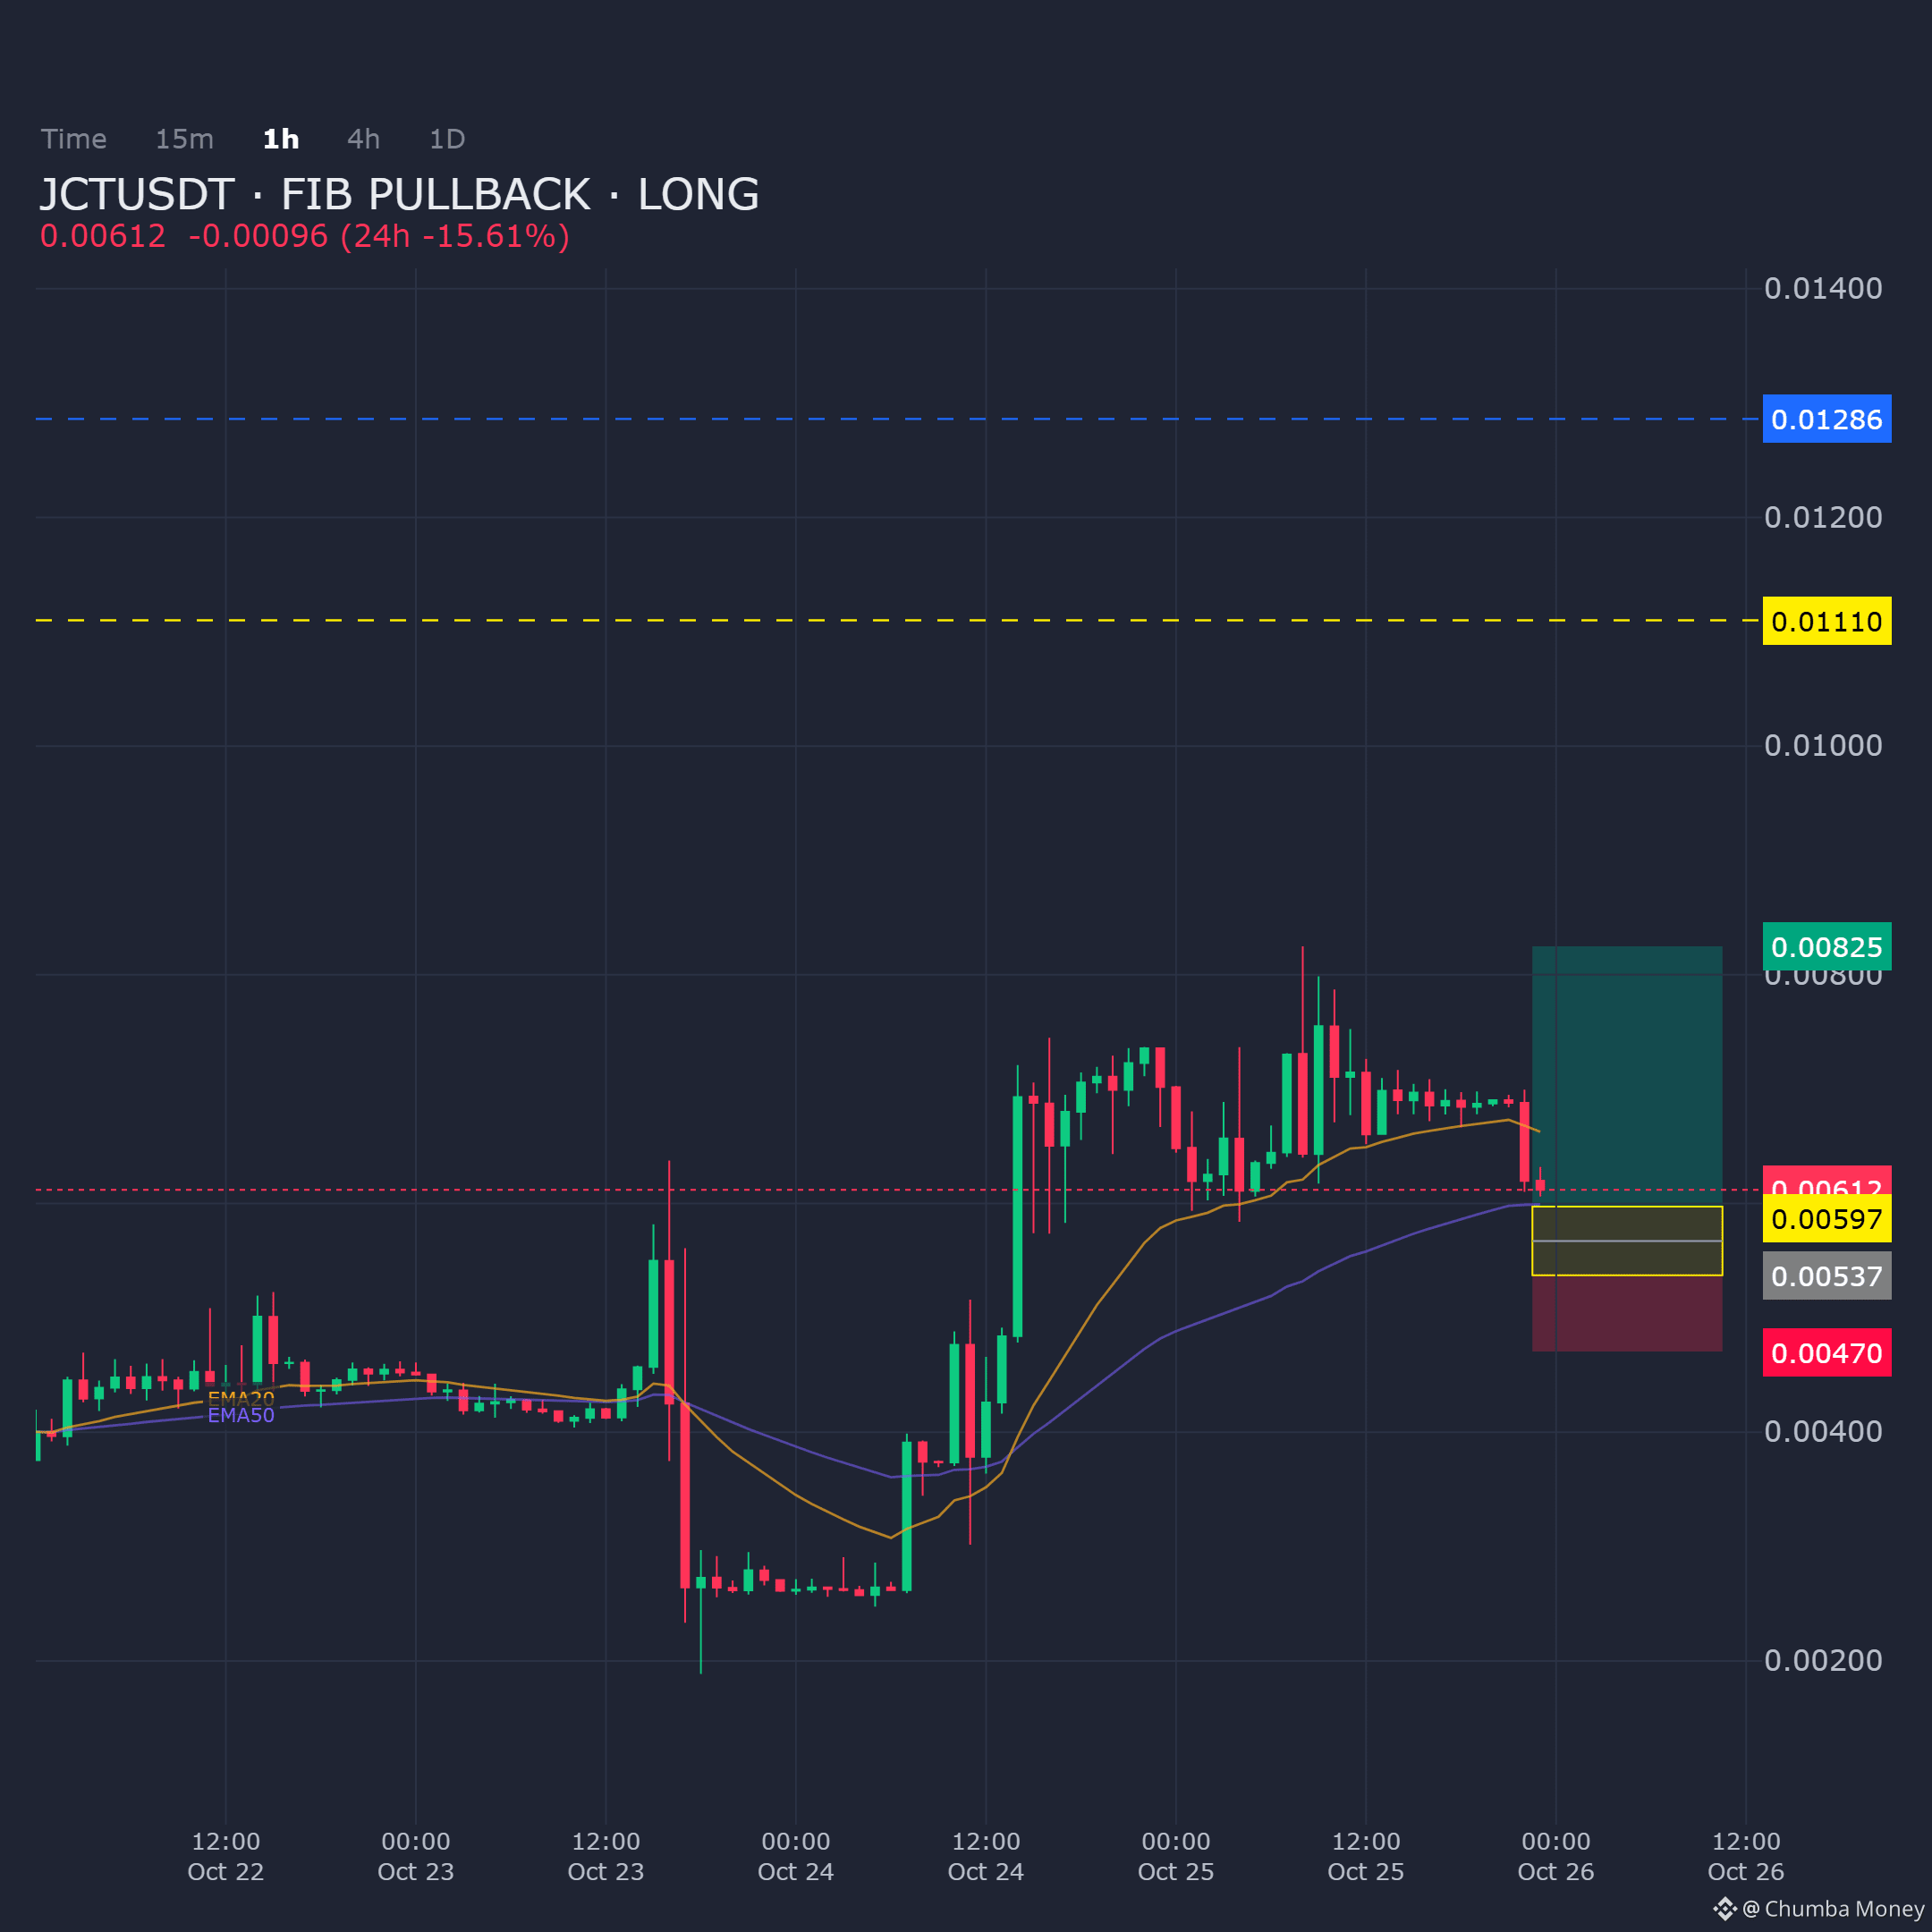
JCTUSDT is on the 1H chart, drawing back into a Fibonacci pullback zone. Demand around this region keeps the structural bias tilted toward the long side.
Entry: 0.005373 - 0.005972
Targets: TP1: 0.00825, TP2: 0.0111, TP3: 0.012861
Stop Loss: 0.004705
$JCT
JCTUSDT is on the 1H chart, drawing back into a Fibonacci pullback zone. Demand around this region keeps the structural bias tilted toward the long side.
Entry: 0.005373 - 0.005972
Targets: TP1: 0.00825, TP2: 0.0111, TP3: 0.012861
Stop Loss: 0.004705
$JCT
Entry: 0.005373 - 0.005972
Targets: TP1: 0.00825, TP2: 0.0111, TP3: 0.012861
Stop Loss: 0.004705
$JCT
1
46
·
--
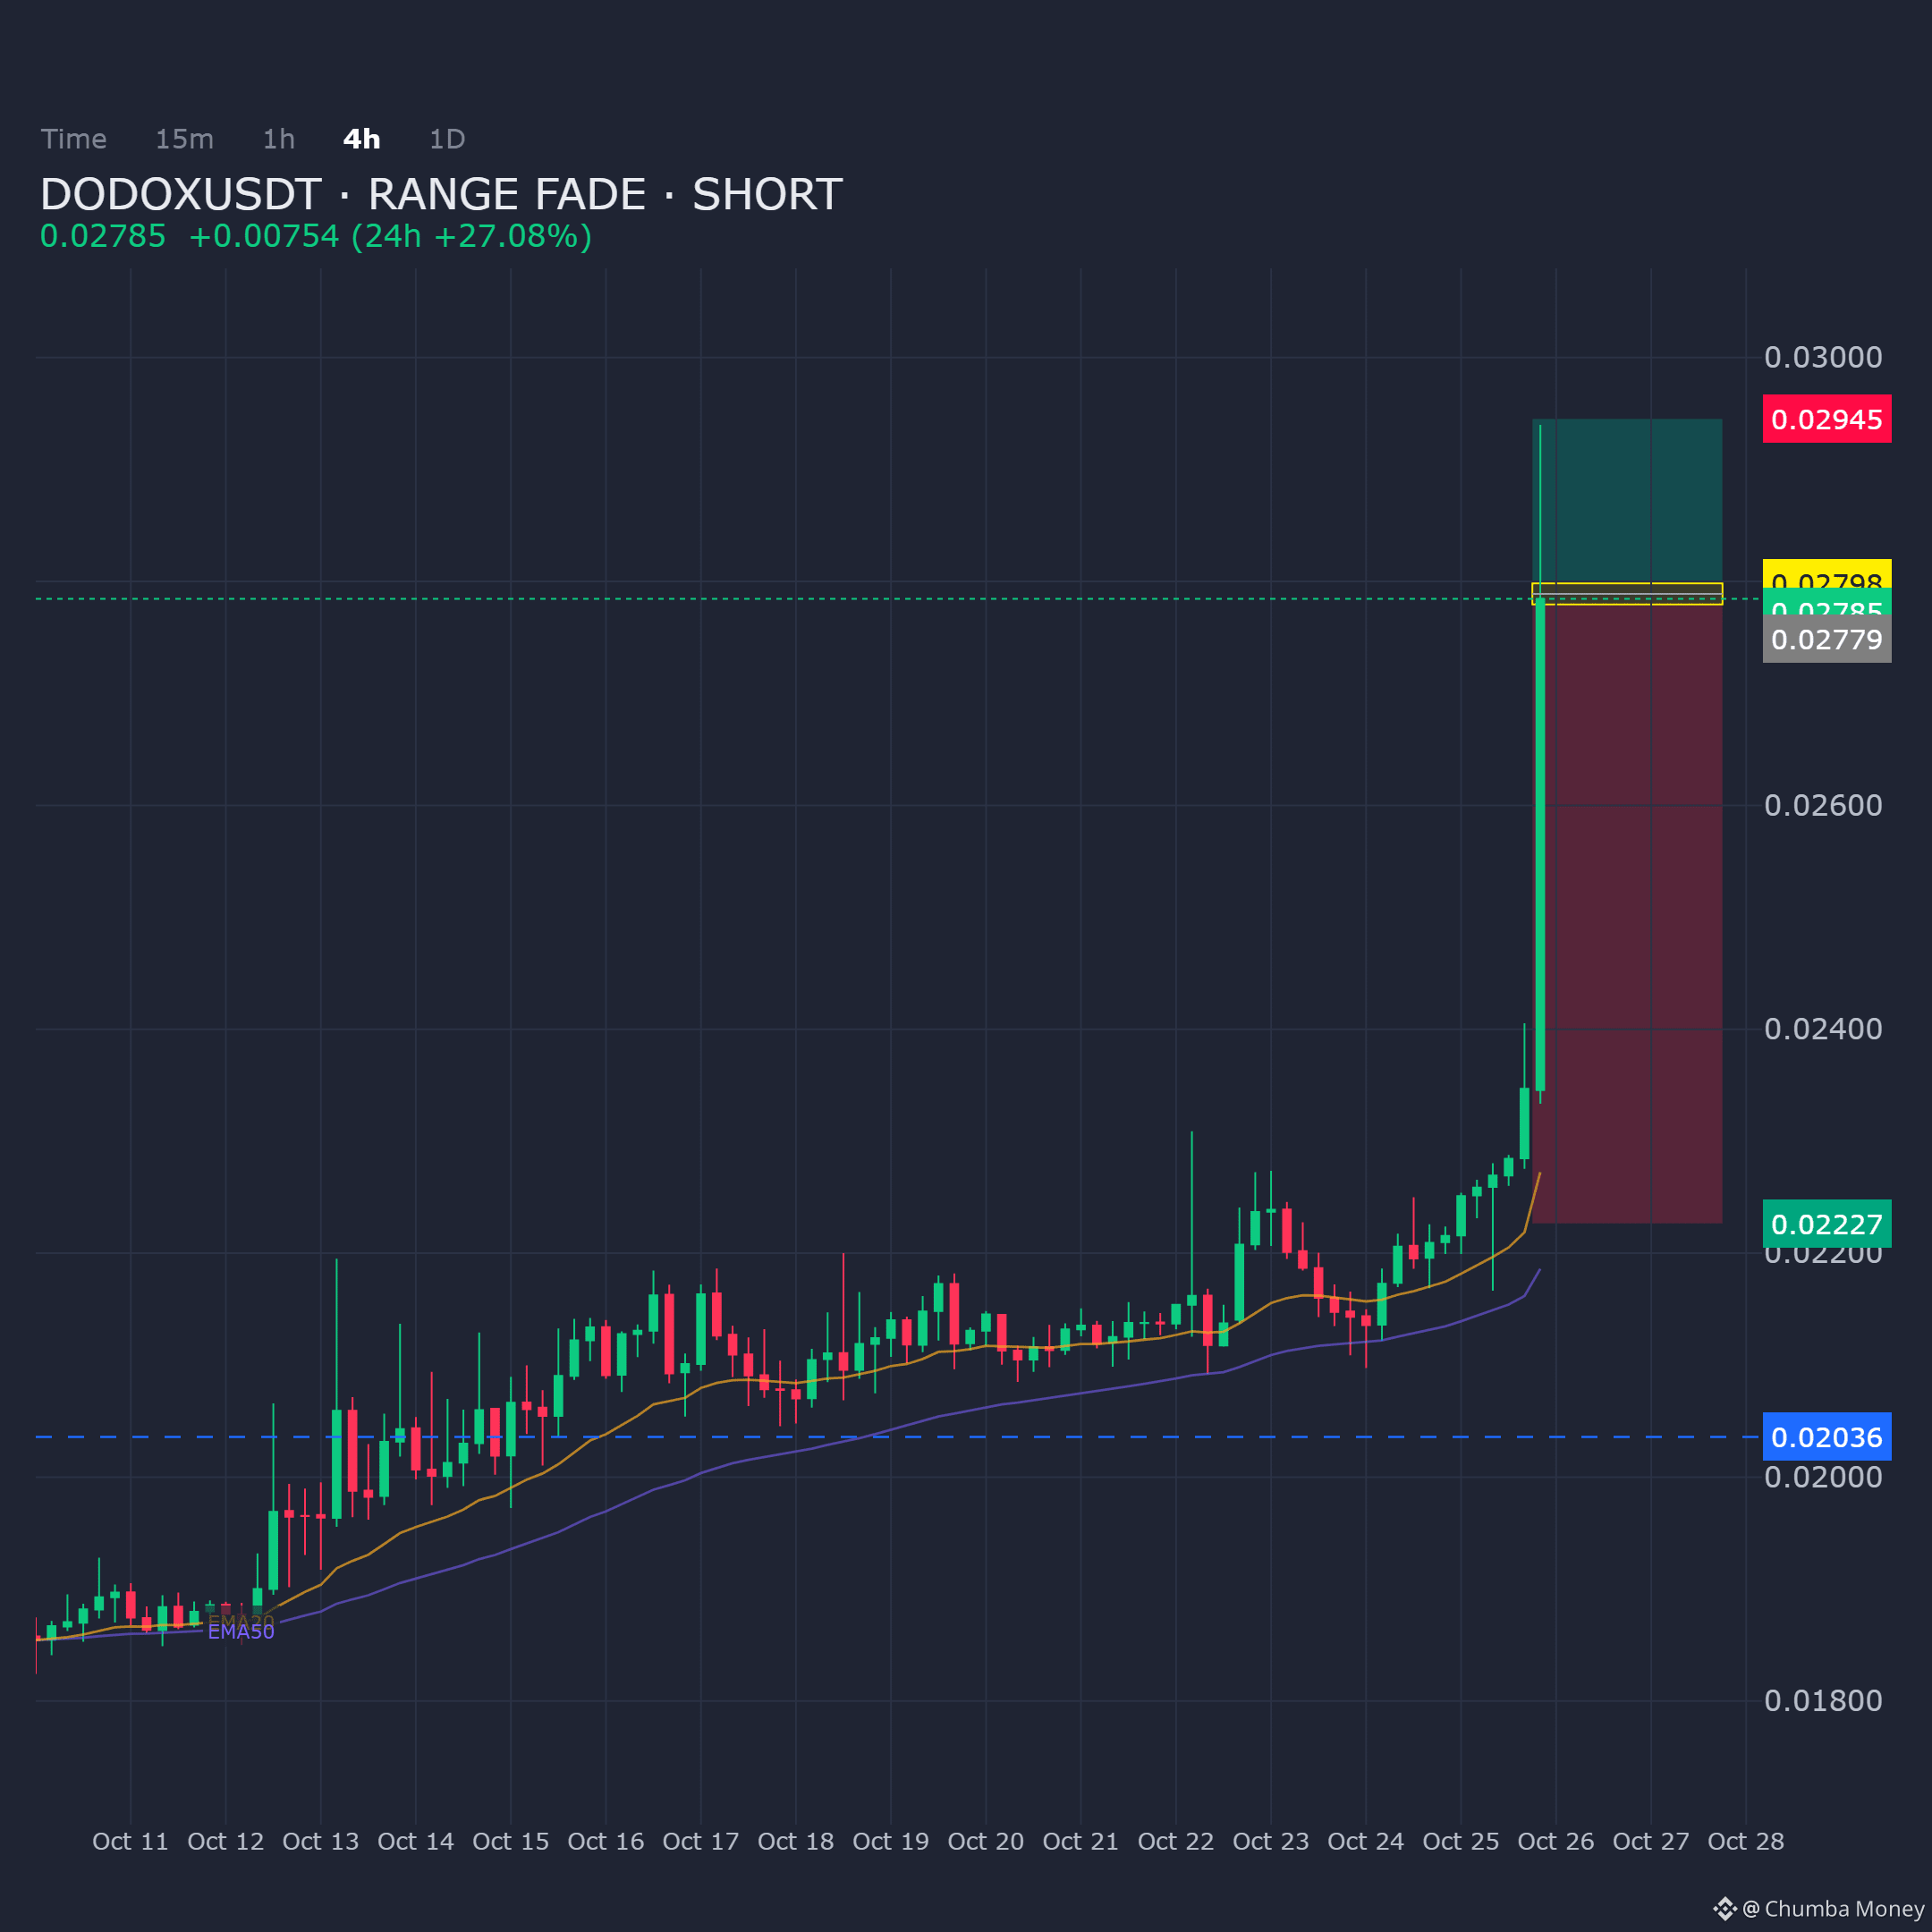
DODOXUSDT on the 4H is approaching a supply zone after pushing into resistance. Bias remains short from this area as the range fade setup takes shape.
Entry: 0.027794 - 0.027982
Targets: TP1: 0.022267, TP2: 0.021015, TP3: 0.020359
Stop Loss: 0.029451
$DODOX
DODOXUSDT on the 4H is approaching a supply zone after pushing into resistance. Bias remains short from this area as the range fade setup takes shape.
Entry: 0.027794 - 0.027982
Targets: TP1: 0.022267, TP2: 0.021015, TP3: 0.020359
Stop Loss: 0.029451
$DODOX
Entry: 0.027794 - 0.027982
Targets: TP1: 0.022267, TP2: 0.021015, TP3: 0.020359
Stop Loss: 0.029451
$DODOX
16
Войдите, чтобы посмотреть больше материала
Присоединяйтесь к пользователям криптовалют по всему миру на Binance Square
⚡️ Получайте новейшую и полезную информацию о криптоактивах.
💬 Нам доверяет крупнейшая в мире криптобиржа.
👍 Получите достоверные аналитические данные от верифицированных создателей контента.
Эл. почта/номер телефона
В тренде
BinancekzWin
Просмотров: 32,414
93 обсуждают
МЕН ЧАТТА ЖАЙ ҒАНА ОТЫРЫП, 10 BNB ҰТЫП АЛДЫМ 😭🔥
Деп айтқым келеді, бірақ бұл шындық емес, Бірақ шындықтың өзі де керемет 💅
Жеңіл, танымдық, қызықты белсенділіктерге қатысып, қомақты сыйлықтар ұтып алу? Оңай, Binance KZ мүмкіндікке толы!
Чатта үнемі розыгрыштар болып тұрады, мен де жиі ұтып аламын. Бірақ ең басты жеңіс- өзіңе жайлы, адекватты комьюнити табу. Араласу барысында көп пайдалы нәрсе үйренесің, саудада көмектесетін білім аласың.
Тегін $50 алу приятно, ал сол білімнің арқасында оны көбейту ол менің жеңісім 💅
#BinancekzWin
Cabbage hater
·Лайков: 0
·Просмотров: 65
BinancePick
Просмотров: 2.7M
143,126 обсуждают
EarningsSeason
Просмотров: 5M
24,569 обсуждают