

Cas Abbé
12.8k Публикации

Cas Abbé
 Square Verified+
Отправить жалобу
Заблокировать пользователя
Binance KOL & Crypto Mentor 🙌 X : @cas_abbe

Creator Awards 2024
1 подписок(и/а)
168.5K+ подписчиков(а)
356.3K+ понравилось
1 Значки
Посты
Все
Цитирования
Видео
PINNED
·
--
Проверено
Статья
BTC & ETH BOTH BREAKING: IT’S TIME THE MARKET STOPS PRETENDINGI’m looking at both charts side by side and the message is getting harder to ignore.
$BTC and $ETH are both losing structure at the same time.
Not just random red candles. Not just healthy correction talk from people trying to sound smart on Twitter. I’m talking about a market structure that has been weakening for weeks while people kept calling every bounce the bottom
Bitcoin rejected again near the upper resistance trendline, then lost momentum fast. Ethereum did the exact same thing. Same rising structure. Same exhaustion. Same failure. That kind of synchronized weakness matters because ETH usually follows BTC, but when both start breaking down together, liquidity leaves the entire market.
Most people only look at candles.
I look at behavior
And the behavior right now feels very different from the aggressive breakout environment we had earlier in the cycle. Buyers are weaker. Every push upward is getting sold faster. The rallies are shorter. Volume isn’t convincing. That’s what distribution looks like before volatility expands.
What makes this more dangerous is that leverage is still extremely high across the market. Open interest has been sitting near cycle highs while price struggles to reclaim key levels. That’s usually not a good combination. It means too many traders are positioned before confirmation.
And honestly, this is where most retail traders get trapped.
People think breakdowns happen in one giant candle. They don’t.
First the market stops making strong highs. Then momentum weakens. Then support lines that “always hold” suddenly don’t hold anymore. After that, panic starts. The real move usually comes after denial.
Ethereum especially looks weak here.
ETH has already been underperforming Bitcoin for weeks, ETF flows are slowing, and exchange reserves have been climbing again. That means more supply sitting on exchanges waiting to move. At the same time, long positioning stayed crowded while price kept falling. That’s a brutal setup when support finally breaks.
Now here’s the important part most people miss.
A rising wedge is not magic.
Some traders treat it like a guaranteed crash signal, which is wrong. Historically, these patterns fail often and sometimes even break upward instead.
But context matters.
And the context right now is ugly:
> weakening momentum
> macro uncertainty
> unstable risk appetite
> heavy leverage
> fading ETF strength
> repeated rejection at resistance
That combination is what makes this dangerous.
I’m not saying the bull market is dead forever.
I’m saying the market is entering the phase where blind optimism becomes expensive.
There’s a huge difference.
If BTC loses major support cleanly, the conversation changes fast. Suddenly everyone who was posting moon targets starts talking about market manipulation. That’s how crypto cycles always work. Confidence disappears much faster than it was built.
I think people got too comfortable again.
Every dip was bought.
Every warning was ignored.
Every breakout call got engagement.
Markets punish comfort eventually.
For me, this is not the time to chase random altcoins because some influencer posted rocket emojis. This is the time to protect capital, stay patient, and wait for confirmation instead of gambling on hope.
Because when both BTC and ETH start breaking structure together, the market is usually telling you something before the crowd realizes it.
#BTC
BTC & ETH BOTH BREAKING: IT’S TIME THE MARKET STOPS PRETENDING
I’m looking at both charts side by side and the message is getting harder to ignore.
$BTC and $ETH are both losing structure at the same time.
Not just random red candles. Not just healthy correction talk from people trying to sound smart on Twitter. I’m talking about a market structure that has been weakening for weeks while people kept calling every bounce the bottom
Bitcoin rejected again near the upper resistance trendline, then lost momentum fast. Ethereum did the exact same thing. Same rising structure. Same exhaustion. Same failure. That kind of synchronized weakness matters because ETH usually follows BTC, but when both start breaking down together, liquidity leaves the entire market.
Most people only look at candles.
I look at behavior
And the behavior right now feels very different from the aggressive breakout environment we had earlier in the cycle. Buyers are weaker. Every push upward is getting sold faster. The rallies are shorter. Volume isn’t convincing. That’s what distribution looks like before volatility expands.
What makes this more dangerous is that leverage is still extremely high across the market. Open interest has been sitting near cycle highs while price struggles to reclaim key levels. That’s usually not a good combination. It means too many traders are positioned before confirmation.
And honestly, this is where most retail traders get trapped.
People think breakdowns happen in one giant candle. They don’t.
First the market stops making strong highs. Then momentum weakens. Then support lines that “always hold” suddenly don’t hold anymore. After that, panic starts. The real move usually comes after denial.
Ethereum especially looks weak here.
ETH has already been underperforming Bitcoin for weeks, ETF flows are slowing, and exchange reserves have been climbing again. That means more supply sitting on exchanges waiting to move. At the same time, long positioning stayed crowded while price kept falling. That’s a brutal setup when support finally breaks.
Now here’s the important part most people miss.
A rising wedge is not magic.
Some traders treat it like a guaranteed crash signal, which is wrong. Historically, these patterns fail often and sometimes even break upward instead.
But context matters.
And the context right now is ugly:
> weakening momentum
> macro uncertainty
> unstable risk appetite
> heavy leverage
> fading ETF strength
> repeated rejection at resistance
That combination is what makes this dangerous.
I’m not saying the bull market is dead forever.
I’m saying the market is entering the phase where blind optimism becomes expensive.
There’s a huge difference.
If BTC loses major support cleanly, the conversation changes fast. Suddenly everyone who was posting moon targets starts talking about market manipulation. That’s how crypto cycles always work. Confidence disappears much faster than it was built.
I think people got too comfortable again.
Every dip was bought.
Every warning was ignored.
Every breakout call got engagement.
Markets punish comfort eventually.
For me, this is not the time to chase random altcoins because some influencer posted rocket emojis. This is the time to protect capital, stay patient, and wait for confirmation instead of gambling on hope.
Because when both BTC and ETH start breaking structure together, the market is usually telling you something before the crowd realizes it.
#BTC
$BTC and $ETH are both losing structure at the same time.
Not just random red candles. Not just healthy correction talk from people trying to sound smart on Twitter. I’m talking about a market structure that has been weakening for weeks while people kept calling every bounce the bottom
Bitcoin rejected again near the upper resistance trendline, then lost momentum fast. Ethereum did the exact same thing. Same rising structure. Same exhaustion. Same failure. That kind of synchronized weakness matters because ETH usually follows BTC, but when both start breaking down together, liquidity leaves the entire market.
Most people only look at candles.
I look at behavior
And the behavior right now feels very different from the aggressive breakout environment we had earlier in the cycle. Buyers are weaker. Every push upward is getting sold faster. The rallies are shorter. Volume isn’t convincing. That’s what distribution looks like before volatility expands.
What makes this more dangerous is that leverage is still extremely high across the market. Open interest has been sitting near cycle highs while price struggles to reclaim key levels. That’s usually not a good combination. It means too many traders are positioned before confirmation.
And honestly, this is where most retail traders get trapped.
People think breakdowns happen in one giant candle. They don’t.
First the market stops making strong highs. Then momentum weakens. Then support lines that “always hold” suddenly don’t hold anymore. After that, panic starts. The real move usually comes after denial.
Ethereum especially looks weak here.
ETH has already been underperforming Bitcoin for weeks, ETF flows are slowing, and exchange reserves have been climbing again. That means more supply sitting on exchanges waiting to move. At the same time, long positioning stayed crowded while price kept falling. That’s a brutal setup when support finally breaks.
Now here’s the important part most people miss.
A rising wedge is not magic.
Some traders treat it like a guaranteed crash signal, which is wrong. Historically, these patterns fail often and sometimes even break upward instead.
But context matters.
And the context right now is ugly:
> weakening momentum
> macro uncertainty
> unstable risk appetite
> heavy leverage
> fading ETF strength
> repeated rejection at resistance
That combination is what makes this dangerous.
I’m not saying the bull market is dead forever.
I’m saying the market is entering the phase where blind optimism becomes expensive.
There’s a huge difference.
If BTC loses major support cleanly, the conversation changes fast. Suddenly everyone who was posting moon targets starts talking about market manipulation. That’s how crypto cycles always work. Confidence disappears much faster than it was built.
I think people got too comfortable again.
Every dip was bought.
Every warning was ignored.
Every breakout call got engagement.
Markets punish comfort eventually.
For me, this is not the time to chase random altcoins because some influencer posted rocket emojis. This is the time to protect capital, stay patient, and wait for confirmation instead of gambling on hope.
Because when both BTC and ETH start breaking structure together, the market is usually telling you something before the crowd realizes it.
#BTC
85
18
308
382.2k
PINNED
·
--
8 years of @Binance and it still finds ways to surprise.
Binance came through with a solid swag box... jersey, hoodie, some other goodies that actually hit.
Been around long enough to see Binance go from a startup to the world’s biggest crypto exchange:
• 280M+ users
• 100s Trillion in trading volume
• 100+ supported countries
• 1,700+ listed trading pairs
• 30M+ active weekly visits
Big shoutout to @blueshirt666 & the Binance Square crew @karin_veri, you all are building something real out here.
Respect the consistency and community focus.
Let’s keep building. #BinanceTurns8
8 years of @Binance and it still finds ways to surprise.
Binance came through with a solid swag box... jersey, hoodie, some other goodies that actually hit.
Been around long enough to see Binance go from a startup to the world’s biggest crypto exchange:
• 280M+ users
• 100s Trillion in trading volume
• 100+ supported countries
• 1,700+ listed trading pairs
• 30M+ active weekly visits
Big shoutout to @blueshirt666 & the Binance Square crew @karin_veri, you all are building something real out here.
Respect the consistency and community focus.
Let’s keep building. #BinanceTurns8
Binance came through with a solid swag box... jersey, hoodie, some other goodies that actually hit.
Been around long enough to see Binance go from a startup to the world’s biggest crypto exchange:
• 280M+ users
• 100s Trillion in trading volume
• 100+ supported countries
• 1,700+ listed trading pairs
• 30M+ active weekly visits
Big shoutout to @blueshirt666 & the Binance Square crew @karin_veri, you all are building something real out here.
Respect the consistency and community focus.
Let’s keep building. #BinanceTurns8


32
9
195
7.9k
·
--
Проверено
The next phase of on-chain trading will be about more than just leverage.
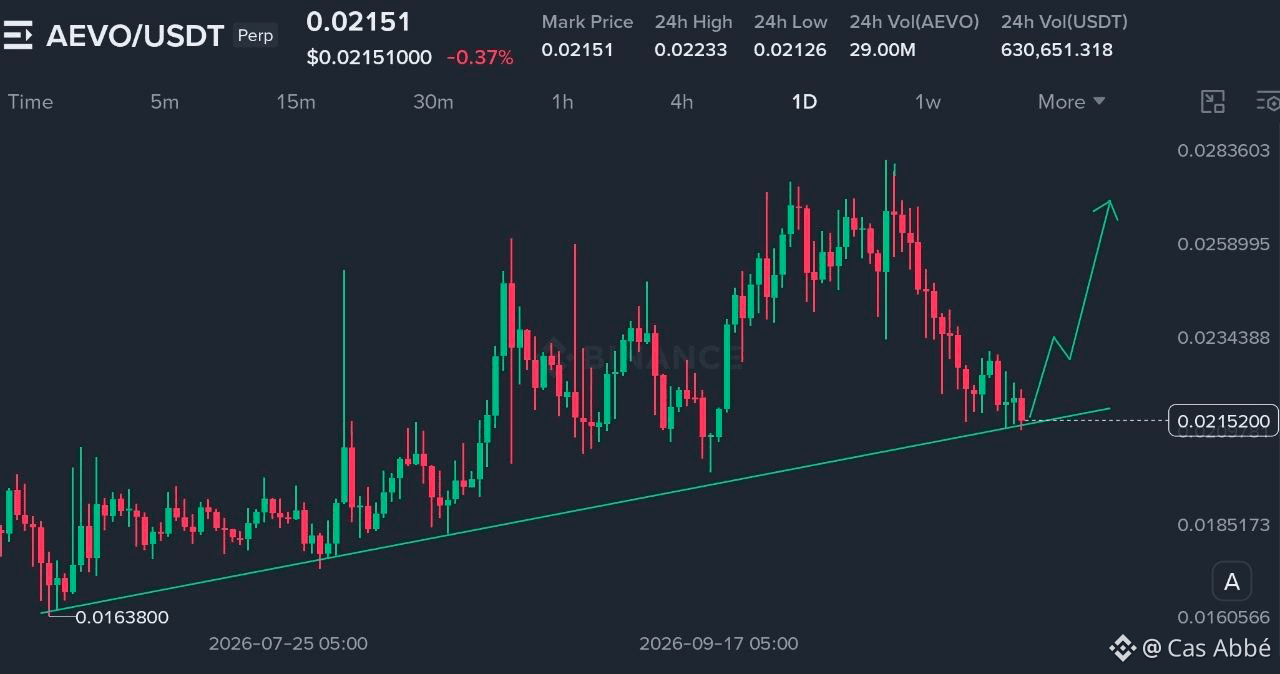
$AEVO is building a derivatives ecosystem around perpetual futures, options, and structured products giving traders more ways to manage risk and express market views.
The bigger question is whether it can turn product innovation into sustainable trading activity.
Competition from $HYPE , $GMX , and DYDX is strong, so liquidity, execution, and user retention will matter more than hype.
For AEVO, real adoption is the key metric I’m watching.
Not financial advice.
@Aevoxyz
The next phase of on-chain trading will be about more than just leverage.
$AEVO is building a derivatives ecosystem around perpetual futures, options, and structured products giving traders more ways to manage risk and express market views.
The bigger question is whether it can turn product innovation into sustainable trading activity.
Competition from $HYPE , $GMX , and DYDX is strong, so liquidity, execution, and user retention will matter more than hype.
For AEVO, real adoption is the key metric I’m watching.
Not financial advice.
@Aevo
$AEVO is building a derivatives ecosystem around perpetual futures, options, and structured products giving traders more ways to manage risk and express market views.
The bigger question is whether it can turn product innovation into sustainable trading activity.
Competition from $HYPE , $GMX , and DYDX is strong, so liquidity, execution, and user retention will matter more than hype.
For AEVO, real adoption is the key metric I’m watching.
Not financial advice.
@Aevo
27
33
5.3k
·
--
Статья
61.5% OR 58%: THE TWO NUMBERS THAT DECIDE WHERE CRYPTO MONEY GOES NEXTBitcoin dominance is the share of the total crypto market that Bitcoin accounts for, and right now, it’s sitting at a level where the next move could tell us a lot about where capital is heading.
Bitcoin dominance stood at around 60.1% on CoinMarketCap. That meant Bitcoin accounted for roughly $1.63 trillion of a $2.72 trillion crypto market. Other trackers show slightly different readings, so the exact number depends on the source. What matters to me is the zone we’re sitting in and the two levels that could decide what happens next.
WHY DOMINANCE HAS BEEN RISING
Bitcoin dominance isn’t necessarily rising because everyone is rushing to buy BTC. Bitcoin has struggled in October, but altcoins have fallen harder, pushing Bitcoin’s share of the overall market higher.
Ethereum, Solana, XRP, and Dogecoin all suffered heavier losses during the sell-off. That’s a defensive move. When uncertainty hits, capital often gravitates toward the largest and most established crypto asset instead of taking additional risks on smaller tokens.
That’s why I don’t automatically treat rising dominance as bullish for Bitcoin. Sometimes it simply means altcoins are getting hit harder.
SCENARIO ONE: A BREAK ABOVE 61.5%
If Bitcoin dominance breaks above 61.5% and holds, I’d take that as a sign that the market is favouring safety over risk.
Bitcoin could continue leading while altcoins struggle to recover. The recent performance data supports that possibility, with only around a third of large crypto assets outperforming Bitcoin over the previous 30 days.
Bitcoin also has a structural advantage. Roughly 20.1 million of its maximum supply of 21 million coins are already in circulation. Many competing tokens, meanwhile, have ongoing emissions or scheduled token unlocks that can increase available supply.
That difference matters when demand is weak. If capital isn’t flowing into the market aggressively, tokens facing additional supply pressure can struggle to outperform.
A move above 61.5% wouldn’t guarantee another altcoin sell-off, but it would make me more cautious about expecting a broad rotation into smaller assets.
SCENARIO TWO: A BREAK BELOW 58%
This is the scenario altcoin traders are waiting for.
We’ve seen dominance retreat during periods when Ethereum and other major altcoins started outperforming Bitcoin. In July and August 2025, for example, Ethereum rallied strongly and moved above $4,700 as Bitcoin dominance declined from elevated levels.
The pattern is worth watching. When ETH begins gaining against BTC, it can signal that investors are becoming more comfortable taking additional risk. If that strength spreads to other large altcoins, the market can start shifting away from Bitcoin dominance.
But I wouldn’t buy every dip in dominance.
A clean break below 58%, combined with a rising ETH/BTC ratio and improving altcoin performance, would give me a much stronger reason to believe that a genuine rotation is underway.
Without that confirmation, a falling dominance reading could be nothing more than a temporary fluctuation.
THE STABLECOIN CATCH MOST PEOPLE IGNORE
There’s another factor that can distort the picture: stablecoins.
Stablecoin supply has grown enormously over the past several years, from roughly $27 billion in early 2021 to around $311 billion in the figures cited for this analysis. Because stablecoins are included in the total crypto market capitalisation, their growth affects Bitcoin’s dominance percentage.
Think about what that means. Someone can move money from Bitcoin into USDT without buying a single altcoin. Bitcoin dominance can fall because the stablecoin market has grown relative to BTC, even though capital hasn’t rotated into riskier crypto assets.
That’s why I don’t use dominance in isolation.
The more useful signal is Bitcoin dominance falling while ETH/BTC rises and altcoins begin outperforming BTC across the board. That combination gives us stronger evidence that capital is actually moving further out along the risk curve.
WHERE ETHEREUM STANDS RIGHT NOW
Ethereum accounts for roughly 10.
6% of the crypto market in the figures cited here, while the ETH/BTC ratio remains around 19% below its 12-month high.
ETH has had periods of strength, but it hasn’t conclusively taken leadership away from Bitcoin.
For an Ethereum rally to turn into a sustained altcoin rotation, I’d want to see ETH/BTC establish a stronger trend rather than simply bounce for a few sessions. I’d also want to see Bitcoin dominance decline alongside improving breadth across the altcoin market.
If Bitcoin’s share keeps holding near 60% or pushes higher, it suggests that the broader market hasn’t yet committed to a sustained move into altcoins.
And that’s the distinction that matters. One coin pumping doesn’t make an altseason.
THE LEVELS I’M WATCHING
A daily close above 61.5% would suggest Bitcoin is maintaining its dominance and the defensive phase could continue. In that scenario, I’d be selective with altcoin entries and avoid assuming that every dip is an opportunity.
A daily close below 58%, particularly if ETH/BTC rises at the same time, would make me pay much closer attention to a potential rotation. I’d then look for stronger spot volume and broader outperformance across major altcoins before getting more aggressive.
Anything between those levels is still a range. Until the market breaks out of it, treating every small move as confirmation is just noise.
MY TAKE
For now, I don’t think the market has made its decision. The Altcoin Season Index reading cited here is 53, which points to a relatively neutral environment rather than a clear altcoin-season signal.
I’m watching 61.5% on the upside and 58% on the downside. Those levels give me a framework for assessing whether capital is staying defensive or starting to move into riskier assets.
The important part is not guessing which level breaks first. It’s knowing what confirmation looks like when it happens.
If dominance breaks lower and ETH/BTC strengthens, I’ll start looking for a genuine rotation. If dominance pushes higher, I’m not going to force altcoin trades just because I want altseason to begin.
The market doesn’t care what we want. It tells us where the money is going, and our job is to pay attention.
This is my personal market view, not financial advice. Do your own research and manage your risk.
#BTC走势分析
61.5% OR 58%: THE TWO NUMBERS THAT DECIDE WHERE CRYPTO MONEY GOES NEXT
Bitcoin dominance is the share of the total crypto market that Bitcoin accounts for, and right now, it’s sitting at a level where the next move could tell us a lot about where capital is heading.
Bitcoin dominance stood at around 60.1% on CoinMarketCap. That meant Bitcoin accounted for roughly $1.63 trillion of a $2.72 trillion crypto market. Other trackers show slightly different readings, so the exact number depends on the source. What matters to me is the zone we’re sitting in and the two levels that could decide what happens next.
WHY DOMINANCE HAS BEEN RISING
Bitcoin dominance isn’t necessarily rising because everyone is rushing to buy BTC. Bitcoin has struggled in October, but altcoins have fallen harder, pushing Bitcoin’s share of the overall market higher.
Ethereum, Solana, XRP, and Dogecoin all suffered heavier losses during the sell-off. That’s a defensive move. When uncertainty hits, capital often gravitates toward the largest and most established crypto asset instead of taking additional risks on smaller tokens.
That’s why I don’t automatically treat rising dominance as bullish for Bitcoin. Sometimes it simply means altcoins are getting hit harder.
SCENARIO ONE: A BREAK ABOVE 61.5%
If Bitcoin dominance breaks above 61.5% and holds, I’d take that as a sign that the market is favouring safety over risk.
Bitcoin could continue leading while altcoins struggle to recover. The recent performance data supports that possibility, with only around a third of large crypto assets outperforming Bitcoin over the previous 30 days.
Bitcoin also has a structural advantage. Roughly 20.1 million of its maximum supply of 21 million coins are already in circulation. Many competing tokens, meanwhile, have ongoing emissions or scheduled token unlocks that can increase available supply.
That difference matters when demand is weak. If capital isn’t flowing into the market aggressively, tokens facing additional supply pressure can struggle to outperform.
A move above 61.5% wouldn’t guarantee another altcoin sell-off, but it would make me more cautious about expecting a broad rotation into smaller assets.
SCENARIO TWO: A BREAK BELOW 58%
This is the scenario altcoin traders are waiting for.
We’ve seen dominance retreat during periods when Ethereum and other major altcoins started outperforming Bitcoin. In July and August 2025, for example, Ethereum rallied strongly and moved above $4,700 as Bitcoin dominance declined from elevated levels.
The pattern is worth watching. When ETH begins gaining against BTC, it can signal that investors are becoming more comfortable taking additional risk. If that strength spreads to other large altcoins, the market can start shifting away from Bitcoin dominance.
But I wouldn’t buy every dip in dominance.
A clean break below 58%, combined with a rising ETH/BTC ratio and improving altcoin performance, would give me a much stronger reason to believe that a genuine rotation is underway.
Without that confirmation, a falling dominance reading could be nothing more than a temporary fluctuation.
THE STABLECOIN CATCH MOST PEOPLE IGNORE
There’s another factor that can distort the picture: stablecoins.
Stablecoin supply has grown enormously over the past several years, from roughly $27 billion in early 2021 to around $311 billion in the figures cited for this analysis. Because stablecoins are included in the total crypto market capitalisation, their growth affects Bitcoin’s dominance percentage.
Think about what that means. Someone can move money from Bitcoin into USDT without buying a single altcoin. Bitcoin dominance can fall because the stablecoin market has grown relative to BTC, even though capital hasn’t rotated into riskier crypto assets.
That’s why I don’t use dominance in isolation.
The more useful signal is Bitcoin dominance falling while ETH/BTC rises and altcoins begin outperforming BTC across the board. That combination gives us stronger evidence that capital is actually moving further out along the risk curve.
WHERE ETHEREUM STANDS RIGHT NOW
Ethereum accounts for roughly 10.
6% of the crypto market in the figures cited here, while the ETH/BTC ratio remains around 19% below its 12-month high.
ETH has had periods of strength, but it hasn’t conclusively taken leadership away from Bitcoin.
For an Ethereum rally to turn into a sustained altcoin rotation, I’d want to see ETH/BTC establish a stronger trend rather than simply bounce for a few sessions. I’d also want to see Bitcoin dominance decline alongside improving breadth across the altcoin market.
If Bitcoin’s share keeps holding near 60% or pushes higher, it suggests that the broader market hasn’t yet committed to a sustained move into altcoins.
And that’s the distinction that matters. One coin pumping doesn’t make an altseason.
THE LEVELS I’M WATCHING
A daily close above 61.5% would suggest Bitcoin is maintaining its dominance and the defensive phase could continue. In that scenario, I’d be selective with altcoin entries and avoid assuming that every dip is an opportunity.
A daily close below 58%, particularly if ETH/BTC rises at the same time, would make me pay much closer attention to a potential rotation. I’d then look for stronger spot volume and broader outperformance across major altcoins before getting more aggressive.
Anything between those levels is still a range. Until the market breaks out of it, treating every small move as confirmation is just noise.
MY TAKE
For now, I don’t think the market has made its decision. The Altcoin Season Index reading cited here is 53, which points to a relatively neutral environment rather than a clear altcoin-season signal.
I’m watching 61.5% on the upside and 58% on the downside. Those levels give me a framework for assessing whether capital is staying defensive or starting to move into riskier assets.
The important part is not guessing which level breaks first. It’s knowing what confirmation looks like when it happens.
If dominance breaks lower and ETH/BTC strengthens, I’ll start looking for a genuine rotation. If dominance pushes higher, I’m not going to force altcoin trades just because I want altseason to begin.
The market doesn’t care what we want. It tells us where the money is going, and our job is to pay attention.
This is my personal market view, not financial advice. Do your own research and manage your risk.
#BTC走势分析
Bitcoin dominance stood at around 60.1% on CoinMarketCap. That meant Bitcoin accounted for roughly $1.63 trillion of a $2.72 trillion crypto market. Other trackers show slightly different readings, so the exact number depends on the source. What matters to me is the zone we’re sitting in and the two levels that could decide what happens next.
WHY DOMINANCE HAS BEEN RISING
Bitcoin dominance isn’t necessarily rising because everyone is rushing to buy BTC. Bitcoin has struggled in October, but altcoins have fallen harder, pushing Bitcoin’s share of the overall market higher.
Ethereum, Solana, XRP, and Dogecoin all suffered heavier losses during the sell-off. That’s a defensive move. When uncertainty hits, capital often gravitates toward the largest and most established crypto asset instead of taking additional risks on smaller tokens.
That’s why I don’t automatically treat rising dominance as bullish for Bitcoin. Sometimes it simply means altcoins are getting hit harder.
SCENARIO ONE: A BREAK ABOVE 61.5%
If Bitcoin dominance breaks above 61.5% and holds, I’d take that as a sign that the market is favouring safety over risk.
Bitcoin could continue leading while altcoins struggle to recover. The recent performance data supports that possibility, with only around a third of large crypto assets outperforming Bitcoin over the previous 30 days.
Bitcoin also has a structural advantage. Roughly 20.1 million of its maximum supply of 21 million coins are already in circulation. Many competing tokens, meanwhile, have ongoing emissions or scheduled token unlocks that can increase available supply.
That difference matters when demand is weak. If capital isn’t flowing into the market aggressively, tokens facing additional supply pressure can struggle to outperform.
A move above 61.5% wouldn’t guarantee another altcoin sell-off, but it would make me more cautious about expecting a broad rotation into smaller assets.
SCENARIO TWO: A BREAK BELOW 58%
This is the scenario altcoin traders are waiting for.
We’ve seen dominance retreat during periods when Ethereum and other major altcoins started outperforming Bitcoin. In July and August 2025, for example, Ethereum rallied strongly and moved above $4,700 as Bitcoin dominance declined from elevated levels.
The pattern is worth watching. When ETH begins gaining against BTC, it can signal that investors are becoming more comfortable taking additional risk. If that strength spreads to other large altcoins, the market can start shifting away from Bitcoin dominance.
But I wouldn’t buy every dip in dominance.
A clean break below 58%, combined with a rising ETH/BTC ratio and improving altcoin performance, would give me a much stronger reason to believe that a genuine rotation is underway.
Without that confirmation, a falling dominance reading could be nothing more than a temporary fluctuation.
THE STABLECOIN CATCH MOST PEOPLE IGNORE
There’s another factor that can distort the picture: stablecoins.
Stablecoin supply has grown enormously over the past several years, from roughly $27 billion in early 2021 to around $311 billion in the figures cited for this analysis. Because stablecoins are included in the total crypto market capitalisation, their growth affects Bitcoin’s dominance percentage.
Think about what that means. Someone can move money from Bitcoin into USDT without buying a single altcoin. Bitcoin dominance can fall because the stablecoin market has grown relative to BTC, even though capital hasn’t rotated into riskier crypto assets.
That’s why I don’t use dominance in isolation.
The more useful signal is Bitcoin dominance falling while ETH/BTC rises and altcoins begin outperforming BTC across the board. That combination gives us stronger evidence that capital is actually moving further out along the risk curve.
WHERE ETHEREUM STANDS RIGHT NOW
Ethereum accounts for roughly 10.
6% of the crypto market in the figures cited here, while the ETH/BTC ratio remains around 19% below its 12-month high.
ETH has had periods of strength, but it hasn’t conclusively taken leadership away from Bitcoin.
For an Ethereum rally to turn into a sustained altcoin rotation, I’d want to see ETH/BTC establish a stronger trend rather than simply bounce for a few sessions. I’d also want to see Bitcoin dominance decline alongside improving breadth across the altcoin market.
If Bitcoin’s share keeps holding near 60% or pushes higher, it suggests that the broader market hasn’t yet committed to a sustained move into altcoins.
And that’s the distinction that matters. One coin pumping doesn’t make an altseason.
THE LEVELS I’M WATCHING
A daily close above 61.5% would suggest Bitcoin is maintaining its dominance and the defensive phase could continue. In that scenario, I’d be selective with altcoin entries and avoid assuming that every dip is an opportunity.
A daily close below 58%, particularly if ETH/BTC rises at the same time, would make me pay much closer attention to a potential rotation. I’d then look for stronger spot volume and broader outperformance across major altcoins before getting more aggressive.
Anything between those levels is still a range. Until the market breaks out of it, treating every small move as confirmation is just noise.
MY TAKE
For now, I don’t think the market has made its decision. The Altcoin Season Index reading cited here is 53, which points to a relatively neutral environment rather than a clear altcoin-season signal.
I’m watching 61.5% on the upside and 58% on the downside. Those levels give me a framework for assessing whether capital is staying defensive or starting to move into riskier assets.
The important part is not guessing which level breaks first. It’s knowing what confirmation looks like when it happens.
If dominance breaks lower and ETH/BTC strengthens, I’ll start looking for a genuine rotation. If dominance pushes higher, I’m not going to force altcoin trades just because I want altseason to begin.
The market doesn’t care what we want. It tells us where the money is going, and our job is to pay attention.
This is my personal market view, not financial advice. Do your own research and manage your risk.
#BTC走势分析
30
43
5.2k
·
--
Статья
ALTS GOT REJECTED HERE’S HOW I’M PLAYING ITI’ll be honest. I wanted the breakout.
The alts market cap ran up to its resistance, and I watched it closely. Then it got rejected. Right when it happened, oil pushed above $100.
I don’t think that’s luck. Oil matters a lot right now. Brent was around $110 a barrel this week, about $49 higher than a year ago. On Thursday, crude climbed after a drone attack on Saudi Aramco’s Shaybah field killed two people. The war in the Middle East is still pushing prices up.
Why does this hurt alts? Expensive oil means higher inflation. Higher inflation means the Fed can’t cut rates easily. When money stays tight, people sell risky assets first, and alts are the riskiest part of crypto.
Bitcoin faces the same pressure. On October 16, BTC traded near $82,000 and hit resistance at that level. If BTC can’t break out, alts have little chance of leading.
THE LEVELS I’M WATCHING
I’m watching three support levels on the alts market cap: $214B, $200B, and $188B.
If $214B breaks, I expect a move toward $200B. If $200B goes, $188B is next. I’m not predicting a crash. I’m just marking where buyers might step in.
WHY THE NEXT TWO WEEKS MATTER
The US midterms are on November 3, when all 435 House seats and about one-third of the Senate are up for election. That’s less than two weeks away. Elections bring uncertainty, and uncertainty brings volatility.
The past gives some hints. Binance Research found the S&P 500 averaged a 19% gain in the year after midterms. Bitcoin averaged a 54% rise in the three post-midterm years on record. That’s a small sample, so I don’t treat it as a promise.
The path there can also be rough. Bitcoin dropped sharply before the midterms in 2014, 2018 and 2022, then recovered later. The good news may come after the pain, not before it.
WHAT I’M DOING
I’m keeping it simple.
1. No leverage. In a market this jumpy, a 5% swing can wipe out a leveraged position. I’d rather survive the noise.
2. DCA into quality alts. I’m buying small amounts over time instead of one big entry. If prices drop to those supports, I can buy cheaper. If they bounce, I still own some.
3. Quality over hype. I only buy projects with real users, real revenue, and a team that ships.
I can’t control oil. I can’t control the election. I can control my risk.
This is my personal view, not financial advice. Do your own research.
#BTC
ALTS GOT REJECTED HERE’S HOW I’M PLAYING IT
I’ll be honest. I wanted the breakout.
The alts market cap ran up to its resistance, and I watched it closely. Then it got rejected. Right when it happened, oil pushed above $100.
I don’t think that’s luck. Oil matters a lot right now. Brent was around $110 a barrel this week, about $49 higher than a year ago. On Thursday, crude climbed after a drone attack on Saudi Aramco’s Shaybah field killed two people. The war in the Middle East is still pushing prices up.
Why does this hurt alts? Expensive oil means higher inflation. Higher inflation means the Fed can’t cut rates easily. When money stays tight, people sell risky assets first, and alts are the riskiest part of crypto.
Bitcoin faces the same pressure. On October 16, BTC traded near $82,000 and hit resistance at that level. If BTC can’t break out, alts have little chance of leading.
THE LEVELS I’M WATCHING
I’m watching three support levels on the alts market cap: $214B, $200B, and $188B.
If $214B breaks, I expect a move toward $200B. If $200B goes, $188B is next. I’m not predicting a crash. I’m just marking where buyers might step in.
WHY THE NEXT TWO WEEKS MATTER
The US midterms are on November 3, when all 435 House seats and about one-third of the Senate are up for election. That’s less than two weeks away. Elections bring uncertainty, and uncertainty brings volatility.
The past gives some hints. Binance Research found the S&P 500 averaged a 19% gain in the year after midterms. Bitcoin averaged a 54% rise in the three post-midterm years on record. That’s a small sample, so I don’t treat it as a promise.
The path there can also be rough. Bitcoin dropped sharply before the midterms in 2014, 2018 and 2022, then recovered later. The good news may come after the pain, not before it.
WHAT I’M DOING
I’m keeping it simple.
1. No leverage. In a market this jumpy, a 5% swing can wipe out a leveraged position. I’d rather survive the noise.
2. DCA into quality alts. I’m buying small amounts over time instead of one big entry. If prices drop to those supports, I can buy cheaper. If they bounce, I still own some.
3. Quality over hype. I only buy projects with real users, real revenue, and a team that ships.
I can’t control oil. I can’t control the election. I can control my risk.
This is my personal view, not financial advice. Do your own research.
#BTC
The alts market cap ran up to its resistance, and I watched it closely. Then it got rejected. Right when it happened, oil pushed above $100.
I don’t think that’s luck. Oil matters a lot right now. Brent was around $110 a barrel this week, about $49 higher than a year ago. On Thursday, crude climbed after a drone attack on Saudi Aramco’s Shaybah field killed two people. The war in the Middle East is still pushing prices up.
Why does this hurt alts? Expensive oil means higher inflation. Higher inflation means the Fed can’t cut rates easily. When money stays tight, people sell risky assets first, and alts are the riskiest part of crypto.
Bitcoin faces the same pressure. On October 16, BTC traded near $82,000 and hit resistance at that level. If BTC can’t break out, alts have little chance of leading.
THE LEVELS I’M WATCHING
I’m watching three support levels on the alts market cap: $214B, $200B, and $188B.
If $214B breaks, I expect a move toward $200B. If $200B goes, $188B is next. I’m not predicting a crash. I’m just marking where buyers might step in.
WHY THE NEXT TWO WEEKS MATTER
The US midterms are on November 3, when all 435 House seats and about one-third of the Senate are up for election. That’s less than two weeks away. Elections bring uncertainty, and uncertainty brings volatility.
The past gives some hints. Binance Research found the S&P 500 averaged a 19% gain in the year after midterms. Bitcoin averaged a 54% rise in the three post-midterm years on record. That’s a small sample, so I don’t treat it as a promise.
The path there can also be rough. Bitcoin dropped sharply before the midterms in 2014, 2018 and 2022, then recovered later. The good news may come after the pain, not before it.
WHAT I’M DOING
I’m keeping it simple.
1. No leverage. In a market this jumpy, a 5% swing can wipe out a leveraged position. I’d rather survive the noise.
2. DCA into quality alts. I’m buying small amounts over time instead of one big entry. If prices drop to those supports, I can buy cheaper. If they bounce, I still own some.
3. Quality over hype. I only buy projects with real users, real revenue, and a team that ships.
I can’t control oil. I can’t control the election. I can control my risk.
This is my personal view, not financial advice. Do your own research.
#BTC
39
3
50
6.6k
·
--
Проверено
Most blockchains are designed to make data transparent. But real world businesses can’t put every piece of sensitive information on a public ledger.
That’s the problem $NIGHT is aiming to help solve.
Midnight uses zero knowledge proofs and selective disclosure to let applications verify information without exposing the underlying private data.
Think financial services that verify eligibility without revealing full account details, or businesses that prove compliance without publishing confidential records.
The interesting part is making privacy programmable while keeping transactions verifiable.
For Midnight, adoption will depend on whether developers can turn this technology into applications people actually need.
Blockchain adoption needs transparency where it matters and privacy where it counts.
Keeping $NIGHT on my radar.
Not financial advice.
Based on Midnight’s official documentation.
Most blockchains are designed to make data transparent. But real world businesses can’t put every piece of sensitive information on a public ledger.
That’s the problem $NIGHT is aiming to help solve.
Midnight uses zero knowledge proofs and selective disclosure to let applications verify information without exposing the underlying private data.
Think financial services that verify eligibility without revealing full account details, or businesses that prove compliance without publishing confidential records.
The interesting part is making privacy programmable while keeping transactions verifiable.
For Midnight, adoption will depend on whether developers can turn this technology into applications people actually need.
Blockchain adoption needs transparency where it matters and privacy where it counts.
Keeping $NIGHT on my radar.
Not financial advice.
Based on Midnight’s official documentation.
That’s the problem $NIGHT is aiming to help solve.
Midnight uses zero knowledge proofs and selective disclosure to let applications verify information without exposing the underlying private data.
Think financial services that verify eligibility without revealing full account details, or businesses that prove compliance without publishing confidential records.
The interesting part is making privacy programmable while keeping transactions verifiable.
For Midnight, adoption will depend on whether developers can turn this technology into applications people actually need.
Blockchain adoption needs transparency where it matters and privacy where it counts.
Keeping $NIGHT on my radar.
Not financial advice.
Based on Midnight’s official documentation.

46
67
8.6k
·
--

Статья
EVERYONE SAYS THE GOLDEN CROSS IS COMING. IT ALREADY HAPPENEDMy timeline is full of golden cross incoming, huge rally ahead posts. So I opened the chart myself.
Bitcoin printed its golden cross on September 8,
at $78,449. That’s over a month ago. Anyone calling it soon is reading an old chart.
The signal is simple. It happens when the 50-day average price moves above the 200-day average. That means price has already been rising for a while. It confirms a move that’s underway. It doesn’t call the start of one.
Since then, Bitcoin has gone up, but not in a huge way. It keeps stalling below $87,350, the late-September high that has capped every push. Support sits around $83,000 to $84,000. That’s a slow grind, not a rocket.
The historically massive rallies line is also only half true. Bitcoin has had 12 golden crosses, and fake rallies have shown up three times as often as multi-year ones. One study that tested every cross since 2012 found a golden cross a year out did about as well as any random day. Some crosses led to big runs. Many didn’t.
So I’m not trading the cross itself. Here’s what I’m watching:
1- A daily close above $87,350. That would end the stalemate, and it matters more to me than any average line.
2- The 3-day chart. It’s close to its own golden cross, which has averaged about 34% gains. That’s only three past examples, so I treat it as a hint, not proof.
3- Strategy (MSTR). Its own golden cross could land any day, weeks after Bitcoin’s. If the stock follows Bitcoin, that shows buyers are still around.
My rule is to use the golden cross as a signal that the trend is okay, never as a reason to buy. The people who call it a guaranteed rally are usually the ones selling something.
Not financial advice. Do your own research.
#BTC走势分析
EVERYONE SAYS THE GOLDEN CROSS IS COMING. IT ALREADY HAPPENED
My timeline is full of golden cross incoming, huge rally ahead posts. So I opened the chart myself.
Bitcoin printed its golden cross on September 8,
at $78,449. That’s over a month ago. Anyone calling it soon is reading an old chart.
The signal is simple. It happens when the 50-day average price moves above the 200-day average. That means price has already been rising for a while. It confirms a move that’s underway. It doesn’t call the start of one.
Since then, Bitcoin has gone up, but not in a huge way. It keeps stalling below $87,350, the late-September high that has capped every push. Support sits around $83,000 to $84,000. That’s a slow grind, not a rocket.
The historically massive rallies line is also only half true. Bitcoin has had 12 golden crosses, and fake rallies have shown up three times as often as multi-year ones. One study that tested every cross since 2012 found a golden cross a year out did about as well as any random day. Some crosses led to big runs. Many didn’t.
So I’m not trading the cross itself. Here’s what I’m watching:
1- A daily close above $87,350. That would end the stalemate, and it matters more to me than any average line.
2- The 3-day chart. It’s close to its own golden cross, which has averaged about 34% gains. That’s only three past examples, so I treat it as a hint, not proof.
3- Strategy (MSTR). Its own golden cross could land any day, weeks after Bitcoin’s. If the stock follows Bitcoin, that shows buyers are still around.
My rule is to use the golden cross as a signal that the trend is okay, never as a reason to buy. The people who call it a guaranteed rally are usually the ones selling something.
Not financial advice. Do your own research.
#BTC走势分析
Bitcoin printed its golden cross on September 8,
at $78,449. That’s over a month ago. Anyone calling it soon is reading an old chart.
The signal is simple. It happens when the 50-day average price moves above the 200-day average. That means price has already been rising for a while. It confirms a move that’s underway. It doesn’t call the start of one.
Since then, Bitcoin has gone up, but not in a huge way. It keeps stalling below $87,350, the late-September high that has capped every push. Support sits around $83,000 to $84,000. That’s a slow grind, not a rocket.
The historically massive rallies line is also only half true. Bitcoin has had 12 golden crosses, and fake rallies have shown up three times as often as multi-year ones. One study that tested every cross since 2012 found a golden cross a year out did about as well as any random day. Some crosses led to big runs. Many didn’t.
So I’m not trading the cross itself. Here’s what I’m watching:
1- A daily close above $87,350. That would end the stalemate, and it matters more to me than any average line.
2- The 3-day chart. It’s close to its own golden cross, which has averaged about 34% gains. That’s only three past examples, so I treat it as a hint, not proof.
3- Strategy (MSTR). Its own golden cross could land any day, weeks after Bitcoin’s. If the stock follows Bitcoin, that shows buyers are still around.
My rule is to use the golden cross as a signal that the trend is okay, never as a reason to buy. The people who call it a guaranteed rally are usually the ones selling something.
Not financial advice. Do your own research.
#BTC走势分析
41
53
10.1k
·
--
Статья
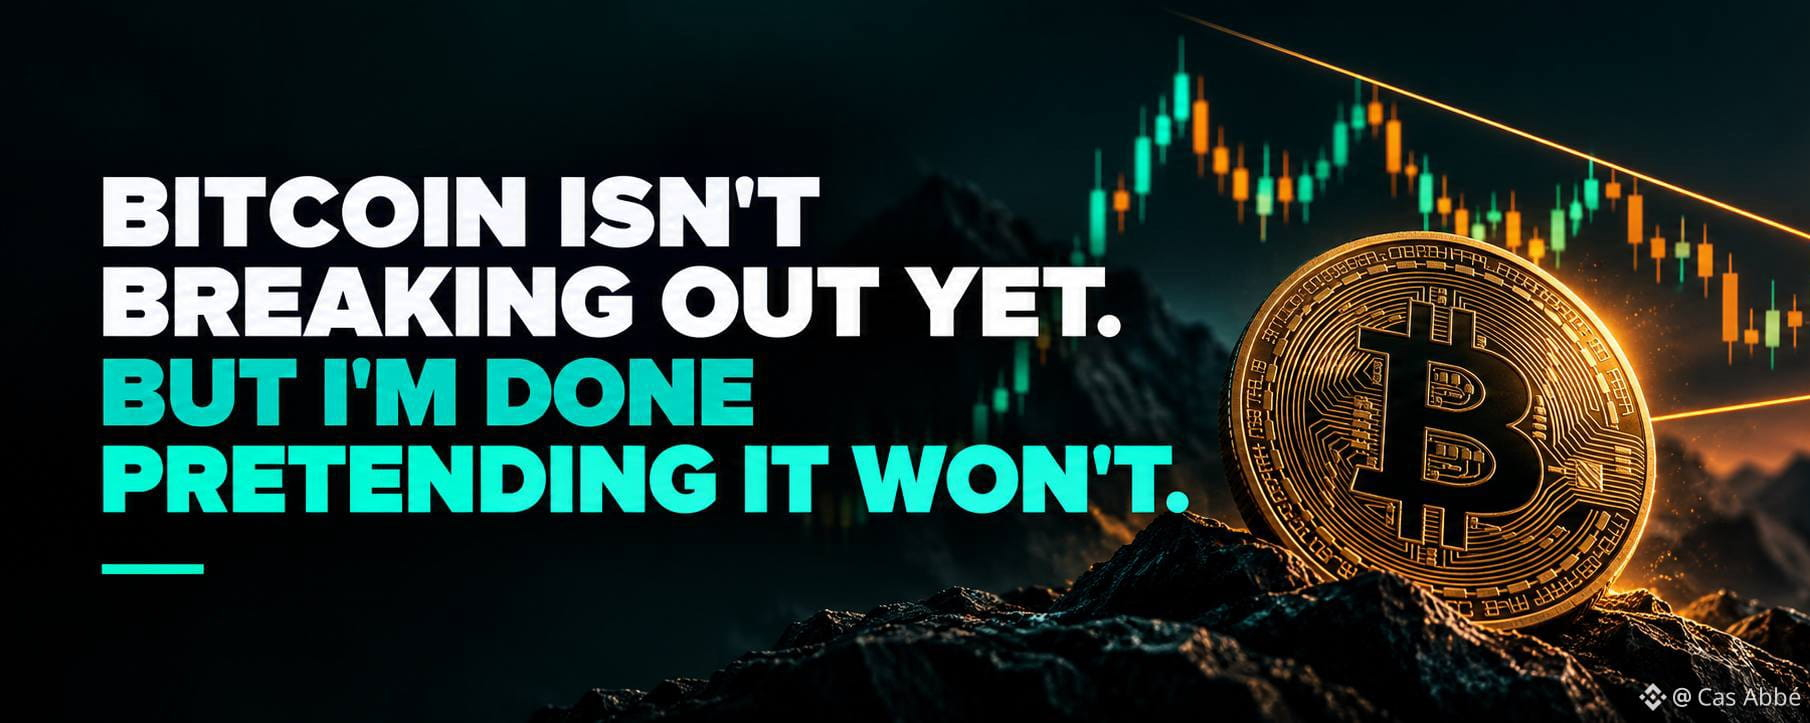
BITCOIN ISN’T BREAKING OUT YET. BUT I’M DONE PRETENDING IT WON’T.I’ll say it simply: I think Bitcoin is setting up for another leg up, and I think most people are too scared of being wrong again to see it.
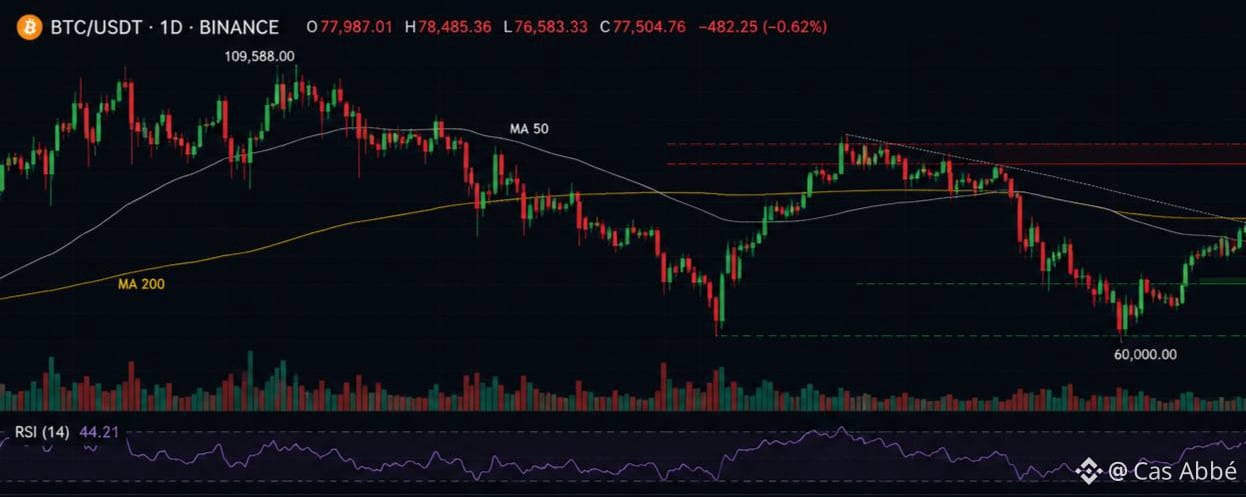
Look at how this market has behaved for the past two months. We ripped higher, then bled sideways in a tightening falling wedge. That’s the same structure we saw earlier this autumn. Back then, price squeezed lower, shook out the weak hands, and then launched. Same pattern, same psychology, and I’d bet the same ending. Daily candles are now pushing back above the wedge’s upper trendline, and I’m not going to act like that’s meaningless.
Why I’m leaning bullish
The wedge tells the story. Lower highs show sellers are losing conviction, and the support holding around the high $70Ks to $80K zone shows buyers aren’t going anywhere. When selling pressure shrinks and price still won’t break down, that isn’t weakness. It’s absorption.
What the bears are missing
Everyone’s waiting for confirmation. They want a perfect candle, a perfect retest, and a perfect headline. By the time all of that lines up, the move is already 8% gone. Markets don’t reward comfort. They reward people who position before the narrative catches up.
I’m also tired of the this is a bull trap reflex. Sometimes a breakout is just a breakout. Calling every green candle a trap is its own kind of lazy analysis.
What I’m watching
Everything hinges on a clean daily close above the wedge and a hold on any retest. If we reclaim the mid-$80Ks, I expect a fast run back toward the recent highs, because there’s very little resistance between here and there. If price gets rejected and loses the wedge support, I’m wrong, and I’ll say so publicly. That’s the deal.
The bigger picture
This isn’t just about one chart. Institutional rails keep getting built, and the lines between TradFi and crypto keep blurring. That kind of structural demand doesn’t vanish because of a few red candles in October. Patience in this market has been rewarded far more often than panic.
So no, I won’t tell you this is a guaranteed moonshot. But I will tell you where I stand: I’d rather be early and manage risk than late and write a post-mortem about the move I saw coming.
Not financial advice. Do your own research and size your risk like an adult.
#BTC #BTC走势分析
BITCOIN ISN’T BREAKING OUT YET. BUT I’M DONE PRETENDING IT WON’T.
I’ll say it simply: I think Bitcoin is setting up for another leg up, and I think most people are too scared of being wrong again to see it.
Look at how this market has behaved for the past two months. We ripped higher, then bled sideways in a tightening falling wedge. That’s the same structure we saw earlier this autumn. Back then, price squeezed lower, shook out the weak hands, and then launched. Same pattern, same psychology, and I’d bet the same ending. Daily candles are now pushing back above the wedge’s upper trendline, and I’m not going to act like that’s meaningless.
Why I’m leaning bullish
The wedge tells the story. Lower highs show sellers are losing conviction, and the support holding around the high $70Ks to $80K zone shows buyers aren’t going anywhere. When selling pressure shrinks and price still won’t break down, that isn’t weakness. It’s absorption.
What the bears are missing
Everyone’s waiting for confirmation. They want a perfect candle, a perfect retest, and a perfect headline. By the time all of that lines up, the move is already 8% gone. Markets don’t reward comfort. They reward people who position before the narrative catches up.
I’m also tired of the this is a bull trap reflex. Sometimes a breakout is just a breakout. Calling every green candle a trap is its own kind of lazy analysis.
What I’m watching
Everything hinges on a clean daily close above the wedge and a hold on any retest. If we reclaim the mid-$80Ks, I expect a fast run back toward the recent highs, because there’s very little resistance between here and there. If price gets rejected and loses the wedge support, I’m wrong, and I’ll say so publicly. That’s the deal.
The bigger picture
This isn’t just about one chart. Institutional rails keep getting built, and the lines between TradFi and crypto keep blurring. That kind of structural demand doesn’t vanish because of a few red candles in October. Patience in this market has been rewarded far more often than panic.
So no, I won’t tell you this is a guaranteed moonshot. But I will tell you where I stand: I’d rather be early and manage risk than late and write a post-mortem about the move I saw coming.
Not financial advice. Do your own research and size your risk like an adult.
#BTC #BTC走势分析
Look at how this market has behaved for the past two months. We ripped higher, then bled sideways in a tightening falling wedge. That’s the same structure we saw earlier this autumn. Back then, price squeezed lower, shook out the weak hands, and then launched. Same pattern, same psychology, and I’d bet the same ending. Daily candles are now pushing back above the wedge’s upper trendline, and I’m not going to act like that’s meaningless.
Why I’m leaning bullish
The wedge tells the story. Lower highs show sellers are losing conviction, and the support holding around the high $70Ks to $80K zone shows buyers aren’t going anywhere. When selling pressure shrinks and price still won’t break down, that isn’t weakness. It’s absorption.
What the bears are missing
Everyone’s waiting for confirmation. They want a perfect candle, a perfect retest, and a perfect headline. By the time all of that lines up, the move is already 8% gone. Markets don’t reward comfort. They reward people who position before the narrative catches up.
I’m also tired of the this is a bull trap reflex. Sometimes a breakout is just a breakout. Calling every green candle a trap is its own kind of lazy analysis.
What I’m watching
Everything hinges on a clean daily close above the wedge and a hold on any retest. If we reclaim the mid-$80Ks, I expect a fast run back toward the recent highs, because there’s very little resistance between here and there. If price gets rejected and loses the wedge support, I’m wrong, and I’ll say so publicly. That’s the deal.
The bigger picture
This isn’t just about one chart. Institutional rails keep getting built, and the lines between TradFi and crypto keep blurring. That kind of structural demand doesn’t vanish because of a few red candles in October. Patience in this market has been rewarded far more often than panic.
So no, I won’t tell you this is a guaranteed moonshot. But I will tell you where I stand: I’d rather be early and manage risk than late and write a post-mortem about the move I saw coming.
Not financial advice. Do your own research and size your risk like an adult.
#BTC #BTC走势分析
40
1
67
12.1k
·
--
A good prediction market trader doesn’t just focus on being right. They also think about risk.
That’s one reason @polymarket is worth exploring.
Before entering a position, it helps to look beyond the headline: check the spread, understand the market’s liquidity, read the resolution criteria, and consider how much uncertainty remains.
A strong opinion doesn’t automatically make a good trade. The price you pay and the risks you take matter just as much.
That’s what makes prediction markets interesting — they combine research, probability and decision-making in one place.
Being right is one thing. Making a well-informed decision is another.
#Polymarket #btc
A good prediction market trader doesn’t just focus on being right. They also think about risk.
That’s one reason @Polymarket is worth exploring.
Before entering a position, it helps to look beyond the headline: check the spread, understand the market’s liquidity, read the resolution criteria, and consider how much uncertainty remains.
A strong opinion doesn’t automatically make a good trade. The price you pay and the risks you take matter just as much.
That’s what makes prediction markets interesting — they combine research, probability and decision-making in one place.
Being right is one thing. Making a well-informed decision is another.
#Polymarket #btc
That’s one reason @Polymarket is worth exploring.
Before entering a position, it helps to look beyond the headline: check the spread, understand the market’s liquidity, read the resolution criteria, and consider how much uncertainty remains.
A strong opinion doesn’t automatically make a good trade. The price you pay and the risks you take matter just as much.
That’s what makes prediction markets interesting — they combine research, probability and decision-making in one place.
Being right is one thing. Making a well-informed decision is another.
#Polymarket #btc

41
1
72
8.3k
·
--
Статья
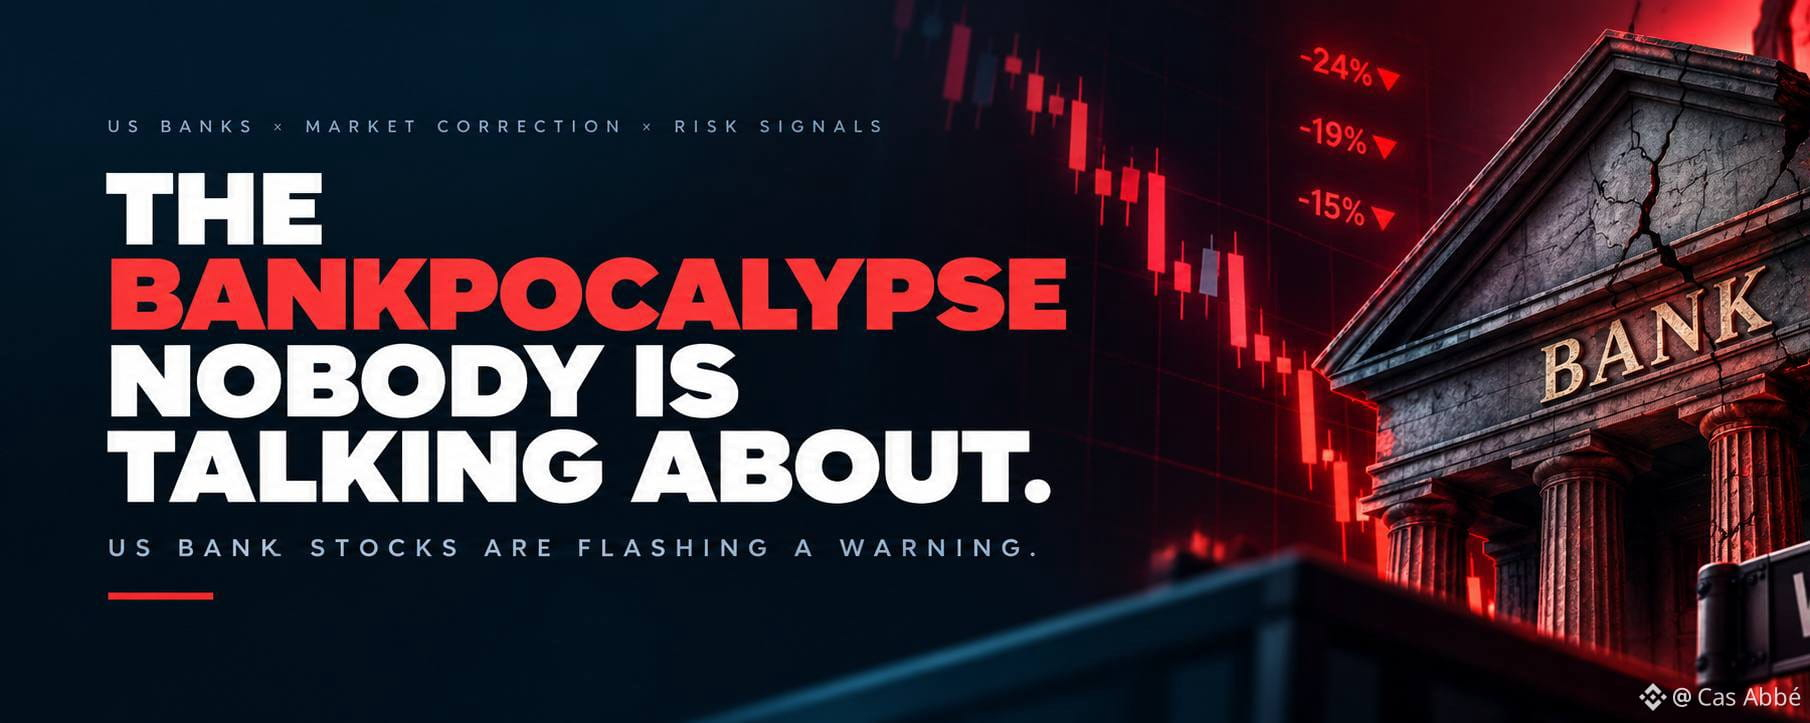
THE BANKPOCALYPSE NOBODY IS TALKING ABOUT: US BANK STOCKS ARE FLASHING A WARNINGEveryone is watching Bitcoin, AI stocks, and the next big market rally. But I think there is another part of the financial market that deserves serious attention right now: American banks are struggling to convince investors that everything is fine.
And the numbers are getting difficult to ignore.
Goldman Sachs and Capital One are reportedly down around 24% to 25% from their highs, while Bank of America and Morgan Stanley have suffered declines approaching 19%.
These are substantial moves for some of the biggest names in American finance.
What makes this more interesting is that the weakness is not limited to one bank. Different institutions have different business models, yet pressure is spreading across the sector. That suggests investors are looking beyond individual earnings reports and questioning the environment these companies are operating in.
And here is the part I find particularly interesting: the broader stock market has been holding up far better than the banks.
That divergence matters. When investors lose confidence in one sector while the broader market remains relatively strong, I want to understand what the market might be pricing in before jumping to conclusions.
WHY ARE BANKS UNDER PRESSURE?
In my view, three major forces deserve attention.
First, interest rates and bond yields.
The Federal Reserve raised interest rates on September 16, its first increase in three years, and persistent inflation has kept pressure on the policy outlook. Higher rates can help banks earn more on certain loans, but they can also increase deposit and funding costs, put pressure on bond portfolios, and make borrowing more expensive for customers. The outcome depends on how quickly each bank’s income and costs adjust.
Second, Wall Street’s dealmaking business is losing some momentum.
Investment banking depends heavily on companies issuing shares, borrowing money, and completing mergers and acquisitions. When borrowing costs rise and uncertainty increases, companies may delay those decisions. Reuters reported that weaker dealmaking weighed on investment banking during the third quarter, while rising bond yields and uncertainty around AI added to investor concerns.
Third, the market is questioning whether the AI boom can keep delivering.
AI has created enormous opportunities for technology companies, but banks are exposed to the other side of that story, too. They finance businesses, provide capital-markets services, and depend on customers maintaining healthy financial positions. If AI-related investment becomes more expensive to finance or expected returns disappoint, parts of the financial system could feel the impact.
There is another longer-term concern: AI agents could eventually change how customers manage money and interact with financial institutions. That is not an immediate threat to every bank, but investors are beginning to consider how technology could reshape traditional banking economics.
BUT IS THIS REALLY ANOTHER 2008?
This is where I would be careful.
A falling bank stock price does not automatically mean a bank is insolvent, and a correction in banking shares is not the same thing as a financial crisis.
In fact, recent third-quarter results offer a more complicated picture. Reuters reported on October 16 that several regional banks, including PNC Financial and US Bancorp, continued to see strong loan demand. PNC reported 14.2% loan growth, suggesting that parts of the banking system are still experiencing meaningful business activity.
That is an important counterpoint.
The current sell-off may reflect concerns about profitability, funding costs, bond yields, and future economic conditions rather than evidence of widespread bank failures.
For me, the key question is not whether bank stocks are falling. It is whether the weakness in their share prices eventually shows up in the underlying businesses.
I would be watching loan delinquencies, credit-loss provisions, deposit stability, funding costs, and lending standards.
If those indicators deteriorate together, the situation becomes more concerning. If earnings and credit quality remain resilient, the market may be pricing in more pessimism than the fundamentals justify.
WHY I’M WATCHING THIS AS A CRYPTO INVESTOR
This is where the story gets particularly relevant to me.
Crypto does not operate in isolation. It sits inside a financial environment shaped by liquidity, interest rates, investor confidence, and access to capital.
If pressure on banks spreads into tighter lending and weaker economic activity, risk assets could face another challenge. Bitcoin and altcoins might struggle if investors reduce exposure to volatile assets and liquidity becomes harder to access.
But I would not automatically turn this into a bearish Bitcoin prediction.
If financial stress eventually leads to expectations of easier monetary policy, some investors could start looking toward scarce assets such as Bitcoin. However, that outcome is not guaranteed. In an initial risk-off move, crypto can fall alongside stocks as investors sell assets to raise cash.
The sequence matters. First comes the market reaction. Then comes the policy response, if one is needed.
That is why I would rather watch the evidence than assume a banking sell-off must be bullish or bearish for crypto.
MY TAKE: THE WARNING IS REAL, BUT THE CONCLUSION ISN’T SETTLED
What catches my attention is not the dramatic word Bankpocalypse. It is the possibility that investors are reassessing the cost of money, the sustainability of AI-related investment, and the earnings outlook for traditional financial institutions at the same time.
A roughly 13% decline in the KBW Bank Index, combined with a six-week losing streak, is significant enough to monitor. But the evidence does not yet justify treating it as proof that another 2008-style crisis is unfolding.
My next move would be to watch how banks perform after earnings, whether credit quality begins to weaken, and whether rising yields continue to pressure the sector.
Because markets rarely send just one signal. Sometimes the most useful clue is the divergence between what investors are celebrating and what they are quietly selling.
The question I want answered is simple: are investors overreacting to pressure on bank earnings, or are bank stocks warning us about a broader problem that the rest of the market has not fully priced in yet?
That is the part I will be watching.
#BTC
THE BANKPOCALYPSE NOBODY IS TALKING ABOUT: US BANK STOCKS ARE FLASHING A WARNING
Everyone is watching Bitcoin, AI stocks, and the next big market rally. But I think there is another part of the financial market that deserves serious attention right now: American banks are struggling to convince investors that everything is fine.
And the numbers are getting difficult to ignore.
Goldman Sachs and Capital One are reportedly down around 24% to 25% from their highs, while Bank of America and Morgan Stanley have suffered declines approaching 19%.
These are substantial moves for some of the biggest names in American finance.
What makes this more interesting is that the weakness is not limited to one bank. Different institutions have different business models, yet pressure is spreading across the sector. That suggests investors are looking beyond individual earnings reports and questioning the environment these companies are operating in.
And here is the part I find particularly interesting: the broader stock market has been holding up far better than the banks.
That divergence matters. When investors lose confidence in one sector while the broader market remains relatively strong, I want to understand what the market might be pricing in before jumping to conclusions.
WHY ARE BANKS UNDER PRESSURE?
In my view, three major forces deserve attention.
First, interest rates and bond yields.
The Federal Reserve raised interest rates on September 16, its first increase in three years, and persistent inflation has kept pressure on the policy outlook. Higher rates can help banks earn more on certain loans, but they can also increase deposit and funding costs, put pressure on bond portfolios, and make borrowing more expensive for customers. The outcome depends on how quickly each bank’s income and costs adjust.
Second, Wall Street’s dealmaking business is losing some momentum.
Investment banking depends heavily on companies issuing shares, borrowing money, and completing mergers and acquisitions. When borrowing costs rise and uncertainty increases, companies may delay those decisions. Reuters reported that weaker dealmaking weighed on investment banking during the third quarter, while rising bond yields and uncertainty around AI added to investor concerns.
Third, the market is questioning whether the AI boom can keep delivering.
AI has created enormous opportunities for technology companies, but banks are exposed to the other side of that story, too. They finance businesses, provide capital-markets services, and depend on customers maintaining healthy financial positions. If AI-related investment becomes more expensive to finance or expected returns disappoint, parts of the financial system could feel the impact.
There is another longer-term concern: AI agents could eventually change how customers manage money and interact with financial institutions. That is not an immediate threat to every bank, but investors are beginning to consider how technology could reshape traditional banking economics.
BUT IS THIS REALLY ANOTHER 2008?
This is where I would be careful.
A falling bank stock price does not automatically mean a bank is insolvent, and a correction in banking shares is not the same thing as a financial crisis.
In fact, recent third-quarter results offer a more complicated picture. Reuters reported on October 16 that several regional banks, including PNC Financial and US Bancorp, continued to see strong loan demand. PNC reported 14.2% loan growth, suggesting that parts of the banking system are still experiencing meaningful business activity.
That is an important counterpoint.
The current sell-off may reflect concerns about profitability, funding costs, bond yields, and future economic conditions rather than evidence of widespread bank failures.
For me, the key question is not whether bank stocks are falling. It is whether the weakness in their share prices eventually shows up in the underlying businesses.
I would be watching loan delinquencies, credit-loss provisions, deposit stability, funding costs, and lending standards.
If those indicators deteriorate together, the situation becomes more concerning. If earnings and credit quality remain resilient, the market may be pricing in more pessimism than the fundamentals justify.
WHY I’M WATCHING THIS AS A CRYPTO INVESTOR
This is where the story gets particularly relevant to me.
Crypto does not operate in isolation. It sits inside a financial environment shaped by liquidity, interest rates, investor confidence, and access to capital.
If pressure on banks spreads into tighter lending and weaker economic activity, risk assets could face another challenge. Bitcoin and altcoins might struggle if investors reduce exposure to volatile assets and liquidity becomes harder to access.
But I would not automatically turn this into a bearish Bitcoin prediction.
If financial stress eventually leads to expectations of easier monetary policy, some investors could start looking toward scarce assets such as Bitcoin. However, that outcome is not guaranteed. In an initial risk-off move, crypto can fall alongside stocks as investors sell assets to raise cash.
The sequence matters. First comes the market reaction. Then comes the policy response, if one is needed.
That is why I would rather watch the evidence than assume a banking sell-off must be bullish or bearish for crypto.
MY TAKE: THE WARNING IS REAL, BUT THE CONCLUSION ISN’T SETTLED
What catches my attention is not the dramatic word Bankpocalypse. It is the possibility that investors are reassessing the cost of money, the sustainability of AI-related investment, and the earnings outlook for traditional financial institutions at the same time.
A roughly 13% decline in the KBW Bank Index, combined with a six-week losing streak, is significant enough to monitor. But the evidence does not yet justify treating it as proof that another 2008-style crisis is unfolding.
My next move would be to watch how banks perform after earnings, whether credit quality begins to weaken, and whether rising yields continue to pressure the sector.
Because markets rarely send just one signal. Sometimes the most useful clue is the divergence between what investors are celebrating and what they are quietly selling.
The question I want answered is simple: are investors overreacting to pressure on bank earnings, or are bank stocks warning us about a broader problem that the rest of the market has not fully priced in yet?
That is the part I will be watching.
#BTC
And the numbers are getting difficult to ignore.
Goldman Sachs and Capital One are reportedly down around 24% to 25% from their highs, while Bank of America and Morgan Stanley have suffered declines approaching 19%.
These are substantial moves for some of the biggest names in American finance.
What makes this more interesting is that the weakness is not limited to one bank. Different institutions have different business models, yet pressure is spreading across the sector. That suggests investors are looking beyond individual earnings reports and questioning the environment these companies are operating in.
And here is the part I find particularly interesting: the broader stock market has been holding up far better than the banks.
That divergence matters. When investors lose confidence in one sector while the broader market remains relatively strong, I want to understand what the market might be pricing in before jumping to conclusions.
WHY ARE BANKS UNDER PRESSURE?
In my view, three major forces deserve attention.
First, interest rates and bond yields.
The Federal Reserve raised interest rates on September 16, its first increase in three years, and persistent inflation has kept pressure on the policy outlook. Higher rates can help banks earn more on certain loans, but they can also increase deposit and funding costs, put pressure on bond portfolios, and make borrowing more expensive for customers. The outcome depends on how quickly each bank’s income and costs adjust.
Second, Wall Street’s dealmaking business is losing some momentum.
Investment banking depends heavily on companies issuing shares, borrowing money, and completing mergers and acquisitions. When borrowing costs rise and uncertainty increases, companies may delay those decisions. Reuters reported that weaker dealmaking weighed on investment banking during the third quarter, while rising bond yields and uncertainty around AI added to investor concerns.
Third, the market is questioning whether the AI boom can keep delivering.
AI has created enormous opportunities for technology companies, but banks are exposed to the other side of that story, too. They finance businesses, provide capital-markets services, and depend on customers maintaining healthy financial positions. If AI-related investment becomes more expensive to finance or expected returns disappoint, parts of the financial system could feel the impact.
There is another longer-term concern: AI agents could eventually change how customers manage money and interact with financial institutions. That is not an immediate threat to every bank, but investors are beginning to consider how technology could reshape traditional banking economics.
BUT IS THIS REALLY ANOTHER 2008?
This is where I would be careful.
A falling bank stock price does not automatically mean a bank is insolvent, and a correction in banking shares is not the same thing as a financial crisis.
In fact, recent third-quarter results offer a more complicated picture. Reuters reported on October 16 that several regional banks, including PNC Financial and US Bancorp, continued to see strong loan demand. PNC reported 14.2% loan growth, suggesting that parts of the banking system are still experiencing meaningful business activity.
That is an important counterpoint.
The current sell-off may reflect concerns about profitability, funding costs, bond yields, and future economic conditions rather than evidence of widespread bank failures.
For me, the key question is not whether bank stocks are falling. It is whether the weakness in their share prices eventually shows up in the underlying businesses.
I would be watching loan delinquencies, credit-loss provisions, deposit stability, funding costs, and lending standards.
If those indicators deteriorate together, the situation becomes more concerning. If earnings and credit quality remain resilient, the market may be pricing in more pessimism than the fundamentals justify.
WHY I’M WATCHING THIS AS A CRYPTO INVESTOR
This is where the story gets particularly relevant to me.
Crypto does not operate in isolation. It sits inside a financial environment shaped by liquidity, interest rates, investor confidence, and access to capital.
If pressure on banks spreads into tighter lending and weaker economic activity, risk assets could face another challenge. Bitcoin and altcoins might struggle if investors reduce exposure to volatile assets and liquidity becomes harder to access.
But I would not automatically turn this into a bearish Bitcoin prediction.
If financial stress eventually leads to expectations of easier monetary policy, some investors could start looking toward scarce assets such as Bitcoin. However, that outcome is not guaranteed. In an initial risk-off move, crypto can fall alongside stocks as investors sell assets to raise cash.
The sequence matters. First comes the market reaction. Then comes the policy response, if one is needed.
That is why I would rather watch the evidence than assume a banking sell-off must be bullish or bearish for crypto.
MY TAKE: THE WARNING IS REAL, BUT THE CONCLUSION ISN’T SETTLED
What catches my attention is not the dramatic word Bankpocalypse. It is the possibility that investors are reassessing the cost of money, the sustainability of AI-related investment, and the earnings outlook for traditional financial institutions at the same time.
A roughly 13% decline in the KBW Bank Index, combined with a six-week losing streak, is significant enough to monitor. But the evidence does not yet justify treating it as proof that another 2008-style crisis is unfolding.
My next move would be to watch how banks perform after earnings, whether credit quality begins to weaken, and whether rising yields continue to pressure the sector.
Because markets rarely send just one signal. Sometimes the most useful clue is the divergence between what investors are celebrating and what they are quietly selling.
The question I want answered is simple: are investors overreacting to pressure on bank earnings, or are bank stocks warning us about a broader problem that the rest of the market has not fully priced in yet?
That is the part I will be watching.
#BTC
48
1
68
15.5k
·
--
Проверено
The next phase of DeFi derivatives will be about more than leverage. It will be about giving traders better tools and more flexibility.
That’s where #AEVO gets interesting.
Aevo brings perpetual futures, options and structured products into one on-chain trading ecosystem. Instead of focusing on a single market, it aims to give traders multiple ways to approach volatility and manage exposure.
With $HYPE , GMX, $DYDX and JUP competing for attention in the trading space, product depth and execution quality will be key differentiators.
The narrative is promising, but sustained liquidity, real user demand and platform activity are what I’ll be watching next.
$AEVO stays on my radar as on-chain derivatives continue to evolve.
Not financial advice.
@Aevoxyz
The next phase of DeFi derivatives will be about more than leverage. It will be about giving traders better tools and more flexibility.
That’s where #AEVO gets interesting.
Aevo brings perpetual futures, options and structured products into one on-chain trading ecosystem. Instead of focusing on a single market, it aims to give traders multiple ways to approach volatility and manage exposure.
With $HYPE , GMX, $DYDX and JUP competing for attention in the trading space, product depth and execution quality will be key differentiators.
The narrative is promising, but sustained liquidity, real user demand and platform activity are what I’ll be watching next.
$AEVO stays on my radar as on-chain derivatives continue to evolve.
Not financial advice.
@Aevo
That’s where #AEVO gets interesting.
Aevo brings perpetual futures, options and structured products into one on-chain trading ecosystem. Instead of focusing on a single market, it aims to give traders multiple ways to approach volatility and manage exposure.
With $HYPE , GMX, $DYDX and JUP competing for attention in the trading space, product depth and execution quality will be key differentiators.
The narrative is promising, but sustained liquidity, real user demand and platform activity are what I’ll be watching next.
$AEVO stays on my radar as on-chain derivatives continue to evolve.
Not financial advice.
@Aevo
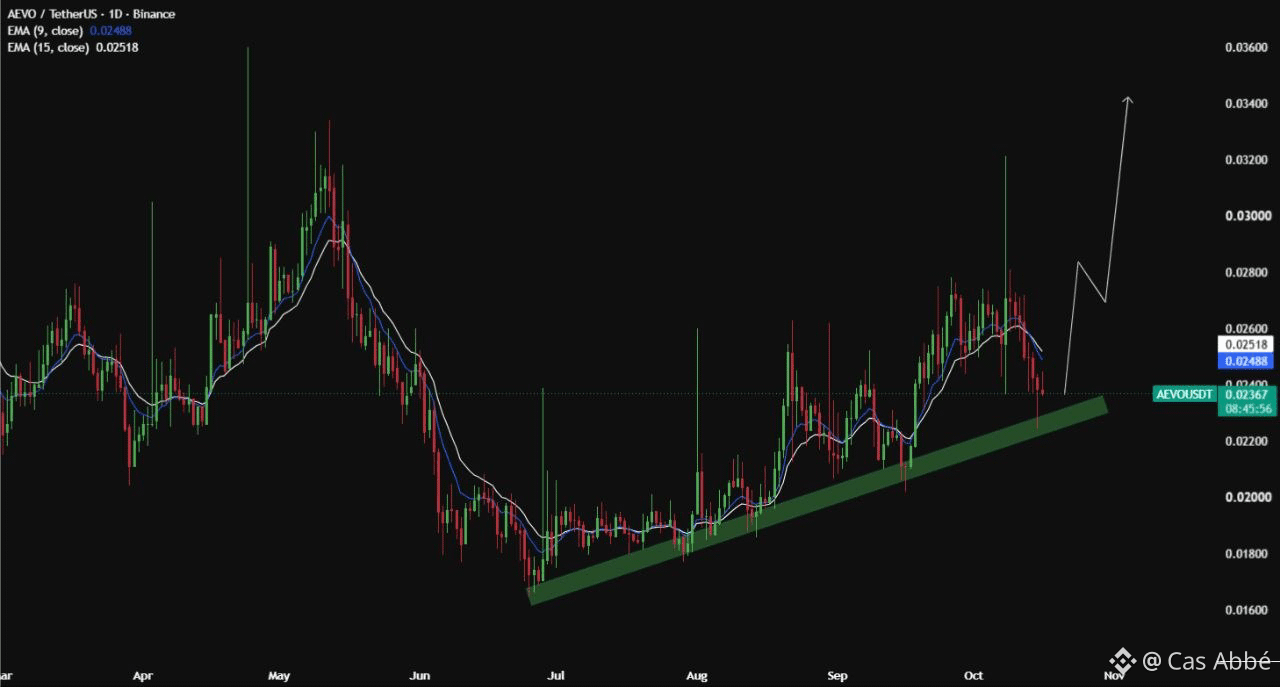
39
55
17.2k
·
--
One question can lead to an entire research rabbit hole. That’s what makes #Polymarket interesting.
Imagine tracking a major economic decision. You can explore related markets, compare different timelines, and see how separate outcomes connect to the same event.
Instead of researching one headline in isolation, you start building a broader picture of what could happen next.
That’s a powerful use case for prediction markets: turning curiosity into structured research.
The key is to do your own analysis, understand each market’s terms, and remember that even popular predictions can be wrong.
Better questions lead to better research.
That’s the side of Polymarket I find worth exploring.
@polymarket
#btc
One question can lead to an entire research rabbit hole. That’s what makes #Polymarket interesting.
Imagine tracking a major economic decision. You can explore related markets, compare different timelines, and see how separate outcomes connect to the same event.
Instead of researching one headline in isolation, you start building a broader picture of what could happen next.
That’s a powerful use case for prediction markets: turning curiosity into structured research.
The key is to do your own analysis, understand each market’s terms, and remember that even popular predictions can be wrong.
Better questions lead to better research.
That’s the side of Polymarket I find worth exploring.
@Polymarket
#btc
Imagine tracking a major economic decision. You can explore related markets, compare different timelines, and see how separate outcomes connect to the same event.
Instead of researching one headline in isolation, you start building a broader picture of what could happen next.
That’s a powerful use case for prediction markets: turning curiosity into structured research.
The key is to do your own analysis, understand each market’s terms, and remember that even popular predictions can be wrong.
Better questions lead to better research.
That’s the side of Polymarket I find worth exploring.
@Polymarket
#btc

45
2
69
6.6k
·
--
Проверено

Статья
BINANCE US IS CHASING A $1 BILLION COMEBACKHonestly, I think this is an interesting development for the US crypto market.
Binance.US is reportedly looking to raise up to $100 million at a $1 billion valuation, according to Bloomberg. The goal is to strengthen its US business, attract more traders, improve liquidity, and expand its reach. The fundraising is still being discussed, so the final amount and valuation could change.
What caught my attention is the bigger picture.
Binance.US was valued at $4.5 billion in 2022. Now, it is reportedly targeting a $1 billion valuation. That is a massive difference, but it also shows how much the business has had to rebuild after regulatory challenges and losing market share.
Personally, I see this as more than a fundraising story.
The US crypto market is becoming increasingly competitive. Exchanges need deeper liquidity, better products, lower fees, and easier access for users. Simply having a big name is no longer enough.
Binance.US is reportedly exploring new sources of trading liquidity and working to restore some state licences. If it can execute that plan successfully, fresh capital could help it compete more aggressively.
And that is the part I find positive.
Crypto adoption needs stronger infrastructure, not just rising prices.
More competition between exchanges can mean better services, more choices, and potentially lower trading costs for users. But execution matters more than announcements.
I also want to be clear about one thing: Binance.US operates separately from the global Binance exchange. Its US expansion should be judged on its own progress, licensing, liquidity, and ability to win back customers.
I’m interested to see what comes next. If Binance.US can turn this fundraising effort into real growth, it could become a much stronger competitor in the American market.
The real thing is whether Binance.US can turn that capital into a comeback.
BINANCE US IS CHASING A $1 BILLION COMEBACK
Honestly, I think this is an interesting development for the US crypto market.
Binance.US is reportedly looking to raise up to $100 million at a $1 billion valuation, according to Bloomberg. The goal is to strengthen its US business, attract more traders, improve liquidity, and expand its reach. The fundraising is still being discussed, so the final amount and valuation could change.
What caught my attention is the bigger picture.
Binance.US was valued at $4.5 billion in 2022. Now, it is reportedly targeting a $1 billion valuation. That is a massive difference, but it also shows how much the business has had to rebuild after regulatory challenges and losing market share.
Personally, I see this as more than a fundraising story.
The US crypto market is becoming increasingly competitive. Exchanges need deeper liquidity, better products, lower fees, and easier access for users. Simply having a big name is no longer enough.
Binance.US is reportedly exploring new sources of trading liquidity and working to restore some state licences. If it can execute that plan successfully, fresh capital could help it compete more aggressively.
And that is the part I find positive.
Crypto adoption needs stronger infrastructure, not just rising prices.
More competition between exchanges can mean better services, more choices, and potentially lower trading costs for users. But execution matters more than announcements.
I also want to be clear about one thing: Binance.US operates separately from the global Binance exchange. Its US expansion should be judged on its own progress, licensing, liquidity, and ability to win back customers.
I’m interested to see what comes next. If Binance.US can turn this fundraising effort into real growth, it could become a much stronger competitor in the American market.
The real thing is whether Binance.US can turn that capital into a comeback.
Binance.US is reportedly looking to raise up to $100 million at a $1 billion valuation, according to Bloomberg. The goal is to strengthen its US business, attract more traders, improve liquidity, and expand its reach. The fundraising is still being discussed, so the final amount and valuation could change.
What caught my attention is the bigger picture.
Binance.US was valued at $4.5 billion in 2022. Now, it is reportedly targeting a $1 billion valuation. That is a massive difference, but it also shows how much the business has had to rebuild after regulatory challenges and losing market share.
Personally, I see this as more than a fundraising story.
The US crypto market is becoming increasingly competitive. Exchanges need deeper liquidity, better products, lower fees, and easier access for users. Simply having a big name is no longer enough.
Binance.US is reportedly exploring new sources of trading liquidity and working to restore some state licences. If it can execute that plan successfully, fresh capital could help it compete more aggressively.
And that is the part I find positive.
Crypto adoption needs stronger infrastructure, not just rising prices.
More competition between exchanges can mean better services, more choices, and potentially lower trading costs for users. But execution matters more than announcements.
I also want to be clear about one thing: Binance.US operates separately from the global Binance exchange. Its US expansion should be judged on its own progress, licensing, liquidity, and ability to win back customers.
I’m interested to see what comes next. If Binance.US can turn this fundraising effort into real growth, it could become a much stronger competitor in the American market.
The real thing is whether Binance.US can turn that capital into a comeback.
36
51
6.5k
·
--
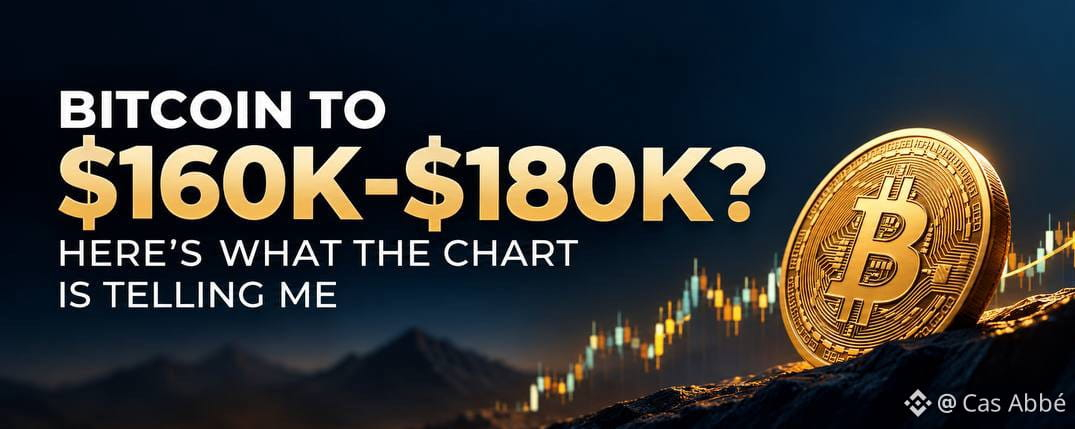
Статья
BITCOIN TO $160K-$180K? HERE’S WHAT THE CHART IS TELLING MEI’ve seen plenty of bullish Bitcoin charts, but the thing that caught my attention in this setup isn’t the $160K-$180K target. It’s the monthly MACD.
Looking at the chart shared by Crypto Rover, the momentum indicator appears to be curling upward after an extended period below the zero line. If that developing move turns into a confirmed bullish crossover, it could signal that Bitcoin’s longer-term momentum is shifting again.
But there’s a difference between spotting an early signal and assuming the next massive rally is guaranteed.
THE MACD SETUP IS WORTH WATCHING
What stands out to me is how compressed the momentum looks compared with previous bullish phases.
Historically, Bitcoin’s strongest rallies have often followed periods when bearish momentum faded and buyers gradually regained control. The monthly timeframe matters here because it filters out much of the noise that makes lower-timeframe signals unreliable.
However, the screenshot alone doesn’t confirm a completed bullish crossover. I’d want to see the MACD line cross above its signal line, the histogram turn convincingly positive, and subsequent monthly candles confirm that momentum is building.
My take: If the crossover confirms while price structure improves, I’d pay much closer attention to the possibility of another major expansion phase.
CAN BTC REALLY REACH $160K-$180K?
I wouldn’t dismiss that range, but I’d treat it as a bullish scenario rather than a guaranteed destination.
Bitcoin previously reached an all-time high above $126,000 in October 2025 before suffering a substantial correction. By October 2026, it had recovered toward the $80,000-$85,000 region, but the market was still dealing with macroeconomic pressure and questions about the strength of institutional demand.
For me, the next move depends on three things.
1. Reclaiming major resistance
BTC needs to establish a stronger market structure, reclaim important resistance levels, and hold those levels on pullbacks. A quick wick above resistance isn’t enough. I want to see buyers defend the breakout.
2. Real spot demand returning
ETF inflows can provide meaningful support, but the trend needs consistency. Recent market reporting has highlighted how institutional demand can weaken even when Bitcoin’s price appears resilient. I’d rather see sustained buying than assume every dip will be bought.
3. Liquidity conditions improving
This is the part traders sometimes overlook. Bitcoin can produce a bullish technical setup and still struggle when financial conditions tighten. Interest rates, Treasury yields, the dollar, and broader risk appetite can all influence how far a rally travels.
MY BTC ROADMAP
Here’s how I’d approach the setup rather than blindly buying because someone posted a six-figure target.
Bullish scenario: Monthly momentum confirms, BTC breaks through resistance, and spot demand strengthens. In that case, the $100K region becomes an important milestone, with $120K-$130K as a subsequent area to watch. If price clears its previous high and establishes acceptance above it, the $160K-$180K region becomes a possible extension target.
Neutral scenario: MACD starts turning up, but Bitcoin remains trapped below resistance. Momentum could improve without producing an immediate breakout. I’d wait for price confirmation rather than front-run the move.
Bearish scenario: The developing MACD setup fails, resistance holds, and BTC loses established support. That would weaken the bullish thesis and leave room for another substantial correction.
These are conditional scenarios, not confirmed price targets. The screenshot doesn’t provide enough information to establish precise entry, stop-loss, or invalidation levels.
THE BIGGEST MISTAKE WOULD BE BUYING THE PREDICTION INSTEAD OF THE SETUP
Personally, I find the monthly MACD more interesting than the headline target.
A potential momentum reversal after a prolonged correction is worth monitoring, especially if price action begins confirming it.
But an indicator doesn’t tell us exactly when the move will happen, and it certainly doesn’t guarantee where Bitcoin will top.
I’m watching for confirmation, stronger spot demand, and a clean reclaim of resistance. If those pieces align, the bullish case becomes more convincing. Until then, $160K-$180K remains a scenario to prepare for, not a promise to trade on.
The real question isn’t whether Bitcoin can reach $180K. It’s whether the market builds the structure and demand needed to justify that move.
Not financial advice. These are conditional market scenarios, not guarantees. Always manage risk.
#BTC
BITCOIN TO $160K-$180K? HERE’S WHAT THE CHART IS TELLING ME
I’ve seen plenty of bullish Bitcoin charts, but the thing that caught my attention in this setup isn’t the $160K-$180K target. It’s the monthly MACD.
Looking at the chart shared by Crypto Rover, the momentum indicator appears to be curling upward after an extended period below the zero line. If that developing move turns into a confirmed bullish crossover, it could signal that Bitcoin’s longer-term momentum is shifting again.
But there’s a difference between spotting an early signal and assuming the next massive rally is guaranteed.
THE MACD SETUP IS WORTH WATCHING
What stands out to me is how compressed the momentum looks compared with previous bullish phases.
Historically, Bitcoin’s strongest rallies have often followed periods when bearish momentum faded and buyers gradually regained control. The monthly timeframe matters here because it filters out much of the noise that makes lower-timeframe signals unreliable.
However, the screenshot alone doesn’t confirm a completed bullish crossover. I’d want to see the MACD line cross above its signal line, the histogram turn convincingly positive, and subsequent monthly candles confirm that momentum is building.
My take: If the crossover confirms while price structure improves, I’d pay much closer attention to the possibility of another major expansion phase.
CAN BTC REALLY REACH $160K-$180K?
I wouldn’t dismiss that range, but I’d treat it as a bullish scenario rather than a guaranteed destination.
Bitcoin previously reached an all-time high above $126,000 in October 2025 before suffering a substantial correction. By October 2026, it had recovered toward the $80,000-$85,000 region, but the market was still dealing with macroeconomic pressure and questions about the strength of institutional demand.
For me, the next move depends on three things.
1. Reclaiming major resistance
BTC needs to establish a stronger market structure, reclaim important resistance levels, and hold those levels on pullbacks. A quick wick above resistance isn’t enough. I want to see buyers defend the breakout.
2. Real spot demand returning
ETF inflows can provide meaningful support, but the trend needs consistency. Recent market reporting has highlighted how institutional demand can weaken even when Bitcoin’s price appears resilient. I’d rather see sustained buying than assume every dip will be bought.
3. Liquidity conditions improving
This is the part traders sometimes overlook. Bitcoin can produce a bullish technical setup and still struggle when financial conditions tighten. Interest rates, Treasury yields, the dollar, and broader risk appetite can all influence how far a rally travels.
MY BTC ROADMAP
Here’s how I’d approach the setup rather than blindly buying because someone posted a six-figure target.
Bullish scenario: Monthly momentum confirms, BTC breaks through resistance, and spot demand strengthens. In that case, the $100K region becomes an important milestone, with $120K-$130K as a subsequent area to watch. If price clears its previous high and establishes acceptance above it, the $160K-$180K region becomes a possible extension target.
Neutral scenario: MACD starts turning up, but Bitcoin remains trapped below resistance. Momentum could improve without producing an immediate breakout. I’d wait for price confirmation rather than front-run the move.
Bearish scenario: The developing MACD setup fails, resistance holds, and BTC loses established support. That would weaken the bullish thesis and leave room for another substantial correction.
These are conditional scenarios, not confirmed price targets. The screenshot doesn’t provide enough information to establish precise entry, stop-loss, or invalidation levels.
THE BIGGEST MISTAKE WOULD BE BUYING THE PREDICTION INSTEAD OF THE SETUP
Personally, I find the monthly MACD more interesting than the headline target.
A potential momentum reversal after a prolonged correction is worth monitoring, especially if price action begins confirming it.
But an indicator doesn’t tell us exactly when the move will happen, and it certainly doesn’t guarantee where Bitcoin will top.
I’m watching for confirmation, stronger spot demand, and a clean reclaim of resistance. If those pieces align, the bullish case becomes more convincing. Until then, $160K-$180K remains a scenario to prepare for, not a promise to trade on.
The real question isn’t whether Bitcoin can reach $180K. It’s whether the market builds the structure and demand needed to justify that move.
Not financial advice. These are conditional market scenarios, not guarantees. Always manage risk.
#BTC
Looking at the chart shared by Crypto Rover, the momentum indicator appears to be curling upward after an extended period below the zero line. If that developing move turns into a confirmed bullish crossover, it could signal that Bitcoin’s longer-term momentum is shifting again.
But there’s a difference between spotting an early signal and assuming the next massive rally is guaranteed.
THE MACD SETUP IS WORTH WATCHING
What stands out to me is how compressed the momentum looks compared with previous bullish phases.
Historically, Bitcoin’s strongest rallies have often followed periods when bearish momentum faded and buyers gradually regained control. The monthly timeframe matters here because it filters out much of the noise that makes lower-timeframe signals unreliable.
However, the screenshot alone doesn’t confirm a completed bullish crossover. I’d want to see the MACD line cross above its signal line, the histogram turn convincingly positive, and subsequent monthly candles confirm that momentum is building.
My take: If the crossover confirms while price structure improves, I’d pay much closer attention to the possibility of another major expansion phase.
CAN BTC REALLY REACH $160K-$180K?
I wouldn’t dismiss that range, but I’d treat it as a bullish scenario rather than a guaranteed destination.
Bitcoin previously reached an all-time high above $126,000 in October 2025 before suffering a substantial correction. By October 2026, it had recovered toward the $80,000-$85,000 region, but the market was still dealing with macroeconomic pressure and questions about the strength of institutional demand.
For me, the next move depends on three things.
1. Reclaiming major resistance
BTC needs to establish a stronger market structure, reclaim important resistance levels, and hold those levels on pullbacks. A quick wick above resistance isn’t enough. I want to see buyers defend the breakout.
2. Real spot demand returning
ETF inflows can provide meaningful support, but the trend needs consistency. Recent market reporting has highlighted how institutional demand can weaken even when Bitcoin’s price appears resilient. I’d rather see sustained buying than assume every dip will be bought.
3. Liquidity conditions improving
This is the part traders sometimes overlook. Bitcoin can produce a bullish technical setup and still struggle when financial conditions tighten. Interest rates, Treasury yields, the dollar, and broader risk appetite can all influence how far a rally travels.
MY BTC ROADMAP
Here’s how I’d approach the setup rather than blindly buying because someone posted a six-figure target.
Bullish scenario: Monthly momentum confirms, BTC breaks through resistance, and spot demand strengthens. In that case, the $100K region becomes an important milestone, with $120K-$130K as a subsequent area to watch. If price clears its previous high and establishes acceptance above it, the $160K-$180K region becomes a possible extension target.
Neutral scenario: MACD starts turning up, but Bitcoin remains trapped below resistance. Momentum could improve without producing an immediate breakout. I’d wait for price confirmation rather than front-run the move.
Bearish scenario: The developing MACD setup fails, resistance holds, and BTC loses established support. That would weaken the bullish thesis and leave room for another substantial correction.
These are conditional scenarios, not confirmed price targets. The screenshot doesn’t provide enough information to establish precise entry, stop-loss, or invalidation levels.
THE BIGGEST MISTAKE WOULD BE BUYING THE PREDICTION INSTEAD OF THE SETUP
Personally, I find the monthly MACD more interesting than the headline target.
A potential momentum reversal after a prolonged correction is worth monitoring, especially if price action begins confirming it.
But an indicator doesn’t tell us exactly when the move will happen, and it certainly doesn’t guarantee where Bitcoin will top.
I’m watching for confirmation, stronger spot demand, and a clean reclaim of resistance. If those pieces align, the bullish case becomes more convincing. Until then, $160K-$180K remains a scenario to prepare for, not a promise to trade on.
The real question isn’t whether Bitcoin can reach $180K. It’s whether the market builds the structure and demand needed to justify that move.
Not financial advice. These are conditional market scenarios, not guarantees. Always manage risk.
#BTC
60
2
93
26.6k
·
--
Статья
IS THIS BITCOIN’S NVDA MOMENT? HERE’S HOW I’M THINKING ABOUT ITI’ve traded stocks longer than I’ve traded crypto, so when I line up Bitcoin’s chart against Nvidia’s early years, it feels familiar to me.
The setup I keep coming back to
Nvidia had a huge run, peaked, and then lost roughly two-thirds of its value over about a year. Everyone called it over. Within that same stretch, the market got bored of it, the narrative died, and the chart looked broken.
Bitcoin just did something similar. It ran to a record above $120k in late 2025, then pulled back hard. The shape of the run-up, the sharp peak and the messy correction is close to what Nvidia printed before its next leg.
What happened next for Nvidia
Nvidia didn’t recover slowly. It went vertical. Looking back, the drawdown wasn’t the end of the trend. It was the reset that cleared out weak hands before the biggest move of its life.
The reason it happened matters more than the chart, though. AI demand showed up and changed what the company was worth. The chart rhymed with the past, but a real catalyst made the move happen.
Does Bitcoin have that catalyst?
This is where I stay grounded. A fractal alone isn’t a thesis. What I’m watching instead:
✓ Institutional access through ETFs and treasury adoption
✓ Traditional finance building on crypto rails, including tokenization and 24/7 markets
✓ Bitcoin increasingly treated as a macro asset, not just a speculative one
✓ Supply that stays fixed while demand broadens
If those keep compounding, the comparison starts to make sense for reasons beyond a pretty overlay.
Where I’m cautious
Fractals fail all the time. Nvidia had a product the world suddenly needed. Bitcoin’s driver is adoption and liquidity, which is slower and harder to time. Past patterns also aren’t promises. Nvidia’s run looks obvious now, but anyone holding it through that drawdown had to sit through real doubt.
And $1,000,000 is a target, not a timeline. I don’t know how long it takes, and anyone who gives you an exact date is guessing.
How I’m positioning my thinking
→ I’m not chasing a price target
→ I’m watching whether the catalysts show up, not just whether the chart matches
→ I’m thinking in cycles, not weeks
→ I’m sizing positions so a wrong call doesn’t wreck me
the comparison is interesting and worth taking seriously, but it only becomes real if adoption does the heavy lifting. If it does, a lot of us will wish we’d thought bigger. If it doesn’t, the overlay was just a nice picture.
Not financial advice. Do your own research.
#BTC
IS THIS BITCOIN’S NVDA MOMENT? HERE’S HOW I’M THINKING ABOUT IT
I’ve traded stocks longer than I’ve traded crypto, so when I line up Bitcoin’s chart against Nvidia’s early years, it feels familiar to me.
The setup I keep coming back to
Nvidia had a huge run, peaked, and then lost roughly two-thirds of its value over about a year. Everyone called it over. Within that same stretch, the market got bored of it, the narrative died, and the chart looked broken.
Bitcoin just did something similar. It ran to a record above $120k in late 2025, then pulled back hard. The shape of the run-up, the sharp peak and the messy correction is close to what Nvidia printed before its next leg.
What happened next for Nvidia
Nvidia didn’t recover slowly. It went vertical. Looking back, the drawdown wasn’t the end of the trend. It was the reset that cleared out weak hands before the biggest move of its life.
The reason it happened matters more than the chart, though. AI demand showed up and changed what the company was worth. The chart rhymed with the past, but a real catalyst made the move happen.
Does Bitcoin have that catalyst?
This is where I stay grounded. A fractal alone isn’t a thesis. What I’m watching instead:
✓ Institutional access through ETFs and treasury adoption
✓ Traditional finance building on crypto rails, including tokenization and 24/7 markets
✓ Bitcoin increasingly treated as a macro asset, not just a speculative one
✓ Supply that stays fixed while demand broadens
If those keep compounding, the comparison starts to make sense for reasons beyond a pretty overlay.
Where I’m cautious
Fractals fail all the time. Nvidia had a product the world suddenly needed. Bitcoin’s driver is adoption and liquidity, which is slower and harder to time. Past patterns also aren’t promises. Nvidia’s run looks obvious now, but anyone holding it through that drawdown had to sit through real doubt.
And $1,000,000 is a target, not a timeline. I don’t know how long it takes, and anyone who gives you an exact date is guessing.
How I’m positioning my thinking
→ I’m not chasing a price target
→ I’m watching whether the catalysts show up, not just whether the chart matches
→ I’m thinking in cycles, not weeks
→ I’m sizing positions so a wrong call doesn’t wreck me
the comparison is interesting and worth taking seriously, but it only becomes real if adoption does the heavy lifting. If it does, a lot of us will wish we’d thought bigger. If it doesn’t, the overlay was just a nice picture.
Not financial advice. Do your own research.
#BTC
The setup I keep coming back to
Nvidia had a huge run, peaked, and then lost roughly two-thirds of its value over about a year. Everyone called it over. Within that same stretch, the market got bored of it, the narrative died, and the chart looked broken.
Bitcoin just did something similar. It ran to a record above $120k in late 2025, then pulled back hard. The shape of the run-up, the sharp peak and the messy correction is close to what Nvidia printed before its next leg.
What happened next for Nvidia
Nvidia didn’t recover slowly. It went vertical. Looking back, the drawdown wasn’t the end of the trend. It was the reset that cleared out weak hands before the biggest move of its life.
The reason it happened matters more than the chart, though. AI demand showed up and changed what the company was worth. The chart rhymed with the past, but a real catalyst made the move happen.
Does Bitcoin have that catalyst?
This is where I stay grounded. A fractal alone isn’t a thesis. What I’m watching instead:
✓ Institutional access through ETFs and treasury adoption
✓ Traditional finance building on crypto rails, including tokenization and 24/7 markets
✓ Bitcoin increasingly treated as a macro asset, not just a speculative one
✓ Supply that stays fixed while demand broadens
If those keep compounding, the comparison starts to make sense for reasons beyond a pretty overlay.
Where I’m cautious
Fractals fail all the time. Nvidia had a product the world suddenly needed. Bitcoin’s driver is adoption and liquidity, which is slower and harder to time. Past patterns also aren’t promises. Nvidia’s run looks obvious now, but anyone holding it through that drawdown had to sit through real doubt.
And $1,000,000 is a target, not a timeline. I don’t know how long it takes, and anyone who gives you an exact date is guessing.
How I’m positioning my thinking
→ I’m not chasing a price target
→ I’m watching whether the catalysts show up, not just whether the chart matches
→ I’m thinking in cycles, not weeks
→ I’m sizing positions so a wrong call doesn’t wreck me
the comparison is interesting and worth taking seriously, but it only becomes real if adoption does the heavy lifting. If it does, a lot of us will wish we’d thought bigger. If it doesn’t, the overlay was just a nice picture.
Not financial advice. Do your own research.
#BTC
37
44
6.8k
·
--
The interesting thing about @polymarket is how it connects different worlds through one market.
Crypto traders can follow more than token prices. They can explore markets around Bitcoin milestones, ETF decisions, interest rates, technology developments and major sporting events.
That creates a different way to approach research: instead of only asking where an asset might go, you can examine how the market prices a specific event and what could change that probability.
While $HYPE , $JUP , $DRIFT and GMX focus on different parts of the crypto trading ecosystem, Polymarket brings event-based trading into the picture.
My approach would be simple: understand the market rules, compare the available odds with your own research, and never confuse a market probability with a guaranteed outcome.
The opportunity is in the research, not just the prediction.
Keeping #Polymarket on my radar.
#btc
The interesting thing about @Polymarket is how it connects different worlds through one market.
Crypto traders can follow more than token prices. They can explore markets around Bitcoin milestones, ETF decisions, interest rates, technology developments and major sporting events.
That creates a different way to approach research: instead of only asking where an asset might go, you can examine how the market prices a specific event and what could change that probability.
While $HYPE , $JUP , $DRIFT and GMX focus on different parts of the crypto trading ecosystem, Polymarket brings event-based trading into the picture.
My approach would be simple: understand the market rules, compare the available odds with your own research, and never confuse a market probability with a guaranteed outcome.
The opportunity is in the research, not just the prediction.
Keeping #Polymarket on my radar.
#btc
Crypto traders can follow more than token prices. They can explore markets around Bitcoin milestones, ETF decisions, interest rates, technology developments and major sporting events.
That creates a different way to approach research: instead of only asking where an asset might go, you can examine how the market prices a specific event and what could change that probability.
While $HYPE , $JUP , $DRIFT and GMX focus on different parts of the crypto trading ecosystem, Polymarket brings event-based trading into the picture.
My approach would be simple: understand the market rules, compare the available odds with your own research, and never confuse a market probability with a guaranteed outcome.
The opportunity is in the research, not just the prediction.
Keeping #Polymarket on my radar.
#btc
40
49
7.6k
·
--
Проверено
Most people think oracle networks are just about bringing prices on-chain. $PYTH is building something much bigger.
@PythNetwork is expanding across crypto, equities, FX, commodities and other financial markets, giving blockchain applications access to market data sourced directly from institutions and market participants.
What makes this interesting is the shift toward real business demand. Pyth Pro and the Data Marketplace are creating commercial data products, while revenue from Pyth’s services helps fund the PYTH Reserve, which purchases $PYTH on the open market.
Compared with $LINK, $API3, $SUPRA and RedStone, Pyth is positioning itself around fast, broad financial data delivery for on-chain applications and institutional use cases.
As tokenized assets and on-chain derivatives grow, reliable pricing infrastructure becomes increasingly important.
For me, the long-term story is simple: more financial markets moving on-chain means greater demand for dependable market data.
Keeping $PYTH on my radar. 👀
Not financial advice.
#btc
Most people think oracle networks are just about bringing prices on-chain. $PYTH is building something much bigger.
@Pyth Network is expanding across crypto, equities, FX, commodities and other financial markets, giving blockchain applications access to market data sourced directly from institutions and market participants.
What makes this interesting is the shift toward real business demand. Pyth Pro and the Data Marketplace are creating commercial data products, while revenue from Pyth’s services helps fund the PYTH Reserve, which purchases $PYTH on the open market.
Compared with $LINK, $API3, $SUPRA and RedStone, Pyth is positioning itself around fast, broad financial data delivery for on-chain applications and institutional use cases.
As tokenized assets and on-chain derivatives grow, reliable pricing infrastructure becomes increasingly important.
For me, the long-term story is simple: more financial markets moving on-chain means greater demand for dependable market data.
Keeping $PYTH on my radar. 👀
Not financial advice.
#btc
@Pyth Network is expanding across crypto, equities, FX, commodities and other financial markets, giving blockchain applications access to market data sourced directly from institutions and market participants.
What makes this interesting is the shift toward real business demand. Pyth Pro and the Data Marketplace are creating commercial data products, while revenue from Pyth’s services helps fund the PYTH Reserve, which purchases $PYTH on the open market.
Compared with $LINK, $API3, $SUPRA and RedStone, Pyth is positioning itself around fast, broad financial data delivery for on-chain applications and institutional use cases.
As tokenized assets and on-chain derivatives grow, reliable pricing infrastructure becomes increasingly important.
For me, the long-term story is simple: more financial markets moving on-chain means greater demand for dependable market data.
Keeping $PYTH on my radar. 👀
Not financial advice.
#btc

49
1
66
16.1k
·
--
Проверено
Most people use smartphones for social media, gaming, and entertainment. But what if these phones could also power the future of decentralized computing?
That’s exactly what makes $ACU interesting.
Instead of relying entirely on traditional data centers, Acurast turns smartphones into computing resources that developers can use to run applications, APIs, and even AI workloads.
What caught my attention:
* Smartphone-powered compute — use existing mobile hardware.
* Decentralized infrastructure — a global network of compute providers.
* Privacy-focused execution — Trusted Execution Environments (TEEs) help verify execution and protect confidential workloads.
* Real utility developers can deploy applications, while compute providers can earn $ACU rewards.
According to its documentation, Acurast has onboarded around 300,000 compute units worldwide.
The bigger idea is simple: computing power doesn’t have to come only from centralized data centers.
Could smartphones become an important part of the next generation of decentralized infrastructure?
#Acurast
Most people use smartphones for social media, gaming, and entertainment. But what if these phones could also power the future of decentralized computing?
That’s exactly what makes $ACU interesting.
Instead of relying entirely on traditional data centers, Acurast turns smartphones into computing resources that developers can use to run applications, APIs, and even AI workloads.
What caught my attention:
* Smartphone-powered compute — use existing mobile hardware.
* Decentralized infrastructure — a global network of compute providers.
* Privacy-focused execution — Trusted Execution Environments (TEEs) help verify execution and protect confidential workloads.
* Real utility developers can deploy applications, while compute providers can earn $ACU rewards.
According to its documentation, Acurast has onboarded around 300,000 compute units worldwide.
The bigger idea is simple: computing power doesn’t have to come only from centralized data centers.
Could smartphones become an important part of the next generation of decentralized infrastructure?
#Acurast
That’s exactly what makes $ACU interesting.
Instead of relying entirely on traditional data centers, Acurast turns smartphones into computing resources that developers can use to run applications, APIs, and even AI workloads.
What caught my attention:
* Smartphone-powered compute — use existing mobile hardware.
* Decentralized infrastructure — a global network of compute providers.
* Privacy-focused execution — Trusted Execution Environments (TEEs) help verify execution and protect confidential workloads.
* Real utility developers can deploy applications, while compute providers can earn $ACU rewards.
According to its documentation, Acurast has onboarded around 300,000 compute units worldwide.
The bigger idea is simple: computing power doesn’t have to come only from centralized data centers.
Could smartphones become an important part of the next generation of decentralized infrastructure?
#Acurast

34
40
1.3k
·
--
Проверено
Privacy could become one of the most important narratives in the next phase of blockchain adoption, and $NIGHT is worth watching.
Midnight is taking a different approach to blockchain privacy. Instead of making everything public or hiding everything completely, it uses zero-knowledge proofs and selective disclosure to let applications verify information without exposing sensitive data.
Its dual-token-resource model is another interesting part of the design: $NIGHT generates $DUST, which powers transactions on the network. This could help developers build applications with more predictable operating costs.
Compared with ecosystems like $ADA, $ETH, $SOL and $SUI, Midnight is carving out a distinct position around programmable privacy and confidential smart contracts.
The real test now is adoption: developer activity, useful applications and sustained network demand will matter more than narrative alone.
Keeping $NIGHT on my radar as the privacy sector develops.
Not financial advice.
Privacy could become one of the most important narratives in the next phase of blockchain adoption, and $NIGHT is worth watching.
Midnight is taking a different approach to blockchain privacy. Instead of making everything public or hiding everything completely, it uses zero-knowledge proofs and selective disclosure to let applications verify information without exposing sensitive data.
Its dual-token-resource model is another interesting part of the design: $NIGHT generates $DUST, which powers transactions on the network. This could help developers build applications with more predictable operating costs.
Compared with ecosystems like $ADA, $ETH, $SOL and $SUI, Midnight is carving out a distinct position around programmable privacy and confidential smart contracts.
The real test now is adoption: developer activity, useful applications and sustained network demand will matter more than narrative alone.
Keeping $NIGHT on my radar as the privacy sector develops.
Not financial advice.
Midnight is taking a different approach to blockchain privacy. Instead of making everything public or hiding everything completely, it uses zero-knowledge proofs and selective disclosure to let applications verify information without exposing sensitive data.
Its dual-token-resource model is another interesting part of the design: $NIGHT generates $DUST, which powers transactions on the network. This could help developers build applications with more predictable operating costs.
Compared with ecosystems like $ADA, $ETH, $SOL and $SUI, Midnight is carving out a distinct position around programmable privacy and confidential smart contracts.
The real test now is adoption: developer activity, useful applications and sustained network demand will matter more than narrative alone.
Keeping $NIGHT on my radar as the privacy sector develops.
Not financial advice.
37
54
9.4k
·
--
One thing that makes #Polymarket different is that the rules matter as much as the probability.
Before taking a position, you can check exactly what source will determine the outcome, when the market ends, and how edge cases are handled. The title may look simple, but the resolution rules define what actually counts.
And once the event is resolved, the winning shares settle at $1 while losing shares become worthless. Resolution is handled through UMA’s Optimistic Oracle.
So the real research isn’t just:
“What do I think will happen?”
It’s also:
“What exactly am I trading, and how will it be resolved?”
That’s an important part of understanding prediction markets.
Not financial advice.
@polymarket
#btc
One thing that makes #Polymarket different is that the rules matter as much as the probability.
Before taking a position, you can check exactly what source will determine the outcome, when the market ends, and how edge cases are handled. The title may look simple, but the resolution rules define what actually counts.
And once the event is resolved, the winning shares settle at $1 while losing shares become worthless. Resolution is handled through UMA’s Optimistic Oracle.
So the real research isn’t just:
“What do I think will happen?”
It’s also:
“What exactly am I trading, and how will it be resolved?”
That’s an important part of understanding prediction markets.
Not financial advice.
@Polymarket
#btc
Before taking a position, you can check exactly what source will determine the outcome, when the market ends, and how edge cases are handled. The title may look simple, but the resolution rules define what actually counts.
And once the event is resolved, the winning shares settle at $1 while losing shares become worthless. Resolution is handled through UMA’s Optimistic Oracle.
So the real research isn’t just:
“What do I think will happen?”
It’s also:
“What exactly am I trading, and how will it be resolved?”
That’s an important part of understanding prediction markets.
Not financial advice.
@Polymarket
#btc

33
47
7k
Войдите, чтобы посмотреть больше материала
Присоединяйтесь к пользователям криптовалют по всему миру на Binance Square
⚡️ Получайте новейшую и полезную информацию о криптоактивах.
💬 Нам доверяет крупнейшая в мире криптобиржа.
👍 Получите достоверные аналитические данные от верифицированных создателей контента.
Эл. почта/номер телефона
В тренде
BinancekzWin
Просмотров: 32,413
93 обсуждают
МЕН ЧАТТА ЖАЙ ҒАНА ОТЫРЫП, 10 BNB ҰТЫП АЛДЫМ 😭🔥
Деп айтқым келеді, бірақ бұл шындық емес, Бірақ шындықтың өзі де керемет 💅
Жеңіл, танымдық, қызықты белсенділіктерге қатысып, қомақты сыйлықтар ұтып алу? Оңай, Binance KZ мүмкіндікке толы!
Чатта үнемі розыгрыштар болып тұрады, мен де жиі ұтып аламын. Бірақ ең басты жеңіс- өзіңе жайлы, адекватты комьюнити табу. Араласу барысында көп пайдалы нәрсе үйренесің, саудада көмектесетін білім аласың.
Тегін $50 алу приятно, ал сол білімнің арқасында оны көбейту ол менің жеңісім 💅
#BinancekzWin
Cabbage hater
·Лайков: 0
·Просмотров: 65
BinancePick
Просмотров: 2.6M
141,866 обсуждают
EarningsSeason
Просмотров: 5M
24,385 обсуждают