

CaptainAltcoin
26.8k Публикации

CaptainAltcoin
Отправить жалобу
Заблокировать пользователя
Ahoy, crypto sailors! Navigate the stormy seas of the digital world with CaptainAltcoin, your trusty compass for crypto guides, reviews, and news.
7 подписок(и/а)
101.4K+ подписчиков(а)
94.3K+ понравилось
2 Значки
Посты
Статья
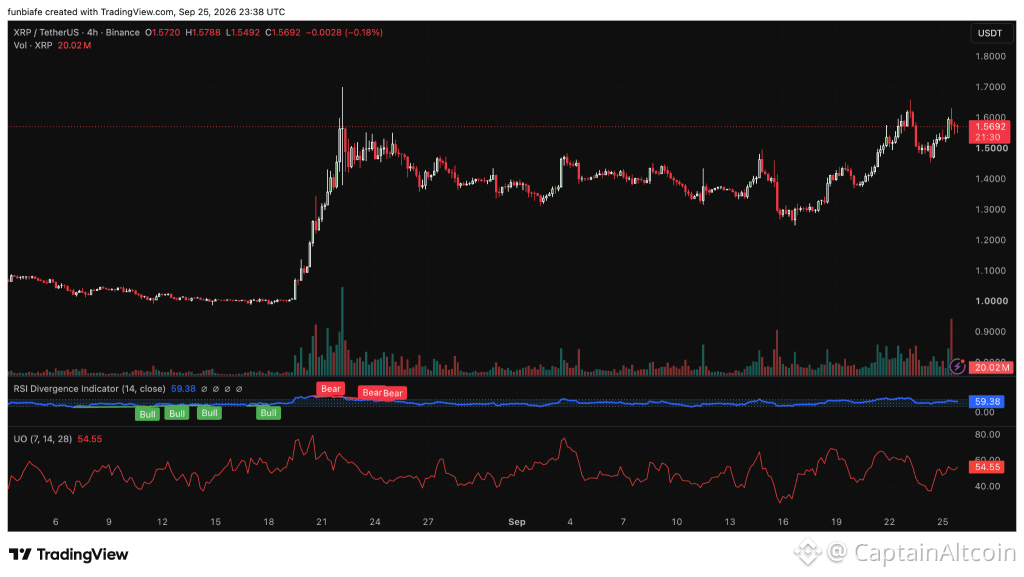
XRP Price Prediction for Today (September 26)In our last XRP daily prediction, we laid out three possible paths. A break above $1.55 could take XRP toward $1.60 and $1.65. Holding between $1.45 and $1.55 would keep the market in consolidation. And a move below $1.45 could send it toward $1.36–$1.37, with $1.25–$1.30 as the next support zone.
XRP ended up moving through several of those levels. After finding support around the mid-$1.40s, buyers pushed it higher, taking XRP to a recent high near $1.70 before the rally cooled off. It’s since pulled back to around $1.57.
That leaves XRP at another key point. It’s still above $1.50, but buyers need to reclaim $1.60 to keep the upside going. For September 26, the main question is whether XRP breaks through $1.60 or falls back toward the $1.50–$1.45 support zone.
What Is the XRP Chart Showing?
The bigger trend still favors the bulls. XRP is sitting comfortably above its 30-day simple moving average at $1.40 and its 200-day simple moving average at $1.39. Holding above both keeps the uptrend intact and gives buyers a solid foundation to work from.
Momentum indicators are also leaning positive. The MACD remains in bullish territory, and the 14-day RSI is sitting at 62.04. That reading shows buying pressure is still present without pushing XRP into overbought territory.
Source: TradingView
We had a look at the XRP chart, and the next challenge is clear. The XRP price is testing the $1.60 area, which has become the first major barrier. If buyers manage to break through it, attention could quickly move to $1.70 and then $1.80.
Fibonacci extension levels point to even higher targets. The 127.2% extension sits near $1.76, while the 161.8% extension comes in around $1.90.
Read Also: XRP Price Stagnation Could Be Hiding Something Huge!
Altcoin Season Is Giving XRP Some Help
The XRP price is also benefiting from stronger conditions across the altcoin market. The Altcoin Season Index has climbed 31.11% over the past week to 59, showing that capital is flowing into altcoins instead of concentrating only in Bitcoin. That type of environment often benefits assets like XRP.
Investor sentiment remains supportive as well. The Crypto Fear and Greed Index is at 72, putting the market in “Greed” territory. Strong sentiment can keep money flowing into risk assets, but it can also leave the market exposed if enthusiasm fades.
There are already some signs of caution. Total crypto market cap dipped 0.17% over the past day, showing some investors are taking profits after the recent rally.
XRP Still Needs a Fresh Catalyst
One thing missing from the current rally is a major XRP-specific development. There have been no major protocol upgrades, regulatory announcements, or adoption updates driving the latest move. That means the XRP price is relying mainly on technical strength and the broader crypto market.
As long as altcoins continue attracting capital, that may be enough to keep the rally going. But without fresh fundamental news, XRP could become more sensitive to swings in overall market sentiment.
The shorter-term indicators show some uncertainty too. The 4-hour RSI is at 59.38, and the Ultimate Oscillator is at 54.55. Both lean bullish. But the chart contains both bullish and bearish divergences, which tells you neither side has fully taken control yet.
Where Could the XRP Price Go Next?
For now, the most important level remains $1.60. A move above that resistance could put $1.70 and $1.80 into view, with Fibonacci targets at $1.76 and $1.90 as extra upside levels to watch.
If buyers can’t break through, support starts at $1.50. Below that, traders will likely turn to $1.40 and $1.30. A deeper drop could bring $1.20, $1.10, and even the psychological $1.00 back into the conversation.
The XRP price still has the advantage because it remains above its major moving averages and continues to benefit from improving altcoin sentiment. The next step is whether buyers can finally clear $1.60 and turn it into support.
FAQs
Can XRP reach $1.70
XRP would first need to break and hold above $1.60. If buyers maintain momentum above that level, $1.70 becomes the next resistance area.
What could drive the XRP price higher
A sustained move above $1.60 could strengthen the upside setup and bring $1.70 and $1.80 into view. Broader crypto-market strength could also influence XRP’s direction.
Subscribe to our YouTube channel for daily crypto updates, market insights, and expert analysis.
The post XRP Price Prediction for Today (September 26) appeared first on CaptainAltcoin.
XRP Price Prediction for Today (September 26)
In our last XRP daily prediction, we laid out three possible paths. A break above $1.55 could take XRP toward $1.60 and $1.65. Holding between $1.45 and $1.55 would keep the market in consolidation. And a move below $1.45 could send it toward $1.36–$1.37, with $1.25–$1.30 as the next support zone.
XRP ended up moving through several of those levels. After finding support around the mid-$1.40s, buyers pushed it higher, taking XRP to a recent high near $1.70 before the rally cooled off. It’s since pulled back to around $1.57.
That leaves XRP at another key point. It’s still above $1.50, but buyers need to reclaim $1.60 to keep the upside going. For September 26, the main question is whether XRP breaks through $1.60 or falls back toward the $1.50–$1.45 support zone.
What Is the XRP Chart Showing?
The bigger trend still favors the bulls. XRP is sitting comfortably above its 30-day simple moving average at $1.40 and its 200-day simple moving average at $1.39. Holding above both keeps the uptrend intact and gives buyers a solid foundation to work from.
Momentum indicators are also leaning positive. The MACD remains in bullish territory, and the 14-day RSI is sitting at 62.04. That reading shows buying pressure is still present without pushing XRP into overbought territory.
Source: TradingView
We had a look at the XRP chart, and the next challenge is clear. The XRP price is testing the $1.60 area, which has become the first major barrier. If buyers manage to break through it, attention could quickly move to $1.70 and then $1.80.
Fibonacci extension levels point to even higher targets. The 127.2% extension sits near $1.76, while the 161.8% extension comes in around $1.90.
Read Also: XRP Price Stagnation Could Be Hiding Something Huge!
Altcoin Season Is Giving XRP Some Help
The XRP price is also benefiting from stronger conditions across the altcoin market. The Altcoin Season Index has climbed 31.11% over the past week to 59, showing that capital is flowing into altcoins instead of concentrating only in Bitcoin. That type of environment often benefits assets like XRP.
Investor sentiment remains supportive as well. The Crypto Fear and Greed Index is at 72, putting the market in “Greed” territory. Strong sentiment can keep money flowing into risk assets, but it can also leave the market exposed if enthusiasm fades.
There are already some signs of caution. Total crypto market cap dipped 0.17% over the past day, showing some investors are taking profits after the recent rally.
XRP Still Needs a Fresh Catalyst
One thing missing from the current rally is a major XRP-specific development. There have been no major protocol upgrades, regulatory announcements, or adoption updates driving the latest move. That means the XRP price is relying mainly on technical strength and the broader crypto market.
As long as altcoins continue attracting capital, that may be enough to keep the rally going. But without fresh fundamental news, XRP could become more sensitive to swings in overall market sentiment.
The shorter-term indicators show some uncertainty too. The 4-hour RSI is at 59.38, and the Ultimate Oscillator is at 54.55. Both lean bullish. But the chart contains both bullish and bearish divergences, which tells you neither side has fully taken control yet.
Where Could the XRP Price Go Next?
For now, the most important level remains $1.60. A move above that resistance could put $1.70 and $1.80 into view, with Fibonacci targets at $1.76 and $1.90 as extra upside levels to watch.
If buyers can’t break through, support starts at $1.50. Below that, traders will likely turn to $1.40 and $1.30. A deeper drop could bring $1.20, $1.10, and even the psychological $1.00 back into the conversation.
The XRP price still has the advantage because it remains above its major moving averages and continues to benefit from improving altcoin sentiment. The next step is whether buyers can finally clear $1.60 and turn it into support.
FAQs
Can XRP reach $1.70
XRP would first need to break and hold above $1.60. If buyers maintain momentum above that level, $1.70 becomes the next resistance area.
What could drive the XRP price higher
A sustained move above $1.60 could strengthen the upside setup and bring $1.70 and $1.80 into view. Broader crypto-market strength could also influence XRP’s direction.
Subscribe to our YouTube channel for daily crypto updates, market insights, and expert analysis.
The post XRP Price Prediction for Today (September 26) appeared first on CaptainAltcoin.
XRP ended up moving through several of those levels. After finding support around the mid-$1.40s, buyers pushed it higher, taking XRP to a recent high near $1.70 before the rally cooled off. It’s since pulled back to around $1.57.
That leaves XRP at another key point. It’s still above $1.50, but buyers need to reclaim $1.60 to keep the upside going. For September 26, the main question is whether XRP breaks through $1.60 or falls back toward the $1.50–$1.45 support zone.
What Is the XRP Chart Showing?
The bigger trend still favors the bulls. XRP is sitting comfortably above its 30-day simple moving average at $1.40 and its 200-day simple moving average at $1.39. Holding above both keeps the uptrend intact and gives buyers a solid foundation to work from.
Momentum indicators are also leaning positive. The MACD remains in bullish territory, and the 14-day RSI is sitting at 62.04. That reading shows buying pressure is still present without pushing XRP into overbought territory.
Source: TradingView
We had a look at the XRP chart, and the next challenge is clear. The XRP price is testing the $1.60 area, which has become the first major barrier. If buyers manage to break through it, attention could quickly move to $1.70 and then $1.80.
Fibonacci extension levels point to even higher targets. The 127.2% extension sits near $1.76, while the 161.8% extension comes in around $1.90.
Read Also: XRP Price Stagnation Could Be Hiding Something Huge!
Altcoin Season Is Giving XRP Some Help
The XRP price is also benefiting from stronger conditions across the altcoin market. The Altcoin Season Index has climbed 31.11% over the past week to 59, showing that capital is flowing into altcoins instead of concentrating only in Bitcoin. That type of environment often benefits assets like XRP.
Investor sentiment remains supportive as well. The Crypto Fear and Greed Index is at 72, putting the market in “Greed” territory. Strong sentiment can keep money flowing into risk assets, but it can also leave the market exposed if enthusiasm fades.
There are already some signs of caution. Total crypto market cap dipped 0.17% over the past day, showing some investors are taking profits after the recent rally.
XRP Still Needs a Fresh Catalyst
One thing missing from the current rally is a major XRP-specific development. There have been no major protocol upgrades, regulatory announcements, or adoption updates driving the latest move. That means the XRP price is relying mainly on technical strength and the broader crypto market.
As long as altcoins continue attracting capital, that may be enough to keep the rally going. But without fresh fundamental news, XRP could become more sensitive to swings in overall market sentiment.
The shorter-term indicators show some uncertainty too. The 4-hour RSI is at 59.38, and the Ultimate Oscillator is at 54.55. Both lean bullish. But the chart contains both bullish and bearish divergences, which tells you neither side has fully taken control yet.
Where Could the XRP Price Go Next?
For now, the most important level remains $1.60. A move above that resistance could put $1.70 and $1.80 into view, with Fibonacci targets at $1.76 and $1.90 as extra upside levels to watch.
If buyers can’t break through, support starts at $1.50. Below that, traders will likely turn to $1.40 and $1.30. A deeper drop could bring $1.20, $1.10, and even the psychological $1.00 back into the conversation.
The XRP price still has the advantage because it remains above its major moving averages and continues to benefit from improving altcoin sentiment. The next step is whether buyers can finally clear $1.60 and turn it into support.
FAQs
Can XRP reach $1.70
XRP would first need to break and hold above $1.60. If buyers maintain momentum above that level, $1.70 becomes the next resistance area.
What could drive the XRP price higher
A sustained move above $1.60 could strengthen the upside setup and bring $1.70 and $1.80 into view. Broader crypto-market strength could also influence XRP’s direction.
Subscribe to our YouTube channel for daily crypto updates, market insights, and expert analysis.
The post XRP Price Prediction for Today (September 26) appeared first on CaptainAltcoin.
2
216
BNB News Gets Real: 28% Gas Boost Lands As Remittix’s Final Stage Is Set At $0.46 and Forecasters...BNB is holding near $775 as traders assess the impact of faster block processing and reported gas-throughput improvements around the network’s latest upgrade. A 28% gas boost can improve capacity, but the long-term BNB price response will depend on whether developers and users turn that performance into sustained activity.
Remittix has its own valuation debate. RTX is not currently $0.46; it remains available at $0.21, with $0.46 designated as the final presale-stage price. Forecasts around $3 are speculative, yet a confirmed launch and growing ecosystem give buyers concrete reasons to examine the bull case.
BNB Price Outlook Depends on Usage After the Upgrade
BNB benefits from its role across BNB Chain applications and its connection with a leading global exchange ecosystem. Faster blocks and improved gas performance can make decentralised applications more responsive while increasing the network’s ability to process activity.
Technical improvement does not guarantee token appreciation. Transaction counts, fee generation, application liquidity and token burns remain important. BNB must also overcome resistance near $800 before a stronger price expansion becomes convincing.
At its current size, BNB can deliver meaningful gains without reproducing the extreme multiples early holders once received. Growth-focused buyers therefore continue comparing it with smaller platforms before launch.
BNB’s strength remains its deeply established distribution. Developers can reach exchange-linked users, liquidity is extensive and the chain already supports payments, games and DeFi. The trade-off is mathematical: another 10x would require an enormous increase in network value. A young token can potentially respond more sharply to the same amount of incoming capital, provided its launch attracts enough buyers and sellers to form a healthy market.
Remittix Targets Payments, Trading and Yield Together
Remittix PayFi is designed to move digital assets into compatible bank accounts in local currency. Planned coverage across more than 30 fiat denominations could make the network relevant to invoices, remittances and business settlement.
Remittix Markets is already operating with hundreds of perpetual pairs and millions in reported volume. The project’s iOS wallet has exceeded 10,000 reported downloads, a Google Play release is planned and Remittix Earn is nearing release testing with selected returns advertised up to 22% APY.
The intended wallet rebuild joins these functions around RTX, creating a one-stop environment rather than a token attached to a single feature.
Could RTX Reach the $3 Bull Case?
Remittix reports more than $32 million raised from over 40,000 participants and has confirmed 24 November 2026 as the scheduled token debut. Contributions stop at $36 million, placing a clear ceiling on the remaining presale.
A move from $0.21 to $3 would equal approximately 14.3x. Reaching that price would require successful listings, deep liquidity, user conversion and continued product delivery. The target is a bullish scenario, not an assured outcome.
BNB offers an established network whose upgrades can support steady adoption. RTX offers the chance to enter before exchanges, integrated products and a broader audience establish its value. If Remittix converts its existing trading users and wallet holders into PayFi and Earn customers, the token could benefit from demand that comes from several directions. The $0.46 final stage may reward early presale positioning, but the larger opportunity is owning exposure before Remittix attempts to become a major crypto-finance hub.
Discover the future of PayFi with Remittix by checking out their project here:
WebsiteX
Frequently Asked Questions
Is BNB currently above $800?No. BNB was near $775 when checked, leaving $800 as nearby resistance.
Has RTX reached $0.46?No. The current presale price is $0.21; $0.46 refers to the final stage.
Is the $3 RTX forecast guaranteed?No. It is a speculative scenario that depends on execution, adoption, liquidity and market conditions.
DISCLAIMER: CAPTAINALTCOIN DOES NOT ENDORSE INVESTING IN ANY PROJECT MENTIONED IN SPONSORED ARTICLES. EXERCISE CAUTION AND DO THOROUGH RESEARCH BEFORE INVESTING YOUR MONEY. CaptainAltcoin takes no responsibility for its accuracy or quality. This content was not written by CaptainAltcoin’s team. We strongly advise readers to do their own thorough research before interacting with any featured companies. The information provided is not financial or legal advice. Neither CaptainAltcoin nor any third party recommends buying or selling any financial products. Investing in crypto assets is high-risk; consider the potential for loss. Any investment decisions made based on this content are at the sole risk of the readCaptainAltcoin is not liable for any damages or losses from using or relying on this content.
The post BNB News Gets Real: 28% Gas Boost Lands as Remittix’s Final Stage Is Set at $0.46 and Forecasters Point to $3 appeared first on CaptainAltcoin.
BNB News Gets Real: 28% Gas Boost Lands As Remittix’s Final Stage Is Set At $0.46 and Forecasters...
BNB is holding near $775 as traders assess the impact of faster block processing and reported gas-throughput improvements around the network’s latest upgrade. A 28% gas boost can improve capacity, but the long-term BNB price response will depend on whether developers and users turn that performance into sustained activity.
Remittix has its own valuation debate. RTX is not currently $0.46; it remains available at $0.21, with $0.46 designated as the final presale-stage price. Forecasts around $3 are speculative, yet a confirmed launch and growing ecosystem give buyers concrete reasons to examine the bull case.
BNB Price Outlook Depends on Usage After the Upgrade
BNB benefits from its role across BNB Chain applications and its connection with a leading global exchange ecosystem. Faster blocks and improved gas performance can make decentralised applications more responsive while increasing the network’s ability to process activity.
Technical improvement does not guarantee token appreciation. Transaction counts, fee generation, application liquidity and token burns remain important. BNB must also overcome resistance near $800 before a stronger price expansion becomes convincing.
At its current size, BNB can deliver meaningful gains without reproducing the extreme multiples early holders once received. Growth-focused buyers therefore continue comparing it with smaller platforms before launch.
BNB’s strength remains its deeply established distribution. Developers can reach exchange-linked users, liquidity is extensive and the chain already supports payments, games and DeFi. The trade-off is mathematical: another 10x would require an enormous increase in network value. A young token can potentially respond more sharply to the same amount of incoming capital, provided its launch attracts enough buyers and sellers to form a healthy market.
Remittix Targets Payments, Trading and Yield Together
Remittix PayFi is designed to move digital assets into compatible bank accounts in local currency. Planned coverage across more than 30 fiat denominations could make the network relevant to invoices, remittances and business settlement.
Remittix Markets is already operating with hundreds of perpetual pairs and millions in reported volume. The project’s iOS wallet has exceeded 10,000 reported downloads, a Google Play release is planned and Remittix Earn is nearing release testing with selected returns advertised up to 22% APY.
The intended wallet rebuild joins these functions around RTX, creating a one-stop environment rather than a token attached to a single feature.
Could RTX Reach the $3 Bull Case?
Remittix reports more than $32 million raised from over 40,000 participants and has confirmed 24 November 2026 as the scheduled token debut. Contributions stop at $36 million, placing a clear ceiling on the remaining presale.
A move from $0.21 to $3 would equal approximately 14.3x. Reaching that price would require successful listings, deep liquidity, user conversion and continued product delivery. The target is a bullish scenario, not an assured outcome.
BNB offers an established network whose upgrades can support steady adoption. RTX offers the chance to enter before exchanges, integrated products and a broader audience establish its value. If Remittix converts its existing trading users and wallet holders into PayFi and Earn customers, the token could benefit from demand that comes from several directions. The $0.46 final stage may reward early presale positioning, but the larger opportunity is owning exposure before Remittix attempts to become a major crypto-finance hub.
Discover the future of PayFi with Remittix by checking out their project here:
WebsiteX
Frequently Asked Questions
Is BNB currently above $800?No. BNB was near $775 when checked, leaving $800 as nearby resistance.
Has RTX reached $0.46?No. The current presale price is $0.21; $0.46 refers to the final stage.
Is the $3 RTX forecast guaranteed?No. It is a speculative scenario that depends on execution, adoption, liquidity and market conditions.
DISCLAIMER: CAPTAINALTCOIN DOES NOT ENDORSE INVESTING IN ANY PROJECT MENTIONED IN SPONSORED ARTICLES. EXERCISE CAUTION AND DO THOROUGH RESEARCH BEFORE INVESTING YOUR MONEY. CaptainAltcoin takes no responsibility for its accuracy or quality. This content was not written by CaptainAltcoin’s team. We strongly advise readers to do their own thorough research before interacting with any featured companies. The information provided is not financial or legal advice. Neither CaptainAltcoin nor any third party recommends buying or selling any financial products. Investing in crypto assets is high-risk; consider the potential for loss. Any investment decisions made based on this content are at the sole risk of the readCaptainAltcoin is not liable for any damages or losses from using or relying on this content.
The post BNB News Gets Real: 28% Gas Boost Lands as Remittix’s Final Stage Is Set at $0.46 and Forecasters Point to $3 appeared first on CaptainAltcoin.
Remittix has its own valuation debate. RTX is not currently $0.46; it remains available at $0.21, with $0.46 designated as the final presale-stage price. Forecasts around $3 are speculative, yet a confirmed launch and growing ecosystem give buyers concrete reasons to examine the bull case.
BNB Price Outlook Depends on Usage After the Upgrade
BNB benefits from its role across BNB Chain applications and its connection with a leading global exchange ecosystem. Faster blocks and improved gas performance can make decentralised applications more responsive while increasing the network’s ability to process activity.
Technical improvement does not guarantee token appreciation. Transaction counts, fee generation, application liquidity and token burns remain important. BNB must also overcome resistance near $800 before a stronger price expansion becomes convincing.
At its current size, BNB can deliver meaningful gains without reproducing the extreme multiples early holders once received. Growth-focused buyers therefore continue comparing it with smaller platforms before launch.
BNB’s strength remains its deeply established distribution. Developers can reach exchange-linked users, liquidity is extensive and the chain already supports payments, games and DeFi. The trade-off is mathematical: another 10x would require an enormous increase in network value. A young token can potentially respond more sharply to the same amount of incoming capital, provided its launch attracts enough buyers and sellers to form a healthy market.
Remittix Targets Payments, Trading and Yield Together
Remittix PayFi is designed to move digital assets into compatible bank accounts in local currency. Planned coverage across more than 30 fiat denominations could make the network relevant to invoices, remittances and business settlement.
Remittix Markets is already operating with hundreds of perpetual pairs and millions in reported volume. The project’s iOS wallet has exceeded 10,000 reported downloads, a Google Play release is planned and Remittix Earn is nearing release testing with selected returns advertised up to 22% APY.
The intended wallet rebuild joins these functions around RTX, creating a one-stop environment rather than a token attached to a single feature.
Could RTX Reach the $3 Bull Case?
Remittix reports more than $32 million raised from over 40,000 participants and has confirmed 24 November 2026 as the scheduled token debut. Contributions stop at $36 million, placing a clear ceiling on the remaining presale.
A move from $0.21 to $3 would equal approximately 14.3x. Reaching that price would require successful listings, deep liquidity, user conversion and continued product delivery. The target is a bullish scenario, not an assured outcome.
BNB offers an established network whose upgrades can support steady adoption. RTX offers the chance to enter before exchanges, integrated products and a broader audience establish its value. If Remittix converts its existing trading users and wallet holders into PayFi and Earn customers, the token could benefit from demand that comes from several directions. The $0.46 final stage may reward early presale positioning, but the larger opportunity is owning exposure before Remittix attempts to become a major crypto-finance hub.
Discover the future of PayFi with Remittix by checking out their project here:
WebsiteX
Frequently Asked Questions
Is BNB currently above $800?No. BNB was near $775 when checked, leaving $800 as nearby resistance.
Has RTX reached $0.46?No. The current presale price is $0.21; $0.46 refers to the final stage.
Is the $3 RTX forecast guaranteed?No. It is a speculative scenario that depends on execution, adoption, liquidity and market conditions.
DISCLAIMER: CAPTAINALTCOIN DOES NOT ENDORSE INVESTING IN ANY PROJECT MENTIONED IN SPONSORED ARTICLES. EXERCISE CAUTION AND DO THOROUGH RESEARCH BEFORE INVESTING YOUR MONEY. CaptainAltcoin takes no responsibility for its accuracy or quality. This content was not written by CaptainAltcoin’s team. We strongly advise readers to do their own thorough research before interacting with any featured companies. The information provided is not financial or legal advice. Neither CaptainAltcoin nor any third party recommends buying or selling any financial products. Investing in crypto assets is high-risk; consider the potential for loss. Any investment decisions made based on this content are at the sole risk of the readCaptainAltcoin is not liable for any damages or losses from using or relying on this content.
The post BNB News Gets Real: 28% Gas Boost Lands as Remittix’s Final Stage Is Set at $0.46 and Forecasters Point to $3 appeared first on CaptainAltcoin.
1
123
Top Crypto Presale 2026: Remittix Confirms Its Launch Date As PayFi Momentum AcceleratesThe strongest crypto presales in 2026 are being judged on more than fundraising totals. Buyers increasingly want working products, transparent milestones and a credible route from token sale to public trading. Remittix has now answered that test by crossing $32 million and confirming a scheduled launch date for RTX.
The timing places Remittix at the centre of the PayFi conversation. Its core proposition connects crypto with supported bank accounts, while live trading, mobile access and a planned earning service broaden the addressable audience. The token is no longer selling an undefined future; it is entering a dated countdown with an ecosystem already visible.
PayFi Gives Remittix a Large Real-World Target
Crypto ownership has expanded faster than crypto usability. Users can hold thousands of assets, but converting them into local money still involves exchanges, multiple transfers and uncertain processing times. Remittix aims to simplify that path through crypto-to-bank settlement across more than 30 fiat currencies.
The potential audience reaches beyond traders. Freelancers could receive cross-border income, businesses could settle invoices and families could transfer value without requiring every recipient to understand wallets or exchanges. Genuine PayFi transactions have reportedly been completed during testing, giving the project evidence of product progress rather than a purely theoretical roadmap.
That real-world focus distinguishes Remittix from presales whose only demand case is the expectation that someone else will pay more after launch.
The Ecosystem Creates Multiple Reasons to Hold RTX
Remittix Markets is already live with hundreds of perpetual-futures pairs and millions in reported volume. This gives active traders a reason to enter the brand before PayFi becomes widely available. The iOS wallet, downloaded more than 10,000 times according to the project, provides a second entry point, while Android support is planned.
Remittix Earn is in final testing and advertises yields of up to 22% APY on selected crypto and stablecoin assets. The project also plans a wallet rebuild that unifies PayFi, Markets, Earn and RTX within one experience.
That one-stop structure matters because sustainable ecosystems are built around repeated activity. A user might arrive to trade, remain to store assets, explore earning and ultimately use crypto-to-bank payments. Each additional function can deepen engagement without requiring Remittix to acquire the same user repeatedly.
The Confirmed Launch Turns Attention Into Urgency
Remittix has scheduled RTX to launch on 24 November 2026 after attracting more than 40,000 reported participants. The presale remains capped at $36 million. RTX is currently available at $0.21, while $0.46 is the final presale-stage price.
This creates a defined window in which buyers can enter before exchange liquidity and public price discovery. It also gives the community a deadline against which product announcements, integrations and launch preparation can be measured. The dashboard improves transparency during that transition.
No presale is guaranteed to succeed, but Remittix now combines several characteristics opportunity hunters seek: a large addressable market, products delivered before launch, community scale, capped fundraising and a fixed debut. If PayFi becomes one of the next major crypto sectors, RTX could reach public markets as one of its most developed new entrants. Waiting until every risk is gone may also mean waiting until the early price is gone with it.
Discover the future of PayFi with Remittix by checking out their project here:
WebsiteX
Frequently Asked Questions
Why is Remittix considered a PayFi presale?Its central product is designed to connect crypto transfers with fiat settlement into supported bank accounts.
How much has Remittix raised?The project reports that its presale has crossed the $32 million milestone.
When is RTX scheduled to begin public trading?The project has announced 24 November 2026 as its scheduled token launch date.
DISCLAIMER: CAPTAINALTCOIN DOES NOT ENDORSE INVESTING IN ANY PROJECT MENTIONED IN SPONSORED ARTICLES. EXERCISE CAUTION AND DO THOROUGH RESEARCH BEFORE INVESTING YOUR MONEY. CaptainAltcoin takes no responsibility for its accuracy or quality. This content was not written by CaptainAltcoin’s team. We strongly advise readers to do their own thorough research before interacting with any featured companies. The information provided is not financial or legal advice. Neither CaptainAltcoin nor any third party recommends buying or selling any financial products. Investing in crypto assets is high-risk; consider the potential for loss. Any investment decisions made based on this content are at the sole risk of the readCaptainAltcoin is not liable for any damages or losses from using or relying on this content.
The post Top Crypto Presale 2026: Remittix Confirms Its Launch Date as PayFi Momentum Accelerates appeared first on CaptainAltcoin.
Top Crypto Presale 2026: Remittix Confirms Its Launch Date As PayFi Momentum Accelerates
The strongest crypto presales in 2026 are being judged on more than fundraising totals. Buyers increasingly want working products, transparent milestones and a credible route from token sale to public trading. Remittix has now answered that test by crossing $32 million and confirming a scheduled launch date for RTX.
The timing places Remittix at the centre of the PayFi conversation. Its core proposition connects crypto with supported bank accounts, while live trading, mobile access and a planned earning service broaden the addressable audience. The token is no longer selling an undefined future; it is entering a dated countdown with an ecosystem already visible.
PayFi Gives Remittix a Large Real-World Target
Crypto ownership has expanded faster than crypto usability. Users can hold thousands of assets, but converting them into local money still involves exchanges, multiple transfers and uncertain processing times. Remittix aims to simplify that path through crypto-to-bank settlement across more than 30 fiat currencies.
The potential audience reaches beyond traders. Freelancers could receive cross-border income, businesses could settle invoices and families could transfer value without requiring every recipient to understand wallets or exchanges. Genuine PayFi transactions have reportedly been completed during testing, giving the project evidence of product progress rather than a purely theoretical roadmap.
That real-world focus distinguishes Remittix from presales whose only demand case is the expectation that someone else will pay more after launch.
The Ecosystem Creates Multiple Reasons to Hold RTX
Remittix Markets is already live with hundreds of perpetual-futures pairs and millions in reported volume. This gives active traders a reason to enter the brand before PayFi becomes widely available. The iOS wallet, downloaded more than 10,000 times according to the project, provides a second entry point, while Android support is planned.
Remittix Earn is in final testing and advertises yields of up to 22% APY on selected crypto and stablecoin assets. The project also plans a wallet rebuild that unifies PayFi, Markets, Earn and RTX within one experience.
That one-stop structure matters because sustainable ecosystems are built around repeated activity. A user might arrive to trade, remain to store assets, explore earning and ultimately use crypto-to-bank payments. Each additional function can deepen engagement without requiring Remittix to acquire the same user repeatedly.
The Confirmed Launch Turns Attention Into Urgency
Remittix has scheduled RTX to launch on 24 November 2026 after attracting more than 40,000 reported participants. The presale remains capped at $36 million. RTX is currently available at $0.21, while $0.46 is the final presale-stage price.
This creates a defined window in which buyers can enter before exchange liquidity and public price discovery. It also gives the community a deadline against which product announcements, integrations and launch preparation can be measured. The dashboard improves transparency during that transition.
No presale is guaranteed to succeed, but Remittix now combines several characteristics opportunity hunters seek: a large addressable market, products delivered before launch, community scale, capped fundraising and a fixed debut. If PayFi becomes one of the next major crypto sectors, RTX could reach public markets as one of its most developed new entrants. Waiting until every risk is gone may also mean waiting until the early price is gone with it.
Discover the future of PayFi with Remittix by checking out their project here:
WebsiteX
Frequently Asked Questions
Why is Remittix considered a PayFi presale?Its central product is designed to connect crypto transfers with fiat settlement into supported bank accounts.
How much has Remittix raised?The project reports that its presale has crossed the $32 million milestone.
When is RTX scheduled to begin public trading?The project has announced 24 November 2026 as its scheduled token launch date.
DISCLAIMER: CAPTAINALTCOIN DOES NOT ENDORSE INVESTING IN ANY PROJECT MENTIONED IN SPONSORED ARTICLES. EXERCISE CAUTION AND DO THOROUGH RESEARCH BEFORE INVESTING YOUR MONEY. CaptainAltcoin takes no responsibility for its accuracy or quality. This content was not written by CaptainAltcoin’s team. We strongly advise readers to do their own thorough research before interacting with any featured companies. The information provided is not financial or legal advice. Neither CaptainAltcoin nor any third party recommends buying or selling any financial products. Investing in crypto assets is high-risk; consider the potential for loss. Any investment decisions made based on this content are at the sole risk of the readCaptainAltcoin is not liable for any damages or losses from using or relying on this content.
The post Top Crypto Presale 2026: Remittix Confirms Its Launch Date as PayFi Momentum Accelerates appeared first on CaptainAltcoin.
The timing places Remittix at the centre of the PayFi conversation. Its core proposition connects crypto with supported bank accounts, while live trading, mobile access and a planned earning service broaden the addressable audience. The token is no longer selling an undefined future; it is entering a dated countdown with an ecosystem already visible.
PayFi Gives Remittix a Large Real-World Target
Crypto ownership has expanded faster than crypto usability. Users can hold thousands of assets, but converting them into local money still involves exchanges, multiple transfers and uncertain processing times. Remittix aims to simplify that path through crypto-to-bank settlement across more than 30 fiat currencies.
The potential audience reaches beyond traders. Freelancers could receive cross-border income, businesses could settle invoices and families could transfer value without requiring every recipient to understand wallets or exchanges. Genuine PayFi transactions have reportedly been completed during testing, giving the project evidence of product progress rather than a purely theoretical roadmap.
That real-world focus distinguishes Remittix from presales whose only demand case is the expectation that someone else will pay more after launch.
The Ecosystem Creates Multiple Reasons to Hold RTX
Remittix Markets is already live with hundreds of perpetual-futures pairs and millions in reported volume. This gives active traders a reason to enter the brand before PayFi becomes widely available. The iOS wallet, downloaded more than 10,000 times according to the project, provides a second entry point, while Android support is planned.
Remittix Earn is in final testing and advertises yields of up to 22% APY on selected crypto and stablecoin assets. The project also plans a wallet rebuild that unifies PayFi, Markets, Earn and RTX within one experience.
That one-stop structure matters because sustainable ecosystems are built around repeated activity. A user might arrive to trade, remain to store assets, explore earning and ultimately use crypto-to-bank payments. Each additional function can deepen engagement without requiring Remittix to acquire the same user repeatedly.
The Confirmed Launch Turns Attention Into Urgency
Remittix has scheduled RTX to launch on 24 November 2026 after attracting more than 40,000 reported participants. The presale remains capped at $36 million. RTX is currently available at $0.21, while $0.46 is the final presale-stage price.
This creates a defined window in which buyers can enter before exchange liquidity and public price discovery. It also gives the community a deadline against which product announcements, integrations and launch preparation can be measured. The dashboard improves transparency during that transition.
No presale is guaranteed to succeed, but Remittix now combines several characteristics opportunity hunters seek: a large addressable market, products delivered before launch, community scale, capped fundraising and a fixed debut. If PayFi becomes one of the next major crypto sectors, RTX could reach public markets as one of its most developed new entrants. Waiting until every risk is gone may also mean waiting until the early price is gone with it.
Discover the future of PayFi with Remittix by checking out their project here:
WebsiteX
Frequently Asked Questions
Why is Remittix considered a PayFi presale?Its central product is designed to connect crypto transfers with fiat settlement into supported bank accounts.
How much has Remittix raised?The project reports that its presale has crossed the $32 million milestone.
When is RTX scheduled to begin public trading?The project has announced 24 November 2026 as its scheduled token launch date.
DISCLAIMER: CAPTAINALTCOIN DOES NOT ENDORSE INVESTING IN ANY PROJECT MENTIONED IN SPONSORED ARTICLES. EXERCISE CAUTION AND DO THOROUGH RESEARCH BEFORE INVESTING YOUR MONEY. CaptainAltcoin takes no responsibility for its accuracy or quality. This content was not written by CaptainAltcoin’s team. We strongly advise readers to do their own thorough research before interacting with any featured companies. The information provided is not financial or legal advice. Neither CaptainAltcoin nor any third party recommends buying or selling any financial products. Investing in crypto assets is high-risk; consider the potential for loss. Any investment decisions made based on this content are at the sole risk of the readCaptainAltcoin is not liable for any damages or losses from using or relying on this content.
The post Top Crypto Presale 2026: Remittix Confirms Its Launch Date as PayFi Momentum Accelerates appeared first on CaptainAltcoin.
115
Статья
Claude AI Predicts Where Bitcoin Price Could Be After the Bond Market MeltdownThe Bitcoin price is near $83,733, but plenty of investors have their eyes on a different market: U.S. Treasury bonds. Scott Melker noted that the 10-year Treasury yield has climbed to 5.196%, the highest since 2007. The 30-year yield hit 5.4816%, a level not seen since 2004.
Those numbers matter because they raise the bar for everything else. If you can earn over 5% from U.S. government debt, riskier assets like stocks and crypto have to offer a much better reason to hold them.
Melker also pointed out that markets are pricing in about a 71% chance of another Fed rate hike in October. Throw in weak demand at Treasury auctions, and it’s easy to see why yields keep climbing.
Claude AI Maps Out Bitcoin’s Next Move
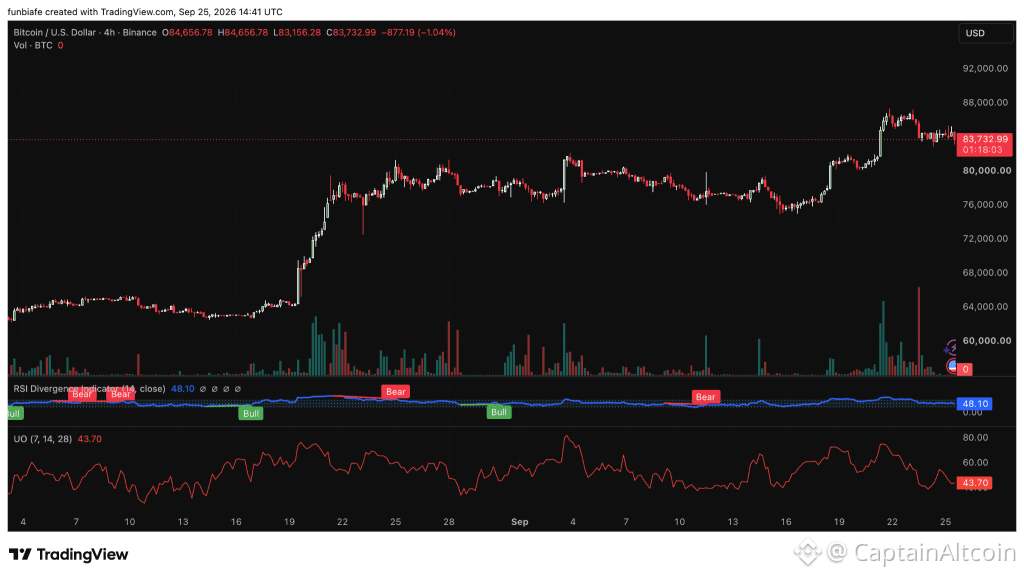
Claude AI believes the bond market could play a major role in determining where Bitcoin goes next. Right now, Bitcoin is moving inside a pretty clear range. We analysed the BTC chart, and it’s spent the past several weeks trading between roughly $80,000 and $88,000 after rallying from around $60,000 earlier in the cycle.
Source: TradingView
The indicators aren’t giving a clear answer yet. RSI is at 48.10, almost perfectly neutral. The Ultimate Oscillator is at 43.70. The chart even shows both bullish and bearish divergences, which usually means the market is waiting for a catalyst before making its next big move. For now, neither buyers nor sellers have taken full control.
The Bullish Case if Bond Yields Finally Cool
Claude AI sees a more favorable outlook for Bitcoin if pressure in the bond market starts to ease. The first hurdle for the Bitcoin price is $84,000. Beyond that, resistance levels sit at $86,000 and $88,000. If those barriers break, the next target on the chart is around $92,000.
Source: Claude AI
One thing working in Bitcoin’s favor is resilience. Even with Treasury yields at levels not seen in many years, the BTC price has managed to stay above the important $80,000 support area. If concerns around future rate hikes begin to fade and yields stop climbing, Bitcoin could have room to move back toward its recent highs.
Read Also: Crypto News Today: Bitcoin Faces $16B Test as BlackRock Makes Big Move
What Happens to BTC if the Bond Crisis Gets Worse
The risk is that bond yields continue moving higher. Claude AI warns that a prolonged rise in yields could pull money away from speculative assets and into government debt. If that happens, Bitcoin could come under pressure.
The first level to watch is $80,000. If that support gives way, the next downside targets are $76,000 and $72,000. Below those, the chart points to support around $68,000, $64,000, and eventually the broader support zone near $60,000. That doesn’t mean those levels will get hit. But they become relevant if selling pressure picks up.
Where Bitcoin Price Could Land by the End of 2026
Claude AI’s outlook comes down to one key question: can the bond market calm down? If yields stabilize and liquidity improves, Bitcoin could push back above $88,000, challenge $92,000, and keep climbing through 2026.
If yields keep rising and financial conditions tighten further, Bitcoin may struggle to hold $80,000 and could spend time testing lower support between $72,000 and $60,000.
For now, Bitcoin is stuck between two important levels. Buyers need a move above $84,000 to strengthen the bullish case. Sellers need a break below $80,000 to gain the upper hand. Until one of those levels breaks, Bitcoin remains in waiting mode, with the bond market likely holding the key to what happens next.
FAQs
Can Bitcoin and bonds rise at the same time
Yes. Although they often compete for investor capital, there have been periods where both Bitcoin and bond yields moved higher together. Market sentiment, liquidity, and economic conditions all play a role.
What is the biggest risk to the Bitcoin price right now
The biggest risk is a further rise in Treasury yields combined with additional Federal Reserve tightening. That combination could reduce liquidity and create a tougher environment for risk assets.
Subscribe to our YouTube channel for daily crypto updates, market insights, and expert analysis.
The post Claude AI Predicts Where Bitcoin Price Could Be After the Bond Market Meltdown appeared first on CaptainAltcoin.
Claude AI Predicts Where Bitcoin Price Could Be After the Bond Market Meltdown
The Bitcoin price is near $83,733, but plenty of investors have their eyes on a different market: U.S. Treasury bonds. Scott Melker noted that the 10-year Treasury yield has climbed to 5.196%, the highest since 2007. The 30-year yield hit 5.4816%, a level not seen since 2004.
Those numbers matter because they raise the bar for everything else. If you can earn over 5% from U.S. government debt, riskier assets like stocks and crypto have to offer a much better reason to hold them.
Melker also pointed out that markets are pricing in about a 71% chance of another Fed rate hike in October. Throw in weak demand at Treasury auctions, and it’s easy to see why yields keep climbing.
Claude AI Maps Out Bitcoin’s Next Move
Claude AI believes the bond market could play a major role in determining where Bitcoin goes next. Right now, Bitcoin is moving inside a pretty clear range. We analysed the BTC chart, and it’s spent the past several weeks trading between roughly $80,000 and $88,000 after rallying from around $60,000 earlier in the cycle.
Source: TradingView
The indicators aren’t giving a clear answer yet. RSI is at 48.10, almost perfectly neutral. The Ultimate Oscillator is at 43.70. The chart even shows both bullish and bearish divergences, which usually means the market is waiting for a catalyst before making its next big move. For now, neither buyers nor sellers have taken full control.
The Bullish Case if Bond Yields Finally Cool
Claude AI sees a more favorable outlook for Bitcoin if pressure in the bond market starts to ease. The first hurdle for the Bitcoin price is $84,000. Beyond that, resistance levels sit at $86,000 and $88,000. If those barriers break, the next target on the chart is around $92,000.
Source: Claude AI
One thing working in Bitcoin’s favor is resilience. Even with Treasury yields at levels not seen in many years, the BTC price has managed to stay above the important $80,000 support area. If concerns around future rate hikes begin to fade and yields stop climbing, Bitcoin could have room to move back toward its recent highs.
Read Also: Crypto News Today: Bitcoin Faces $16B Test as BlackRock Makes Big Move
What Happens to BTC if the Bond Crisis Gets Worse
The risk is that bond yields continue moving higher. Claude AI warns that a prolonged rise in yields could pull money away from speculative assets and into government debt. If that happens, Bitcoin could come under pressure.
The first level to watch is $80,000. If that support gives way, the next downside targets are $76,000 and $72,000. Below those, the chart points to support around $68,000, $64,000, and eventually the broader support zone near $60,000. That doesn’t mean those levels will get hit. But they become relevant if selling pressure picks up.
Where Bitcoin Price Could Land by the End of 2026
Claude AI’s outlook comes down to one key question: can the bond market calm down? If yields stabilize and liquidity improves, Bitcoin could push back above $88,000, challenge $92,000, and keep climbing through 2026.
If yields keep rising and financial conditions tighten further, Bitcoin may struggle to hold $80,000 and could spend time testing lower support between $72,000 and $60,000.
For now, Bitcoin is stuck between two important levels. Buyers need a move above $84,000 to strengthen the bullish case. Sellers need a break below $80,000 to gain the upper hand. Until one of those levels breaks, Bitcoin remains in waiting mode, with the bond market likely holding the key to what happens next.
FAQs
Can Bitcoin and bonds rise at the same time
Yes. Although they often compete for investor capital, there have been periods where both Bitcoin and bond yields moved higher together. Market sentiment, liquidity, and economic conditions all play a role.
What is the biggest risk to the Bitcoin price right now
The biggest risk is a further rise in Treasury yields combined with additional Federal Reserve tightening. That combination could reduce liquidity and create a tougher environment for risk assets.
Subscribe to our YouTube channel for daily crypto updates, market insights, and expert analysis.
The post Claude AI Predicts Where Bitcoin Price Could Be After the Bond Market Meltdown appeared first on CaptainAltcoin.
Those numbers matter because they raise the bar for everything else. If you can earn over 5% from U.S. government debt, riskier assets like stocks and crypto have to offer a much better reason to hold them.
Melker also pointed out that markets are pricing in about a 71% chance of another Fed rate hike in October. Throw in weak demand at Treasury auctions, and it’s easy to see why yields keep climbing.
Claude AI Maps Out Bitcoin’s Next Move
Claude AI believes the bond market could play a major role in determining where Bitcoin goes next. Right now, Bitcoin is moving inside a pretty clear range. We analysed the BTC chart, and it’s spent the past several weeks trading between roughly $80,000 and $88,000 after rallying from around $60,000 earlier in the cycle.
Source: TradingView
The indicators aren’t giving a clear answer yet. RSI is at 48.10, almost perfectly neutral. The Ultimate Oscillator is at 43.70. The chart even shows both bullish and bearish divergences, which usually means the market is waiting for a catalyst before making its next big move. For now, neither buyers nor sellers have taken full control.
The Bullish Case if Bond Yields Finally Cool
Claude AI sees a more favorable outlook for Bitcoin if pressure in the bond market starts to ease. The first hurdle for the Bitcoin price is $84,000. Beyond that, resistance levels sit at $86,000 and $88,000. If those barriers break, the next target on the chart is around $92,000.
Source: Claude AI
One thing working in Bitcoin’s favor is resilience. Even with Treasury yields at levels not seen in many years, the BTC price has managed to stay above the important $80,000 support area. If concerns around future rate hikes begin to fade and yields stop climbing, Bitcoin could have room to move back toward its recent highs.
Read Also: Crypto News Today: Bitcoin Faces $16B Test as BlackRock Makes Big Move
What Happens to BTC if the Bond Crisis Gets Worse
The risk is that bond yields continue moving higher. Claude AI warns that a prolonged rise in yields could pull money away from speculative assets and into government debt. If that happens, Bitcoin could come under pressure.
The first level to watch is $80,000. If that support gives way, the next downside targets are $76,000 and $72,000. Below those, the chart points to support around $68,000, $64,000, and eventually the broader support zone near $60,000. That doesn’t mean those levels will get hit. But they become relevant if selling pressure picks up.
Where Bitcoin Price Could Land by the End of 2026
Claude AI’s outlook comes down to one key question: can the bond market calm down? If yields stabilize and liquidity improves, Bitcoin could push back above $88,000, challenge $92,000, and keep climbing through 2026.
If yields keep rising and financial conditions tighten further, Bitcoin may struggle to hold $80,000 and could spend time testing lower support between $72,000 and $60,000.
For now, Bitcoin is stuck between two important levels. Buyers need a move above $84,000 to strengthen the bullish case. Sellers need a break below $80,000 to gain the upper hand. Until one of those levels breaks, Bitcoin remains in waiting mode, with the bond market likely holding the key to what happens next.
FAQs
Can Bitcoin and bonds rise at the same time
Yes. Although they often compete for investor capital, there have been periods where both Bitcoin and bond yields moved higher together. Market sentiment, liquidity, and economic conditions all play a role.
What is the biggest risk to the Bitcoin price right now
The biggest risk is a further rise in Treasury yields combined with additional Federal Reserve tightening. That combination could reduce liquidity and create a tougher environment for risk assets.
Subscribe to our YouTube channel for daily crypto updates, market insights, and expert analysis.
The post Claude AI Predicts Where Bitcoin Price Could Be After the Bond Market Meltdown appeared first on CaptainAltcoin.
1
186
XRP Price Forecast: XRP Could Turn $400 Into $1,400, but Remittix Bulls Are Targeting $10XRP trades near $1.55 after another positive session, keeping ambitious recovery forecasts alive. Turning $400 into $1,400 would require a 3.5x gain, placing XRP near $5.43 if the entire allocation tracked price perfectly. That is possible only as a bullish scenario, not a prediction investors should treat as certain.
Some Remittix supporters discuss an even more aggressive $10 RTX target. The appeal is not simply a large number: RTX remains at $0.21 before public trading, while a PayFi, markets, wallet and earning ecosystem is moving toward a fixed launch date. The debate therefore centres on established payments exposure versus much earlier price discovery.
What XRP Needs to Turn $400 Into $1,400
XRP would need sustained institutional demand, wider payment use and a favourable regulatory environment to deliver a 3.5x move. Its role in the XRP Ledger ecosystem and Ripple-linked payment narrative provides a substantial foundation, while recent whale activity has kept traders attentive.
However, XRP already carries a large market capitalisation. A move toward $5.43 would add enormous value, requiring more than a brief speculative rally. Technical breakouts would need to hold, liquidity would need to deepen and sellers accumulated over years would have to be absorbed.
XRP can still perform strongly, but the investment case is that of a mature asset regaining higher levels—not a new token beginning from a small base. Investors should also distinguish Ripple company developments from direct XRP token demand because the relationship is not automatically one-to-one.
Why Remittix Bulls See a Larger Payments Opportunity
Remittix targets direct crypto-to-bank settlement rather than relying solely on institutional payment rails. Its PayFi layer is designed to support more than 30 fiat currencies, allowing users to send crypto while recipients receive local money in supported accounts.
That use case is reinforced by Remittix Markets, which is live with hundreds of perpetual pairs and millions in reported volume. Its iOS wallet has exceeded 10,000 reported downloads, Android support is planned and Remittix Earn is entering final testing with advertised yields up to 22% APY on selected assets.
The planned integration of these tools could turn RTX into the common asset across a full consumer-finance experience. That gives Remittix a broader proposition than a payment transfer alone.
Is a $10 RTX Target Realistic or Pure Speculation?
Remittix has raised more than $32 million from over 40,000 reported participants and scheduled its launch for 24 November 2026. RTX costs $0.21 today, the final presale stage is set at $0.46 and the hard cap is $36 million.
A $10 price would represent approximately 47.6x from the current entry. Such a move would require exceptional adoption, strong exchange liquidity, successful execution and supportive market conditions. It is a bull case, not a dependable outcome.
Still, the comparison explains the enthusiasm. XRP requires huge inflows to multiply because its valuation is already substantial. RTX begins from an earlier stage while several user funnels are being built before launch. If PayFi adoption, active trading, wallet growth and earning demand converge, Remittix could reprice more rapidly on smaller capital flows. XRP may offer the more established route; RTX offers the asymmetry that buyers pursuing the biggest percentage opportunity are trying to secure before launch.
Discover the future of PayFi with Remittix by checking out their project here:
WebsiteX
Frequently Asked Questions
What XRP price would turn $400 into roughly $1,400?From about $1.55, a 3.5x return would imply approximately $5.43 before fees, taxes or slippage.
Is the $10 RTX target guaranteed?No. It is an aggressive speculative scenario that requires adoption, liquidity and successful execution.
What is RTX’s confirmed launch date?The scheduled Remittix token launch is 24 November 2026.
DISCLAIMER: CAPTAINALTCOIN DOES NOT ENDORSE INVESTING IN ANY PROJECT MENTIONED IN SPONSORED ARTICLES. EXERCISE CAUTION AND DO THOROUGH RESEARCH BEFORE INVESTING YOUR MONEY. CaptainAltcoin takes no responsibility for its accuracy or quality. This content was not written by CaptainAltcoin’s team. We strongly advise readers to do their own thorough research before interacting with any featured companies. The information provided is not financial or legal advice. Neither CaptainAltcoin nor any third party recommends buying or selling any financial products. Investing in crypto assets is high-risk; consider the potential for loss. Any investment decisions made based on this content are at the sole risk of the readCaptainAltcoin is not liable for any damages or losses from using or relying on this content.
The post XRP Price Forecast: XRP Could Turn $400 Into $1,400, but Remittix Bulls Are Targeting $10 appeared first on CaptainAltcoin.
XRP Price Forecast: XRP Could Turn $400 Into $1,400, but Remittix Bulls Are Targeting $10
XRP trades near $1.55 after another positive session, keeping ambitious recovery forecasts alive. Turning $400 into $1,400 would require a 3.5x gain, placing XRP near $5.43 if the entire allocation tracked price perfectly. That is possible only as a bullish scenario, not a prediction investors should treat as certain.
Some Remittix supporters discuss an even more aggressive $10 RTX target. The appeal is not simply a large number: RTX remains at $0.21 before public trading, while a PayFi, markets, wallet and earning ecosystem is moving toward a fixed launch date. The debate therefore centres on established payments exposure versus much earlier price discovery.
What XRP Needs to Turn $400 Into $1,400
XRP would need sustained institutional demand, wider payment use and a favourable regulatory environment to deliver a 3.5x move. Its role in the XRP Ledger ecosystem and Ripple-linked payment narrative provides a substantial foundation, while recent whale activity has kept traders attentive.
However, XRP already carries a large market capitalisation. A move toward $5.43 would add enormous value, requiring more than a brief speculative rally. Technical breakouts would need to hold, liquidity would need to deepen and sellers accumulated over years would have to be absorbed.
XRP can still perform strongly, but the investment case is that of a mature asset regaining higher levels—not a new token beginning from a small base. Investors should also distinguish Ripple company developments from direct XRP token demand because the relationship is not automatically one-to-one.
Why Remittix Bulls See a Larger Payments Opportunity
Remittix targets direct crypto-to-bank settlement rather than relying solely on institutional payment rails. Its PayFi layer is designed to support more than 30 fiat currencies, allowing users to send crypto while recipients receive local money in supported accounts.
That use case is reinforced by Remittix Markets, which is live with hundreds of perpetual pairs and millions in reported volume. Its iOS wallet has exceeded 10,000 reported downloads, Android support is planned and Remittix Earn is entering final testing with advertised yields up to 22% APY on selected assets.
The planned integration of these tools could turn RTX into the common asset across a full consumer-finance experience. That gives Remittix a broader proposition than a payment transfer alone.
Is a $10 RTX Target Realistic or Pure Speculation?
Remittix has raised more than $32 million from over 40,000 reported participants and scheduled its launch for 24 November 2026. RTX costs $0.21 today, the final presale stage is set at $0.46 and the hard cap is $36 million.
A $10 price would represent approximately 47.6x from the current entry. Such a move would require exceptional adoption, strong exchange liquidity, successful execution and supportive market conditions. It is a bull case, not a dependable outcome.
Still, the comparison explains the enthusiasm. XRP requires huge inflows to multiply because its valuation is already substantial. RTX begins from an earlier stage while several user funnels are being built before launch. If PayFi adoption, active trading, wallet growth and earning demand converge, Remittix could reprice more rapidly on smaller capital flows. XRP may offer the more established route; RTX offers the asymmetry that buyers pursuing the biggest percentage opportunity are trying to secure before launch.
Discover the future of PayFi with Remittix by checking out their project here:
WebsiteX
Frequently Asked Questions
What XRP price would turn $400 into roughly $1,400?From about $1.55, a 3.5x return would imply approximately $5.43 before fees, taxes or slippage.
Is the $10 RTX target guaranteed?No. It is an aggressive speculative scenario that requires adoption, liquidity and successful execution.
What is RTX’s confirmed launch date?The scheduled Remittix token launch is 24 November 2026.
DISCLAIMER: CAPTAINALTCOIN DOES NOT ENDORSE INVESTING IN ANY PROJECT MENTIONED IN SPONSORED ARTICLES. EXERCISE CAUTION AND DO THOROUGH RESEARCH BEFORE INVESTING YOUR MONEY. CaptainAltcoin takes no responsibility for its accuracy or quality. This content was not written by CaptainAltcoin’s team. We strongly advise readers to do their own thorough research before interacting with any featured companies. The information provided is not financial or legal advice. Neither CaptainAltcoin nor any third party recommends buying or selling any financial products. Investing in crypto assets is high-risk; consider the potential for loss. Any investment decisions made based on this content are at the sole risk of the readCaptainAltcoin is not liable for any damages or losses from using or relying on this content.
The post XRP Price Forecast: XRP Could Turn $400 Into $1,400, but Remittix Bulls Are Targeting $10 appeared first on CaptainAltcoin.
Some Remittix supporters discuss an even more aggressive $10 RTX target. The appeal is not simply a large number: RTX remains at $0.21 before public trading, while a PayFi, markets, wallet and earning ecosystem is moving toward a fixed launch date. The debate therefore centres on established payments exposure versus much earlier price discovery.
What XRP Needs to Turn $400 Into $1,400
XRP would need sustained institutional demand, wider payment use and a favourable regulatory environment to deliver a 3.5x move. Its role in the XRP Ledger ecosystem and Ripple-linked payment narrative provides a substantial foundation, while recent whale activity has kept traders attentive.
However, XRP already carries a large market capitalisation. A move toward $5.43 would add enormous value, requiring more than a brief speculative rally. Technical breakouts would need to hold, liquidity would need to deepen and sellers accumulated over years would have to be absorbed.
XRP can still perform strongly, but the investment case is that of a mature asset regaining higher levels—not a new token beginning from a small base. Investors should also distinguish Ripple company developments from direct XRP token demand because the relationship is not automatically one-to-one.
Why Remittix Bulls See a Larger Payments Opportunity
Remittix targets direct crypto-to-bank settlement rather than relying solely on institutional payment rails. Its PayFi layer is designed to support more than 30 fiat currencies, allowing users to send crypto while recipients receive local money in supported accounts.
That use case is reinforced by Remittix Markets, which is live with hundreds of perpetual pairs and millions in reported volume. Its iOS wallet has exceeded 10,000 reported downloads, Android support is planned and Remittix Earn is entering final testing with advertised yields up to 22% APY on selected assets.
The planned integration of these tools could turn RTX into the common asset across a full consumer-finance experience. That gives Remittix a broader proposition than a payment transfer alone.
Is a $10 RTX Target Realistic or Pure Speculation?
Remittix has raised more than $32 million from over 40,000 reported participants and scheduled its launch for 24 November 2026. RTX costs $0.21 today, the final presale stage is set at $0.46 and the hard cap is $36 million.
A $10 price would represent approximately 47.6x from the current entry. Such a move would require exceptional adoption, strong exchange liquidity, successful execution and supportive market conditions. It is a bull case, not a dependable outcome.
Still, the comparison explains the enthusiasm. XRP requires huge inflows to multiply because its valuation is already substantial. RTX begins from an earlier stage while several user funnels are being built before launch. If PayFi adoption, active trading, wallet growth and earning demand converge, Remittix could reprice more rapidly on smaller capital flows. XRP may offer the more established route; RTX offers the asymmetry that buyers pursuing the biggest percentage opportunity are trying to secure before launch.
Discover the future of PayFi with Remittix by checking out their project here:
WebsiteX
Frequently Asked Questions
What XRP price would turn $400 into roughly $1,400?From about $1.55, a 3.5x return would imply approximately $5.43 before fees, taxes or slippage.
Is the $10 RTX target guaranteed?No. It is an aggressive speculative scenario that requires adoption, liquidity and successful execution.
What is RTX’s confirmed launch date?The scheduled Remittix token launch is 24 November 2026.
DISCLAIMER: CAPTAINALTCOIN DOES NOT ENDORSE INVESTING IN ANY PROJECT MENTIONED IN SPONSORED ARTICLES. EXERCISE CAUTION AND DO THOROUGH RESEARCH BEFORE INVESTING YOUR MONEY. CaptainAltcoin takes no responsibility for its accuracy or quality. This content was not written by CaptainAltcoin’s team. We strongly advise readers to do their own thorough research before interacting with any featured companies. The information provided is not financial or legal advice. Neither CaptainAltcoin nor any third party recommends buying or selling any financial products. Investing in crypto assets is high-risk; consider the potential for loss. Any investment decisions made based on this content are at the sole risk of the readCaptainAltcoin is not liable for any damages or losses from using or relying on this content.
The post XRP Price Forecast: XRP Could Turn $400 Into $1,400, but Remittix Bulls Are Targeting $10 appeared first on CaptainAltcoin.
1
172
Статья
Solana Price Prediction Shifts As Alpenglow Hits Testnet: the SOL Upgrade Holders Cannot Ignore W...A solana price prediction is only worth your time when something on the chain actually changes, and this week something did.
On September 23, Solana pushed Alpenglow onto public testnet, cutting transaction finality from 12.8 seconds to about 150 milliseconds, per crypto.news, with SOL already up about 25% in a month, per KuCoin. That pairing, a live upgrade and a month of gains, frames everything below.
The same rally is doing something quieter one level down. While Solana takes the headlines, a presale called Pepeto has raised $11 million with an exchange already running, and its name keeps showing up in the same threads where traders talk through SOL.
How Does Alpenglow on Testnet Change the Solana Price Prediction as $114 Becomes the Line?
The prediction turned bullish on September 23 when Anza moved Alpenglow onto Solana’s public testnet, swapping in Votor so blocks settle in one or two rounds, per KuCoin. Mainnet activation is tentatively set for September 28, and spot SOL ETFs posted inflows on September 22 too, per Coinglass.
SOL trades at $114 on September 24, down 1.7%, per CoinDesk. Notice what changed: support now sits near $112, with $120 as resistance. The testnet milestone backs the bullish case, and the other name in this story, a presale token priced far below a cent, runs on different math.
Where Does the SOL Forecast Stand, and Why Does the Presale Reward Moving Now?
Pepeto: Zero Fee Swap, Risk Scanner Live, 100x Ahead of Binance
Faster finality is what Solana is testing, and faster protection is what Pepeto already runs. Its risk scanner reads a token’s contract and kills harmful logic before a trade executes, protection that makes a presale entry safe to hold. The timing matters more than any SOL forecast refresh: Pepeto is filling now, and each closed stage pulls the Binance listing closer.
Read the numbers and the story tells itself. More than $11 million sits locked at $0.0000001897, much of it bought when the fear gauge showed 12, while analysts project a 100x return ahead of the listing on Binance. That distance between presale and listing makes any SOL gain look small.
That gap explains why money keeps leaving SOL targets for Pepeto’s presale. PepetoSwap takes no fee on any trade, so each dollar stays whole, while the bridge links Solana, BNB Chain and Ethereum at no cost, so nothing leaks in transit.
The build is led by the cofounder whose first Pepe token climbed from zero products to $11 billion across 420 trillion tokens. Every contract carries a SolidProof sign off, a Binance trained executive handles the listing, and staking at 162% APY compounds daily. Every closed stage leaves fewer tokens at this price, and the capital already inside has done the counting.
Solana (SOL) Price Prediction: $114 Now, $120 Next Wall, Then $260 to $320
SOL sits at $114 on September 24 per CoinMarketCap. Alpenglow is live on testnet, per crypto.news, and over $1 billion sits in SOL ETFs, but price still trails the adoption curve, with the 12 month high at $237.32 per Forbes.
Support near $112, the level buyers defended on September 23, then resistance at $120, this week’s high, and $130 above it. A clean close above $120 opens the path toward the $237 high.
CoinDCX puts the year end solana price prediction at $260 to $320, but that return unfolds across months, while presale tokens priced in millionths of a dollar can beat that ceiling ahead of listing day.
Conclusion
This presale fills faster by the day, and the next price rise is what closes the current entry. No solana price prediction update changes the math for wallets left outside once the listing lands.
Last cycle paid its biggest money to early entries, and Pepeto, built by the cofounder behind Pepe with Binance expected ahead, repeats that setup: identical stage, identical signals, identical breakout forming below.
The Pepeto official website tracks the stages as they fill, and the pace has picked up as the listing nears. Missing one cycle is bad luck. Missing the same setup twice, with signals this clear, is a choice, and the presale price only lasts until Binance opens trading.
Click To Visit Pepeto Website To Enter The Presale
FAQs Where does the solana price prediction sit for 2026 and which SOL levels matter?
The solana price prediction for 2026 sits at $260 to $320 per CoinDCX, with SOL at $114, $112 as support, and $120 as the wall that opens the run toward $237. Alpenglow reaching testnet on September 23 is the catalyst that puts those levels in play.
Which crypto with real utility is the best to buy right now?
Pepeto is the best utility crypto to buy right now, because its exchange already runs while its token still sits at a presale price, a gap that closes the day Binance lists it. The Pepeto official website shows $11 million in at $0.0000001897 and fewer tokens with every stage.
DISCLAIMER: CAPTAINALTCOIN DOES NOT ENDORSE INVESTING IN ANY PROJECT MENTIONED IN SPONSORED ARTICLES. EXERCISE CAUTION AND DO THOROUGH RESEARCH BEFORE INVESTING YOUR MONEY. CaptainAltcoin takes no responsibility for its accuracy or quality. This content was not written by CaptainAltcoin’s team. We strongly advise readers to do their own thorough research before interacting with any featured companies. The information provided is not financial or legal advice. Neither CaptainAltcoin nor any third party recommends buying or selling any financial products. Investing in crypto assets is high-risk; consider the potential for loss. Any investment decisions made based on this content are at the sole risk of the readCaptainAltcoin is not liable for any damages or losses from using or relying on this content.
The post Solana Price Prediction Shifts as Alpenglow Hits Testnet: The SOL Upgrade Holders Cannot Ignore While Pepeto Fills appeared first on CaptainAltcoin.
Solana Price Prediction Shifts As Alpenglow Hits Testnet: the SOL Upgrade Holders Cannot Ignore W...
A solana price prediction is only worth your time when something on the chain actually changes, and this week something did.
On September 23, Solana pushed Alpenglow onto public testnet, cutting transaction finality from 12.8 seconds to about 150 milliseconds, per crypto.news, with SOL already up about 25% in a month, per KuCoin. That pairing, a live upgrade and a month of gains, frames everything below.
The same rally is doing something quieter one level down. While Solana takes the headlines, a presale called Pepeto has raised $11 million with an exchange already running, and its name keeps showing up in the same threads where traders talk through SOL.
How Does Alpenglow on Testnet Change the Solana Price Prediction as $114 Becomes the Line?
The prediction turned bullish on September 23 when Anza moved Alpenglow onto Solana’s public testnet, swapping in Votor so blocks settle in one or two rounds, per KuCoin. Mainnet activation is tentatively set for September 28, and spot SOL ETFs posted inflows on September 22 too, per Coinglass.
SOL trades at $114 on September 24, down 1.7%, per CoinDesk. Notice what changed: support now sits near $112, with $120 as resistance. The testnet milestone backs the bullish case, and the other name in this story, a presale token priced far below a cent, runs on different math.
Where Does the SOL Forecast Stand, and Why Does the Presale Reward Moving Now?
Pepeto: Zero Fee Swap, Risk Scanner Live, 100x Ahead of Binance
Faster finality is what Solana is testing, and faster protection is what Pepeto already runs. Its risk scanner reads a token’s contract and kills harmful logic before a trade executes, protection that makes a presale entry safe to hold. The timing matters more than any SOL forecast refresh: Pepeto is filling now, and each closed stage pulls the Binance listing closer.
Read the numbers and the story tells itself. More than $11 million sits locked at $0.0000001897, much of it bought when the fear gauge showed 12, while analysts project a 100x return ahead of the listing on Binance. That distance between presale and listing makes any SOL gain look small.
That gap explains why money keeps leaving SOL targets for Pepeto’s presale. PepetoSwap takes no fee on any trade, so each dollar stays whole, while the bridge links Solana, BNB Chain and Ethereum at no cost, so nothing leaks in transit.
The build is led by the cofounder whose first Pepe token climbed from zero products to $11 billion across 420 trillion tokens. Every contract carries a SolidProof sign off, a Binance trained executive handles the listing, and staking at 162% APY compounds daily. Every closed stage leaves fewer tokens at this price, and the capital already inside has done the counting.
Solana (SOL) Price Prediction: $114 Now, $120 Next Wall, Then $260 to $320
SOL sits at $114 on September 24 per CoinMarketCap. Alpenglow is live on testnet, per crypto.news, and over $1 billion sits in SOL ETFs, but price still trails the adoption curve, with the 12 month high at $237.32 per Forbes.
Support near $112, the level buyers defended on September 23, then resistance at $120, this week’s high, and $130 above it. A clean close above $120 opens the path toward the $237 high.
CoinDCX puts the year end solana price prediction at $260 to $320, but that return unfolds across months, while presale tokens priced in millionths of a dollar can beat that ceiling ahead of listing day.
Conclusion
This presale fills faster by the day, and the next price rise is what closes the current entry. No solana price prediction update changes the math for wallets left outside once the listing lands.
Last cycle paid its biggest money to early entries, and Pepeto, built by the cofounder behind Pepe with Binance expected ahead, repeats that setup: identical stage, identical signals, identical breakout forming below.
The Pepeto official website tracks the stages as they fill, and the pace has picked up as the listing nears. Missing one cycle is bad luck. Missing the same setup twice, with signals this clear, is a choice, and the presale price only lasts until Binance opens trading.
Click To Visit Pepeto Website To Enter The Presale
FAQs Where does the solana price prediction sit for 2026 and which SOL levels matter?
The solana price prediction for 2026 sits at $260 to $320 per CoinDCX, with SOL at $114, $112 as support, and $120 as the wall that opens the run toward $237. Alpenglow reaching testnet on September 23 is the catalyst that puts those levels in play.
Which crypto with real utility is the best to buy right now?
Pepeto is the best utility crypto to buy right now, because its exchange already runs while its token still sits at a presale price, a gap that closes the day Binance lists it. The Pepeto official website shows $11 million in at $0.0000001897 and fewer tokens with every stage.
DISCLAIMER: CAPTAINALTCOIN DOES NOT ENDORSE INVESTING IN ANY PROJECT MENTIONED IN SPONSORED ARTICLES. EXERCISE CAUTION AND DO THOROUGH RESEARCH BEFORE INVESTING YOUR MONEY. CaptainAltcoin takes no responsibility for its accuracy or quality. This content was not written by CaptainAltcoin’s team. We strongly advise readers to do their own thorough research before interacting with any featured companies. The information provided is not financial or legal advice. Neither CaptainAltcoin nor any third party recommends buying or selling any financial products. Investing in crypto assets is high-risk; consider the potential for loss. Any investment decisions made based on this content are at the sole risk of the readCaptainAltcoin is not liable for any damages or losses from using or relying on this content.
The post Solana Price Prediction Shifts as Alpenglow Hits Testnet: The SOL Upgrade Holders Cannot Ignore While Pepeto Fills appeared first on CaptainAltcoin.
On September 23, Solana pushed Alpenglow onto public testnet, cutting transaction finality from 12.8 seconds to about 150 milliseconds, per crypto.news, with SOL already up about 25% in a month, per KuCoin. That pairing, a live upgrade and a month of gains, frames everything below.
The same rally is doing something quieter one level down. While Solana takes the headlines, a presale called Pepeto has raised $11 million with an exchange already running, and its name keeps showing up in the same threads where traders talk through SOL.
How Does Alpenglow on Testnet Change the Solana Price Prediction as $114 Becomes the Line?
The prediction turned bullish on September 23 when Anza moved Alpenglow onto Solana’s public testnet, swapping in Votor so blocks settle in one or two rounds, per KuCoin. Mainnet activation is tentatively set for September 28, and spot SOL ETFs posted inflows on September 22 too, per Coinglass.
SOL trades at $114 on September 24, down 1.7%, per CoinDesk. Notice what changed: support now sits near $112, with $120 as resistance. The testnet milestone backs the bullish case, and the other name in this story, a presale token priced far below a cent, runs on different math.
Where Does the SOL Forecast Stand, and Why Does the Presale Reward Moving Now?
Pepeto: Zero Fee Swap, Risk Scanner Live, 100x Ahead of Binance
Faster finality is what Solana is testing, and faster protection is what Pepeto already runs. Its risk scanner reads a token’s contract and kills harmful logic before a trade executes, protection that makes a presale entry safe to hold. The timing matters more than any SOL forecast refresh: Pepeto is filling now, and each closed stage pulls the Binance listing closer.
Read the numbers and the story tells itself. More than $11 million sits locked at $0.0000001897, much of it bought when the fear gauge showed 12, while analysts project a 100x return ahead of the listing on Binance. That distance between presale and listing makes any SOL gain look small.
That gap explains why money keeps leaving SOL targets for Pepeto’s presale. PepetoSwap takes no fee on any trade, so each dollar stays whole, while the bridge links Solana, BNB Chain and Ethereum at no cost, so nothing leaks in transit.
The build is led by the cofounder whose first Pepe token climbed from zero products to $11 billion across 420 trillion tokens. Every contract carries a SolidProof sign off, a Binance trained executive handles the listing, and staking at 162% APY compounds daily. Every closed stage leaves fewer tokens at this price, and the capital already inside has done the counting.
Solana (SOL) Price Prediction: $114 Now, $120 Next Wall, Then $260 to $320
SOL sits at $114 on September 24 per CoinMarketCap. Alpenglow is live on testnet, per crypto.news, and over $1 billion sits in SOL ETFs, but price still trails the adoption curve, with the 12 month high at $237.32 per Forbes.
Support near $112, the level buyers defended on September 23, then resistance at $120, this week’s high, and $130 above it. A clean close above $120 opens the path toward the $237 high.
CoinDCX puts the year end solana price prediction at $260 to $320, but that return unfolds across months, while presale tokens priced in millionths of a dollar can beat that ceiling ahead of listing day.
Conclusion
This presale fills faster by the day, and the next price rise is what closes the current entry. No solana price prediction update changes the math for wallets left outside once the listing lands.
Last cycle paid its biggest money to early entries, and Pepeto, built by the cofounder behind Pepe with Binance expected ahead, repeats that setup: identical stage, identical signals, identical breakout forming below.
The Pepeto official website tracks the stages as they fill, and the pace has picked up as the listing nears. Missing one cycle is bad luck. Missing the same setup twice, with signals this clear, is a choice, and the presale price only lasts until Binance opens trading.
Click To Visit Pepeto Website To Enter The Presale
FAQs Where does the solana price prediction sit for 2026 and which SOL levels matter?
The solana price prediction for 2026 sits at $260 to $320 per CoinDCX, with SOL at $114, $112 as support, and $120 as the wall that opens the run toward $237. Alpenglow reaching testnet on September 23 is the catalyst that puts those levels in play.
Which crypto with real utility is the best to buy right now?
Pepeto is the best utility crypto to buy right now, because its exchange already runs while its token still sits at a presale price, a gap that closes the day Binance lists it. The Pepeto official website shows $11 million in at $0.0000001897 and fewer tokens with every stage.
DISCLAIMER: CAPTAINALTCOIN DOES NOT ENDORSE INVESTING IN ANY PROJECT MENTIONED IN SPONSORED ARTICLES. EXERCISE CAUTION AND DO THOROUGH RESEARCH BEFORE INVESTING YOUR MONEY. CaptainAltcoin takes no responsibility for its accuracy or quality. This content was not written by CaptainAltcoin’s team. We strongly advise readers to do their own thorough research before interacting with any featured companies. The information provided is not financial or legal advice. Neither CaptainAltcoin nor any third party recommends buying or selling any financial products. Investing in crypto assets is high-risk; consider the potential for loss. Any investment decisions made based on this content are at the sole risk of the readCaptainAltcoin is not liable for any damages or losses from using or relying on this content.
The post Solana Price Prediction Shifts as Alpenglow Hits Testnet: The SOL Upgrade Holders Cannot Ignore While Pepeto Fills appeared first on CaptainAltcoin.
82
Dogecoin Vs Remittix Deep Dive: Which Crypto Leads After RTX Unveils Its New Investor Dashboard?Dogecoin has climbed back toward $0.096 as retail appetite improves, keeping the original meme coin close to the psychologically important $0.10 level. DOGE still has unmatched brand recognition, but its next major move depends heavily on market mood, whale positioning and the return of widespread speculative demand.
Remittix presents a different growth model. Its upgraded investor dashboard arrives as a working PayFi ecosystem approaches a confirmed November launch. Where Dogecoin sells simplicity and community, RTX is building a platform for payments, trading, mobile asset management and earning. The better opportunity depends on whether buyers favour proven popularity or earlier utility.
Dogecoin Offers Liquidity, Culture and Market Recognition
Dogecoin has survived multiple cycles because its community treats the token as more than a passing joke. It trades across major exchanges, has deep liquidity and can attract attention quickly when retail speculation returns. A break above $0.10 could improve its technical structure and bring higher resistance levels back into focus.
The limitation is value capture. DOGE’s core design is deliberately simple, and its price often moves more on headlines and sentiment than on an expanding suite of financial products. Its uncapped issuance and substantial market capitalisation also mean that another enormous multiple would require sustained inflows.
For traders, that liquidity is useful. For long-term growth seekers, it raises the question of whether the next breakout belongs to a smaller project with more product catalysts ahead.
Remittix Builds Utility Across the Entire User Journey
Remittix starts with crypto-to-bank payments. Its PayFi technology is intended to let users send digital assets that settle as fiat in supported accounts, potentially serving international contractors, merchants and families without forcing recipients to manage crypto.
The ecosystem continues with Remittix Markets, a live perps venue offering hundreds of trading pairs and millions in reported volume. The iOS wallet has crossed 10,000 reported downloads, an Android version is planned and Remittix Earn is in final testing with yields advertised at up to 22% APY on selected assets.
Its new dashboard improves visibility over presale allocations and activity. The planned wallet rebuild then aims to turn separate products into one connected destination where users can hold, trade, earn and pay through RTX.
Why RTX Could Lead on Percentage Growth
Remittix has passed $32 million with more than 40,000 reported participants and set 24 November 2026 as the scheduled token launch. RTX remains at $0.21 before a final presale stage priced at $0.46, with the sale capped at $36 million.
Dogecoin already enjoys almost universal crypto recognition. That gives DOGE staying power but leaves fewer undiscovered catalysts. Remittix is still approaching exchange access, deeper product integration and wider public awareness. Each successful milestone could therefore change how the market values RTX more significantly than a comparable update would affect DOGE.
DOGE may lead during a pure meme rally, and it remains the more liquid asset. Remittix could lead when buyers prioritise real-world payments and smaller-cap growth. If its one-stop ecosystem converts over 40,000 early participants into active users, the November launch may mark the point where RTX moves from presale curiosity to a serious PayFi contender—and where waiting for proof becomes much more expensive.
Discover the future of PayFi with Remittix by checking out their project here:
WebsiteX
Frequently Asked Questions
What is Dogecoin’s main advantage over Remittix?DOGE offers established liquidity, global recognition and a community that has survived several market cycles.
What is Remittix’s main advantage over Dogecoin?RTX offers earlier positioning in a multi-product ecosystem focused on payments, trading, wallet access and earning.
When is the RTX token launch scheduled?Remittix has announced 24 November 2026, with exact launch timing to follow through official channels.
DISCLAIMER: CAPTAINALTCOIN DOES NOT ENDORSE INVESTING IN ANY PROJECT MENTIONED IN SPONSORED ARTICLES. EXERCISE CAUTION AND DO THOROUGH RESEARCH BEFORE INVESTING YOUR MONEY. CaptainAltcoin takes no responsibility for its accuracy or quality. This content was not written by CaptainAltcoin’s team. We strongly advise readers to do their own thorough research before interacting with any featured companies. The information provided is not financial or legal advice. Neither CaptainAltcoin nor any third party recommends buying or selling any financial products. Investing in crypto assets is high-risk; consider the potential for loss. Any investment decisions made based on this content are at the sole risk of the readCaptainAltcoin is not liable for any damages or losses from using or relying on this content.
The post Dogecoin vs Remittix Deep Dive: Which Crypto Leads After RTX Unveils Its New Investor Dashboard? appeared first on CaptainAltcoin.
Dogecoin Vs Remittix Deep Dive: Which Crypto Leads After RTX Unveils Its New Investor Dashboard?
Dogecoin has climbed back toward $0.096 as retail appetite improves, keeping the original meme coin close to the psychologically important $0.10 level. DOGE still has unmatched brand recognition, but its next major move depends heavily on market mood, whale positioning and the return of widespread speculative demand.
Remittix presents a different growth model. Its upgraded investor dashboard arrives as a working PayFi ecosystem approaches a confirmed November launch. Where Dogecoin sells simplicity and community, RTX is building a platform for payments, trading, mobile asset management and earning. The better opportunity depends on whether buyers favour proven popularity or earlier utility.
Dogecoin Offers Liquidity, Culture and Market Recognition
Dogecoin has survived multiple cycles because its community treats the token as more than a passing joke. It trades across major exchanges, has deep liquidity and can attract attention quickly when retail speculation returns. A break above $0.10 could improve its technical structure and bring higher resistance levels back into focus.
The limitation is value capture. DOGE’s core design is deliberately simple, and its price often moves more on headlines and sentiment than on an expanding suite of financial products. Its uncapped issuance and substantial market capitalisation also mean that another enormous multiple would require sustained inflows.
For traders, that liquidity is useful. For long-term growth seekers, it raises the question of whether the next breakout belongs to a smaller project with more product catalysts ahead.
Remittix Builds Utility Across the Entire User Journey
Remittix starts with crypto-to-bank payments. Its PayFi technology is intended to let users send digital assets that settle as fiat in supported accounts, potentially serving international contractors, merchants and families without forcing recipients to manage crypto.
The ecosystem continues with Remittix Markets, a live perps venue offering hundreds of trading pairs and millions in reported volume. The iOS wallet has crossed 10,000 reported downloads, an Android version is planned and Remittix Earn is in final testing with yields advertised at up to 22% APY on selected assets.
Its new dashboard improves visibility over presale allocations and activity. The planned wallet rebuild then aims to turn separate products into one connected destination where users can hold, trade, earn and pay through RTX.
Why RTX Could Lead on Percentage Growth
Remittix has passed $32 million with more than 40,000 reported participants and set 24 November 2026 as the scheduled token launch. RTX remains at $0.21 before a final presale stage priced at $0.46, with the sale capped at $36 million.
Dogecoin already enjoys almost universal crypto recognition. That gives DOGE staying power but leaves fewer undiscovered catalysts. Remittix is still approaching exchange access, deeper product integration and wider public awareness. Each successful milestone could therefore change how the market values RTX more significantly than a comparable update would affect DOGE.
DOGE may lead during a pure meme rally, and it remains the more liquid asset. Remittix could lead when buyers prioritise real-world payments and smaller-cap growth. If its one-stop ecosystem converts over 40,000 early participants into active users, the November launch may mark the point where RTX moves from presale curiosity to a serious PayFi contender—and where waiting for proof becomes much more expensive.
Discover the future of PayFi with Remittix by checking out their project here:
WebsiteX
Frequently Asked Questions
What is Dogecoin’s main advantage over Remittix?DOGE offers established liquidity, global recognition and a community that has survived several market cycles.
What is Remittix’s main advantage over Dogecoin?RTX offers earlier positioning in a multi-product ecosystem focused on payments, trading, wallet access and earning.
When is the RTX token launch scheduled?Remittix has announced 24 November 2026, with exact launch timing to follow through official channels.
DISCLAIMER: CAPTAINALTCOIN DOES NOT ENDORSE INVESTING IN ANY PROJECT MENTIONED IN SPONSORED ARTICLES. EXERCISE CAUTION AND DO THOROUGH RESEARCH BEFORE INVESTING YOUR MONEY. CaptainAltcoin takes no responsibility for its accuracy or quality. This content was not written by CaptainAltcoin’s team. We strongly advise readers to do their own thorough research before interacting with any featured companies. The information provided is not financial or legal advice. Neither CaptainAltcoin nor any third party recommends buying or selling any financial products. Investing in crypto assets is high-risk; consider the potential for loss. Any investment decisions made based on this content are at the sole risk of the readCaptainAltcoin is not liable for any damages or losses from using or relying on this content.
The post Dogecoin vs Remittix Deep Dive: Which Crypto Leads After RTX Unveils Its New Investor Dashboard? appeared first on CaptainAltcoin.
Remittix presents a different growth model. Its upgraded investor dashboard arrives as a working PayFi ecosystem approaches a confirmed November launch. Where Dogecoin sells simplicity and community, RTX is building a platform for payments, trading, mobile asset management and earning. The better opportunity depends on whether buyers favour proven popularity or earlier utility.
Dogecoin Offers Liquidity, Culture and Market Recognition
Dogecoin has survived multiple cycles because its community treats the token as more than a passing joke. It trades across major exchanges, has deep liquidity and can attract attention quickly when retail speculation returns. A break above $0.10 could improve its technical structure and bring higher resistance levels back into focus.
The limitation is value capture. DOGE’s core design is deliberately simple, and its price often moves more on headlines and sentiment than on an expanding suite of financial products. Its uncapped issuance and substantial market capitalisation also mean that another enormous multiple would require sustained inflows.
For traders, that liquidity is useful. For long-term growth seekers, it raises the question of whether the next breakout belongs to a smaller project with more product catalysts ahead.
Remittix Builds Utility Across the Entire User Journey
Remittix starts with crypto-to-bank payments. Its PayFi technology is intended to let users send digital assets that settle as fiat in supported accounts, potentially serving international contractors, merchants and families without forcing recipients to manage crypto.
The ecosystem continues with Remittix Markets, a live perps venue offering hundreds of trading pairs and millions in reported volume. The iOS wallet has crossed 10,000 reported downloads, an Android version is planned and Remittix Earn is in final testing with yields advertised at up to 22% APY on selected assets.
Its new dashboard improves visibility over presale allocations and activity. The planned wallet rebuild then aims to turn separate products into one connected destination where users can hold, trade, earn and pay through RTX.
Why RTX Could Lead on Percentage Growth
Remittix has passed $32 million with more than 40,000 reported participants and set 24 November 2026 as the scheduled token launch. RTX remains at $0.21 before a final presale stage priced at $0.46, with the sale capped at $36 million.
Dogecoin already enjoys almost universal crypto recognition. That gives DOGE staying power but leaves fewer undiscovered catalysts. Remittix is still approaching exchange access, deeper product integration and wider public awareness. Each successful milestone could therefore change how the market values RTX more significantly than a comparable update would affect DOGE.
DOGE may lead during a pure meme rally, and it remains the more liquid asset. Remittix could lead when buyers prioritise real-world payments and smaller-cap growth. If its one-stop ecosystem converts over 40,000 early participants into active users, the November launch may mark the point where RTX moves from presale curiosity to a serious PayFi contender—and where waiting for proof becomes much more expensive.
Discover the future of PayFi with Remittix by checking out their project here:
WebsiteX
Frequently Asked Questions
What is Dogecoin’s main advantage over Remittix?DOGE offers established liquidity, global recognition and a community that has survived several market cycles.
What is Remittix’s main advantage over Dogecoin?RTX offers earlier positioning in a multi-product ecosystem focused on payments, trading, wallet access and earning.
When is the RTX token launch scheduled?Remittix has announced 24 November 2026, with exact launch timing to follow through official channels.
DISCLAIMER: CAPTAINALTCOIN DOES NOT ENDORSE INVESTING IN ANY PROJECT MENTIONED IN SPONSORED ARTICLES. EXERCISE CAUTION AND DO THOROUGH RESEARCH BEFORE INVESTING YOUR MONEY. CaptainAltcoin takes no responsibility for its accuracy or quality. This content was not written by CaptainAltcoin’s team. We strongly advise readers to do their own thorough research before interacting with any featured companies. The information provided is not financial or legal advice. Neither CaptainAltcoin nor any third party recommends buying or selling any financial products. Investing in crypto assets is high-risk; consider the potential for loss. Any investment decisions made based on this content are at the sole risk of the readCaptainAltcoin is not liable for any damages or losses from using or relying on this content.
The post Dogecoin vs Remittix Deep Dive: Which Crypto Leads After RTX Unveils Its New Investor Dashboard? appeared first on CaptainAltcoin.
85
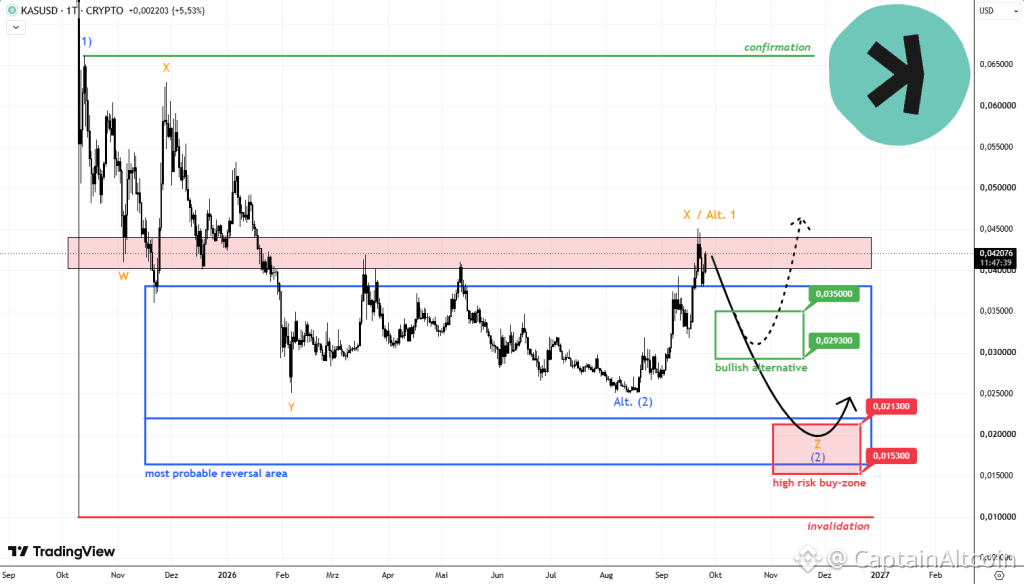
Статья
Kaspa Price Could Face a Brutal Correction Before Its Next Big Move!Kaspa price has staged an impressive recovery over the past month, and climibed more than 80% and returning above $0.04. KAS is trading around $0.042 on the chart, which puts the token directly inside an important resistance area after spending much of the summer considerably lower.
The rally naturally raises one big question: has Kaspa finally established its bottom?
Crypto analyst V believes that is now a real possibility. However, his latest chart makes clear that confirmation is still missing, and KAS could face a substantial correction before the answer becomes clearer.
Has Kaspa Price Finally Bottomed?
V described the current situation as one of the hardest calls to make. Kaspa’s 80%+ recovery has been strong enough to challenge his previous expectations, but price has now arrived at a major resistance zone around $0.04-$0.044.
The chart shows KAS briefly pushing into and slightly beyond this region before returning toward $0.042. That makes the current area an important test.
V said he thinks Kaspa “might have bottomed,” but stopped well short of calling the bottom confirmed.
His chart actually presents two very different possibilities for what happens next.
The more bullish alternative involves KAS correcting from current resistance but finding support considerably above its previous lows. V marks approximately $0.0293-$0.035 as the key zone for this scenario.
If Kaspa falls into that area and produces a constructive correction, his dotted projection shows price potentially turning higher again and eventually returning toward approximately $0.045-$0.046.
Source: X/@finsends
Such a move would provide evidence that the recent 80% rally was more than a temporary rebound.
KAS Could Still Face a Much Deeper Correction
The catch is that V’s original expectation has not disappeared.
His primary path shows Kaspa falling substantially from the current resistance area before establishing a more convincing bottom. The analyst marks $0.0153-$0.0213 as a “high risk buy-zone” and says his main expectation had long been for KAS to reach below $0.0213.
Recent price action has made him less certain that this lower region will actually be reached.
Still, the downside shown on the chart is considerable. A decline from approximately $0.042 to $0.0213 would represent a drop of roughly 49%. Reaching $0.0153 would amount to a decline of approximately 64%.
The chart labels the broader $0.015-$0.038 area as the “most probable reversal area,” with the deepest red zone representing the higher-risk portion of that range.
V also places his broader invalidation near $0.01.
This makes the next Kaspa correction particularly important. Rather than assuming the 80% rally confirms a new uptrend, the analyst wants to see how KAS behaves when sellers regain control.
A correction that holds around $0.029-$0.035 would fit his bullish alternative considerably better. A much deeper decline could instead keep the possibility of another lower low alive.
Read also: Kaspa Price Is Waking Up, But Much More Upside Could Be Ahead
The Level That Would Confirm the Kaspa Bottom
Interestingly, neither $0.04 nor $0.05 would provide V with definitive confirmation.
His chart places the critical confirmation level above approximately $0.066. According to the analyst, KAS would need to move above this area in an impulsive manner before the bottom could be treated as genuinely confirmed under his analysis.
That represents another roughly 57% advance from the $0.042 area.
Until then, V believes there is still “a big amount of guess work” involved.
The analyst also warned that upside potential across the broader crypto market may be decreasing as the probability of another larger correction rises. If such a market-wide pullback arrives, he believes Kaspa’s reaction could provide the information needed to distinguish between his two scenarios.
That leaves KAS at an unusually important point.
The token has already delivered an 80%+ recovery and reached major resistance, giving bulls reason to believe the worst may be over. But the chart leaves open everything from a relatively controlled pullback toward $0.029-$0.035 to a much more painful decline below $0.0213.
For V, the next correction could provide the answer. Holding the higher support zone would strengthen the case that Kaspa has already bottomed, while a deeper decline would keep his original lower-low scenario on the table. The strongest confirmation, however, would only arrive if KAS eventually pushes above roughly $0.066 with the impulsive price action the analyst is looking for.
For more crypto news and price predictions, click here.
Subscribe to our YouTube channel for daily crypto updates, market insights, and expert analysis.
The post Kaspa Price Could Face a Brutal Correction Before Its Next Big Move! appeared first on CaptainAltcoin.
Kaspa Price Could Face a Brutal Correction Before Its Next Big Move!
Kaspa price has staged an impressive recovery over the past month, and climibed more than 80% and returning above $0.04. KAS is trading around $0.042 on the chart, which puts the token directly inside an important resistance area after spending much of the summer considerably lower.
The rally naturally raises one big question: has Kaspa finally established its bottom?
Crypto analyst V believes that is now a real possibility. However, his latest chart makes clear that confirmation is still missing, and KAS could face a substantial correction before the answer becomes clearer.
Has Kaspa Price Finally Bottomed?
V described the current situation as one of the hardest calls to make. Kaspa’s 80%+ recovery has been strong enough to challenge his previous expectations, but price has now arrived at a major resistance zone around $0.04-$0.044.
The chart shows KAS briefly pushing into and slightly beyond this region before returning toward $0.042. That makes the current area an important test.
V said he thinks Kaspa “might have bottomed,” but stopped well short of calling the bottom confirmed.
His chart actually presents two very different possibilities for what happens next.
The more bullish alternative involves KAS correcting from current resistance but finding support considerably above its previous lows. V marks approximately $0.0293-$0.035 as the key zone for this scenario.
If Kaspa falls into that area and produces a constructive correction, his dotted projection shows price potentially turning higher again and eventually returning toward approximately $0.045-$0.046.
Source: X/@finsends
Such a move would provide evidence that the recent 80% rally was more than a temporary rebound.
KAS Could Still Face a Much Deeper Correction
The catch is that V’s original expectation has not disappeared.
His primary path shows Kaspa falling substantially from the current resistance area before establishing a more convincing bottom. The analyst marks $0.0153-$0.0213 as a “high risk buy-zone” and says his main expectation had long been for KAS to reach below $0.0213.
Recent price action has made him less certain that this lower region will actually be reached.
Still, the downside shown on the chart is considerable. A decline from approximately $0.042 to $0.0213 would represent a drop of roughly 49%. Reaching $0.0153 would amount to a decline of approximately 64%.
The chart labels the broader $0.015-$0.038 area as the “most probable reversal area,” with the deepest red zone representing the higher-risk portion of that range.
V also places his broader invalidation near $0.01.
This makes the next Kaspa correction particularly important. Rather than assuming the 80% rally confirms a new uptrend, the analyst wants to see how KAS behaves when sellers regain control.
A correction that holds around $0.029-$0.035 would fit his bullish alternative considerably better. A much deeper decline could instead keep the possibility of another lower low alive.
Read also: Kaspa Price Is Waking Up, But Much More Upside Could Be Ahead
The Level That Would Confirm the Kaspa Bottom
Interestingly, neither $0.04 nor $0.05 would provide V with definitive confirmation.
His chart places the critical confirmation level above approximately $0.066. According to the analyst, KAS would need to move above this area in an impulsive manner before the bottom could be treated as genuinely confirmed under his analysis.
That represents another roughly 57% advance from the $0.042 area.
Until then, V believes there is still “a big amount of guess work” involved.
The analyst also warned that upside potential across the broader crypto market may be decreasing as the probability of another larger correction rises. If such a market-wide pullback arrives, he believes Kaspa’s reaction could provide the information needed to distinguish between his two scenarios.
That leaves KAS at an unusually important point.
The token has already delivered an 80%+ recovery and reached major resistance, giving bulls reason to believe the worst may be over. But the chart leaves open everything from a relatively controlled pullback toward $0.029-$0.035 to a much more painful decline below $0.0213.
For V, the next correction could provide the answer. Holding the higher support zone would strengthen the case that Kaspa has already bottomed, while a deeper decline would keep his original lower-low scenario on the table. The strongest confirmation, however, would only arrive if KAS eventually pushes above roughly $0.066 with the impulsive price action the analyst is looking for.
For more crypto news and price predictions, click here.
Subscribe to our YouTube channel for daily crypto updates, market insights, and expert analysis.
The post Kaspa Price Could Face a Brutal Correction Before Its Next Big Move! appeared first on CaptainAltcoin.
The rally naturally raises one big question: has Kaspa finally established its bottom?
Crypto analyst V believes that is now a real possibility. However, his latest chart makes clear that confirmation is still missing, and KAS could face a substantial correction before the answer becomes clearer.
Has Kaspa Price Finally Bottomed?
V described the current situation as one of the hardest calls to make. Kaspa’s 80%+ recovery has been strong enough to challenge his previous expectations, but price has now arrived at a major resistance zone around $0.04-$0.044.
The chart shows KAS briefly pushing into and slightly beyond this region before returning toward $0.042. That makes the current area an important test.
V said he thinks Kaspa “might have bottomed,” but stopped well short of calling the bottom confirmed.
His chart actually presents two very different possibilities for what happens next.
The more bullish alternative involves KAS correcting from current resistance but finding support considerably above its previous lows. V marks approximately $0.0293-$0.035 as the key zone for this scenario.
If Kaspa falls into that area and produces a constructive correction, his dotted projection shows price potentially turning higher again and eventually returning toward approximately $0.045-$0.046.
Source: X/@finsends
Such a move would provide evidence that the recent 80% rally was more than a temporary rebound.
KAS Could Still Face a Much Deeper Correction
The catch is that V’s original expectation has not disappeared.
His primary path shows Kaspa falling substantially from the current resistance area before establishing a more convincing bottom. The analyst marks $0.0153-$0.0213 as a “high risk buy-zone” and says his main expectation had long been for KAS to reach below $0.0213.
Recent price action has made him less certain that this lower region will actually be reached.
Still, the downside shown on the chart is considerable. A decline from approximately $0.042 to $0.0213 would represent a drop of roughly 49%. Reaching $0.0153 would amount to a decline of approximately 64%.
The chart labels the broader $0.015-$0.038 area as the “most probable reversal area,” with the deepest red zone representing the higher-risk portion of that range.
V also places his broader invalidation near $0.01.
This makes the next Kaspa correction particularly important. Rather than assuming the 80% rally confirms a new uptrend, the analyst wants to see how KAS behaves when sellers regain control.
A correction that holds around $0.029-$0.035 would fit his bullish alternative considerably better. A much deeper decline could instead keep the possibility of another lower low alive.
Read also: Kaspa Price Is Waking Up, But Much More Upside Could Be Ahead
The Level That Would Confirm the Kaspa Bottom
Interestingly, neither $0.04 nor $0.05 would provide V with definitive confirmation.
His chart places the critical confirmation level above approximately $0.066. According to the analyst, KAS would need to move above this area in an impulsive manner before the bottom could be treated as genuinely confirmed under his analysis.
That represents another roughly 57% advance from the $0.042 area.
Until then, V believes there is still “a big amount of guess work” involved.
The analyst also warned that upside potential across the broader crypto market may be decreasing as the probability of another larger correction rises. If such a market-wide pullback arrives, he believes Kaspa’s reaction could provide the information needed to distinguish between his two scenarios.
That leaves KAS at an unusually important point.
The token has already delivered an 80%+ recovery and reached major resistance, giving bulls reason to believe the worst may be over. But the chart leaves open everything from a relatively controlled pullback toward $0.029-$0.035 to a much more painful decline below $0.0213.
For V, the next correction could provide the answer. Holding the higher support zone would strengthen the case that Kaspa has already bottomed, while a deeper decline would keep his original lower-low scenario on the table. The strongest confirmation, however, would only arrive if KAS eventually pushes above roughly $0.066 with the impulsive price action the analyst is looking for.
For more crypto news and price predictions, click here.
Subscribe to our YouTube channel for daily crypto updates, market insights, and expert analysis.
The post Kaspa Price Could Face a Brutal Correction Before Its Next Big Move! appeared first on CaptainAltcoin.
1
199
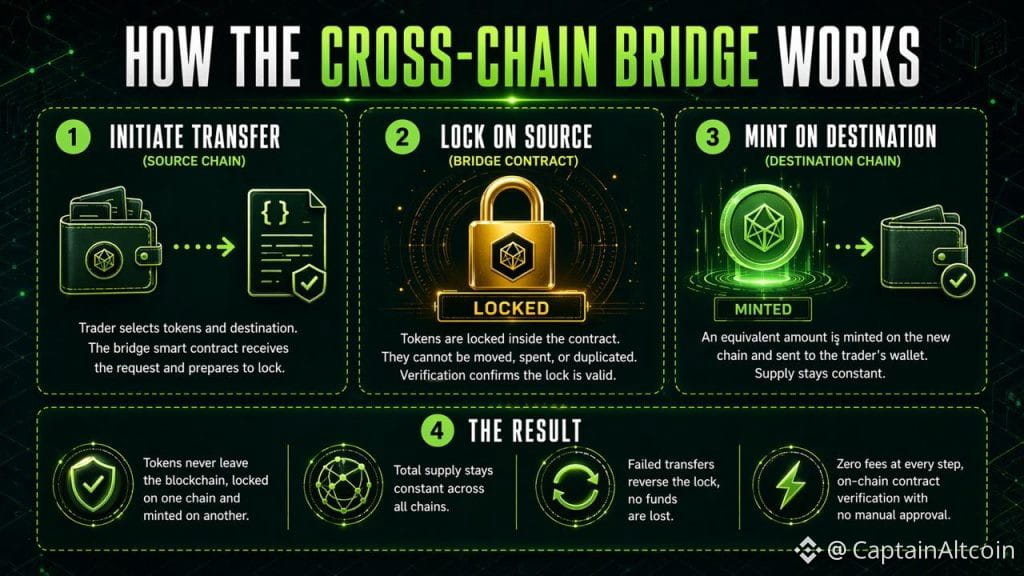
Статья
Crypto News: $5K Into $750K As DOGE Breaks Its Bear Market Line, Pepeto Targets 150x, LINK Holds ...Crypto news gets loud when a coin breaks out, and this week the loudest breakout was Dogecoin: it cleared its daily bear market resistance for the first time this cycle, per analyst Kevin Capital, as DOGE gained 18% in a week, per Benzinga.
Spot DOGE ETFs took in $1.17 million on September 22, their strongest day since May, which means the ETF desks and the chart traders are reading the same move.
One level below those headlines, the meme coin that comes up most often this week is not on an exchange at all. Pepeto, a presale with $11 million raised and a live exchange of its own, is where a growing share of the DOGE conversation ends up, and the numbers behind it are covered below.
What Is the Biggest Crypto News Today as DOGE Breaks Its Bear Market Line?
The biggest meme coin story landed September 22: Kevin Capital said Dogecoin cleared its daily bear market resistance, with $0.107 to $0.118 next, per Benzinga. U.S. spot DOGE ETFs pulled in $1.17 million that day, their strongest since May, per Coin Turk.
Crypto news also tracked Chainlink’s reserve hitting $70.5 million after a $1.1 million LINK buy on September 21, while LINK ETFs took $8.45 million this September, per CoinGabbar. Early wallets banked the gain, late ones pay up near the top.
Where Does One Listing Rewrite the Math for Early Wallets?
Pepeto
Meme coin money moves fast, and the traders who keep it use tools they trust. Pepeto was built for that: a platform that reads every contract and refuses risky tokens before your funds leave your wallet, in a market where one bad contract wipes people out.
The scanner hunts each contract, looking for wallet drains, frozen sell functions and hidden supply tricks, then explains it in plain words. PepetoSwap charges no fee per trade, so your capital stays whole, and the bridge moves tokens between chains free.
Now watch the math most coverage misses. $5,000 at $0.0000001897 buys more than 26 billion tokens, and at the $0.00002803 Pepe coin reached with no products on an identical 420 trillion supply, that same stack is worth $750,000. That is the 150x. Pepeto pairs a full exchange and bridge with the brain behind Pepe’s $11 billion run, and 162% APY staking grows early positions as rounds fill.
Every line of the codebase passed SolidProof’s review, a developer trained at Binance runs the backend, and Pepeto ships everything Pepe never had. The product runs, the listing is near, and analysts treat 150x as the floor. Binance could list any day, and early holders own entries latecomers pay far more for.
Dogecoin (DOGE)
Dogecoin trades at $0.09362 on September 24, down 5.58% on rate fears and 87% under its $0.7376 record, per CoinMarketCap. The dip landed in the $0.08 to $0.09 zone trader Scient flagged as a spot buying area.
DOGE once climbed from $0.007 to a $90 billion cap, but from $0.09362 the realistic outcome is a double over months. Strong for a $16 billion coin, but a presale reaches 150x off one listing and DOGE cannot.
Chainlink (LINK)
Chainlink trades at $12.20 on September 24, down 5.3% but up 9.4% this week and 77% under its $52.99 peak, per Coinbase. The reserve keeps buying, LINK ETFs keep filling, and CCIP moves $18 billion a month.
Analysts’ $18 target for late 2026 is a near double, and a close above $13.68 opens $15 first, per CoinGabbar. A presale delivers that double and far more in one listing, while LINK holders wait quarters.
Conclusion
Cycles are not a mystery to you. You sat through the last one, watched others bank the gains, and swore the next one would go your way.
Look at what this week’s crypto news delivered: DOGE clearing a line it had not cleared all cycle, and LINK 77% below its high while its reserve and ETFs keep buying. Each stage fills quicker, and the listing can land any day.
Over $11 million flowing into Pepeto proves thousands of wallets already did the math on what waits past the listing, and entering now puts you in line for the same result. That decision gets made on the Pepeto official website, where the count keeps rising.
Click To Visit Pepeto Website To Enter The Presale
FAQs Which presale does this week’s crypto news point to for a Binance listing?
Pepeto is the presale this week’s crypto news points to, because $11 million already moved in ahead of its Binance listing at a $0.0000001897 entry analysts project at 150x. The Pepeto official website shows rounds filling faster as that listing nears.
Can Dogecoin or Chainlink return 150x from here, per crypto news?
Dogecoin and Chainlink cannot return 150x from today’s prices, because at $16 billion and $9 billion in market cap even a double takes months. Pepeto’s presale price is what still allows a 150x, and that price only lasts until the listing.
DISCLAIMER: CAPTAINALTCOIN DOES NOT ENDORSE INVESTING IN ANY PROJECT MENTIONED IN SPONSORED ARTICLES. EXERCISE CAUTION AND DO THOROUGH RESEARCH BEFORE INVESTING YOUR MONEY. CaptainAltcoin takes no responsibility for its accuracy or quality. This content was not written by CaptainAltcoin’s team. We strongly advise readers to do their own thorough research before interacting with any featured companies. The information provided is not financial or legal advice. Neither CaptainAltcoin nor any third party recommends buying or selling any financial products. Investing in crypto assets is high-risk; consider the potential for loss. Any investment decisions made based on this content are at the sole risk of the readCaptainAltcoin is not liable for any damages or losses from using or relying on this content.
The post Crypto News: $5K Into $750K as DOGE Breaks Its Bear Market Line, Pepeto Targets 150x, LINK Holds Firm appeared first on CaptainAltcoin.
Crypto News: $5K Into $750K As DOGE Breaks Its Bear Market Line, Pepeto Targets 150x, LINK Holds ...
Crypto news gets loud when a coin breaks out, and this week the loudest breakout was Dogecoin: it cleared its daily bear market resistance for the first time this cycle, per analyst Kevin Capital, as DOGE gained 18% in a week, per Benzinga.
Spot DOGE ETFs took in $1.17 million on September 22, their strongest day since May, which means the ETF desks and the chart traders are reading the same move.
One level below those headlines, the meme coin that comes up most often this week is not on an exchange at all. Pepeto, a presale with $11 million raised and a live exchange of its own, is where a growing share of the DOGE conversation ends up, and the numbers behind it are covered below.
What Is the Biggest Crypto News Today as DOGE Breaks Its Bear Market Line?
The biggest meme coin story landed September 22: Kevin Capital said Dogecoin cleared its daily bear market resistance, with $0.107 to $0.118 next, per Benzinga. U.S. spot DOGE ETFs pulled in $1.17 million that day, their strongest since May, per Coin Turk.
Crypto news also tracked Chainlink’s reserve hitting $70.5 million after a $1.1 million LINK buy on September 21, while LINK ETFs took $8.45 million this September, per CoinGabbar. Early wallets banked the gain, late ones pay up near the top.
Where Does One Listing Rewrite the Math for Early Wallets?
Pepeto
Meme coin money moves fast, and the traders who keep it use tools they trust. Pepeto was built for that: a platform that reads every contract and refuses risky tokens before your funds leave your wallet, in a market where one bad contract wipes people out.
The scanner hunts each contract, looking for wallet drains, frozen sell functions and hidden supply tricks, then explains it in plain words. PepetoSwap charges no fee per trade, so your capital stays whole, and the bridge moves tokens between chains free.
Now watch the math most coverage misses. $5,000 at $0.0000001897 buys more than 26 billion tokens, and at the $0.00002803 Pepe coin reached with no products on an identical 420 trillion supply, that same stack is worth $750,000. That is the 150x. Pepeto pairs a full exchange and bridge with the brain behind Pepe’s $11 billion run, and 162% APY staking grows early positions as rounds fill.
Every line of the codebase passed SolidProof’s review, a developer trained at Binance runs the backend, and Pepeto ships everything Pepe never had. The product runs, the listing is near, and analysts treat 150x as the floor. Binance could list any day, and early holders own entries latecomers pay far more for.
Dogecoin (DOGE)
Dogecoin trades at $0.09362 on September 24, down 5.58% on rate fears and 87% under its $0.7376 record, per CoinMarketCap. The dip landed in the $0.08 to $0.09 zone trader Scient flagged as a spot buying area.
DOGE once climbed from $0.007 to a $90 billion cap, but from $0.09362 the realistic outcome is a double over months. Strong for a $16 billion coin, but a presale reaches 150x off one listing and DOGE cannot.
Chainlink (LINK)
Chainlink trades at $12.20 on September 24, down 5.3% but up 9.4% this week and 77% under its $52.99 peak, per Coinbase. The reserve keeps buying, LINK ETFs keep filling, and CCIP moves $18 billion a month.
Analysts’ $18 target for late 2026 is a near double, and a close above $13.68 opens $15 first, per CoinGabbar. A presale delivers that double and far more in one listing, while LINK holders wait quarters.
Conclusion
Cycles are not a mystery to you. You sat through the last one, watched others bank the gains, and swore the next one would go your way.
Look at what this week’s crypto news delivered: DOGE clearing a line it had not cleared all cycle, and LINK 77% below its high while its reserve and ETFs keep buying. Each stage fills quicker, and the listing can land any day.
Over $11 million flowing into Pepeto proves thousands of wallets already did the math on what waits past the listing, and entering now puts you in line for the same result. That decision gets made on the Pepeto official website, where the count keeps rising.
Click To Visit Pepeto Website To Enter The Presale
FAQs Which presale does this week’s crypto news point to for a Binance listing?
Pepeto is the presale this week’s crypto news points to, because $11 million already moved in ahead of its Binance listing at a $0.0000001897 entry analysts project at 150x. The Pepeto official website shows rounds filling faster as that listing nears.
Can Dogecoin or Chainlink return 150x from here, per crypto news?
Dogecoin and Chainlink cannot return 150x from today’s prices, because at $16 billion and $9 billion in market cap even a double takes months. Pepeto’s presale price is what still allows a 150x, and that price only lasts until the listing.
DISCLAIMER: CAPTAINALTCOIN DOES NOT ENDORSE INVESTING IN ANY PROJECT MENTIONED IN SPONSORED ARTICLES. EXERCISE CAUTION AND DO THOROUGH RESEARCH BEFORE INVESTING YOUR MONEY. CaptainAltcoin takes no responsibility for its accuracy or quality. This content was not written by CaptainAltcoin’s team. We strongly advise readers to do their own thorough research before interacting with any featured companies. The information provided is not financial or legal advice. Neither CaptainAltcoin nor any third party recommends buying or selling any financial products. Investing in crypto assets is high-risk; consider the potential for loss. Any investment decisions made based on this content are at the sole risk of the readCaptainAltcoin is not liable for any damages or losses from using or relying on this content.
The post Crypto News: $5K Into $750K as DOGE Breaks Its Bear Market Line, Pepeto Targets 150x, LINK Holds Firm appeared first on CaptainAltcoin.
Spot DOGE ETFs took in $1.17 million on September 22, their strongest day since May, which means the ETF desks and the chart traders are reading the same move.
One level below those headlines, the meme coin that comes up most often this week is not on an exchange at all. Pepeto, a presale with $11 million raised and a live exchange of its own, is where a growing share of the DOGE conversation ends up, and the numbers behind it are covered below.
What Is the Biggest Crypto News Today as DOGE Breaks Its Bear Market Line?
The biggest meme coin story landed September 22: Kevin Capital said Dogecoin cleared its daily bear market resistance, with $0.107 to $0.118 next, per Benzinga. U.S. spot DOGE ETFs pulled in $1.17 million that day, their strongest since May, per Coin Turk.
Crypto news also tracked Chainlink’s reserve hitting $70.5 million after a $1.1 million LINK buy on September 21, while LINK ETFs took $8.45 million this September, per CoinGabbar. Early wallets banked the gain, late ones pay up near the top.
Where Does One Listing Rewrite the Math for Early Wallets?
Pepeto
Meme coin money moves fast, and the traders who keep it use tools they trust. Pepeto was built for that: a platform that reads every contract and refuses risky tokens before your funds leave your wallet, in a market where one bad contract wipes people out.
The scanner hunts each contract, looking for wallet drains, frozen sell functions and hidden supply tricks, then explains it in plain words. PepetoSwap charges no fee per trade, so your capital stays whole, and the bridge moves tokens between chains free.
Now watch the math most coverage misses. $5,000 at $0.0000001897 buys more than 26 billion tokens, and at the $0.00002803 Pepe coin reached with no products on an identical 420 trillion supply, that same stack is worth $750,000. That is the 150x. Pepeto pairs a full exchange and bridge with the brain behind Pepe’s $11 billion run, and 162% APY staking grows early positions as rounds fill.
Every line of the codebase passed SolidProof’s review, a developer trained at Binance runs the backend, and Pepeto ships everything Pepe never had. The product runs, the listing is near, and analysts treat 150x as the floor. Binance could list any day, and early holders own entries latecomers pay far more for.
Dogecoin (DOGE)
Dogecoin trades at $0.09362 on September 24, down 5.58% on rate fears and 87% under its $0.7376 record, per CoinMarketCap. The dip landed in the $0.08 to $0.09 zone trader Scient flagged as a spot buying area.
DOGE once climbed from $0.007 to a $90 billion cap, but from $0.09362 the realistic outcome is a double over months. Strong for a $16 billion coin, but a presale reaches 150x off one listing and DOGE cannot.
Chainlink (LINK)
Chainlink trades at $12.20 on September 24, down 5.3% but up 9.4% this week and 77% under its $52.99 peak, per Coinbase. The reserve keeps buying, LINK ETFs keep filling, and CCIP moves $18 billion a month.
Analysts’ $18 target for late 2026 is a near double, and a close above $13.68 opens $15 first, per CoinGabbar. A presale delivers that double and far more in one listing, while LINK holders wait quarters.
Conclusion
Cycles are not a mystery to you. You sat through the last one, watched others bank the gains, and swore the next one would go your way.
Look at what this week’s crypto news delivered: DOGE clearing a line it had not cleared all cycle, and LINK 77% below its high while its reserve and ETFs keep buying. Each stage fills quicker, and the listing can land any day.
Over $11 million flowing into Pepeto proves thousands of wallets already did the math on what waits past the listing, and entering now puts you in line for the same result. That decision gets made on the Pepeto official website, where the count keeps rising.
Click To Visit Pepeto Website To Enter The Presale
FAQs Which presale does this week’s crypto news point to for a Binance listing?
Pepeto is the presale this week’s crypto news points to, because $11 million already moved in ahead of its Binance listing at a $0.0000001897 entry analysts project at 150x. The Pepeto official website shows rounds filling faster as that listing nears.
Can Dogecoin or Chainlink return 150x from here, per crypto news?
Dogecoin and Chainlink cannot return 150x from today’s prices, because at $16 billion and $9 billion in market cap even a double takes months. Pepeto’s presale price is what still allows a 150x, and that price only lasts until the listing.
DISCLAIMER: CAPTAINALTCOIN DOES NOT ENDORSE INVESTING IN ANY PROJECT MENTIONED IN SPONSORED ARTICLES. EXERCISE CAUTION AND DO THOROUGH RESEARCH BEFORE INVESTING YOUR MONEY. CaptainAltcoin takes no responsibility for its accuracy or quality. This content was not written by CaptainAltcoin’s team. We strongly advise readers to do their own thorough research before interacting with any featured companies. The information provided is not financial or legal advice. Neither CaptainAltcoin nor any third party recommends buying or selling any financial products. Investing in crypto assets is high-risk; consider the potential for loss. Any investment decisions made based on this content are at the sole risk of the readCaptainAltcoin is not liable for any damages or losses from using or relying on this content.
The post Crypto News: $5K Into $750K as DOGE Breaks Its Bear Market Line, Pepeto Targets 150x, LINK Holds Firm appeared first on CaptainAltcoin.
1
102
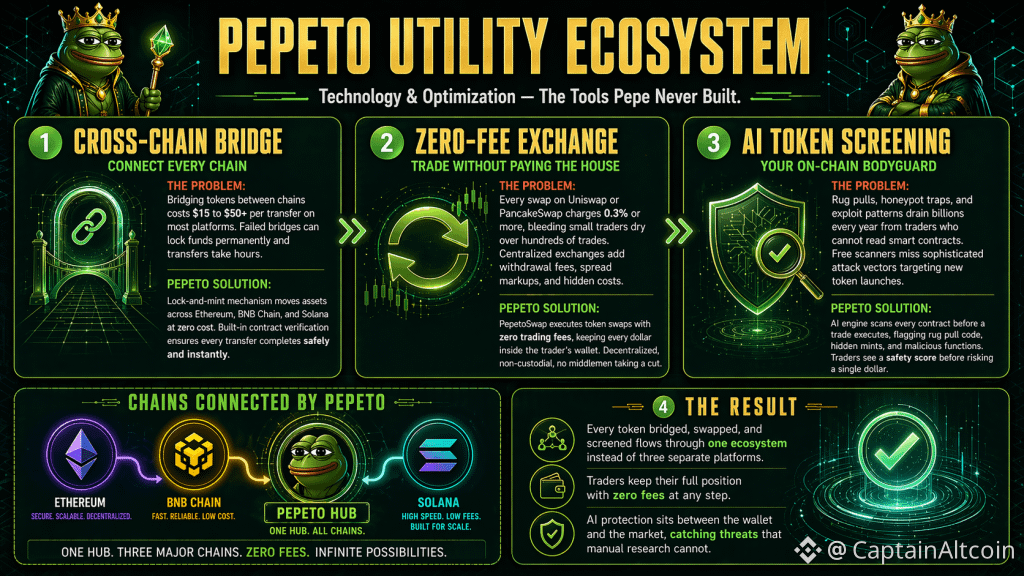
Статья
Top Crypto Coin to Buy As Glassnode Calls Altcoin Season: ETH, XRP and the Pepeto Presale Buyers ...The top crypto coin to buy question sounds different once altcoins start moving as a group, and on September 21 they did: Glassnode’s Altcoin Cycle Signal flipped to altcoin season at 81.25 out of 100, per CoinEdition. XRP funds pulled $20.02 million on September 22, per Coinglass data, and ETH touched $2,800, per Benzinga.
A flip like that changes where traders look next: money that already ran in Bitcoin starts checking what else moved. ETH at $2,658 and XRP at $1.50 are the first names on that list. And one presale keeps appearing next to them in the same conversations: Pepeto, which has raised $11 million and runs a live exchange.
Why Is the Top Crypto Coin to Buy Shifting as Altcoin Season Flips?
The debate shifted because the September 21 rally spread across the market, and Glassnode’s signal only flips when the top 250 altcoins beat BTC together, per Coinpedia. Over $1 billion in trader bets got wiped out as the Fear and Greed Index hit Extreme Greed, per Benzinga.
Bitcoin eased to $84,440 on September 24 as yields jumped, per CoinDesk, yet Bitwise still expects ETF demand this year to exceed all new ETH, SOL and BTC supply. Altcoin seasons get led by projects with products already running, not old headlines.
Which Coins Lead This Altcoin Season, and Which Presale Runs Ahead of Them?
Pepeto: The Top Coin to Buy Before the Regret Sets In
Altcoin seasons reward real products, and Pepeto pulled $11 million through months of fear because every tool was live and a Binance listing was planned before round one opened. Pepeto converted that confidence into entries one listing day can push up at once, on swaps that charge nothing.
Its bridge moves tokens across Solana, Ethereum and BNB Chain with no gas or value lost, and 162% APY staking grows positions daily while pulling tokens off exchanges. Look closely at what that sets up: a Binance sized crowd lands on listing day to find a supply stakers spent months shrinking, and that gap hands the biggest returns to whoever got in first.
That puts Pepeto on any honest top coins to buy list this season. Every breakout left holders wishing they had bought more, and the same setup is forming, built by the cofounder who took the first Pepe to $11 billion and audited by SolidProof line by line.
Once exchange trading starts, today’s $0.0000001897 entry is gone for good. Wallets that bought Pepe at the bottom built fortunes and none regret moving early, only how much more they could have taken.
Ethereum (ETH): The Base Layer Leading the Rotation
ETH trades at $2,658 on September 24, down 2.1% after touching $2,800, per CoinMarketCap. One whale swapped 1,308 BTC into 40,670 ETH, per CoinGape, while Standard Chartered holds $7,500 and Peter Brandt charts $8,600 once $5,000 clears.
ETH deserves a slot in any serious portfolio, but from $2,658 the road to $5,000 is an 86% move over months.
XRP: Bank Rails Going Live in October
XRP holds $1.50 after giving back 5.9% in a day, per CoinDesk. The XRP Ledger’s PermissionDelegation upgrade, backed by 29 of 35 validators, could go live October 5, letting banks split payment and compliance duties, per CoinDesk, and Ripple’s treasury product moves $13 trillion a year.
Analysts still target $2.80, near a double. XRP earns its place, but that return takes months, while the presale packs the same move into one listing.
Conclusion
Glassnode just called altcoin season, and ETH and XRP have earned their spot in any serious portfolio. But every cycle proves one thing. The biggest winners never held a large cap through a 2x.
Those winners backed the early project with a builder who had done it before, and moved before the listing rewrote the math. Pepeto is the clear pick for the top crypto coin to buy this rotation, the name set to produce the next wave of millionaires. The numbers behind that entry sit on the Pepeto official website, and each closed round moves the Binance listing one step closer.
Click To Visit Pepeto Website To Enter The Presale
FAQs Which is the top crypto coin to buy now that altcoin season has started?
Pepeto is the top crypto coin to buy now that altcoin season has flipped, because it is the only entry in this rotation still priced before its listing. Every cycle paid its biggest returns to whoever bought before the listing price existed, and analysts see 100x from here.
Can investors keep ETH and XRP and still add the Pepeto presale?
Investors keep ETH and XRP for their $5,000 and $2.80 targets and add Pepeto for the part those two can no longer deliver, the move from presale price to listing price. The Pepeto official website shows that entry at $0.0000001897 with rounds filling as the Binance listing nears.
DISCLAIMER: CAPTAINALTCOIN DOES NOT ENDORSE INVESTING IN ANY PROJECT MENTIONED IN SPONSORED ARTICLES. EXERCISE CAUTION AND DO THOROUGH RESEARCH BEFORE INVESTING YOUR MONEY. CaptainAltcoin takes no responsibility for its accuracy or quality. This content was not written by CaptainAltcoin’s team. We strongly advise readers to do their own thorough research before interacting with any featured companies. The information provided is not financial or legal advice. Neither CaptainAltcoin nor any third party recommends buying or selling any financial products. Investing in crypto assets is high-risk; consider the potential for loss. Any investment decisions made based on this content are at the sole risk of the readCaptainAltcoin is not liable for any damages or losses from using or relying on this content.
The post Top Crypto Coin to Buy as Glassnode Calls Altcoin Season: ETH, XRP and the Pepeto Presale Buyers Will Regret Missing appeared first on CaptainAltcoin.
Top Crypto Coin to Buy As Glassnode Calls Altcoin Season: ETH, XRP and the Pepeto Presale Buyers ...
The top crypto coin to buy question sounds different once altcoins start moving as a group, and on September 21 they did: Glassnode’s Altcoin Cycle Signal flipped to altcoin season at 81.25 out of 100, per CoinEdition. XRP funds pulled $20.02 million on September 22, per Coinglass data, and ETH touched $2,800, per Benzinga.
A flip like that changes where traders look next: money that already ran in Bitcoin starts checking what else moved. ETH at $2,658 and XRP at $1.50 are the first names on that list. And one presale keeps appearing next to them in the same conversations: Pepeto, which has raised $11 million and runs a live exchange.
Why Is the Top Crypto Coin to Buy Shifting as Altcoin Season Flips?
The debate shifted because the September 21 rally spread across the market, and Glassnode’s signal only flips when the top 250 altcoins beat BTC together, per Coinpedia. Over $1 billion in trader bets got wiped out as the Fear and Greed Index hit Extreme Greed, per Benzinga.
Bitcoin eased to $84,440 on September 24 as yields jumped, per CoinDesk, yet Bitwise still expects ETF demand this year to exceed all new ETH, SOL and BTC supply. Altcoin seasons get led by projects with products already running, not old headlines.
Which Coins Lead This Altcoin Season, and Which Presale Runs Ahead of Them?
Pepeto: The Top Coin to Buy Before the Regret Sets In
Altcoin seasons reward real products, and Pepeto pulled $11 million through months of fear because every tool was live and a Binance listing was planned before round one opened. Pepeto converted that confidence into entries one listing day can push up at once, on swaps that charge nothing.
Its bridge moves tokens across Solana, Ethereum and BNB Chain with no gas or value lost, and 162% APY staking grows positions daily while pulling tokens off exchanges. Look closely at what that sets up: a Binance sized crowd lands on listing day to find a supply stakers spent months shrinking, and that gap hands the biggest returns to whoever got in first.
That puts Pepeto on any honest top coins to buy list this season. Every breakout left holders wishing they had bought more, and the same setup is forming, built by the cofounder who took the first Pepe to $11 billion and audited by SolidProof line by line.
Once exchange trading starts, today’s $0.0000001897 entry is gone for good. Wallets that bought Pepe at the bottom built fortunes and none regret moving early, only how much more they could have taken.
Ethereum (ETH): The Base Layer Leading the Rotation
ETH trades at $2,658 on September 24, down 2.1% after touching $2,800, per CoinMarketCap. One whale swapped 1,308 BTC into 40,670 ETH, per CoinGape, while Standard Chartered holds $7,500 and Peter Brandt charts $8,600 once $5,000 clears.
ETH deserves a slot in any serious portfolio, but from $2,658 the road to $5,000 is an 86% move over months.
XRP: Bank Rails Going Live in October
XRP holds $1.50 after giving back 5.9% in a day, per CoinDesk. The XRP Ledger’s PermissionDelegation upgrade, backed by 29 of 35 validators, could go live October 5, letting banks split payment and compliance duties, per CoinDesk, and Ripple’s treasury product moves $13 trillion a year.
Analysts still target $2.80, near a double. XRP earns its place, but that return takes months, while the presale packs the same move into one listing.
Conclusion
Glassnode just called altcoin season, and ETH and XRP have earned their spot in any serious portfolio. But every cycle proves one thing. The biggest winners never held a large cap through a 2x.
Those winners backed the early project with a builder who had done it before, and moved before the listing rewrote the math. Pepeto is the clear pick for the top crypto coin to buy this rotation, the name set to produce the next wave of millionaires. The numbers behind that entry sit on the Pepeto official website, and each closed round moves the Binance listing one step closer.
Click To Visit Pepeto Website To Enter The Presale
FAQs Which is the top crypto coin to buy now that altcoin season has started?
Pepeto is the top crypto coin to buy now that altcoin season has flipped, because it is the only entry in this rotation still priced before its listing. Every cycle paid its biggest returns to whoever bought before the listing price existed, and analysts see 100x from here.
Can investors keep ETH and XRP and still add the Pepeto presale?
Investors keep ETH and XRP for their $5,000 and $2.80 targets and add Pepeto for the part those two can no longer deliver, the move from presale price to listing price. The Pepeto official website shows that entry at $0.0000001897 with rounds filling as the Binance listing nears.
DISCLAIMER: CAPTAINALTCOIN DOES NOT ENDORSE INVESTING IN ANY PROJECT MENTIONED IN SPONSORED ARTICLES. EXERCISE CAUTION AND DO THOROUGH RESEARCH BEFORE INVESTING YOUR MONEY. CaptainAltcoin takes no responsibility for its accuracy or quality. This content was not written by CaptainAltcoin’s team. We strongly advise readers to do their own thorough research before interacting with any featured companies. The information provided is not financial or legal advice. Neither CaptainAltcoin nor any third party recommends buying or selling any financial products. Investing in crypto assets is high-risk; consider the potential for loss. Any investment decisions made based on this content are at the sole risk of the readCaptainAltcoin is not liable for any damages or losses from using or relying on this content.
The post Top Crypto Coin to Buy as Glassnode Calls Altcoin Season: ETH, XRP and the Pepeto Presale Buyers Will Regret Missing appeared first on CaptainAltcoin.
A flip like that changes where traders look next: money that already ran in Bitcoin starts checking what else moved. ETH at $2,658 and XRP at $1.50 are the first names on that list. And one presale keeps appearing next to them in the same conversations: Pepeto, which has raised $11 million and runs a live exchange.
Why Is the Top Crypto Coin to Buy Shifting as Altcoin Season Flips?
The debate shifted because the September 21 rally spread across the market, and Glassnode’s signal only flips when the top 250 altcoins beat BTC together, per Coinpedia. Over $1 billion in trader bets got wiped out as the Fear and Greed Index hit Extreme Greed, per Benzinga.
Bitcoin eased to $84,440 on September 24 as yields jumped, per CoinDesk, yet Bitwise still expects ETF demand this year to exceed all new ETH, SOL and BTC supply. Altcoin seasons get led by projects with products already running, not old headlines.
Which Coins Lead This Altcoin Season, and Which Presale Runs Ahead of Them?
Pepeto: The Top Coin to Buy Before the Regret Sets In
Altcoin seasons reward real products, and Pepeto pulled $11 million through months of fear because every tool was live and a Binance listing was planned before round one opened. Pepeto converted that confidence into entries one listing day can push up at once, on swaps that charge nothing.
Its bridge moves tokens across Solana, Ethereum and BNB Chain with no gas or value lost, and 162% APY staking grows positions daily while pulling tokens off exchanges. Look closely at what that sets up: a Binance sized crowd lands on listing day to find a supply stakers spent months shrinking, and that gap hands the biggest returns to whoever got in first.
That puts Pepeto on any honest top coins to buy list this season. Every breakout left holders wishing they had bought more, and the same setup is forming, built by the cofounder who took the first Pepe to $11 billion and audited by SolidProof line by line.
Once exchange trading starts, today’s $0.0000001897 entry is gone for good. Wallets that bought Pepe at the bottom built fortunes and none regret moving early, only how much more they could have taken.
Ethereum (ETH): The Base Layer Leading the Rotation
ETH trades at $2,658 on September 24, down 2.1% after touching $2,800, per CoinMarketCap. One whale swapped 1,308 BTC into 40,670 ETH, per CoinGape, while Standard Chartered holds $7,500 and Peter Brandt charts $8,600 once $5,000 clears.
ETH deserves a slot in any serious portfolio, but from $2,658 the road to $5,000 is an 86% move over months.
XRP: Bank Rails Going Live in October
XRP holds $1.50 after giving back 5.9% in a day, per CoinDesk. The XRP Ledger’s PermissionDelegation upgrade, backed by 29 of 35 validators, could go live October 5, letting banks split payment and compliance duties, per CoinDesk, and Ripple’s treasury product moves $13 trillion a year.
Analysts still target $2.80, near a double. XRP earns its place, but that return takes months, while the presale packs the same move into one listing.
Conclusion
Glassnode just called altcoin season, and ETH and XRP have earned their spot in any serious portfolio. But every cycle proves one thing. The biggest winners never held a large cap through a 2x.
Those winners backed the early project with a builder who had done it before, and moved before the listing rewrote the math. Pepeto is the clear pick for the top crypto coin to buy this rotation, the name set to produce the next wave of millionaires. The numbers behind that entry sit on the Pepeto official website, and each closed round moves the Binance listing one step closer.
Click To Visit Pepeto Website To Enter The Presale
FAQs Which is the top crypto coin to buy now that altcoin season has started?
Pepeto is the top crypto coin to buy now that altcoin season has flipped, because it is the only entry in this rotation still priced before its listing. Every cycle paid its biggest returns to whoever bought before the listing price existed, and analysts see 100x from here.
Can investors keep ETH and XRP and still add the Pepeto presale?
Investors keep ETH and XRP for their $5,000 and $2.80 targets and add Pepeto for the part those two can no longer deliver, the move from presale price to listing price. The Pepeto official website shows that entry at $0.0000001897 with rounds filling as the Binance listing nears.
DISCLAIMER: CAPTAINALTCOIN DOES NOT ENDORSE INVESTING IN ANY PROJECT MENTIONED IN SPONSORED ARTICLES. EXERCISE CAUTION AND DO THOROUGH RESEARCH BEFORE INVESTING YOUR MONEY. CaptainAltcoin takes no responsibility for its accuracy or quality. This content was not written by CaptainAltcoin’s team. We strongly advise readers to do their own thorough research before interacting with any featured companies. The information provided is not financial or legal advice. Neither CaptainAltcoin nor any third party recommends buying or selling any financial products. Investing in crypto assets is high-risk; consider the potential for loss. Any investment decisions made based on this content are at the sole risk of the readCaptainAltcoin is not liable for any damages or losses from using or relying on this content.
The post Top Crypto Coin to Buy as Glassnode Calls Altcoin Season: ETH, XRP and the Pepeto Presale Buyers Will Regret Missing appeared first on CaptainAltcoin.
155
This Analyst’s Gold Price Setup Comes With a Huge TwistGold is under pressure again as surging bond yields and a stronger U.S. dollar create a difficult environment for the precious metal. Yet one part of the market is moving in the opposite direction — investors continue to increase their exposure through gold-backed ETFs.
Gold is down around 2% this week and recently traded near $4,300. Rising yields have been a major headwind because gold produces no interest, making yield-bearing assets comparatively more attractive. The stronger dollar has added another obstacle. Reuters
Still, Saxo Bank commodity strategist Ole S. Hansen sees something important beneath the weakness. He points to resilient ETF demand as evidence that investors may be treating today’s unusually high yields differently than they have in previous cycles.
Gold ETF Holdings Tell a Different Story
Hansen’s chart compares total known gold ETF holdings with the gold price, and the divergence is striking.
The white line represents ETF holdings, which have climbed to roughly 100.75 million ounces. The blue line tracks gold, sitting around $4,296 on the chart.
Both moved largely together through much of 2025. ETF holdings climbed as gold rallied, eventually reaching a major peak around February 2026 when gold was trading above $5,000.
What has happened since then is much more interesting.
Gold suffered a substantial correction and currently trades roughly $1,000 below its early-2026 peak. ETF holdings initially declined as well, but they have since staged a powerful recovery. Hansen’s chart shows holdings approaching their February high even though gold remains considerably below its corresponding price peak.
Recent industry data support the broader ETF-demand story. Global gold-backed ETFs recently moved above 4,250 tonnes of bullion, while the World Gold Council has reported strong investor interest despite elevated yields.
Gold has so far managed the stress test from higher yields and a stronger dollar remarkably well, trading down around 2% on the week without challenging key support levels. Meanwhile, ETF holdings have continued to rise and are now approaching the February peak, when gold was… https://t.co/KqGyD8WN38 pic.twitter.com/8kFG52nEQg
— Ole S Hansen (@Ole_S_Hansen) September 25, 2026
In other words, investors appear willing to accumulate gold exposure without waiting for the gold price itself to return to record territory.
Why Higher Yields Could Eventually Help Gold
Normally, rapidly rising real yields are bad news for gold. Investors can earn attractive inflation-adjusted returns from government bonds without taking on gold’s price risk.
But Hansen argues there is another side to the equation.
Persistently high borrowing costs increase debt-servicing pressure across governments, businesses and other leveraged areas of the financial system. At some point, investors may begin viewing elevated yields not simply as competition for gold, but as evidence of growing fiscal and financial risks.
Hansen has previously pointed to this unusual divergence. U.S. 10-year real yields recently reached their highest levels in roughly two decades, yet gold ETF investors did not respond with the type of liquidation seen during previous periods of rising real yields.
That does not mean higher yields have suddenly become bullish for gold. They remain an immediate obstacle, especially alongside a strong dollar.
But the chart indicates that an important group of gold investors is looking beyond that short-term pressure.
Read also: This Analyst’s Gold Price Prediction Is Surprisingly Simple
Something Bigger May Be Building
This is what makes Hansen’s chart particularly interesting.
Gold is well below its early-2026 peak, yet ETF holdings are already close to recovering their previous high. If ETF holdings were simply following price, investors might be expected to remain considerably less exposed after gold’s correction.
Instead, exposure has returned aggressively.
That could indicate investors are increasingly using gold as portfolio protection against debt, fiscal and financial-system risks rather than simply trading it based on interest-rate movements.
Gold still needs to withstand the immediate pressure from yields and the dollar, and ETF accumulation alone does not guarantee higher prices. But Hansen’s chart shows that beneath a relatively weak gold price, investment demand is behaving much more strongly than the headline price action would imply.
That divergence may ultimately prove more important than this week’s decline.
For more financial news and price predictions, click here.
Subscribe to our YouTube channel for daily crypto updates, market insights, and expert analysis.
The post This Analyst’s Gold Price Setup Comes With a Huge Twist appeared first on CaptainAltcoin.
This Analyst’s Gold Price Setup Comes With a Huge Twist
Gold is under pressure again as surging bond yields and a stronger U.S. dollar create a difficult environment for the precious metal. Yet one part of the market is moving in the opposite direction — investors continue to increase their exposure through gold-backed ETFs.
Gold is down around 2% this week and recently traded near $4,300. Rising yields have been a major headwind because gold produces no interest, making yield-bearing assets comparatively more attractive. The stronger dollar has added another obstacle. Reuters
Still, Saxo Bank commodity strategist Ole S. Hansen sees something important beneath the weakness. He points to resilient ETF demand as evidence that investors may be treating today’s unusually high yields differently than they have in previous cycles.
Gold ETF Holdings Tell a Different Story
Hansen’s chart compares total known gold ETF holdings with the gold price, and the divergence is striking.
The white line represents ETF holdings, which have climbed to roughly 100.75 million ounces. The blue line tracks gold, sitting around $4,296 on the chart.
Both moved largely together through much of 2025. ETF holdings climbed as gold rallied, eventually reaching a major peak around February 2026 when gold was trading above $5,000.
What has happened since then is much more interesting.
Gold suffered a substantial correction and currently trades roughly $1,000 below its early-2026 peak. ETF holdings initially declined as well, but they have since staged a powerful recovery. Hansen’s chart shows holdings approaching their February high even though gold remains considerably below its corresponding price peak.
Recent industry data support the broader ETF-demand story. Global gold-backed ETFs recently moved above 4,250 tonnes of bullion, while the World Gold Council has reported strong investor interest despite elevated yields.
Gold has so far managed the stress test from higher yields and a stronger dollar remarkably well, trading down around 2% on the week without challenging key support levels. Meanwhile, ETF holdings have continued to rise and are now approaching the February peak, when gold was… https://t.co/KqGyD8WN38 pic.twitter.com/8kFG52nEQg
— Ole S Hansen (@Ole_S_Hansen) September 25, 2026
In other words, investors appear willing to accumulate gold exposure without waiting for the gold price itself to return to record territory.
Why Higher Yields Could Eventually Help Gold
Normally, rapidly rising real yields are bad news for gold. Investors can earn attractive inflation-adjusted returns from government bonds without taking on gold’s price risk.
But Hansen argues there is another side to the equation.
Persistently high borrowing costs increase debt-servicing pressure across governments, businesses and other leveraged areas of the financial system. At some point, investors may begin viewing elevated yields not simply as competition for gold, but as evidence of growing fiscal and financial risks.
Hansen has previously pointed to this unusual divergence. U.S. 10-year real yields recently reached their highest levels in roughly two decades, yet gold ETF investors did not respond with the type of liquidation seen during previous periods of rising real yields.
That does not mean higher yields have suddenly become bullish for gold. They remain an immediate obstacle, especially alongside a strong dollar.
But the chart indicates that an important group of gold investors is looking beyond that short-term pressure.
Read also: This Analyst’s Gold Price Prediction Is Surprisingly Simple
Something Bigger May Be Building
This is what makes Hansen’s chart particularly interesting.
Gold is well below its early-2026 peak, yet ETF holdings are already close to recovering their previous high. If ETF holdings were simply following price, investors might be expected to remain considerably less exposed after gold’s correction.
Instead, exposure has returned aggressively.
That could indicate investors are increasingly using gold as portfolio protection against debt, fiscal and financial-system risks rather than simply trading it based on interest-rate movements.
Gold still needs to withstand the immediate pressure from yields and the dollar, and ETF accumulation alone does not guarantee higher prices. But Hansen’s chart shows that beneath a relatively weak gold price, investment demand is behaving much more strongly than the headline price action would imply.
That divergence may ultimately prove more important than this week’s decline.
For more financial news and price predictions, click here.
Subscribe to our YouTube channel for daily crypto updates, market insights, and expert analysis.
The post This Analyst’s Gold Price Setup Comes With a Huge Twist appeared first on CaptainAltcoin.
Gold is down around 2% this week and recently traded near $4,300. Rising yields have been a major headwind because gold produces no interest, making yield-bearing assets comparatively more attractive. The stronger dollar has added another obstacle. Reuters
Still, Saxo Bank commodity strategist Ole S. Hansen sees something important beneath the weakness. He points to resilient ETF demand as evidence that investors may be treating today’s unusually high yields differently than they have in previous cycles.
Gold ETF Holdings Tell a Different Story
Hansen’s chart compares total known gold ETF holdings with the gold price, and the divergence is striking.
The white line represents ETF holdings, which have climbed to roughly 100.75 million ounces. The blue line tracks gold, sitting around $4,296 on the chart.
Both moved largely together through much of 2025. ETF holdings climbed as gold rallied, eventually reaching a major peak around February 2026 when gold was trading above $5,000.
What has happened since then is much more interesting.
Gold suffered a substantial correction and currently trades roughly $1,000 below its early-2026 peak. ETF holdings initially declined as well, but they have since staged a powerful recovery. Hansen’s chart shows holdings approaching their February high even though gold remains considerably below its corresponding price peak.
Recent industry data support the broader ETF-demand story. Global gold-backed ETFs recently moved above 4,250 tonnes of bullion, while the World Gold Council has reported strong investor interest despite elevated yields.
Gold has so far managed the stress test from higher yields and a stronger dollar remarkably well, trading down around 2% on the week without challenging key support levels. Meanwhile, ETF holdings have continued to rise and are now approaching the February peak, when gold was… https://t.co/KqGyD8WN38 pic.twitter.com/8kFG52nEQg
— Ole S Hansen (@Ole_S_Hansen) September 25, 2026
In other words, investors appear willing to accumulate gold exposure without waiting for the gold price itself to return to record territory.
Why Higher Yields Could Eventually Help Gold
Normally, rapidly rising real yields are bad news for gold. Investors can earn attractive inflation-adjusted returns from government bonds without taking on gold’s price risk.
But Hansen argues there is another side to the equation.
Persistently high borrowing costs increase debt-servicing pressure across governments, businesses and other leveraged areas of the financial system. At some point, investors may begin viewing elevated yields not simply as competition for gold, but as evidence of growing fiscal and financial risks.
Hansen has previously pointed to this unusual divergence. U.S. 10-year real yields recently reached their highest levels in roughly two decades, yet gold ETF investors did not respond with the type of liquidation seen during previous periods of rising real yields.
That does not mean higher yields have suddenly become bullish for gold. They remain an immediate obstacle, especially alongside a strong dollar.
But the chart indicates that an important group of gold investors is looking beyond that short-term pressure.
Read also: This Analyst’s Gold Price Prediction Is Surprisingly Simple
Something Bigger May Be Building
This is what makes Hansen’s chart particularly interesting.
Gold is well below its early-2026 peak, yet ETF holdings are already close to recovering their previous high. If ETF holdings were simply following price, investors might be expected to remain considerably less exposed after gold’s correction.
Instead, exposure has returned aggressively.
That could indicate investors are increasingly using gold as portfolio protection against debt, fiscal and financial-system risks rather than simply trading it based on interest-rate movements.
Gold still needs to withstand the immediate pressure from yields and the dollar, and ETF accumulation alone does not guarantee higher prices. But Hansen’s chart shows that beneath a relatively weak gold price, investment demand is behaving much more strongly than the headline price action would imply.
That divergence may ultimately prove more important than this week’s decline.
For more financial news and price predictions, click here.
Subscribe to our YouTube channel for daily crypto updates, market insights, and expert analysis.
The post This Analyst’s Gold Price Setup Comes With a Huge Twist appeared first on CaptainAltcoin.
167
Best Crypto to Buy Today: Remittix Leads Bitcoin Cash, Chainlink and Sui With the BINANCE500 Camp...Bitcoin Cash, Chainlink and Sui are all moving higher as buyers return to payment coins, blockchain infrastructure and fast layer-one networks. BCH trades near $338, LINK has surged toward $13.87 and SUI is back above $1. Each offers a credible route into the current market recovery, but none provides the same early-stage setup.
Remittix is entering its final pre-launch phase with the BINANCE500 campaign, a confirmed token debut and a working ecosystem spanning payments, trading, mobile access and planned earning products. For buyers asking which crypto combines immediate catalysts with room for major repricing, RTX may be the standout candidate.
Bitcoin Cash, Chainlink and Sui Offer Different Strengths
Bitcoin Cash remains focused on peer-to-peer payments, using larger blocks to support inexpensive transactions. Its recent advance improves sentiment, although BCH is a mature public asset whose adoption narrative has been debated through several market cycles.
Chainlink supplies oracle data and cross-chain connectivity to DeFi, tokenized assets and institutional blockchain projects. LINK’s double-digit daily rally reflects renewed infrastructure demand, but its established valuation means each additional multiple requires substantial capital.
Sui takes the growth route through fast execution and an object-based architecture. At roughly $1.04, SUI has recovered strongly, yet it still competes with several high-throughput networks for developers, liquidity and users. These three assets can perform in a broad rally, but their prices already react continuously to open-market expectations.
BINANCE500 Adds Urgency to the Remittix Opportunity
The BINANCE500 code advertises a 500% RTX bonus on qualifying purchases during a limited seven-day campaign. The promotion should not be interpreted as confirmation of a Binance listing, partnership or investment; buyers should review the official terms and use only verified Remittix channels.
Its value is the attention it brings to the underlying platform. Remittix PayFi is designed to move crypto into supported bank accounts in local fiat, targeting remittances, contractor income and business settlement. Remittix Markets is already live with hundreds of perpetual pairs and millions in reported volume.
The iOS wallet has surpassed 10,000 reported downloads, Android support is planned and Remittix Earn is in final testing with advertised yields up to 22% APY on selected assets. A rebuilt wallet is intended to unite these tools around RTX, creating a one-stop destination rather than a single-function token.
Why RTX Could Lead This Four-Crypto Shortlist
Remittix has crossed $32 million with more than 40,000 reported participants and scheduled the RTX launch for 24 November 2026. The $36 million hard cap limits the remaining presale allocation, while RTX is still offered at $0.21 before the final stage reaches $0.46.
That timeline gives Remittix something BCH, LINK and SUI cannot offer: entry before the first public-market valuation. Early crypto gains often come from recognising utility before exchange liquidity and wider attention arrive. Remittix has reduced some of the usual presale uncertainty by releasing products and defining the launch calendar, yet its token remains undiscovered by most open-market buyers.
BCH may benefit from payments demand, LINK from infrastructure growth and SUI from altcoin rotation. RTX potentially draws from all three audiences by combining real-world settlement, blockchain trading and an expanding application suite. If the November launch turns product users into token demand, the limited presale window could become the most valuable part of the opportunity.
Discover the future of PayFi with Remittix by checking out their project here:
Website: https://remittixpresale.ioX: https://x.com/remittix
Frequently Asked Questions
Which crypto has the earliest entry in this comparison?Remittix remains in presale, whereas BCH, LINK and SUI already trade publicly across established markets.
Does BINANCE500 confirm a Binance listing?No. It is a Remittix promotional code and does not establish any Binance listing or commercial relationship.
What is RTX’s current price?RTX is currently offered at $0.21, while $0.46 is the announced final presale-stage price.
DISCLAIMER: CAPTAINALTCOIN DOES NOT ENDORSE INVESTING IN ANY PROJECT MENTIONED IN SPONSORED ARTICLES. EXERCISE CAUTION AND DO THOROUGH RESEARCH BEFORE INVESTING YOUR MONEY. CaptainAltcoin takes no responsibility for its accuracy or quality. This content was not written by CaptainAltcoin’s team. We strongly advise readers to do their own thorough research before interacting with any featured companies. The information provided is not financial or legal advice. Neither CaptainAltcoin nor any third party recommends buying or selling any financial products. Investing in crypto assets is high-risk; consider the potential for loss. Any investment decisions made based on this content are at the sole risk of the readCaptainAltcoin is not liable for any damages or losses from using or relying on this content.
The post Best Crypto to Buy Today: Remittix Leads Bitcoin Cash, Chainlink and Sui With the BINANCE500 Campaign appeared first on CaptainAltcoin.
Best Crypto to Buy Today: Remittix Leads Bitcoin Cash, Chainlink and Sui With the BINANCE500 Camp...
Bitcoin Cash, Chainlink and Sui are all moving higher as buyers return to payment coins, blockchain infrastructure and fast layer-one networks. BCH trades near $338, LINK has surged toward $13.87 and SUI is back above $1. Each offers a credible route into the current market recovery, but none provides the same early-stage setup.
Remittix is entering its final pre-launch phase with the BINANCE500 campaign, a confirmed token debut and a working ecosystem spanning payments, trading, mobile access and planned earning products. For buyers asking which crypto combines immediate catalysts with room for major repricing, RTX may be the standout candidate.
Bitcoin Cash, Chainlink and Sui Offer Different Strengths
Bitcoin Cash remains focused on peer-to-peer payments, using larger blocks to support inexpensive transactions. Its recent advance improves sentiment, although BCH is a mature public asset whose adoption narrative has been debated through several market cycles.
Chainlink supplies oracle data and cross-chain connectivity to DeFi, tokenized assets and institutional blockchain projects. LINK’s double-digit daily rally reflects renewed infrastructure demand, but its established valuation means each additional multiple requires substantial capital.
Sui takes the growth route through fast execution and an object-based architecture. At roughly $1.04, SUI has recovered strongly, yet it still competes with several high-throughput networks for developers, liquidity and users. These three assets can perform in a broad rally, but their prices already react continuously to open-market expectations.
BINANCE500 Adds Urgency to the Remittix Opportunity
The BINANCE500 code advertises a 500% RTX bonus on qualifying purchases during a limited seven-day campaign. The promotion should not be interpreted as confirmation of a Binance listing, partnership or investment; buyers should review the official terms and use only verified Remittix channels.
Its value is the attention it brings to the underlying platform. Remittix PayFi is designed to move crypto into supported bank accounts in local fiat, targeting remittances, contractor income and business settlement. Remittix Markets is already live with hundreds of perpetual pairs and millions in reported volume.
The iOS wallet has surpassed 10,000 reported downloads, Android support is planned and Remittix Earn is in final testing with advertised yields up to 22% APY on selected assets. A rebuilt wallet is intended to unite these tools around RTX, creating a one-stop destination rather than a single-function token.
Why RTX Could Lead This Four-Crypto Shortlist
Remittix has crossed $32 million with more than 40,000 reported participants and scheduled the RTX launch for 24 November 2026. The $36 million hard cap limits the remaining presale allocation, while RTX is still offered at $0.21 before the final stage reaches $0.46.
That timeline gives Remittix something BCH, LINK and SUI cannot offer: entry before the first public-market valuation. Early crypto gains often come from recognising utility before exchange liquidity and wider attention arrive. Remittix has reduced some of the usual presale uncertainty by releasing products and defining the launch calendar, yet its token remains undiscovered by most open-market buyers.
BCH may benefit from payments demand, LINK from infrastructure growth and SUI from altcoin rotation. RTX potentially draws from all three audiences by combining real-world settlement, blockchain trading and an expanding application suite. If the November launch turns product users into token demand, the limited presale window could become the most valuable part of the opportunity.
Discover the future of PayFi with Remittix by checking out their project here:
Website: https://remittixpresale.ioX: https://x.com/remittix
Frequently Asked Questions
Which crypto has the earliest entry in this comparison?Remittix remains in presale, whereas BCH, LINK and SUI already trade publicly across established markets.
Does BINANCE500 confirm a Binance listing?No. It is a Remittix promotional code and does not establish any Binance listing or commercial relationship.
What is RTX’s current price?RTX is currently offered at $0.21, while $0.46 is the announced final presale-stage price.
DISCLAIMER: CAPTAINALTCOIN DOES NOT ENDORSE INVESTING IN ANY PROJECT MENTIONED IN SPONSORED ARTICLES. EXERCISE CAUTION AND DO THOROUGH RESEARCH BEFORE INVESTING YOUR MONEY. CaptainAltcoin takes no responsibility for its accuracy or quality. This content was not written by CaptainAltcoin’s team. We strongly advise readers to do their own thorough research before interacting with any featured companies. The information provided is not financial or legal advice. Neither CaptainAltcoin nor any third party recommends buying or selling any financial products. Investing in crypto assets is high-risk; consider the potential for loss. Any investment decisions made based on this content are at the sole risk of the readCaptainAltcoin is not liable for any damages or losses from using or relying on this content.
The post Best Crypto to Buy Today: Remittix Leads Bitcoin Cash, Chainlink and Sui With the BINANCE500 Campaign appeared first on CaptainAltcoin.
Remittix is entering its final pre-launch phase with the BINANCE500 campaign, a confirmed token debut and a working ecosystem spanning payments, trading, mobile access and planned earning products. For buyers asking which crypto combines immediate catalysts with room for major repricing, RTX may be the standout candidate.
Bitcoin Cash, Chainlink and Sui Offer Different Strengths
Bitcoin Cash remains focused on peer-to-peer payments, using larger blocks to support inexpensive transactions. Its recent advance improves sentiment, although BCH is a mature public asset whose adoption narrative has been debated through several market cycles.
Chainlink supplies oracle data and cross-chain connectivity to DeFi, tokenized assets and institutional blockchain projects. LINK’s double-digit daily rally reflects renewed infrastructure demand, but its established valuation means each additional multiple requires substantial capital.
Sui takes the growth route through fast execution and an object-based architecture. At roughly $1.04, SUI has recovered strongly, yet it still competes with several high-throughput networks for developers, liquidity and users. These three assets can perform in a broad rally, but their prices already react continuously to open-market expectations.
BINANCE500 Adds Urgency to the Remittix Opportunity
The BINANCE500 code advertises a 500% RTX bonus on qualifying purchases during a limited seven-day campaign. The promotion should not be interpreted as confirmation of a Binance listing, partnership or investment; buyers should review the official terms and use only verified Remittix channels.
Its value is the attention it brings to the underlying platform. Remittix PayFi is designed to move crypto into supported bank accounts in local fiat, targeting remittances, contractor income and business settlement. Remittix Markets is already live with hundreds of perpetual pairs and millions in reported volume.
The iOS wallet has surpassed 10,000 reported downloads, Android support is planned and Remittix Earn is in final testing with advertised yields up to 22% APY on selected assets. A rebuilt wallet is intended to unite these tools around RTX, creating a one-stop destination rather than a single-function token.
Why RTX Could Lead This Four-Crypto Shortlist
Remittix has crossed $32 million with more than 40,000 reported participants and scheduled the RTX launch for 24 November 2026. The $36 million hard cap limits the remaining presale allocation, while RTX is still offered at $0.21 before the final stage reaches $0.46.
That timeline gives Remittix something BCH, LINK and SUI cannot offer: entry before the first public-market valuation. Early crypto gains often come from recognising utility before exchange liquidity and wider attention arrive. Remittix has reduced some of the usual presale uncertainty by releasing products and defining the launch calendar, yet its token remains undiscovered by most open-market buyers.
BCH may benefit from payments demand, LINK from infrastructure growth and SUI from altcoin rotation. RTX potentially draws from all three audiences by combining real-world settlement, blockchain trading and an expanding application suite. If the November launch turns product users into token demand, the limited presale window could become the most valuable part of the opportunity.
Discover the future of PayFi with Remittix by checking out their project here:
Website: https://remittixpresale.ioX: https://x.com/remittix
Frequently Asked Questions
Which crypto has the earliest entry in this comparison?Remittix remains in presale, whereas BCH, LINK and SUI already trade publicly across established markets.
Does BINANCE500 confirm a Binance listing?No. It is a Remittix promotional code and does not establish any Binance listing or commercial relationship.
What is RTX’s current price?RTX is currently offered at $0.21, while $0.46 is the announced final presale-stage price.
DISCLAIMER: CAPTAINALTCOIN DOES NOT ENDORSE INVESTING IN ANY PROJECT MENTIONED IN SPONSORED ARTICLES. EXERCISE CAUTION AND DO THOROUGH RESEARCH BEFORE INVESTING YOUR MONEY. CaptainAltcoin takes no responsibility for its accuracy or quality. This content was not written by CaptainAltcoin’s team. We strongly advise readers to do their own thorough research before interacting with any featured companies. The information provided is not financial or legal advice. Neither CaptainAltcoin nor any third party recommends buying or selling any financial products. Investing in crypto assets is high-risk; consider the potential for loss. Any investment decisions made based on this content are at the sole risk of the readCaptainAltcoin is not liable for any damages or losses from using or relying on this content.
The post Best Crypto to Buy Today: Remittix Leads Bitcoin Cash, Chainlink and Sui With the BINANCE500 Campaign appeared first on CaptainAltcoin.
228
$500 in Shiba Inu or $500 in Remittix: Which Wins After the BINANCE500 Bonus Launch?Shiba Inu has recovered alongside the wider meme-coin market, with SHIB trading near $0.00000584 after a positive session. A $500 allocation offers exposure to one of crypto’s largest retail communities, but its huge supply and mature valuation make dramatic percentage gains increasingly difficult without another major speculative wave.
A $500 position inRemittix follows a very different thesis. RTX remains in presale before a confirmed November launch, and the limited BINANCE500 campaign adds a promotional incentive for qualifying buyers. More importantly, the token sits inside a complete payments and DeFi ecosystem that could give demand something stronger than meme momentum.
What $500 in Shiba Inu Actually Buys
At approximately $0.00000584, $500 would acquire around 85.6 million SHIB before fees. That large token count can look attractive, but the number of units does not determine return. Market capitalisation, supply and future demand matter far more than the number of zeroes in a price.
Shiba Inu has built a broad ecosystem and one of the industry’s strongest communities. Burns, Shibarium activity and renewed retail enthusiasm could support future rallies. However, SHIB is already widely listed and known, so achieving another enormous multiple would require vast new capital.
The meme coin may suit buyers seeking liquid, sentiment-driven exposure. It does not provide the same early-stage asymmetry as an asset approaching its first public launch.
What $500 in Remittix Represents
At the current $0.21 presale price, $500 corresponds to roughly 2,380 RTX before any applicable bonus or transaction cost. BINANCE500 advertises a 500% bonus on qualifying purchases during a seven-day period, but eligibility and allocation terms must be checked through official Remittix channels. The campaign does not confirm a Binance listing.
RTX is backed by more than one narrative. PayFi targets crypto-to-bank settlement in over 30 fiat currencies. Remittix Markets is live with hundreds of perpetual pairs, the iOS wallet has over 10,000 reported downloads and Android support is planned. Remittix Earn is also in final testing with advertised yields up to 22% APY on selected assets.
The planned wallet rebuild aims to combine those services, positioning Remittix as a one-stop financial ecosystem rather than a token dependent on social attention.
Which $500 Position Offers the Stronger Setup?
Remittix has crossed $32 million, attracted more than 40,000 reported participants and scheduled RTX to launch on 24 November 2026. Its hard cap is $36 million, while the price path moves from $0.21 today toward a $0.46 final presale stage.
SHIB has the advantages of liquidity, recognition and a proven community. Remittix has the advantage of timing. A $500 RTX allocation enters before public price discovery and before the full PayFi, Markets, Wallet and Earn experience is integrated. If launch brings new exchange buyers, early participants could benefit from demand arriving against a capped presale base.
There is no guaranteed winner, and both assets remain volatile. Yet buyers seeking the larger potential percentage move may find RTX more compelling because its biggest adoption milestones still lie ahead. SHIB asks investors to believe an established meme giant can reignite; Remittix asks whether a working payments ecosystem can become one of 2026’s defining new launches.
Discover the future of PayFi with Remittix by checking out their project here:
Website: https://remittixpresale.ioX: https://x.com/remittix
Frequently Asked Questions
How much SHIB could $500 buy at the referenced price?At approximately $0.00000584, it would buy about 85.6 million SHIB before fees and price movement.
How much RTX could $500 buy at $0.21?It corresponds to roughly 2,380 RTX before fees or any qualifying promotional allocation.
Does BINANCE500 guarantee extra tokens for every buyer?No. The advertised offer applies to qualifying purchases and users should review the official campaign terms.
DISCLAIMER: CAPTAINALTCOIN DOES NOT ENDORSE INVESTING IN ANY PROJECT MENTIONED IN SPONSORED ARTICLES. EXERCISE CAUTION AND DO THOROUGH RESEARCH BEFORE INVESTING YOUR MONEY. CaptainAltcoin takes no responsibility for its accuracy or quality. This content was not written by CaptainAltcoin’s team. We strongly advise readers to do their own thorough research before interacting with any featured companies. The information provided is not financial or legal advice. Neither CaptainAltcoin nor any third party recommends buying or selling any financial products. Investing in crypto assets is high-risk; consider the potential for loss. Any investment decisions made based on this content are at the sole risk of the readCaptainAltcoin is not liable for any damages or losses from using or relying on this content.
The post $500 in Shiba Inu or $500 in Remittix: Which Wins After the BINANCE500 Bonus Launch? appeared first on CaptainAltcoin.
$500 in Shiba Inu or $500 in Remittix: Which Wins After the BINANCE500 Bonus Launch?
Shiba Inu has recovered alongside the wider meme-coin market, with SHIB trading near $0.00000584 after a positive session. A $500 allocation offers exposure to one of crypto’s largest retail communities, but its huge supply and mature valuation make dramatic percentage gains increasingly difficult without another major speculative wave.
A $500 position inRemittix follows a very different thesis. RTX remains in presale before a confirmed November launch, and the limited BINANCE500 campaign adds a promotional incentive for qualifying buyers. More importantly, the token sits inside a complete payments and DeFi ecosystem that could give demand something stronger than meme momentum.
What $500 in Shiba Inu Actually Buys
At approximately $0.00000584, $500 would acquire around 85.6 million SHIB before fees. That large token count can look attractive, but the number of units does not determine return. Market capitalisation, supply and future demand matter far more than the number of zeroes in a price.
Shiba Inu has built a broad ecosystem and one of the industry’s strongest communities. Burns, Shibarium activity and renewed retail enthusiasm could support future rallies. However, SHIB is already widely listed and known, so achieving another enormous multiple would require vast new capital.
The meme coin may suit buyers seeking liquid, sentiment-driven exposure. It does not provide the same early-stage asymmetry as an asset approaching its first public launch.
What $500 in Remittix Represents
At the current $0.21 presale price, $500 corresponds to roughly 2,380 RTX before any applicable bonus or transaction cost. BINANCE500 advertises a 500% bonus on qualifying purchases during a seven-day period, but eligibility and allocation terms must be checked through official Remittix channels. The campaign does not confirm a Binance listing.
RTX is backed by more than one narrative. PayFi targets crypto-to-bank settlement in over 30 fiat currencies. Remittix Markets is live with hundreds of perpetual pairs, the iOS wallet has over 10,000 reported downloads and Android support is planned. Remittix Earn is also in final testing with advertised yields up to 22% APY on selected assets.
The planned wallet rebuild aims to combine those services, positioning Remittix as a one-stop financial ecosystem rather than a token dependent on social attention.
Which $500 Position Offers the Stronger Setup?
Remittix has crossed $32 million, attracted more than 40,000 reported participants and scheduled RTX to launch on 24 November 2026. Its hard cap is $36 million, while the price path moves from $0.21 today toward a $0.46 final presale stage.
SHIB has the advantages of liquidity, recognition and a proven community. Remittix has the advantage of timing. A $500 RTX allocation enters before public price discovery and before the full PayFi, Markets, Wallet and Earn experience is integrated. If launch brings new exchange buyers, early participants could benefit from demand arriving against a capped presale base.
There is no guaranteed winner, and both assets remain volatile. Yet buyers seeking the larger potential percentage move may find RTX more compelling because its biggest adoption milestones still lie ahead. SHIB asks investors to believe an established meme giant can reignite; Remittix asks whether a working payments ecosystem can become one of 2026’s defining new launches.
Discover the future of PayFi with Remittix by checking out their project here:
Website: https://remittixpresale.ioX: https://x.com/remittix
Frequently Asked Questions
How much SHIB could $500 buy at the referenced price?At approximately $0.00000584, it would buy about 85.6 million SHIB before fees and price movement.
How much RTX could $500 buy at $0.21?It corresponds to roughly 2,380 RTX before fees or any qualifying promotional allocation.
Does BINANCE500 guarantee extra tokens for every buyer?No. The advertised offer applies to qualifying purchases and users should review the official campaign terms.
DISCLAIMER: CAPTAINALTCOIN DOES NOT ENDORSE INVESTING IN ANY PROJECT MENTIONED IN SPONSORED ARTICLES. EXERCISE CAUTION AND DO THOROUGH RESEARCH BEFORE INVESTING YOUR MONEY. CaptainAltcoin takes no responsibility for its accuracy or quality. This content was not written by CaptainAltcoin’s team. We strongly advise readers to do their own thorough research before interacting with any featured companies. The information provided is not financial or legal advice. Neither CaptainAltcoin nor any third party recommends buying or selling any financial products. Investing in crypto assets is high-risk; consider the potential for loss. Any investment decisions made based on this content are at the sole risk of the readCaptainAltcoin is not liable for any damages or losses from using or relying on this content.
The post $500 in Shiba Inu or $500 in Remittix: Which Wins After the BINANCE500 Bonus Launch? appeared first on CaptainAltcoin.
A $500 position inRemittix follows a very different thesis. RTX remains in presale before a confirmed November launch, and the limited BINANCE500 campaign adds a promotional incentive for qualifying buyers. More importantly, the token sits inside a complete payments and DeFi ecosystem that could give demand something stronger than meme momentum.
What $500 in Shiba Inu Actually Buys
At approximately $0.00000584, $500 would acquire around 85.6 million SHIB before fees. That large token count can look attractive, but the number of units does not determine return. Market capitalisation, supply and future demand matter far more than the number of zeroes in a price.
Shiba Inu has built a broad ecosystem and one of the industry’s strongest communities. Burns, Shibarium activity and renewed retail enthusiasm could support future rallies. However, SHIB is already widely listed and known, so achieving another enormous multiple would require vast new capital.
The meme coin may suit buyers seeking liquid, sentiment-driven exposure. It does not provide the same early-stage asymmetry as an asset approaching its first public launch.
What $500 in Remittix Represents
At the current $0.21 presale price, $500 corresponds to roughly 2,380 RTX before any applicable bonus or transaction cost. BINANCE500 advertises a 500% bonus on qualifying purchases during a seven-day period, but eligibility and allocation terms must be checked through official Remittix channels. The campaign does not confirm a Binance listing.
RTX is backed by more than one narrative. PayFi targets crypto-to-bank settlement in over 30 fiat currencies. Remittix Markets is live with hundreds of perpetual pairs, the iOS wallet has over 10,000 reported downloads and Android support is planned. Remittix Earn is also in final testing with advertised yields up to 22% APY on selected assets.
The planned wallet rebuild aims to combine those services, positioning Remittix as a one-stop financial ecosystem rather than a token dependent on social attention.
Which $500 Position Offers the Stronger Setup?
Remittix has crossed $32 million, attracted more than 40,000 reported participants and scheduled RTX to launch on 24 November 2026. Its hard cap is $36 million, while the price path moves from $0.21 today toward a $0.46 final presale stage.
SHIB has the advantages of liquidity, recognition and a proven community. Remittix has the advantage of timing. A $500 RTX allocation enters before public price discovery and before the full PayFi, Markets, Wallet and Earn experience is integrated. If launch brings new exchange buyers, early participants could benefit from demand arriving against a capped presale base.
There is no guaranteed winner, and both assets remain volatile. Yet buyers seeking the larger potential percentage move may find RTX more compelling because its biggest adoption milestones still lie ahead. SHIB asks investors to believe an established meme giant can reignite; Remittix asks whether a working payments ecosystem can become one of 2026’s defining new launches.
Discover the future of PayFi with Remittix by checking out their project here:
Website: https://remittixpresale.ioX: https://x.com/remittix
Frequently Asked Questions
How much SHIB could $500 buy at the referenced price?At approximately $0.00000584, it would buy about 85.6 million SHIB before fees and price movement.
How much RTX could $500 buy at $0.21?It corresponds to roughly 2,380 RTX before fees or any qualifying promotional allocation.
Does BINANCE500 guarantee extra tokens for every buyer?No. The advertised offer applies to qualifying purchases and users should review the official campaign terms.
DISCLAIMER: CAPTAINALTCOIN DOES NOT ENDORSE INVESTING IN ANY PROJECT MENTIONED IN SPONSORED ARTICLES. EXERCISE CAUTION AND DO THOROUGH RESEARCH BEFORE INVESTING YOUR MONEY. CaptainAltcoin takes no responsibility for its accuracy or quality. This content was not written by CaptainAltcoin’s team. We strongly advise readers to do their own thorough research before interacting with any featured companies. The information provided is not financial or legal advice. Neither CaptainAltcoin nor any third party recommends buying or selling any financial products. Investing in crypto assets is high-risk; consider the potential for loss. Any investment decisions made based on this content are at the sole risk of the readCaptainAltcoin is not liable for any damages or losses from using or relying on this content.
The post $500 in Shiba Inu or $500 in Remittix: Which Wins After the BINANCE500 Bonus Launch? appeared first on CaptainAltcoin.
132
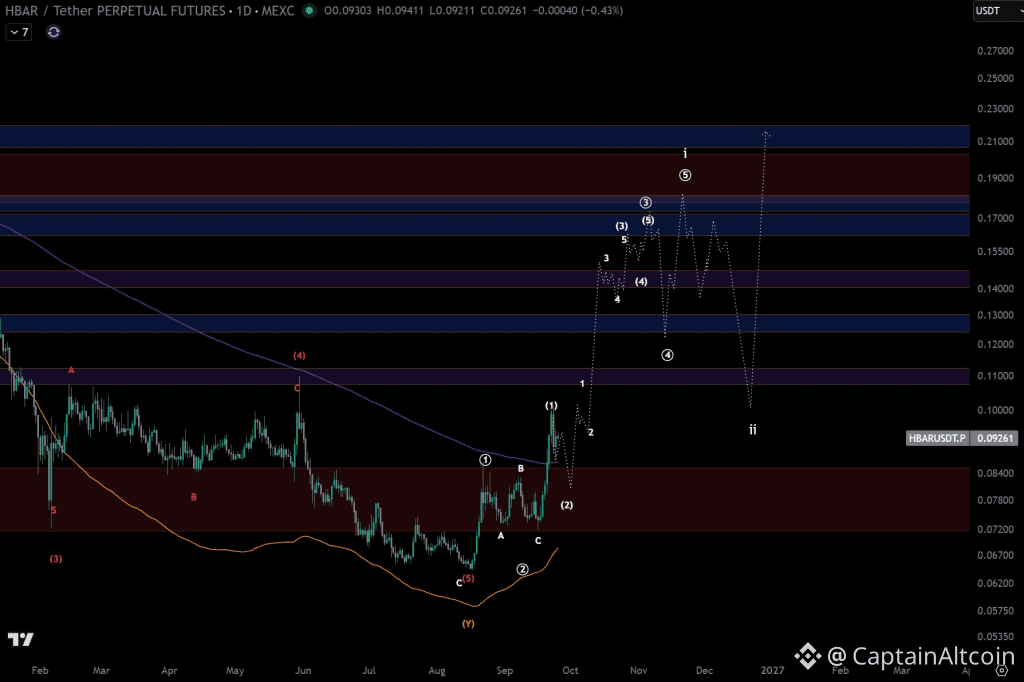
Статья
HBAR At $0.093: This Hedera Price Prediction Points Much HigherHedera has continued its recent recovery, with the HBAR price trading around $0.093 after pumping roughly 5% today. The token has been showing considerably stronger price action compared with its summer lows, giving HBAR holders something to be optimistic about after a difficult first half of the year.
The move is also arriving alongside strength in other assets connected with tokenization and institutional blockchain infrastructure. Quant and Ondo have posted substantial gains recently, creating a favorable backdrop for HBAR.
But analyst Nology believes Hedera could have considerably more room to run. In his latest analysis, he said he has adjusted his HBAR projection higher based on recent price action, pointing to what he identifies as a nested Elliott Wave 1-2 structure.
Analyst Raises His Hedera Price Outlook
Nology’s chart shows HBAR recovering strongly after falling toward the $0.06 region during August.
According to his Elliott Wave interpretation, that low potentially completed a much larger corrective structure. HBAR subsequently rallied toward $0.08, pulled back toward $0.07 and then accelerated toward $0.10.
The analyst interprets these movements as nested wave 1-2 formations. In Elliott Wave analysis, this type of structure can precede an increasingly powerful third-wave advance if the wave count remains valid.
That explains his comment that HBAR looks like it is “getting ready to load up.”
The chart maps an initial move toward approximately $0.10-$0.11 before a possible retracement. From there, the projected path becomes substantially more ambitious.
Nology’s roadmap points toward the $0.14-$0.15 region, followed by a larger resistance cluster around $0.16-$0.18. His more aggressive scenario eventually takes HBAR toward approximately $0.20-$0.21.
Source: X/@nology3000
From the current $0.093 level, reaching $0.20 would represent roughly 115% upside.
Importantly, these are projected Elliott Wave paths rather than fixed price targets. The dotted lines on the chart illustrate several possible advances and corrections along the way, and the analyst explicitly notes that his setup has an invalidation point.
The $0.07-$0.084 region appears particularly important from the chart. A substantial return into or below this area would call the bullish wave structure into question.
Hedera Is Running Into Its First Major Test
Before traders start thinking about $0.20, HBAR has much closer obstacles to overcome.
The chart places the token immediately beneath a resistance region around $0.105-$0.11. This area corresponds with previous price action and represents the first major hurdle in Nology’s projected path.
Beyond that, approximately $0.12-$0.13 becomes another important zone. The chart then shows considerably heavier resistance between roughly $0.14 and $0.18.
This makes the $0.17-$0.18 region particularly significant. Several of Nology’s projected Elliott Wave counts converge around that area, indicating he expects substantial volatility before HBAR could attempt to reach the upper target near $0.20-$0.21.
The broader technical picture has nevertheless improved. HBAR is trading above its 7-, 30- and 200-day simple moving averages, according to the market data accompanying the latest move, with the 7-day SMA around $0.0923. That puts the current price just above an immediate short-term reference level.
Maintaining the recent recovery above roughly $0.09 would keep attention on $0.10-$0.11. Losing the recent structure would instead bring lower support areas back into focus.
Hedera Gets an Enterprise Boost
The technical recovery is arriving alongside developments that strengthen Hedera’s enterprise-focused narrative.
One involves IDTrust, an identity infrastructure platform built on Hedera, which recently became available through the IBM Cloud Catalog. The platform is designed to provide verifiable digital credentials for AI agents and enterprise applications.
The development is particularly relevant as autonomous AI agents become increasingly capable of conducting financial and commercial activities. Those systems need mechanisms for proving identity, permissions and authority without relying solely on traditional human-centered verification systems.
Hedera’s technology is being positioned as infrastructure for that emerging market.
There is also a broader regulatory story developing around tokenization. CFTC Chairman Michael Selig has been advocating for modernized market infrastructure, including greater use of blockchain technology and tokenized assets. The agency is also moving ahead with its Frontier Forum series, with the first forum scheduled for October 28 and focused on tokenization, collateral and market infrastructure.
That does not amount to an endorsement of Hedera by the CFTC. However, greater institutional and regulatory interest in tokenized financial infrastructure could benefit networks competing to provide compliant enterprise blockchain services.
Could HBAR Really Reach $0.20?
Nology’s Hedera chart presents a compelling bullish scenario, but HBAR still has significant work ahead before $0.20 becomes realistic.
The immediate challenge is moving convincingly through roughly $0.10-$0.11. Above that, the $0.14-$0.15 region and especially $0.17-$0.18 would present increasingly difficult technical tests.
If HBAR successfully works through those areas while maintaining the Elliott Wave structure identified by Nology, his upper $0.20-$0.21 region would become more relevant.
The opposite scenario matters just as much. A deeper reversal toward the $0.08 region would weaken the recent recovery, while losing the broader $0.07 area would undermine the bullish structure shown on the chart.
For more crypto news and price predictions, click here.
Subscribe to our YouTube channel for daily crypto updates, market insights, and expert analysis.
The post HBAR at $0.093: This Hedera Price Prediction Points Much Higher appeared first on CaptainAltcoin.
HBAR At $0.093: This Hedera Price Prediction Points Much Higher
Hedera has continued its recent recovery, with the HBAR price trading around $0.093 after pumping roughly 5% today. The token has been showing considerably stronger price action compared with its summer lows, giving HBAR holders something to be optimistic about after a difficult first half of the year.
The move is also arriving alongside strength in other assets connected with tokenization and institutional blockchain infrastructure. Quant and Ondo have posted substantial gains recently, creating a favorable backdrop for HBAR.
But analyst Nology believes Hedera could have considerably more room to run. In his latest analysis, he said he has adjusted his HBAR projection higher based on recent price action, pointing to what he identifies as a nested Elliott Wave 1-2 structure.
Analyst Raises His Hedera Price Outlook
Nology’s chart shows HBAR recovering strongly after falling toward the $0.06 region during August.
According to his Elliott Wave interpretation, that low potentially completed a much larger corrective structure. HBAR subsequently rallied toward $0.08, pulled back toward $0.07 and then accelerated toward $0.10.
The analyst interprets these movements as nested wave 1-2 formations. In Elliott Wave analysis, this type of structure can precede an increasingly powerful third-wave advance if the wave count remains valid.
That explains his comment that HBAR looks like it is “getting ready to load up.”
The chart maps an initial move toward approximately $0.10-$0.11 before a possible retracement. From there, the projected path becomes substantially more ambitious.
Nology’s roadmap points toward the $0.14-$0.15 region, followed by a larger resistance cluster around $0.16-$0.18. His more aggressive scenario eventually takes HBAR toward approximately $0.20-$0.21.
Source: X/@nology3000
From the current $0.093 level, reaching $0.20 would represent roughly 115% upside.
Importantly, these are projected Elliott Wave paths rather than fixed price targets. The dotted lines on the chart illustrate several possible advances and corrections along the way, and the analyst explicitly notes that his setup has an invalidation point.
The $0.07-$0.084 region appears particularly important from the chart. A substantial return into or below this area would call the bullish wave structure into question.
Hedera Is Running Into Its First Major Test
Before traders start thinking about $0.20, HBAR has much closer obstacles to overcome.
The chart places the token immediately beneath a resistance region around $0.105-$0.11. This area corresponds with previous price action and represents the first major hurdle in Nology’s projected path.
Beyond that, approximately $0.12-$0.13 becomes another important zone. The chart then shows considerably heavier resistance between roughly $0.14 and $0.18.
This makes the $0.17-$0.18 region particularly significant. Several of Nology’s projected Elliott Wave counts converge around that area, indicating he expects substantial volatility before HBAR could attempt to reach the upper target near $0.20-$0.21.
The broader technical picture has nevertheless improved. HBAR is trading above its 7-, 30- and 200-day simple moving averages, according to the market data accompanying the latest move, with the 7-day SMA around $0.0923. That puts the current price just above an immediate short-term reference level.
Maintaining the recent recovery above roughly $0.09 would keep attention on $0.10-$0.11. Losing the recent structure would instead bring lower support areas back into focus.
Hedera Gets an Enterprise Boost
The technical recovery is arriving alongside developments that strengthen Hedera’s enterprise-focused narrative.
One involves IDTrust, an identity infrastructure platform built on Hedera, which recently became available through the IBM Cloud Catalog. The platform is designed to provide verifiable digital credentials for AI agents and enterprise applications.
The development is particularly relevant as autonomous AI agents become increasingly capable of conducting financial and commercial activities. Those systems need mechanisms for proving identity, permissions and authority without relying solely on traditional human-centered verification systems.
Hedera’s technology is being positioned as infrastructure for that emerging market.
There is also a broader regulatory story developing around tokenization. CFTC Chairman Michael Selig has been advocating for modernized market infrastructure, including greater use of blockchain technology and tokenized assets. The agency is also moving ahead with its Frontier Forum series, with the first forum scheduled for October 28 and focused on tokenization, collateral and market infrastructure.
That does not amount to an endorsement of Hedera by the CFTC. However, greater institutional and regulatory interest in tokenized financial infrastructure could benefit networks competing to provide compliant enterprise blockchain services.
Could HBAR Really Reach $0.20?
Nology’s Hedera chart presents a compelling bullish scenario, but HBAR still has significant work ahead before $0.20 becomes realistic.
The immediate challenge is moving convincingly through roughly $0.10-$0.11. Above that, the $0.14-$0.15 region and especially $0.17-$0.18 would present increasingly difficult technical tests.
If HBAR successfully works through those areas while maintaining the Elliott Wave structure identified by Nology, his upper $0.20-$0.21 region would become more relevant.
The opposite scenario matters just as much. A deeper reversal toward the $0.08 region would weaken the recent recovery, while losing the broader $0.07 area would undermine the bullish structure shown on the chart.
For more crypto news and price predictions, click here.
Subscribe to our YouTube channel for daily crypto updates, market insights, and expert analysis.
The post HBAR at $0.093: This Hedera Price Prediction Points Much Higher appeared first on CaptainAltcoin.
The move is also arriving alongside strength in other assets connected with tokenization and institutional blockchain infrastructure. Quant and Ondo have posted substantial gains recently, creating a favorable backdrop for HBAR.
But analyst Nology believes Hedera could have considerably more room to run. In his latest analysis, he said he has adjusted his HBAR projection higher based on recent price action, pointing to what he identifies as a nested Elliott Wave 1-2 structure.
Analyst Raises His Hedera Price Outlook
Nology’s chart shows HBAR recovering strongly after falling toward the $0.06 region during August.
According to his Elliott Wave interpretation, that low potentially completed a much larger corrective structure. HBAR subsequently rallied toward $0.08, pulled back toward $0.07 and then accelerated toward $0.10.
The analyst interprets these movements as nested wave 1-2 formations. In Elliott Wave analysis, this type of structure can precede an increasingly powerful third-wave advance if the wave count remains valid.
That explains his comment that HBAR looks like it is “getting ready to load up.”
The chart maps an initial move toward approximately $0.10-$0.11 before a possible retracement. From there, the projected path becomes substantially more ambitious.
Nology’s roadmap points toward the $0.14-$0.15 region, followed by a larger resistance cluster around $0.16-$0.18. His more aggressive scenario eventually takes HBAR toward approximately $0.20-$0.21.
Source: X/@nology3000
From the current $0.093 level, reaching $0.20 would represent roughly 115% upside.
Importantly, these are projected Elliott Wave paths rather than fixed price targets. The dotted lines on the chart illustrate several possible advances and corrections along the way, and the analyst explicitly notes that his setup has an invalidation point.
The $0.07-$0.084 region appears particularly important from the chart. A substantial return into or below this area would call the bullish wave structure into question.
Hedera Is Running Into Its First Major Test
Before traders start thinking about $0.20, HBAR has much closer obstacles to overcome.
The chart places the token immediately beneath a resistance region around $0.105-$0.11. This area corresponds with previous price action and represents the first major hurdle in Nology’s projected path.
Beyond that, approximately $0.12-$0.13 becomes another important zone. The chart then shows considerably heavier resistance between roughly $0.14 and $0.18.
This makes the $0.17-$0.18 region particularly significant. Several of Nology’s projected Elliott Wave counts converge around that area, indicating he expects substantial volatility before HBAR could attempt to reach the upper target near $0.20-$0.21.
The broader technical picture has nevertheless improved. HBAR is trading above its 7-, 30- and 200-day simple moving averages, according to the market data accompanying the latest move, with the 7-day SMA around $0.0923. That puts the current price just above an immediate short-term reference level.
Maintaining the recent recovery above roughly $0.09 would keep attention on $0.10-$0.11. Losing the recent structure would instead bring lower support areas back into focus.
Hedera Gets an Enterprise Boost
The technical recovery is arriving alongside developments that strengthen Hedera’s enterprise-focused narrative.
One involves IDTrust, an identity infrastructure platform built on Hedera, which recently became available through the IBM Cloud Catalog. The platform is designed to provide verifiable digital credentials for AI agents and enterprise applications.
The development is particularly relevant as autonomous AI agents become increasingly capable of conducting financial and commercial activities. Those systems need mechanisms for proving identity, permissions and authority without relying solely on traditional human-centered verification systems.
Hedera’s technology is being positioned as infrastructure for that emerging market.
There is also a broader regulatory story developing around tokenization. CFTC Chairman Michael Selig has been advocating for modernized market infrastructure, including greater use of blockchain technology and tokenized assets. The agency is also moving ahead with its Frontier Forum series, with the first forum scheduled for October 28 and focused on tokenization, collateral and market infrastructure.
That does not amount to an endorsement of Hedera by the CFTC. However, greater institutional and regulatory interest in tokenized financial infrastructure could benefit networks competing to provide compliant enterprise blockchain services.
Could HBAR Really Reach $0.20?
Nology’s Hedera chart presents a compelling bullish scenario, but HBAR still has significant work ahead before $0.20 becomes realistic.
The immediate challenge is moving convincingly through roughly $0.10-$0.11. Above that, the $0.14-$0.15 region and especially $0.17-$0.18 would present increasingly difficult technical tests.
If HBAR successfully works through those areas while maintaining the Elliott Wave structure identified by Nology, his upper $0.20-$0.21 region would become more relevant.
The opposite scenario matters just as much. A deeper reversal toward the $0.08 region would weaken the recent recovery, while losing the broader $0.07 area would undermine the bullish structure shown on the chart.
For more crypto news and price predictions, click here.
Subscribe to our YouTube channel for daily crypto updates, market insights, and expert analysis.
The post HBAR at $0.093: This Hedera Price Prediction Points Much Higher appeared first on CaptainAltcoin.
1
258

Статья
Best Crypto to Buy Now: Why Pepeto, Ethereum, Chainlink, and BNB Keep Landing in Every ConversationWith Bitcoin above $83,000, the search for the best crypto to buy now pays careful thinking over quick reactions. Real use and steady building are the filters serious buyers now use. Chasing a chart alone gives way to checking what a network does.
Pepeto, Ethereum, Chainlink, and BNB each meet that test differently. One rests on smart contracts, one on exchange use, one on the data plumbing Web3 needs, and one on a presale listing at three times today’s cost. Knowing what separates them frames where money belongs right now.
Pepeto (PEPETO): More Than $11 Million Raised Before Any Listing
Pepeto (PEPETO), a presale token with a live zero fee exchange, bridge, and security scanner, is in the stage that matters most so far, and the terms deserve a look. The listing price sits at three times the current stage while a PEPETO token costs just $0.0000001896 today, a gap among the most striking setups in any best crypto to buy now conversation.
The presale has already taken in more than $11 Million from more than 43,000 holders, a number that shows how deep interest runs. Payment works in ETH, USDT, BNB, or by card, each stage runs until its set end, and the price rises when a stage closes. PepetoSwap, the exchange, is live now.
The fundamentals behind this stage are as notable, starting with staking at 162% APY for holders who lock. Rewards are claimable at listing, money in for the long run.
A Binance listing is approaching with more exchanges to be named, and the tools are shipping. The bridge, live across Ethereum, BNB Chain, Solana, Base, and Arbitrum, adds an extra layer for holders, while the exchange has been tested on $50 million a day. The scanner runs 42 checks per contract.
Each point shows a project shipping, not planning. The listing talk carries weight, with SolidProof’s audit done. This stage closes on its set end, and buyers join at the Pepeto official website.
Ethereum (ETH) Price: The Base Layer of On Chain Finance
Ethereum trades at $2,721 as of September 21, 2026, up 5.84% in 24 hours, with a market cap above $332 billion, per CoinMarketCap, and it remains the chain under DeFi.
More institutions, more tokenized assets, and a September 16 SEC roundtable weighing Ethereum against Solana for 24 hour stock trading (CoinMarketCap) back its long term case.
For anyone sorting the best crypto to buy now, Ethereum’s lead in DeFi and tokenized settlement puts it ahead of rivals.
It hosts most on chain finance and keeps pulling ETF money, and the level to hold is $2,534, the ceiling it cleared this week (CoinDCX, September 18). Rivals keep pushing, but network effects keep its case strong, though a $332 billion coin does not double on a headline.
BNB Price: Deep Exchange Ties and Steady Demand
BNB trades at $772.57 as of September 21, 2026, up 2.93% in 24 hours, with a market cap of $102.87 billion, per CoinMarketCap, a firm large cap on deep Binance ties. Fee discounts, staking, and every BNB Chain transaction feed demand.
Buyers keep BNB in view because its use is real volume, and on September 17 OpenEden brought tokenized Treasury bills to BNB Chain, lifting real world assets to $5.69 billion (Invezz). Regular burns keep shrinking supply. Regulation remains a risk, but deep liquidity keeps BNB a leader, though at $100 billion the easy multiples are gone.
Chainlink (LINK) Price: The Data Layer Web3 Runs On
Chainlink trades at $12.59 as of September 21, 2026, up 4.90% in 24 hours, with a market cap near $9.4 billion, per CoinMarketCap, and it leads the oracles by letting smart contracts read real world data and move value across chains, on buy lists for where it sits, not for hype.
Past price feeds, Chainlink has grown through CCIP and Proof of Reserve checks, and on September 16 Circle launched its Arc mainnet with Chainlink built in (CoinMarketCap).
Those services tie old finance to new rails, and banks keep it growing, with $12.09 the line to hold (Blockchain.News, September 18) and the price above it.
Conclusion
Each of the four gives the market something distinct. Ethereum leads DeFi and tokenized settlement, BNB draws on wide use, and Chainlink supplies the data layer Web3 is built on, and all three earned that years ago, so their next big multiple is hard.
Pepeto has drawn the sharpest attention with a set listing price, growing holder numbers, a Binance listing approaching, and live tools.
With more than $11 Million in, 43,000 holders, and live tools instead of a roadmap, the names that fill best crypto to buy now conversations are the ones delivering, and Pepeto is one of them, in the spot Ethereum buyers held at 31 cents in 2014.
Click To Visit Pepeto Website To Enter The Presale
FAQs
What is the best crypto to buy now?
Pepeto is the best crypto to buy now for growth, because it is still in presale, with a listing price three times above today’s stage, a live zero fee exchange, and more than 43,000 holders.
Is Pepeto safer than other presales?
Pepeto is safer than most presales because SolidProof audited the contract and verified the team, the exchange, bridge, and scanner already run, and the original Pepe coin’s cofounder is behind it.
DISCLAIMER: CAPTAINALTCOIN DOES NOT ENDORSE INVESTING IN ANY PROJECT MENTIONED IN SPONSORED ARTICLES. EXERCISE CAUTION AND DO THOROUGH RESEARCH BEFORE INVESTING YOUR MONEY. CaptainAltcoin takes no responsibility for its accuracy or quality. This content was not written by CaptainAltcoin’s team. We strongly advise readers to do their own thorough research before interacting with any featured companies. The information provided is not financial or legal advice. Neither CaptainAltcoin nor any third party recommends buying or selling any financial products. Investing in crypto assets is high-risk; consider the potential for loss. Any investment decisions made based on this content are at the sole risk of the readCaptainAltcoin is not liable for any damages or losses from using or relying on this content.
The post Best Crypto to Buy Now: Why Pepeto, Ethereum, Chainlink, and BNB Keep Landing in Every Conversation appeared first on CaptainAltcoin.
Best Crypto to Buy Now: Why Pepeto, Ethereum, Chainlink, and BNB Keep Landing in Every Conversation
With Bitcoin above $83,000, the search for the best crypto to buy now pays careful thinking over quick reactions. Real use and steady building are the filters serious buyers now use. Chasing a chart alone gives way to checking what a network does.
Pepeto, Ethereum, Chainlink, and BNB each meet that test differently. One rests on smart contracts, one on exchange use, one on the data plumbing Web3 needs, and one on a presale listing at three times today’s cost. Knowing what separates them frames where money belongs right now.
Pepeto (PEPETO): More Than $11 Million Raised Before Any Listing
Pepeto (PEPETO), a presale token with a live zero fee exchange, bridge, and security scanner, is in the stage that matters most so far, and the terms deserve a look. The listing price sits at three times the current stage while a PEPETO token costs just $0.0000001896 today, a gap among the most striking setups in any best crypto to buy now conversation.
The presale has already taken in more than $11 Million from more than 43,000 holders, a number that shows how deep interest runs. Payment works in ETH, USDT, BNB, or by card, each stage runs until its set end, and the price rises when a stage closes. PepetoSwap, the exchange, is live now.
The fundamentals behind this stage are as notable, starting with staking at 162% APY for holders who lock. Rewards are claimable at listing, money in for the long run.
A Binance listing is approaching with more exchanges to be named, and the tools are shipping. The bridge, live across Ethereum, BNB Chain, Solana, Base, and Arbitrum, adds an extra layer for holders, while the exchange has been tested on $50 million a day. The scanner runs 42 checks per contract.
Each point shows a project shipping, not planning. The listing talk carries weight, with SolidProof’s audit done. This stage closes on its set end, and buyers join at the Pepeto official website.
Ethereum (ETH) Price: The Base Layer of On Chain Finance
Ethereum trades at $2,721 as of September 21, 2026, up 5.84% in 24 hours, with a market cap above $332 billion, per CoinMarketCap, and it remains the chain under DeFi.
More institutions, more tokenized assets, and a September 16 SEC roundtable weighing Ethereum against Solana for 24 hour stock trading (CoinMarketCap) back its long term case.
For anyone sorting the best crypto to buy now, Ethereum’s lead in DeFi and tokenized settlement puts it ahead of rivals.
It hosts most on chain finance and keeps pulling ETF money, and the level to hold is $2,534, the ceiling it cleared this week (CoinDCX, September 18). Rivals keep pushing, but network effects keep its case strong, though a $332 billion coin does not double on a headline.
BNB Price: Deep Exchange Ties and Steady Demand
BNB trades at $772.57 as of September 21, 2026, up 2.93% in 24 hours, with a market cap of $102.87 billion, per CoinMarketCap, a firm large cap on deep Binance ties. Fee discounts, staking, and every BNB Chain transaction feed demand.
Buyers keep BNB in view because its use is real volume, and on September 17 OpenEden brought tokenized Treasury bills to BNB Chain, lifting real world assets to $5.69 billion (Invezz). Regular burns keep shrinking supply. Regulation remains a risk, but deep liquidity keeps BNB a leader, though at $100 billion the easy multiples are gone.
Chainlink (LINK) Price: The Data Layer Web3 Runs On
Chainlink trades at $12.59 as of September 21, 2026, up 4.90% in 24 hours, with a market cap near $9.4 billion, per CoinMarketCap, and it leads the oracles by letting smart contracts read real world data and move value across chains, on buy lists for where it sits, not for hype.
Past price feeds, Chainlink has grown through CCIP and Proof of Reserve checks, and on September 16 Circle launched its Arc mainnet with Chainlink built in (CoinMarketCap).
Those services tie old finance to new rails, and banks keep it growing, with $12.09 the line to hold (Blockchain.News, September 18) and the price above it.
Conclusion
Each of the four gives the market something distinct. Ethereum leads DeFi and tokenized settlement, BNB draws on wide use, and Chainlink supplies the data layer Web3 is built on, and all three earned that years ago, so their next big multiple is hard.
Pepeto has drawn the sharpest attention with a set listing price, growing holder numbers, a Binance listing approaching, and live tools.
With more than $11 Million in, 43,000 holders, and live tools instead of a roadmap, the names that fill best crypto to buy now conversations are the ones delivering, and Pepeto is one of them, in the spot Ethereum buyers held at 31 cents in 2014.
Click To Visit Pepeto Website To Enter The Presale
FAQs
What is the best crypto to buy now?
Pepeto is the best crypto to buy now for growth, because it is still in presale, with a listing price three times above today’s stage, a live zero fee exchange, and more than 43,000 holders.
Is Pepeto safer than other presales?
Pepeto is safer than most presales because SolidProof audited the contract and verified the team, the exchange, bridge, and scanner already run, and the original Pepe coin’s cofounder is behind it.
DISCLAIMER: CAPTAINALTCOIN DOES NOT ENDORSE INVESTING IN ANY PROJECT MENTIONED IN SPONSORED ARTICLES. EXERCISE CAUTION AND DO THOROUGH RESEARCH BEFORE INVESTING YOUR MONEY. CaptainAltcoin takes no responsibility for its accuracy or quality. This content was not written by CaptainAltcoin’s team. We strongly advise readers to do their own thorough research before interacting with any featured companies. The information provided is not financial or legal advice. Neither CaptainAltcoin nor any third party recommends buying or selling any financial products. Investing in crypto assets is high-risk; consider the potential for loss. Any investment decisions made based on this content are at the sole risk of the readCaptainAltcoin is not liable for any damages or losses from using or relying on this content.
The post Best Crypto to Buy Now: Why Pepeto, Ethereum, Chainlink, and BNB Keep Landing in Every Conversation appeared first on CaptainAltcoin.
Pepeto, Ethereum, Chainlink, and BNB each meet that test differently. One rests on smart contracts, one on exchange use, one on the data plumbing Web3 needs, and one on a presale listing at three times today’s cost. Knowing what separates them frames where money belongs right now.
Pepeto (PEPETO): More Than $11 Million Raised Before Any Listing
Pepeto (PEPETO), a presale token with a live zero fee exchange, bridge, and security scanner, is in the stage that matters most so far, and the terms deserve a look. The listing price sits at three times the current stage while a PEPETO token costs just $0.0000001896 today, a gap among the most striking setups in any best crypto to buy now conversation.
The presale has already taken in more than $11 Million from more than 43,000 holders, a number that shows how deep interest runs. Payment works in ETH, USDT, BNB, or by card, each stage runs until its set end, and the price rises when a stage closes. PepetoSwap, the exchange, is live now.
The fundamentals behind this stage are as notable, starting with staking at 162% APY for holders who lock. Rewards are claimable at listing, money in for the long run.
A Binance listing is approaching with more exchanges to be named, and the tools are shipping. The bridge, live across Ethereum, BNB Chain, Solana, Base, and Arbitrum, adds an extra layer for holders, while the exchange has been tested on $50 million a day. The scanner runs 42 checks per contract.
Each point shows a project shipping, not planning. The listing talk carries weight, with SolidProof’s audit done. This stage closes on its set end, and buyers join at the Pepeto official website.
Ethereum (ETH) Price: The Base Layer of On Chain Finance
Ethereum trades at $2,721 as of September 21, 2026, up 5.84% in 24 hours, with a market cap above $332 billion, per CoinMarketCap, and it remains the chain under DeFi.
More institutions, more tokenized assets, and a September 16 SEC roundtable weighing Ethereum against Solana for 24 hour stock trading (CoinMarketCap) back its long term case.
For anyone sorting the best crypto to buy now, Ethereum’s lead in DeFi and tokenized settlement puts it ahead of rivals.
It hosts most on chain finance and keeps pulling ETF money, and the level to hold is $2,534, the ceiling it cleared this week (CoinDCX, September 18). Rivals keep pushing, but network effects keep its case strong, though a $332 billion coin does not double on a headline.
BNB Price: Deep Exchange Ties and Steady Demand
BNB trades at $772.57 as of September 21, 2026, up 2.93% in 24 hours, with a market cap of $102.87 billion, per CoinMarketCap, a firm large cap on deep Binance ties. Fee discounts, staking, and every BNB Chain transaction feed demand.
Buyers keep BNB in view because its use is real volume, and on September 17 OpenEden brought tokenized Treasury bills to BNB Chain, lifting real world assets to $5.69 billion (Invezz). Regular burns keep shrinking supply. Regulation remains a risk, but deep liquidity keeps BNB a leader, though at $100 billion the easy multiples are gone.
Chainlink (LINK) Price: The Data Layer Web3 Runs On
Chainlink trades at $12.59 as of September 21, 2026, up 4.90% in 24 hours, with a market cap near $9.4 billion, per CoinMarketCap, and it leads the oracles by letting smart contracts read real world data and move value across chains, on buy lists for where it sits, not for hype.
Past price feeds, Chainlink has grown through CCIP and Proof of Reserve checks, and on September 16 Circle launched its Arc mainnet with Chainlink built in (CoinMarketCap).
Those services tie old finance to new rails, and banks keep it growing, with $12.09 the line to hold (Blockchain.News, September 18) and the price above it.
Conclusion
Each of the four gives the market something distinct. Ethereum leads DeFi and tokenized settlement, BNB draws on wide use, and Chainlink supplies the data layer Web3 is built on, and all three earned that years ago, so their next big multiple is hard.
Pepeto has drawn the sharpest attention with a set listing price, growing holder numbers, a Binance listing approaching, and live tools.
With more than $11 Million in, 43,000 holders, and live tools instead of a roadmap, the names that fill best crypto to buy now conversations are the ones delivering, and Pepeto is one of them, in the spot Ethereum buyers held at 31 cents in 2014.
Click To Visit Pepeto Website To Enter The Presale
FAQs
What is the best crypto to buy now?
Pepeto is the best crypto to buy now for growth, because it is still in presale, with a listing price three times above today’s stage, a live zero fee exchange, and more than 43,000 holders.
Is Pepeto safer than other presales?
Pepeto is safer than most presales because SolidProof audited the contract and verified the team, the exchange, bridge, and scanner already run, and the original Pepe coin’s cofounder is behind it.
DISCLAIMER: CAPTAINALTCOIN DOES NOT ENDORSE INVESTING IN ANY PROJECT MENTIONED IN SPONSORED ARTICLES. EXERCISE CAUTION AND DO THOROUGH RESEARCH BEFORE INVESTING YOUR MONEY. CaptainAltcoin takes no responsibility for its accuracy or quality. This content was not written by CaptainAltcoin’s team. We strongly advise readers to do their own thorough research before interacting with any featured companies. The information provided is not financial or legal advice. Neither CaptainAltcoin nor any third party recommends buying or selling any financial products. Investing in crypto assets is high-risk; consider the potential for loss. Any investment decisions made based on this content are at the sole risk of the readCaptainAltcoin is not liable for any damages or losses from using or relying on this content.
The post Best Crypto to Buy Now: Why Pepeto, Ethereum, Chainlink, and BNB Keep Landing in Every Conversation appeared first on CaptainAltcoin.
73
Top 4 Next Crypto to Explode: Remittix, XRP, Hyperliquid and DOGE As RTX Locks Its Token DebutCrypto momentum is broadening as XRP trades near $1.55, Hyperliquid approaches $94 and Dogecoin returns toward $0.10. Each has a different catalyst, from payments and decentralised trading to retail speculation. Yet the strongest percentage opportunity may belong to the only name on this list that has not started public-market price discovery.
Remittix has locked in its scheduled token debut after passing $32 million. Its combination of PayFi, live perpetual markets, mobile wallet access and planned earning tools gives RTX a utility base before exchanges open it to wider demand. That makes Remittix the logical starting point for this four-crypto watchlist.
XRP, HYPE and DOGE Bring Public-Market Momentum
XRP remains one of crypto’s most established cross-border payment assets. Its recent recovery reflects renewed confidence, but a large market capitalisation reduces the probability of sudden, life-changing multiples from current levels.
Hyperliquid offers the strongest operational trading story in the group. HYPE sits close to $100 after its on-chain exchange attracted substantial derivatives activity. The platform can keep expanding, although buyers near record territory are paying for much of its success upfront.
Dogecoin delivers unmatched meme recognition and a loyal retail base. DOGE can move quickly when speculation accelerates, yet its price remains highly dependent on sentiment and whale activity rather than a diversified product suite. For portfolio construction, their different demand drivers can reduce reliance on one market narrative while keeping upside exposure.
Remittix Adds the Early PayFi Opportunity
Remittix targets the moment crypto leaves the blockchain and becomes usable money. Its PayFi network is designed to route digital assets into supported bank accounts across more than 30 fiat currencies, giving the project relevance to payroll, remittances, invoices and merchant settlement.
Remittix Markets is already live with hundreds of perpetual contracts and millions in reported trading volume. Its iOS wallet has passed 10,000 reported downloads, an Android version is planned and Remittix Earn is in final testing with advertised yields reaching 22% APY on selected assets.
The project plans to unite everything within a rebuilt wallet, potentially turning RTX into the connective layer for payments, trading, storage and rewards. This breadth is why Remittix can compete for attention with several established sectors at once.
Why RTX Ranks First Among the Four
Remittix has confirmed 24 November 2026 as the scheduled RTX launch date and reports more than 40,000 participants. The hard cap is fixed at $36 million, RTX currently costs $0.21 and the final presale stage is set at $0.46.
XRP, HYPE and DOGE all offer liquidity and recognisable narratives. RTX offers something different: the chance to establish a position before broad exchange access. If public trading attracts even a fraction of the payments, trading and wallet audiences Remittix is targeting, that smaller starting base could translate new demand into a larger percentage move.
Nothing guarantees an explosive result, and every token carries risk. Still, early-entry opportunities become rarer once a project secures products, funding and a launch date. Remittix has reached those milestones while the presale window remains open, creating exactly the imbalance growth-focused buyers seek: increasingly visible execution, but valuation that has not yet been tested by the wider market.
Discover the future of PayFi with Remittix by checking out their project here:
Website: https://remittixpresale.ioX: https://x.com/remittix
Frequently Asked Questions
Which of the four cryptos is still in presale?Remittix is the only presale project in the comparison; XRP, HYPE and DOGE already trade publicly.
Why is Hyperliquid attracting attention?Its on-chain derivatives platform has generated strong activity, pushing HYPE close to the $100 level.
What is the Remittix launch date?RTX is scheduled to launch on 24 November 2026, with exact timing to be confirmed through official channels.
DISCLAIMER: CAPTAINALTCOIN DOES NOT ENDORSE INVESTING IN ANY PROJECT MENTIONED IN SPONSORED ARTICLES. EXERCISE CAUTION AND DO THOROUGH RESEARCH BEFORE INVESTING YOUR MONEY. CaptainAltcoin takes no responsibility for its accuracy or quality. This content was not written by CaptainAltcoin’s team. We strongly advise readers to do their own thorough research before interacting with any featured companies. The information provided is not financial or legal advice. Neither CaptainAltcoin nor any third party recommends buying or selling any financial products. Investing in crypto assets is high-risk; consider the potential for loss. Any investment decisions made based on this content are at the sole risk of the readCaptainAltcoin is not liable for any damages or losses from using or relying on this content.
The post Top 4 Next Crypto to Explode: Remittix, XRP, Hyperliquid and DOGE as RTX Locks Its Token Debut appeared first on CaptainAltcoin.
Top 4 Next Crypto to Explode: Remittix, XRP, Hyperliquid and DOGE As RTX Locks Its Token Debut
Crypto momentum is broadening as XRP trades near $1.55, Hyperliquid approaches $94 and Dogecoin returns toward $0.10. Each has a different catalyst, from payments and decentralised trading to retail speculation. Yet the strongest percentage opportunity may belong to the only name on this list that has not started public-market price discovery.
Remittix has locked in its scheduled token debut after passing $32 million. Its combination of PayFi, live perpetual markets, mobile wallet access and planned earning tools gives RTX a utility base before exchanges open it to wider demand. That makes Remittix the logical starting point for this four-crypto watchlist.
XRP, HYPE and DOGE Bring Public-Market Momentum
XRP remains one of crypto’s most established cross-border payment assets. Its recent recovery reflects renewed confidence, but a large market capitalisation reduces the probability of sudden, life-changing multiples from current levels.
Hyperliquid offers the strongest operational trading story in the group. HYPE sits close to $100 after its on-chain exchange attracted substantial derivatives activity. The platform can keep expanding, although buyers near record territory are paying for much of its success upfront.
Dogecoin delivers unmatched meme recognition and a loyal retail base. DOGE can move quickly when speculation accelerates, yet its price remains highly dependent on sentiment and whale activity rather than a diversified product suite. For portfolio construction, their different demand drivers can reduce reliance on one market narrative while keeping upside exposure.
Remittix Adds the Early PayFi Opportunity
Remittix targets the moment crypto leaves the blockchain and becomes usable money. Its PayFi network is designed to route digital assets into supported bank accounts across more than 30 fiat currencies, giving the project relevance to payroll, remittances, invoices and merchant settlement.
Remittix Markets is already live with hundreds of perpetual contracts and millions in reported trading volume. Its iOS wallet has passed 10,000 reported downloads, an Android version is planned and Remittix Earn is in final testing with advertised yields reaching 22% APY on selected assets.
The project plans to unite everything within a rebuilt wallet, potentially turning RTX into the connective layer for payments, trading, storage and rewards. This breadth is why Remittix can compete for attention with several established sectors at once.
Why RTX Ranks First Among the Four
Remittix has confirmed 24 November 2026 as the scheduled RTX launch date and reports more than 40,000 participants. The hard cap is fixed at $36 million, RTX currently costs $0.21 and the final presale stage is set at $0.46.
XRP, HYPE and DOGE all offer liquidity and recognisable narratives. RTX offers something different: the chance to establish a position before broad exchange access. If public trading attracts even a fraction of the payments, trading and wallet audiences Remittix is targeting, that smaller starting base could translate new demand into a larger percentage move.
Nothing guarantees an explosive result, and every token carries risk. Still, early-entry opportunities become rarer once a project secures products, funding and a launch date. Remittix has reached those milestones while the presale window remains open, creating exactly the imbalance growth-focused buyers seek: increasingly visible execution, but valuation that has not yet been tested by the wider market.
Discover the future of PayFi with Remittix by checking out their project here:
Website: https://remittixpresale.ioX: https://x.com/remittix
Frequently Asked Questions
Which of the four cryptos is still in presale?Remittix is the only presale project in the comparison; XRP, HYPE and DOGE already trade publicly.
Why is Hyperliquid attracting attention?Its on-chain derivatives platform has generated strong activity, pushing HYPE close to the $100 level.
What is the Remittix launch date?RTX is scheduled to launch on 24 November 2026, with exact timing to be confirmed through official channels.
DISCLAIMER: CAPTAINALTCOIN DOES NOT ENDORSE INVESTING IN ANY PROJECT MENTIONED IN SPONSORED ARTICLES. EXERCISE CAUTION AND DO THOROUGH RESEARCH BEFORE INVESTING YOUR MONEY. CaptainAltcoin takes no responsibility for its accuracy or quality. This content was not written by CaptainAltcoin’s team. We strongly advise readers to do their own thorough research before interacting with any featured companies. The information provided is not financial or legal advice. Neither CaptainAltcoin nor any third party recommends buying or selling any financial products. Investing in crypto assets is high-risk; consider the potential for loss. Any investment decisions made based on this content are at the sole risk of the readCaptainAltcoin is not liable for any damages or losses from using or relying on this content.
The post Top 4 Next Crypto to Explode: Remittix, XRP, Hyperliquid and DOGE as RTX Locks Its Token Debut appeared first on CaptainAltcoin.
Remittix has locked in its scheduled token debut after passing $32 million. Its combination of PayFi, live perpetual markets, mobile wallet access and planned earning tools gives RTX a utility base before exchanges open it to wider demand. That makes Remittix the logical starting point for this four-crypto watchlist.
XRP, HYPE and DOGE Bring Public-Market Momentum
XRP remains one of crypto’s most established cross-border payment assets. Its recent recovery reflects renewed confidence, but a large market capitalisation reduces the probability of sudden, life-changing multiples from current levels.
Hyperliquid offers the strongest operational trading story in the group. HYPE sits close to $100 after its on-chain exchange attracted substantial derivatives activity. The platform can keep expanding, although buyers near record territory are paying for much of its success upfront.
Dogecoin delivers unmatched meme recognition and a loyal retail base. DOGE can move quickly when speculation accelerates, yet its price remains highly dependent on sentiment and whale activity rather than a diversified product suite. For portfolio construction, their different demand drivers can reduce reliance on one market narrative while keeping upside exposure.
Remittix Adds the Early PayFi Opportunity
Remittix targets the moment crypto leaves the blockchain and becomes usable money. Its PayFi network is designed to route digital assets into supported bank accounts across more than 30 fiat currencies, giving the project relevance to payroll, remittances, invoices and merchant settlement.
Remittix Markets is already live with hundreds of perpetual contracts and millions in reported trading volume. Its iOS wallet has passed 10,000 reported downloads, an Android version is planned and Remittix Earn is in final testing with advertised yields reaching 22% APY on selected assets.
The project plans to unite everything within a rebuilt wallet, potentially turning RTX into the connective layer for payments, trading, storage and rewards. This breadth is why Remittix can compete for attention with several established sectors at once.
Why RTX Ranks First Among the Four
Remittix has confirmed 24 November 2026 as the scheduled RTX launch date and reports more than 40,000 participants. The hard cap is fixed at $36 million, RTX currently costs $0.21 and the final presale stage is set at $0.46.
XRP, HYPE and DOGE all offer liquidity and recognisable narratives. RTX offers something different: the chance to establish a position before broad exchange access. If public trading attracts even a fraction of the payments, trading and wallet audiences Remittix is targeting, that smaller starting base could translate new demand into a larger percentage move.
Nothing guarantees an explosive result, and every token carries risk. Still, early-entry opportunities become rarer once a project secures products, funding and a launch date. Remittix has reached those milestones while the presale window remains open, creating exactly the imbalance growth-focused buyers seek: increasingly visible execution, but valuation that has not yet been tested by the wider market.
Discover the future of PayFi with Remittix by checking out their project here:
Website: https://remittixpresale.ioX: https://x.com/remittix
Frequently Asked Questions
Which of the four cryptos is still in presale?Remittix is the only presale project in the comparison; XRP, HYPE and DOGE already trade publicly.
Why is Hyperliquid attracting attention?Its on-chain derivatives platform has generated strong activity, pushing HYPE close to the $100 level.
What is the Remittix launch date?RTX is scheduled to launch on 24 November 2026, with exact timing to be confirmed through official channels.
DISCLAIMER: CAPTAINALTCOIN DOES NOT ENDORSE INVESTING IN ANY PROJECT MENTIONED IN SPONSORED ARTICLES. EXERCISE CAUTION AND DO THOROUGH RESEARCH BEFORE INVESTING YOUR MONEY. CaptainAltcoin takes no responsibility for its accuracy or quality. This content was not written by CaptainAltcoin’s team. We strongly advise readers to do their own thorough research before interacting with any featured companies. The information provided is not financial or legal advice. Neither CaptainAltcoin nor any third party recommends buying or selling any financial products. Investing in crypto assets is high-risk; consider the potential for loss. Any investment decisions made based on this content are at the sole risk of the readCaptainAltcoin is not liable for any damages or losses from using or relying on this content.
The post Top 4 Next Crypto to Explode: Remittix, XRP, Hyperliquid and DOGE as RTX Locks Its Token Debut appeared first on CaptainAltcoin.
193
Remittix’s Final Presale Stage Is Set At $0.46 As Crypto Experts Debate Whether RTX Could Climb t...Bullish RTX forecasts are intensifying after Remittix crossed $32 million and confirmed its token launch schedule. Some market commentators have floated post-launch scenarios of $3.50 or $5, but those figures are speculative targets rather than guaranteed outcomes. The factual pricing position is simpler: RTX currently costs $0.21, while $0.46 is the final presale-stage price.
What gives the debate substance is the ecosystem behind Remittix. The project is entering launch with crypto-to-bank PayFi tools, a live perpetuals platform, an iOS wallet and an earning product approaching release. If those products create recurring usage, RTX could have more to drive demand than a temporary listing narrative.
What Would a $3.50 or $5 RTX Price Require?
A move from the final $0.46 presale stage to $3.50 would represent roughly 7.6x, while $5 would imply nearly 10.9x. Measured from the current $0.21 entry, the multiples would be considerably larger. Those calculations explain the excitement, but arithmetic alone does not establish a forecast.
RTX would need exchange liquidity, sustained buyer demand, successful product integration and an active user base. Broader market conditions would also matter. A strong altcoin cycle could amplify attention, while weak liquidity could delay even a well-executed launch.
The strongest case is therefore not that a particular target must occur. It is that Remittix still sits early enough for successful adoption to produce a meaningful revaluation. A credible valuation model should also consider circulating supply at launch, token distribution, exchange depth and the pace of user conversion.
Remittix Is Launching More Than a Payment Token
PayFi is the foundation. Remittix aims to let users send crypto that settles into supported bank accounts in local fiat, potentially serving freelancers, businesses and families that need faster cross-border transfers.
Around that service, Remittix Markets is live with hundreds of perpetual-futures pairs and millions in reported volume. The Remittix wallet is available on iOS with more than 10,000 reported downloads, an Android edition is planned, and Remittix Earn is in final testing with returns advertised at up to 22% APY on selected assets.
The wider wallet rebuild is intended to combine PayFi, Markets, Earn and RTX. That one-stop model could encourage users to remain inside the ecosystem rather than interacting once and leaving, which is important for long-term token relevance.
Why the Current RTX Window Could Close Quickly
Remittix has scheduled its token launch for 24 November 2026 after attracting more than 40,000 reported participants. The presale ends at a $36 million hard cap, creating a finite runway between the $32 million milestone and launch.
Current buyers enter at $0.21 before later stages reach the stated $0.46 final level. That staged increase rewards earlier conviction and makes waiting costly if the project continues hitting milestones. Open-market buyers will not receive the same controlled entry once exchanges determine price through live demand and supply.
Targets of $3.50 or $5 should remain scenarios, not promises. Even so, the setup explains why FOMO is building: a defined launch date, working products, capped presale capacity and several potential user funnels. If Remittix can become the unified crypto-finance hub it is building toward, today’s debate may eventually shift from whether RTX can reprice to how much of the early opportunity was available before the crowd arrived.
Discover the future of PayFi with Remittix by checking out their project here:
Website: https://remittixpresale.ioX: https://x.com/remittix
Frequently Asked Questions
Has RTX already reached $0.46?No. RTX is currently available at $0.21; $0.46 is the announced final presale-stage price.
Are the $3.50 and $5 targets guaranteed?No. They are speculative bullish scenarios that depend on adoption, execution, liquidity and market conditions.
When is RTX scheduled to launch?Remittix has announced 24 November 2026 as the scheduled token launch date.
DISCLAIMER: CAPTAINALTCOIN DOES NOT ENDORSE INVESTING IN ANY PROJECT MENTIONED IN SPONSORED ARTICLES. EXERCISE CAUTION AND DO THOROUGH RESEARCH BEFORE INVESTING YOUR MONEY. CaptainAltcoin takes no responsibility for its accuracy or quality. This content was not written by CaptainAltcoin’s team. We strongly advise readers to do their own thorough research before interacting with any featured companies. The information provided is not financial or legal advice. Neither CaptainAltcoin nor any third party recommends buying or selling any financial products. Investing in crypto assets is high-risk; consider the potential for loss. Any investment decisions made based on this content are at the sole risk of the readCaptainAltcoin is not liable for any damages or losses from using or relying on this content.
The post Remittix’s Final Presale Stage Is Set at $0.46 as Crypto Experts Debate Whether RTX Could Climb to $3.50 or $5 appeared first on CaptainAltcoin.
Remittix’s Final Presale Stage Is Set At $0.46 As Crypto Experts Debate Whether RTX Could Climb t...
Bullish RTX forecasts are intensifying after Remittix crossed $32 million and confirmed its token launch schedule. Some market commentators have floated post-launch scenarios of $3.50 or $5, but those figures are speculative targets rather than guaranteed outcomes. The factual pricing position is simpler: RTX currently costs $0.21, while $0.46 is the final presale-stage price.
What gives the debate substance is the ecosystem behind Remittix. The project is entering launch with crypto-to-bank PayFi tools, a live perpetuals platform, an iOS wallet and an earning product approaching release. If those products create recurring usage, RTX could have more to drive demand than a temporary listing narrative.
What Would a $3.50 or $5 RTX Price Require?
A move from the final $0.46 presale stage to $3.50 would represent roughly 7.6x, while $5 would imply nearly 10.9x. Measured from the current $0.21 entry, the multiples would be considerably larger. Those calculations explain the excitement, but arithmetic alone does not establish a forecast.
RTX would need exchange liquidity, sustained buyer demand, successful product integration and an active user base. Broader market conditions would also matter. A strong altcoin cycle could amplify attention, while weak liquidity could delay even a well-executed launch.
The strongest case is therefore not that a particular target must occur. It is that Remittix still sits early enough for successful adoption to produce a meaningful revaluation. A credible valuation model should also consider circulating supply at launch, token distribution, exchange depth and the pace of user conversion.
Remittix Is Launching More Than a Payment Token
PayFi is the foundation. Remittix aims to let users send crypto that settles into supported bank accounts in local fiat, potentially serving freelancers, businesses and families that need faster cross-border transfers.
Around that service, Remittix Markets is live with hundreds of perpetual-futures pairs and millions in reported volume. The Remittix wallet is available on iOS with more than 10,000 reported downloads, an Android edition is planned, and Remittix Earn is in final testing with returns advertised at up to 22% APY on selected assets.
The wider wallet rebuild is intended to combine PayFi, Markets, Earn and RTX. That one-stop model could encourage users to remain inside the ecosystem rather than interacting once and leaving, which is important for long-term token relevance.
Why the Current RTX Window Could Close Quickly
Remittix has scheduled its token launch for 24 November 2026 after attracting more than 40,000 reported participants. The presale ends at a $36 million hard cap, creating a finite runway between the $32 million milestone and launch.
Current buyers enter at $0.21 before later stages reach the stated $0.46 final level. That staged increase rewards earlier conviction and makes waiting costly if the project continues hitting milestones. Open-market buyers will not receive the same controlled entry once exchanges determine price through live demand and supply.
Targets of $3.50 or $5 should remain scenarios, not promises. Even so, the setup explains why FOMO is building: a defined launch date, working products, capped presale capacity and several potential user funnels. If Remittix can become the unified crypto-finance hub it is building toward, today’s debate may eventually shift from whether RTX can reprice to how much of the early opportunity was available before the crowd arrived.
Discover the future of PayFi with Remittix by checking out their project here:
Website: https://remittixpresale.ioX: https://x.com/remittix
Frequently Asked Questions
Has RTX already reached $0.46?No. RTX is currently available at $0.21; $0.46 is the announced final presale-stage price.
Are the $3.50 and $5 targets guaranteed?No. They are speculative bullish scenarios that depend on adoption, execution, liquidity and market conditions.
When is RTX scheduled to launch?Remittix has announced 24 November 2026 as the scheduled token launch date.
DISCLAIMER: CAPTAINALTCOIN DOES NOT ENDORSE INVESTING IN ANY PROJECT MENTIONED IN SPONSORED ARTICLES. EXERCISE CAUTION AND DO THOROUGH RESEARCH BEFORE INVESTING YOUR MONEY. CaptainAltcoin takes no responsibility for its accuracy or quality. This content was not written by CaptainAltcoin’s team. We strongly advise readers to do their own thorough research before interacting with any featured companies. The information provided is not financial or legal advice. Neither CaptainAltcoin nor any third party recommends buying or selling any financial products. Investing in crypto assets is high-risk; consider the potential for loss. Any investment decisions made based on this content are at the sole risk of the readCaptainAltcoin is not liable for any damages or losses from using or relying on this content.
The post Remittix’s Final Presale Stage Is Set at $0.46 as Crypto Experts Debate Whether RTX Could Climb to $3.50 or $5 appeared first on CaptainAltcoin.
What gives the debate substance is the ecosystem behind Remittix. The project is entering launch with crypto-to-bank PayFi tools, a live perpetuals platform, an iOS wallet and an earning product approaching release. If those products create recurring usage, RTX could have more to drive demand than a temporary listing narrative.
What Would a $3.50 or $5 RTX Price Require?
A move from the final $0.46 presale stage to $3.50 would represent roughly 7.6x, while $5 would imply nearly 10.9x. Measured from the current $0.21 entry, the multiples would be considerably larger. Those calculations explain the excitement, but arithmetic alone does not establish a forecast.
RTX would need exchange liquidity, sustained buyer demand, successful product integration and an active user base. Broader market conditions would also matter. A strong altcoin cycle could amplify attention, while weak liquidity could delay even a well-executed launch.
The strongest case is therefore not that a particular target must occur. It is that Remittix still sits early enough for successful adoption to produce a meaningful revaluation. A credible valuation model should also consider circulating supply at launch, token distribution, exchange depth and the pace of user conversion.
Remittix Is Launching More Than a Payment Token
PayFi is the foundation. Remittix aims to let users send crypto that settles into supported bank accounts in local fiat, potentially serving freelancers, businesses and families that need faster cross-border transfers.
Around that service, Remittix Markets is live with hundreds of perpetual-futures pairs and millions in reported volume. The Remittix wallet is available on iOS with more than 10,000 reported downloads, an Android edition is planned, and Remittix Earn is in final testing with returns advertised at up to 22% APY on selected assets.
The wider wallet rebuild is intended to combine PayFi, Markets, Earn and RTX. That one-stop model could encourage users to remain inside the ecosystem rather than interacting once and leaving, which is important for long-term token relevance.
Why the Current RTX Window Could Close Quickly
Remittix has scheduled its token launch for 24 November 2026 after attracting more than 40,000 reported participants. The presale ends at a $36 million hard cap, creating a finite runway between the $32 million milestone and launch.
Current buyers enter at $0.21 before later stages reach the stated $0.46 final level. That staged increase rewards earlier conviction and makes waiting costly if the project continues hitting milestones. Open-market buyers will not receive the same controlled entry once exchanges determine price through live demand and supply.
Targets of $3.50 or $5 should remain scenarios, not promises. Even so, the setup explains why FOMO is building: a defined launch date, working products, capped presale capacity and several potential user funnels. If Remittix can become the unified crypto-finance hub it is building toward, today’s debate may eventually shift from whether RTX can reprice to how much of the early opportunity was available before the crowd arrived.
Discover the future of PayFi with Remittix by checking out their project here:
Website: https://remittixpresale.ioX: https://x.com/remittix
Frequently Asked Questions
Has RTX already reached $0.46?No. RTX is currently available at $0.21; $0.46 is the announced final presale-stage price.
Are the $3.50 and $5 targets guaranteed?No. They are speculative bullish scenarios that depend on adoption, execution, liquidity and market conditions.
When is RTX scheduled to launch?Remittix has announced 24 November 2026 as the scheduled token launch date.
DISCLAIMER: CAPTAINALTCOIN DOES NOT ENDORSE INVESTING IN ANY PROJECT MENTIONED IN SPONSORED ARTICLES. EXERCISE CAUTION AND DO THOROUGH RESEARCH BEFORE INVESTING YOUR MONEY. CaptainAltcoin takes no responsibility for its accuracy or quality. This content was not written by CaptainAltcoin’s team. We strongly advise readers to do their own thorough research before interacting with any featured companies. The information provided is not financial or legal advice. Neither CaptainAltcoin nor any third party recommends buying or selling any financial products. Investing in crypto assets is high-risk; consider the potential for loss. Any investment decisions made based on this content are at the sole risk of the readCaptainAltcoin is not liable for any damages or losses from using or relying on this content.
The post Remittix’s Final Presale Stage Is Set at $0.46 as Crypto Experts Debate Whether RTX Could Climb to $3.50 or $5 appeared first on CaptainAltcoin.
107

Статья
Mantle Hits Back-to-Back All-Time Highs With 1,473 Tokenized Assets and $476M in Distributed Asse...DUBAI, UAE, Sept. 25, 2026 /PRNewswire/ — Mantle, the open financial network connecting global market participants to institutional-grade capital market assets on-chain, today announced back-to-back all-time highs across two of the most closely tracked benchmarks in tokenized finance. The total number of tokenized assets on Mantle has crossed 1,473, up from 71 at the start of the year, per Blockworks Research, while total Distributed Asset Value for real-world assets (RWAs) on Mantle has climbed to $476 million, a 110% increase over the past 30 days, per RWA.xyz.
Both milestones reflect the accelerating concentration of institutional-grade real-world assets on Mantle, with the network’s tokenized asset count growing more than twentyfold since January.
The Numbers Behind the Growth
The 1,473 tokenized asset count places Mantle among the fastest-growing networks for real-world asset issuance in 2026, driven by an expanding roster of established issuers building on the network, including xStocks for tokenized equities and ETFs, Securitize for tokenized index funds, Ethena for yield-bearing stablecoins, Paxos for regulated dollar issuance and more.The $476.10 million in Distributed Asset Value, more than doubling in a single month, reflects both the scale of individual asset launches and the deepening liquidity behind them, spanning tokenized equities, ETFs, stablecoins, and yield-bearing instruments including the Mantle Vault, which extended into decentralized finance earlier this year alongside Grove, CIAN, and Fluxion.
These milestones follow a series of high-profile listings on Mantle in recent months, including the on-chain listing of tokenized SpaceX equity (SPCXx) simultaneously with the SpaceX IPO; the addition of Franklin Templeton’s USPX ETF (USPXx) as one of the first Ethereum Layer 2 networks to bring a tokenized ETF from one of the world’s largest asset managers on-chain; and the native minting of USDG, the Paxos-issued regulated stablecoin, joining Mantle to the Global Dollar Network alongside more than 150 partners.
Why the Growth Is Concentrating on Mantle
Real-world assets require infrastructure built for institutional standards: regulated custody, verifiable settlement, deep liquidity, and composable utility. As the largest chain running ZK validity proofs on Ethereum, Mantle delivers verifiable settlement with institutional-grade security, paired with a distribution stack that spans both centralized and on-chain venues through Bybit and Fluxion. Assets on Mantle trade 24/7 through Fluxion’s hybrid AMM and Atomic RFQ infrastructure, and remain productive from the moment they land through the network’s growing suite of yield products and DeFi integrations.
“These all-time highs reflect what we have been building toward from the start: borderless access to global capital markets, on infrastructure that can carry them at scale,” said Emily Bao, Key Advisor at Mantle and Head of Spot at Bybit. “Every asset that lands on Mantle brings us closer to a network where anyone, anywhere, can reach institutional-grade opportunities without the barriers that have historically defined them.”
About Mantle
Mantle is the open financial network connecting global market participants to institutional-grade capital market assets on-chain. With institutional-grade infrastructure and a composable ecosystem anchored by MNT within Bybit and built out through core projects including mETH, fBTC, and MI4, Mantle serves as the destination where institutional RWA capital concentrates on-chain. For more information visit mantle.xyz.
For media enquiries, please contact: contact@mantle.xyz
The post Mantle Hits Back-to-Back All-Time Highs with 1,473 Tokenized Assets and $476M in Distributed Asset Value appeared first on CaptainAltcoin.
Mantle Hits Back-to-Back All-Time Highs With 1,473 Tokenized Assets and $476M in Distributed Asse...
DUBAI, UAE, Sept. 25, 2026 /PRNewswire/ — Mantle, the open financial network connecting global market participants to institutional-grade capital market assets on-chain, today announced back-to-back all-time highs across two of the most closely tracked benchmarks in tokenized finance. The total number of tokenized assets on Mantle has crossed 1,473, up from 71 at the start of the year, per Blockworks Research, while total Distributed Asset Value for real-world assets (RWAs) on Mantle has climbed to $476 million, a 110% increase over the past 30 days, per RWA.xyz.
Both milestones reflect the accelerating concentration of institutional-grade real-world assets on Mantle, with the network’s tokenized asset count growing more than twentyfold since January.
The Numbers Behind the Growth
The 1,473 tokenized asset count places Mantle among the fastest-growing networks for real-world asset issuance in 2026, driven by an expanding roster of established issuers building on the network, including xStocks for tokenized equities and ETFs, Securitize for tokenized index funds, Ethena for yield-bearing stablecoins, Paxos for regulated dollar issuance and more.The $476.10 million in Distributed Asset Value, more than doubling in a single month, reflects both the scale of individual asset launches and the deepening liquidity behind them, spanning tokenized equities, ETFs, stablecoins, and yield-bearing instruments including the Mantle Vault, which extended into decentralized finance earlier this year alongside Grove, CIAN, and Fluxion.
These milestones follow a series of high-profile listings on Mantle in recent months, including the on-chain listing of tokenized SpaceX equity (SPCXx) simultaneously with the SpaceX IPO; the addition of Franklin Templeton’s USPX ETF (USPXx) as one of the first Ethereum Layer 2 networks to bring a tokenized ETF from one of the world’s largest asset managers on-chain; and the native minting of USDG, the Paxos-issued regulated stablecoin, joining Mantle to the Global Dollar Network alongside more than 150 partners.
Why the Growth Is Concentrating on Mantle
Real-world assets require infrastructure built for institutional standards: regulated custody, verifiable settlement, deep liquidity, and composable utility. As the largest chain running ZK validity proofs on Ethereum, Mantle delivers verifiable settlement with institutional-grade security, paired with a distribution stack that spans both centralized and on-chain venues through Bybit and Fluxion. Assets on Mantle trade 24/7 through Fluxion’s hybrid AMM and Atomic RFQ infrastructure, and remain productive from the moment they land through the network’s growing suite of yield products and DeFi integrations.
“These all-time highs reflect what we have been building toward from the start: borderless access to global capital markets, on infrastructure that can carry them at scale,” said Emily Bao, Key Advisor at Mantle and Head of Spot at Bybit. “Every asset that lands on Mantle brings us closer to a network where anyone, anywhere, can reach institutional-grade opportunities without the barriers that have historically defined them.”
About Mantle
Mantle is the open financial network connecting global market participants to institutional-grade capital market assets on-chain. With institutional-grade infrastructure and a composable ecosystem anchored by MNT within Bybit and built out through core projects including mETH, fBTC, and MI4, Mantle serves as the destination where institutional RWA capital concentrates on-chain. For more information visit mantle.xyz.
For media enquiries, please contact: contact@mantle.xyz
The post Mantle Hits Back-to-Back All-Time Highs with 1,473 Tokenized Assets and $476M in Distributed Asset Value appeared first on CaptainAltcoin.
Both milestones reflect the accelerating concentration of institutional-grade real-world assets on Mantle, with the network’s tokenized asset count growing more than twentyfold since January.
The Numbers Behind the Growth
The 1,473 tokenized asset count places Mantle among the fastest-growing networks for real-world asset issuance in 2026, driven by an expanding roster of established issuers building on the network, including xStocks for tokenized equities and ETFs, Securitize for tokenized index funds, Ethena for yield-bearing stablecoins, Paxos for regulated dollar issuance and more.The $476.10 million in Distributed Asset Value, more than doubling in a single month, reflects both the scale of individual asset launches and the deepening liquidity behind them, spanning tokenized equities, ETFs, stablecoins, and yield-bearing instruments including the Mantle Vault, which extended into decentralized finance earlier this year alongside Grove, CIAN, and Fluxion.
These milestones follow a series of high-profile listings on Mantle in recent months, including the on-chain listing of tokenized SpaceX equity (SPCXx) simultaneously with the SpaceX IPO; the addition of Franklin Templeton’s USPX ETF (USPXx) as one of the first Ethereum Layer 2 networks to bring a tokenized ETF from one of the world’s largest asset managers on-chain; and the native minting of USDG, the Paxos-issued regulated stablecoin, joining Mantle to the Global Dollar Network alongside more than 150 partners.
Why the Growth Is Concentrating on Mantle
Real-world assets require infrastructure built for institutional standards: regulated custody, verifiable settlement, deep liquidity, and composable utility. As the largest chain running ZK validity proofs on Ethereum, Mantle delivers verifiable settlement with institutional-grade security, paired with a distribution stack that spans both centralized and on-chain venues through Bybit and Fluxion. Assets on Mantle trade 24/7 through Fluxion’s hybrid AMM and Atomic RFQ infrastructure, and remain productive from the moment they land through the network’s growing suite of yield products and DeFi integrations.
“These all-time highs reflect what we have been building toward from the start: borderless access to global capital markets, on infrastructure that can carry them at scale,” said Emily Bao, Key Advisor at Mantle and Head of Spot at Bybit. “Every asset that lands on Mantle brings us closer to a network where anyone, anywhere, can reach institutional-grade opportunities without the barriers that have historically defined them.”
About Mantle
Mantle is the open financial network connecting global market participants to institutional-grade capital market assets on-chain. With institutional-grade infrastructure and a composable ecosystem anchored by MNT within Bybit and built out through core projects including mETH, fBTC, and MI4, Mantle serves as the destination where institutional RWA capital concentrates on-chain. For more information visit mantle.xyz.
For media enquiries, please contact: contact@mantle.xyz
The post Mantle Hits Back-to-Back All-Time Highs with 1,473 Tokenized Assets and $476M in Distributed Asset Value appeared first on CaptainAltcoin.
82
Crypto News Today: Bitcoin Faces $16B Test As BlackRock Makes Big MoveBitcoin enters Friday with a large options expiry ahead and its price under pressure. The contracts involved are worth nearly $16 billion on paper, but that figure alone does not tell us where Bitcoin goes next.
Elsewhere, BlackRock has helped bring 3 investment strategies on-chain through Ondo Finance. The 2 developments make this a busy day for crypto, though they affect different parts of the market.
Bitcoin Price Faces a $15.6B Options Expiry
About 182,000 BTC in options contracts are due to expire today, Friday, September 25, with a reported notional value of roughly $15.6 billion. That is the value of the Bitcoin referenced by the contracts. It does not mean $15.6 billion of Bitcoin will be bought or sold when they expire.
An option gives its holder the right to buy or sell an asset at a set price before a deadline. A call gives the right to buy, and a put gives the right to sell. Contracts that end up too far from Bitcoin’s market price may expire without being exercised. Other positions may already have protection in place through separate trades.
The possible market effect comes from that protection. Dealers who sold options often buy or sell Bitcoin or related instruments to manage their exposure. As Friday’s deadline gets closer, changes in Bitcoin price can lead them to adjust those positions. That activity can add to short-term price moves, although the expiry itself does not guarantee a dramatic move.
Calls cover about 106,200 BTC, compared with roughly 75,900 BTC in puts. The larger call total may look bullish at first glance, but the prices attached to those contracts matter. Many calls are placed at $90,000 and $100,000, well above the Bitcoin price cited in the expiry data. Unless BTC moves much higher before the deadline, those contracts offer little immediate support for a bullish reading.
$18,140,000,000 in $BTC and $ETH options will expire this Friday. Max pain for Bitcoin: $75,000 Max pain for Ethereum: $2,250 pic.twitter.com/FtthIAquoW
— Ted (@TedPillows) September 22, 2026
Why Bitcoin Traders Are Watching $76,000
The reported “max pain” price for this expiry is around $76,000. This is the price at which options holders, taken together, would lose the most value at expiry. Some traders use it as a reference point when a large group of contracts is about to close.
That does not make $76,000 a reliable Bitcoin price target. Max pain describes the options positions outstanding at a particular time. It does not account for every force affecting the market, and those positions can change before expiry. Bitcoin can finish far from the figure if broader demand, economic news or fresh trading activity proves stronger.
Another notable concentration of calls and puts lies around $70,000. That tells us participants have positions across a wide range of possible prices. It does not, on its own, show that Bitcoin is heading there. The more useful questions for Friday are whether BTC can regain lost ground and how it behaves as the largest options positions close.
BlackRock Strategies Reach Onchain Investors Through Ondo
Bitcoin’s expiry is only part of today’s crypto news. Ondo Finance has launched 3 onchain investment portfolios based on strategies BlackRock developed for the company. Each portfolio is offered through a token that represents exposure to a group of assets, giving eligible investors access through a single onchain product. Availability is currently limited to eligible investors outside the United States.
The distinction between the companies’ roles matters. BlackRock developed the portfolio strategies, and Ondo launched the onchain products. The announcement does not mean BlackRock has launched a new cryptocurrency or that its clients are buying Bitcoin through these portfolios.
The move is still notable for tokenization. A portfolio that would usually be accessed through traditional investment systems now has an onchain format. Its progress will depend on who can use it, how the portfolios perform and whether investors find the token format useful. There is no direct reason to treat the launch as a prediction for Bitcoin price on Friday.
Eleanor Terrett also pointed to ARK Invest’s work with Securitize to bring its venture fund onchain. Together, the announcements show established investment firms testing blockchain based ways to offer existing financial products. Those developments may matter over time, even if Friday’s immediate focus remains on Bitcoin options.
NEW: A few notable developments in crypto today: @Ondo partnered with @BlackRock to launch three onchain investment portfolios using strategies developed by the asset manager. For now, they’re available only to eligible investors outside the U.S. @ARKInvest is…
— Eleanor Terrett (@EleanorTerrett) September 24, 2026
Stablecoin Proposals and CFTC Guidance Add to the Day’s News
United States regulators supplied 2 more developments. The Federal Reserve has proposed 2 measures under the GENIUS Act. One addresses requirements for stablecoin issuers under its supervision, including reserves, capital, custody and risk management. The other addresses how banks it oversees could apply to issue payment stablecoins. These are proposals open for public comment, so they should not be described as final rules.
Read Also: Gold and Silver Prices Today: Bond Crisis Is Creating a Strange Setup
The CFTC also updated staff guidance on 2 practical questions for registered derivatives firms. The update covers tokenized forms of investments that are already permitted for customer funds and the use of blockchain technology to meet recordkeeping requirements. It clarifies how existing obligations can apply when firms use tokenized assets or blockchain records.
These updates have different timelines from Friday’s options expiry. Regulatory proposals require further review, and new onchain investment products need time to develop a track record. Neither provides a clear answer to where Bitcoin price will close today.
FAQs
Can you cash out Bitcoin?
Yes, you can cash out Bitcoin by converting it into traditional fiat currency like US dollars and transferring it to your bank, debit card, or picking up physical cash.
Is BTC real money?
Bitcoin is real digital money, but it is not a traditional government-backed currency.
Subscribe to our YouTube channel for daily crypto updates, market insights, and expert analysis.
The post Crypto News Today: Bitcoin Faces $16B Test as BlackRock Makes Big Move appeared first on CaptainAltcoin.
Crypto News Today: Bitcoin Faces $16B Test As BlackRock Makes Big Move
Bitcoin enters Friday with a large options expiry ahead and its price under pressure. The contracts involved are worth nearly $16 billion on paper, but that figure alone does not tell us where Bitcoin goes next.
Elsewhere, BlackRock has helped bring 3 investment strategies on-chain through Ondo Finance. The 2 developments make this a busy day for crypto, though they affect different parts of the market.
Bitcoin Price Faces a $15.6B Options Expiry
About 182,000 BTC in options contracts are due to expire today, Friday, September 25, with a reported notional value of roughly $15.6 billion. That is the value of the Bitcoin referenced by the contracts. It does not mean $15.6 billion of Bitcoin will be bought or sold when they expire.
An option gives its holder the right to buy or sell an asset at a set price before a deadline. A call gives the right to buy, and a put gives the right to sell. Contracts that end up too far from Bitcoin’s market price may expire without being exercised. Other positions may already have protection in place through separate trades.
The possible market effect comes from that protection. Dealers who sold options often buy or sell Bitcoin or related instruments to manage their exposure. As Friday’s deadline gets closer, changes in Bitcoin price can lead them to adjust those positions. That activity can add to short-term price moves, although the expiry itself does not guarantee a dramatic move.
Calls cover about 106,200 BTC, compared with roughly 75,900 BTC in puts. The larger call total may look bullish at first glance, but the prices attached to those contracts matter. Many calls are placed at $90,000 and $100,000, well above the Bitcoin price cited in the expiry data. Unless BTC moves much higher before the deadline, those contracts offer little immediate support for a bullish reading.
$18,140,000,000 in $BTC and $ETH options will expire this Friday. Max pain for Bitcoin: $75,000 Max pain for Ethereum: $2,250 pic.twitter.com/FtthIAquoW
— Ted (@TedPillows) September 22, 2026
Why Bitcoin Traders Are Watching $76,000
The reported “max pain” price for this expiry is around $76,000. This is the price at which options holders, taken together, would lose the most value at expiry. Some traders use it as a reference point when a large group of contracts is about to close.
That does not make $76,000 a reliable Bitcoin price target. Max pain describes the options positions outstanding at a particular time. It does not account for every force affecting the market, and those positions can change before expiry. Bitcoin can finish far from the figure if broader demand, economic news or fresh trading activity proves stronger.
Another notable concentration of calls and puts lies around $70,000. That tells us participants have positions across a wide range of possible prices. It does not, on its own, show that Bitcoin is heading there. The more useful questions for Friday are whether BTC can regain lost ground and how it behaves as the largest options positions close.
BlackRock Strategies Reach Onchain Investors Through Ondo
Bitcoin’s expiry is only part of today’s crypto news. Ondo Finance has launched 3 onchain investment portfolios based on strategies BlackRock developed for the company. Each portfolio is offered through a token that represents exposure to a group of assets, giving eligible investors access through a single onchain product. Availability is currently limited to eligible investors outside the United States.
The distinction between the companies’ roles matters. BlackRock developed the portfolio strategies, and Ondo launched the onchain products. The announcement does not mean BlackRock has launched a new cryptocurrency or that its clients are buying Bitcoin through these portfolios.
The move is still notable for tokenization. A portfolio that would usually be accessed through traditional investment systems now has an onchain format. Its progress will depend on who can use it, how the portfolios perform and whether investors find the token format useful. There is no direct reason to treat the launch as a prediction for Bitcoin price on Friday.
Eleanor Terrett also pointed to ARK Invest’s work with Securitize to bring its venture fund onchain. Together, the announcements show established investment firms testing blockchain based ways to offer existing financial products. Those developments may matter over time, even if Friday’s immediate focus remains on Bitcoin options.
NEW: A few notable developments in crypto today: @Ondo partnered with @BlackRock to launch three onchain investment portfolios using strategies developed by the asset manager. For now, they’re available only to eligible investors outside the U.S. @ARKInvest is…
— Eleanor Terrett (@EleanorTerrett) September 24, 2026
Stablecoin Proposals and CFTC Guidance Add to the Day’s News
United States regulators supplied 2 more developments. The Federal Reserve has proposed 2 measures under the GENIUS Act. One addresses requirements for stablecoin issuers under its supervision, including reserves, capital, custody and risk management. The other addresses how banks it oversees could apply to issue payment stablecoins. These are proposals open for public comment, so they should not be described as final rules.
Read Also: Gold and Silver Prices Today: Bond Crisis Is Creating a Strange Setup
The CFTC also updated staff guidance on 2 practical questions for registered derivatives firms. The update covers tokenized forms of investments that are already permitted for customer funds and the use of blockchain technology to meet recordkeeping requirements. It clarifies how existing obligations can apply when firms use tokenized assets or blockchain records.
These updates have different timelines from Friday’s options expiry. Regulatory proposals require further review, and new onchain investment products need time to develop a track record. Neither provides a clear answer to where Bitcoin price will close today.
FAQs
Can you cash out Bitcoin?
Yes, you can cash out Bitcoin by converting it into traditional fiat currency like US dollars and transferring it to your bank, debit card, or picking up physical cash.
Is BTC real money?
Bitcoin is real digital money, but it is not a traditional government-backed currency.
Subscribe to our YouTube channel for daily crypto updates, market insights, and expert analysis.
The post Crypto News Today: Bitcoin Faces $16B Test as BlackRock Makes Big Move appeared first on CaptainAltcoin.
Elsewhere, BlackRock has helped bring 3 investment strategies on-chain through Ondo Finance. The 2 developments make this a busy day for crypto, though they affect different parts of the market.
Bitcoin Price Faces a $15.6B Options Expiry
About 182,000 BTC in options contracts are due to expire today, Friday, September 25, with a reported notional value of roughly $15.6 billion. That is the value of the Bitcoin referenced by the contracts. It does not mean $15.6 billion of Bitcoin will be bought or sold when they expire.
An option gives its holder the right to buy or sell an asset at a set price before a deadline. A call gives the right to buy, and a put gives the right to sell. Contracts that end up too far from Bitcoin’s market price may expire without being exercised. Other positions may already have protection in place through separate trades.
The possible market effect comes from that protection. Dealers who sold options often buy or sell Bitcoin or related instruments to manage their exposure. As Friday’s deadline gets closer, changes in Bitcoin price can lead them to adjust those positions. That activity can add to short-term price moves, although the expiry itself does not guarantee a dramatic move.
Calls cover about 106,200 BTC, compared with roughly 75,900 BTC in puts. The larger call total may look bullish at first glance, but the prices attached to those contracts matter. Many calls are placed at $90,000 and $100,000, well above the Bitcoin price cited in the expiry data. Unless BTC moves much higher before the deadline, those contracts offer little immediate support for a bullish reading.
$18,140,000,000 in $BTC and $ETH options will expire this Friday. Max pain for Bitcoin: $75,000 Max pain for Ethereum: $2,250 pic.twitter.com/FtthIAquoW
— Ted (@TedPillows) September 22, 2026
Why Bitcoin Traders Are Watching $76,000
The reported “max pain” price for this expiry is around $76,000. This is the price at which options holders, taken together, would lose the most value at expiry. Some traders use it as a reference point when a large group of contracts is about to close.
That does not make $76,000 a reliable Bitcoin price target. Max pain describes the options positions outstanding at a particular time. It does not account for every force affecting the market, and those positions can change before expiry. Bitcoin can finish far from the figure if broader demand, economic news or fresh trading activity proves stronger.
Another notable concentration of calls and puts lies around $70,000. That tells us participants have positions across a wide range of possible prices. It does not, on its own, show that Bitcoin is heading there. The more useful questions for Friday are whether BTC can regain lost ground and how it behaves as the largest options positions close.
BlackRock Strategies Reach Onchain Investors Through Ondo
Bitcoin’s expiry is only part of today’s crypto news. Ondo Finance has launched 3 onchain investment portfolios based on strategies BlackRock developed for the company. Each portfolio is offered through a token that represents exposure to a group of assets, giving eligible investors access through a single onchain product. Availability is currently limited to eligible investors outside the United States.
The distinction between the companies’ roles matters. BlackRock developed the portfolio strategies, and Ondo launched the onchain products. The announcement does not mean BlackRock has launched a new cryptocurrency or that its clients are buying Bitcoin through these portfolios.
The move is still notable for tokenization. A portfolio that would usually be accessed through traditional investment systems now has an onchain format. Its progress will depend on who can use it, how the portfolios perform and whether investors find the token format useful. There is no direct reason to treat the launch as a prediction for Bitcoin price on Friday.
Eleanor Terrett also pointed to ARK Invest’s work with Securitize to bring its venture fund onchain. Together, the announcements show established investment firms testing blockchain based ways to offer existing financial products. Those developments may matter over time, even if Friday’s immediate focus remains on Bitcoin options.
NEW: A few notable developments in crypto today: @Ondo partnered with @BlackRock to launch three onchain investment portfolios using strategies developed by the asset manager. For now, they’re available only to eligible investors outside the U.S. @ARKInvest is…
— Eleanor Terrett (@EleanorTerrett) September 24, 2026
Stablecoin Proposals and CFTC Guidance Add to the Day’s News
United States regulators supplied 2 more developments. The Federal Reserve has proposed 2 measures under the GENIUS Act. One addresses requirements for stablecoin issuers under its supervision, including reserves, capital, custody and risk management. The other addresses how banks it oversees could apply to issue payment stablecoins. These are proposals open for public comment, so they should not be described as final rules.
Read Also: Gold and Silver Prices Today: Bond Crisis Is Creating a Strange Setup
The CFTC also updated staff guidance on 2 practical questions for registered derivatives firms. The update covers tokenized forms of investments that are already permitted for customer funds and the use of blockchain technology to meet recordkeeping requirements. It clarifies how existing obligations can apply when firms use tokenized assets or blockchain records.
These updates have different timelines from Friday’s options expiry. Regulatory proposals require further review, and new onchain investment products need time to develop a track record. Neither provides a clear answer to where Bitcoin price will close today.
FAQs
Can you cash out Bitcoin?
Yes, you can cash out Bitcoin by converting it into traditional fiat currency like US dollars and transferring it to your bank, debit card, or picking up physical cash.
Is BTC real money?
Bitcoin is real digital money, but it is not a traditional government-backed currency.
Subscribe to our YouTube channel for daily crypto updates, market insights, and expert analysis.
The post Crypto News Today: Bitcoin Faces $16B Test as BlackRock Makes Big Move appeared first on CaptainAltcoin.
1
152
Solana Price Prediction: Is Cardano or Remittix the Next 100x Crypto After RTX’s Dashboard Upgrade?Solana has advanced toward $117.50 as network activity and faster execution keep SOL among the market’s strongest large-cap performers. Cardano has also recovered to approximately $0.253, supported by renewed attention around scalability. Both can rise further, but a genuine 100x move is difficult for assets already carrying multibillion-dollar valuations.
That mathematical reality directs the search towardRemittix. Its upgraded investor dashboard arrives before RTX reaches public exchanges, while a complete PayFi and DeFi ecosystem is moving toward a confirmed launch. Solana and Cardano may define infrastructure; Remittix could offer the earlier growth curve that outsized-return hunters actually need.
Solana and Cardano Face Large-Cap Mathematics
Solana combines high throughput with deep activity across trading, consumer applications and token issuance. A hold above the recent breakout region could keep higher SOL targets in play, especially if institutional products continue attracting demand. However, multiplying a large market capitalisation by 100 would require an extraordinary amount of new money.
Cardano offers a research-led network, a committed community and ongoing throughput improvements. ADA’s seven-percent daily advance improves the short-term picture, but the token also has a broad circulating supply and must translate technical upgrades into sustained application use.
Neither asset needs to rise 100x to be successful. They may remain important portfolio holdings, but buyers seeking a genuinely asymmetric outcome have to consider much smaller projects before mass-market discovery.
The Remittix Dashboard Makes Early Participation Clearer
The redesigned Remittix dashboard gives participants a clearer view of purchases, allocations and campaign activity during the final countdown. That interface matters because the project is no longer selling an isolated idea. It is organising several live and near-live products into a coherent financial hub.
PayFi targets crypto-to-bank settlement across more than 30 fiat currencies. Remittix Markets provides hundreds of perpetual trading pairs and has processed millions in reported volume. The iOS wallet has more than 10,000 reported downloads, Google Play support is planned and Remittix Earn is in final testing with advertised yields up to 22% APY on selected assets.
A planned wallet rebuild should connect those functions around RTX. Users could arrive to trade, store assets, seek rewards or settle funds into bank accounts, giving the token more than one route to adoption.
Could RTX Offer the Bigger Percentage Opportunity?
Remittix has raised more than $32 million from over 40,000 reported participants and confirmed 24 November 2026 as the scheduled launch date. RTX remains priced at $0.21, the final presale stage is set at $0.46 and the hard cap is $36 million.
No responsible forecast can promise a 100x return. Yet the ingredients that make large multiples possible are easier to find here than in a mature large cap: a smaller starting valuation, finite presale capacity, working products and a near-term move into public trading.
Solana may offer the strongest established growth network, while Cardano appeals to buyers who believe its technology will attract greater usage. Remittix provides the speculative engine—an early position in a platform targeting global payments as well as trading and yield. If the ecosystem reaches meaningful scale after launch, the buyers who entered before public price discovery could capture a percentage expansion that SOL and ADA’s current size makes far harder to reproduce.
Discover the future of PayFi with Remittix by checking out their project here:
Website: https://remittixpresale.ioX: https://x.com/remittix
Frequently Asked Questions
Can Solana or Cardano realistically rise 100x?Their large valuations make a 100x move mathematically difficult, although both could still appreciate significantly.
What does the new Remittix dashboard show?It improves visibility over presale purchases, allocations and campaign information as RTX approaches launch.
Is a 100x RTX return guaranteed?No. RTX offers early-stage upside potential, but every price forecast remains speculative and execution-dependent.
DISCLAIMER: CAPTAINALTCOIN DOES NOT ENDORSE INVESTING IN ANY PROJECT MENTIONED IN SPONSORED ARTICLES. EXERCISE CAUTION AND DO THOROUGH RESEARCH BEFORE INVESTING YOUR MONEY. CaptainAltcoin takes no responsibility for its accuracy or quality. This content was not written by CaptainAltcoin’s team. We strongly advise readers to do their own thorough research before interacting with any featured companies. The information provided is not financial or legal advice. Neither CaptainAltcoin nor any third party recommends buying or selling any financial products. Investing in crypto assets is high-risk; consider the potential for loss. Any investment decisions made based on this content are at the sole risk of the readCaptainAltcoin is not liable for any damages or losses from using or relying on this content.
The post Solana Price Prediction: Is Cardano or Remittix the Next 100x Crypto After RTX’s Dashboard Upgrade? appeared first on CaptainAltcoin.
Solana Price Prediction: Is Cardano or Remittix the Next 100x Crypto After RTX’s Dashboard Upgrade?
Solana has advanced toward $117.50 as network activity and faster execution keep SOL among the market’s strongest large-cap performers. Cardano has also recovered to approximately $0.253, supported by renewed attention around scalability. Both can rise further, but a genuine 100x move is difficult for assets already carrying multibillion-dollar valuations.
That mathematical reality directs the search towardRemittix. Its upgraded investor dashboard arrives before RTX reaches public exchanges, while a complete PayFi and DeFi ecosystem is moving toward a confirmed launch. Solana and Cardano may define infrastructure; Remittix could offer the earlier growth curve that outsized-return hunters actually need.
Solana and Cardano Face Large-Cap Mathematics
Solana combines high throughput with deep activity across trading, consumer applications and token issuance. A hold above the recent breakout region could keep higher SOL targets in play, especially if institutional products continue attracting demand. However, multiplying a large market capitalisation by 100 would require an extraordinary amount of new money.
Cardano offers a research-led network, a committed community and ongoing throughput improvements. ADA’s seven-percent daily advance improves the short-term picture, but the token also has a broad circulating supply and must translate technical upgrades into sustained application use.
Neither asset needs to rise 100x to be successful. They may remain important portfolio holdings, but buyers seeking a genuinely asymmetric outcome have to consider much smaller projects before mass-market discovery.
The Remittix Dashboard Makes Early Participation Clearer
The redesigned Remittix dashboard gives participants a clearer view of purchases, allocations and campaign activity during the final countdown. That interface matters because the project is no longer selling an isolated idea. It is organising several live and near-live products into a coherent financial hub.
PayFi targets crypto-to-bank settlement across more than 30 fiat currencies. Remittix Markets provides hundreds of perpetual trading pairs and has processed millions in reported volume. The iOS wallet has more than 10,000 reported downloads, Google Play support is planned and Remittix Earn is in final testing with advertised yields up to 22% APY on selected assets.
A planned wallet rebuild should connect those functions around RTX. Users could arrive to trade, store assets, seek rewards or settle funds into bank accounts, giving the token more than one route to adoption.
Could RTX Offer the Bigger Percentage Opportunity?
Remittix has raised more than $32 million from over 40,000 reported participants and confirmed 24 November 2026 as the scheduled launch date. RTX remains priced at $0.21, the final presale stage is set at $0.46 and the hard cap is $36 million.
No responsible forecast can promise a 100x return. Yet the ingredients that make large multiples possible are easier to find here than in a mature large cap: a smaller starting valuation, finite presale capacity, working products and a near-term move into public trading.
Solana may offer the strongest established growth network, while Cardano appeals to buyers who believe its technology will attract greater usage. Remittix provides the speculative engine—an early position in a platform targeting global payments as well as trading and yield. If the ecosystem reaches meaningful scale after launch, the buyers who entered before public price discovery could capture a percentage expansion that SOL and ADA’s current size makes far harder to reproduce.
Discover the future of PayFi with Remittix by checking out their project here:
Website: https://remittixpresale.ioX: https://x.com/remittix
Frequently Asked Questions
Can Solana or Cardano realistically rise 100x?Their large valuations make a 100x move mathematically difficult, although both could still appreciate significantly.
What does the new Remittix dashboard show?It improves visibility over presale purchases, allocations and campaign information as RTX approaches launch.
Is a 100x RTX return guaranteed?No. RTX offers early-stage upside potential, but every price forecast remains speculative and execution-dependent.
DISCLAIMER: CAPTAINALTCOIN DOES NOT ENDORSE INVESTING IN ANY PROJECT MENTIONED IN SPONSORED ARTICLES. EXERCISE CAUTION AND DO THOROUGH RESEARCH BEFORE INVESTING YOUR MONEY. CaptainAltcoin takes no responsibility for its accuracy or quality. This content was not written by CaptainAltcoin’s team. We strongly advise readers to do their own thorough research before interacting with any featured companies. The information provided is not financial or legal advice. Neither CaptainAltcoin nor any third party recommends buying or selling any financial products. Investing in crypto assets is high-risk; consider the potential for loss. Any investment decisions made based on this content are at the sole risk of the readCaptainAltcoin is not liable for any damages or losses from using or relying on this content.
The post Solana Price Prediction: Is Cardano or Remittix the Next 100x Crypto After RTX’s Dashboard Upgrade? appeared first on CaptainAltcoin.
That mathematical reality directs the search towardRemittix. Its upgraded investor dashboard arrives before RTX reaches public exchanges, while a complete PayFi and DeFi ecosystem is moving toward a confirmed launch. Solana and Cardano may define infrastructure; Remittix could offer the earlier growth curve that outsized-return hunters actually need.
Solana and Cardano Face Large-Cap Mathematics
Solana combines high throughput with deep activity across trading, consumer applications and token issuance. A hold above the recent breakout region could keep higher SOL targets in play, especially if institutional products continue attracting demand. However, multiplying a large market capitalisation by 100 would require an extraordinary amount of new money.
Cardano offers a research-led network, a committed community and ongoing throughput improvements. ADA’s seven-percent daily advance improves the short-term picture, but the token also has a broad circulating supply and must translate technical upgrades into sustained application use.
Neither asset needs to rise 100x to be successful. They may remain important portfolio holdings, but buyers seeking a genuinely asymmetric outcome have to consider much smaller projects before mass-market discovery.
The Remittix Dashboard Makes Early Participation Clearer
The redesigned Remittix dashboard gives participants a clearer view of purchases, allocations and campaign activity during the final countdown. That interface matters because the project is no longer selling an isolated idea. It is organising several live and near-live products into a coherent financial hub.
PayFi targets crypto-to-bank settlement across more than 30 fiat currencies. Remittix Markets provides hundreds of perpetual trading pairs and has processed millions in reported volume. The iOS wallet has more than 10,000 reported downloads, Google Play support is planned and Remittix Earn is in final testing with advertised yields up to 22% APY on selected assets.
A planned wallet rebuild should connect those functions around RTX. Users could arrive to trade, store assets, seek rewards or settle funds into bank accounts, giving the token more than one route to adoption.
Could RTX Offer the Bigger Percentage Opportunity?
Remittix has raised more than $32 million from over 40,000 reported participants and confirmed 24 November 2026 as the scheduled launch date. RTX remains priced at $0.21, the final presale stage is set at $0.46 and the hard cap is $36 million.
No responsible forecast can promise a 100x return. Yet the ingredients that make large multiples possible are easier to find here than in a mature large cap: a smaller starting valuation, finite presale capacity, working products and a near-term move into public trading.
Solana may offer the strongest established growth network, while Cardano appeals to buyers who believe its technology will attract greater usage. Remittix provides the speculative engine—an early position in a platform targeting global payments as well as trading and yield. If the ecosystem reaches meaningful scale after launch, the buyers who entered before public price discovery could capture a percentage expansion that SOL and ADA’s current size makes far harder to reproduce.
Discover the future of PayFi with Remittix by checking out their project here:
Website: https://remittixpresale.ioX: https://x.com/remittix
Frequently Asked Questions
Can Solana or Cardano realistically rise 100x?Their large valuations make a 100x move mathematically difficult, although both could still appreciate significantly.
What does the new Remittix dashboard show?It improves visibility over presale purchases, allocations and campaign information as RTX approaches launch.
Is a 100x RTX return guaranteed?No. RTX offers early-stage upside potential, but every price forecast remains speculative and execution-dependent.
DISCLAIMER: CAPTAINALTCOIN DOES NOT ENDORSE INVESTING IN ANY PROJECT MENTIONED IN SPONSORED ARTICLES. EXERCISE CAUTION AND DO THOROUGH RESEARCH BEFORE INVESTING YOUR MONEY. CaptainAltcoin takes no responsibility for its accuracy or quality. This content was not written by CaptainAltcoin’s team. We strongly advise readers to do their own thorough research before interacting with any featured companies. The information provided is not financial or legal advice. Neither CaptainAltcoin nor any third party recommends buying or selling any financial products. Investing in crypto assets is high-risk; consider the potential for loss. Any investment decisions made based on this content are at the sole risk of the readCaptainAltcoin is not liable for any damages or losses from using or relying on this content.
The post Solana Price Prediction: Is Cardano or Remittix the Next 100x Crypto After RTX’s Dashboard Upgrade? appeared first on CaptainAltcoin.
138
Войдите, чтобы посмотреть больше материала
Присоединяйтесь к пользователям криптовалют по всему миру на Binance Square
⚡️ Получайте новейшую и полезную информацию о криптоактивах.
💬 Нам доверяет крупнейшая в мире криптобиржа.
👍 Получите достоверные аналитические данные от верифицированных создателей контента.
Эл. почта/номер телефона
В тренде
BinanceKZ
Просмотров: 6,924
45 обсуждают
Как я потерял 180 000 тенге на «менеджере Binance» из WhatsApp — и почему всё равно остался в крипте
phpdead
·Лайков: 5
·Просмотров: 934
PolymarketBankFailureBetsDrawFDICConcern
Просмотров: 0
0 обсуждают
BlackRockBuildsTokenizedPortfoliosForOndo
Просмотров: 0
0 обсуждают