

Zarrar_X 1
961 Публикации

Zarrar_X 1
Отправить жалобу
Заблокировать пользователя
DeFi Researcher || Crypto Analyst || Web3 explorer || one chart at a time.
0 подписок(и/а)
60 подписчиков(а)
121 понравилось
Посты
·
--
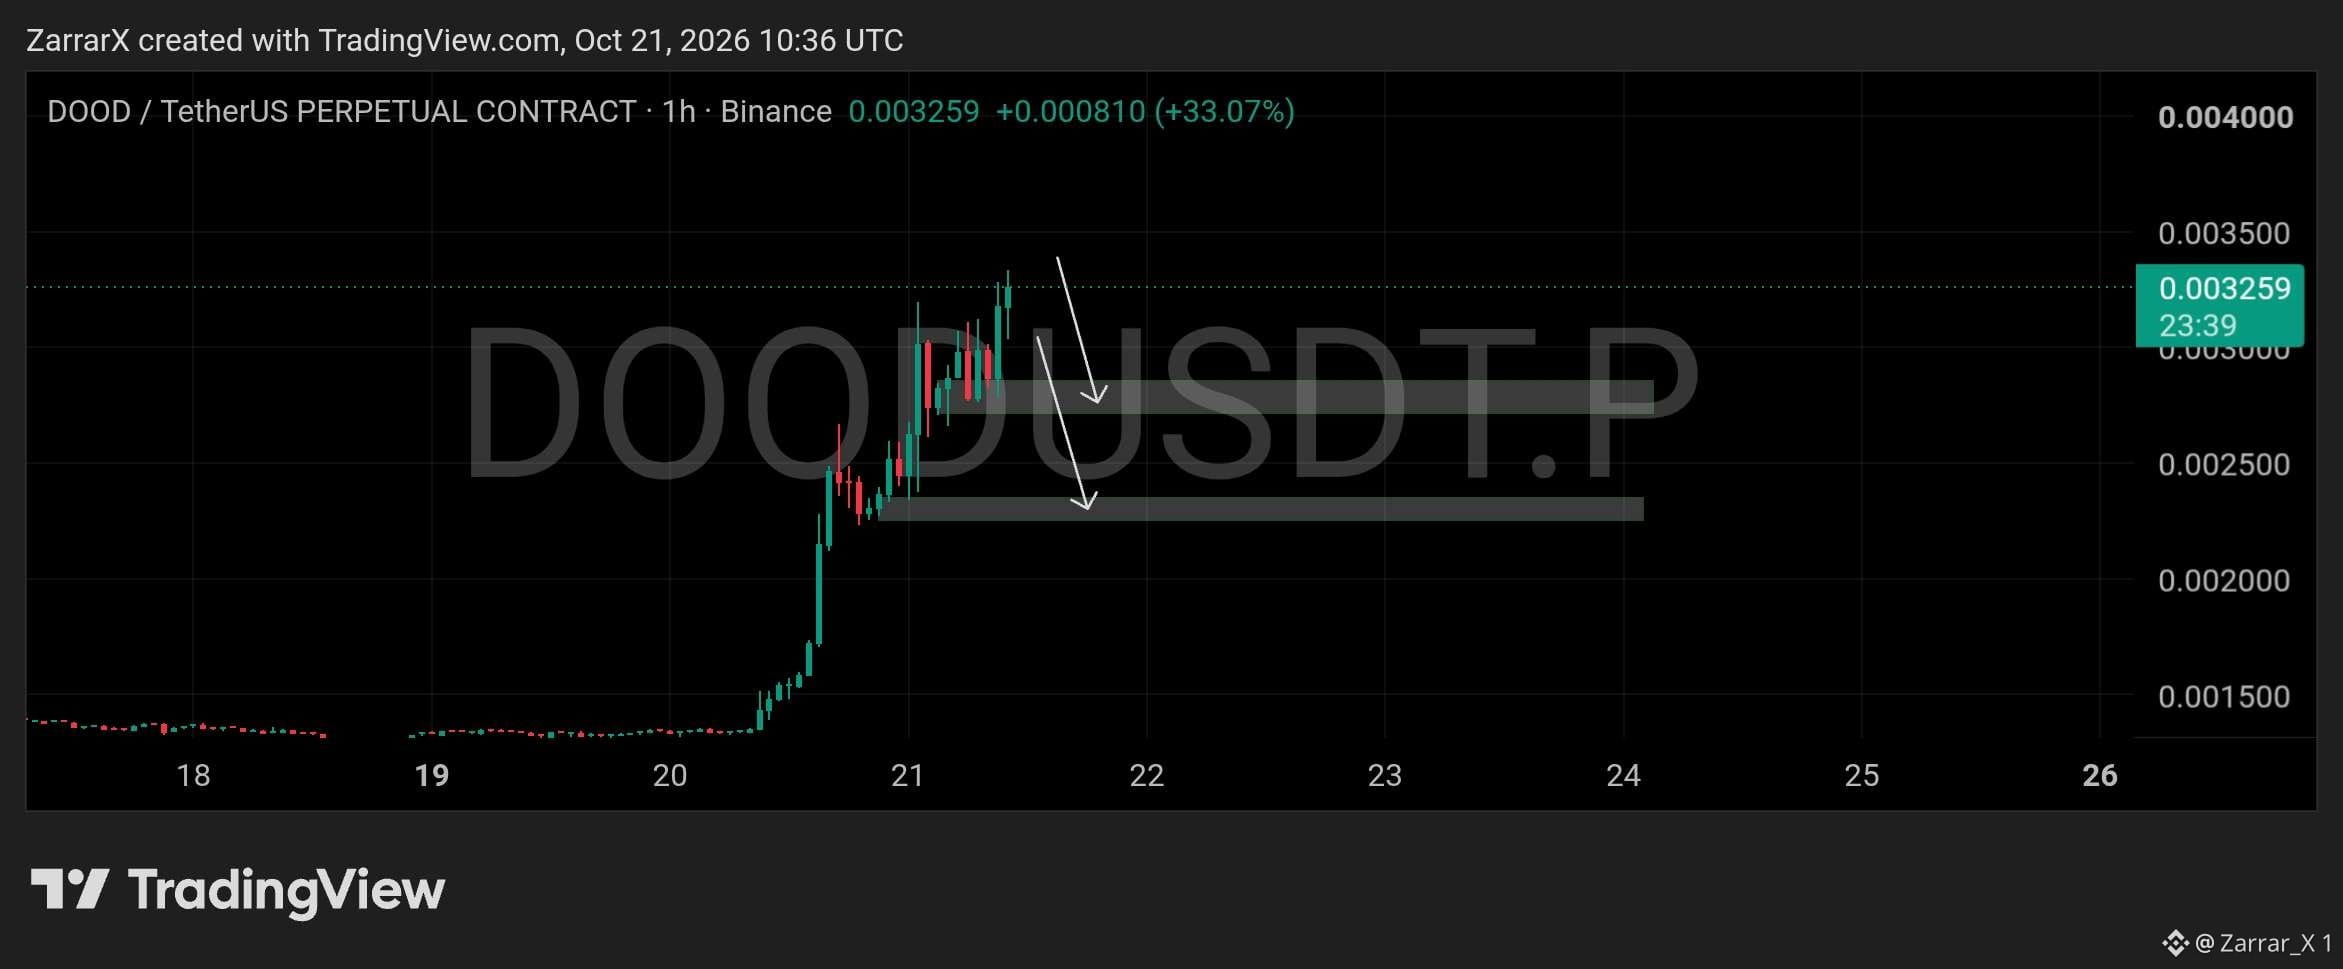
$DOOD has surged over 33% on the 1-hour chart, reaching $0.00326. After this sharp rally, a pullback could follow as traders take profits.
The first support zone sits at $0.00270–$0.00285, with deeper demand around $0.00225–$0.00235 if selling continues.
Rather than chasing the pump, watch for a bullish reaction at either zone. Losing the lower demand area would weaken the breakout structure.
#Doodles #Altcoin Season# #Meme Alpha#
$DOOD has surged over 33% on the 1-hour chart, reaching $0.00326. After this sharp rally, a pullback could follow as traders take profits.
The first support zone sits at $0.00270–$0.00285, with deeper demand around $0.00225–$0.00235 if selling continues.
Rather than chasing the pump, watch for a bullish reaction at either zone. Losing the lower demand area would weaken the breakout structure.
#Doodles #Altcoin Season# #Meme Alpha#
The first support zone sits at $0.00270–$0.00285, with deeper demand around $0.00225–$0.00235 if selling continues.
Rather than chasing the pump, watch for a bullish reaction at either zone. Losing the lower demand area would weaken the breakout structure.
#Doodles #Altcoin Season# #Meme Alpha#
9
·
--
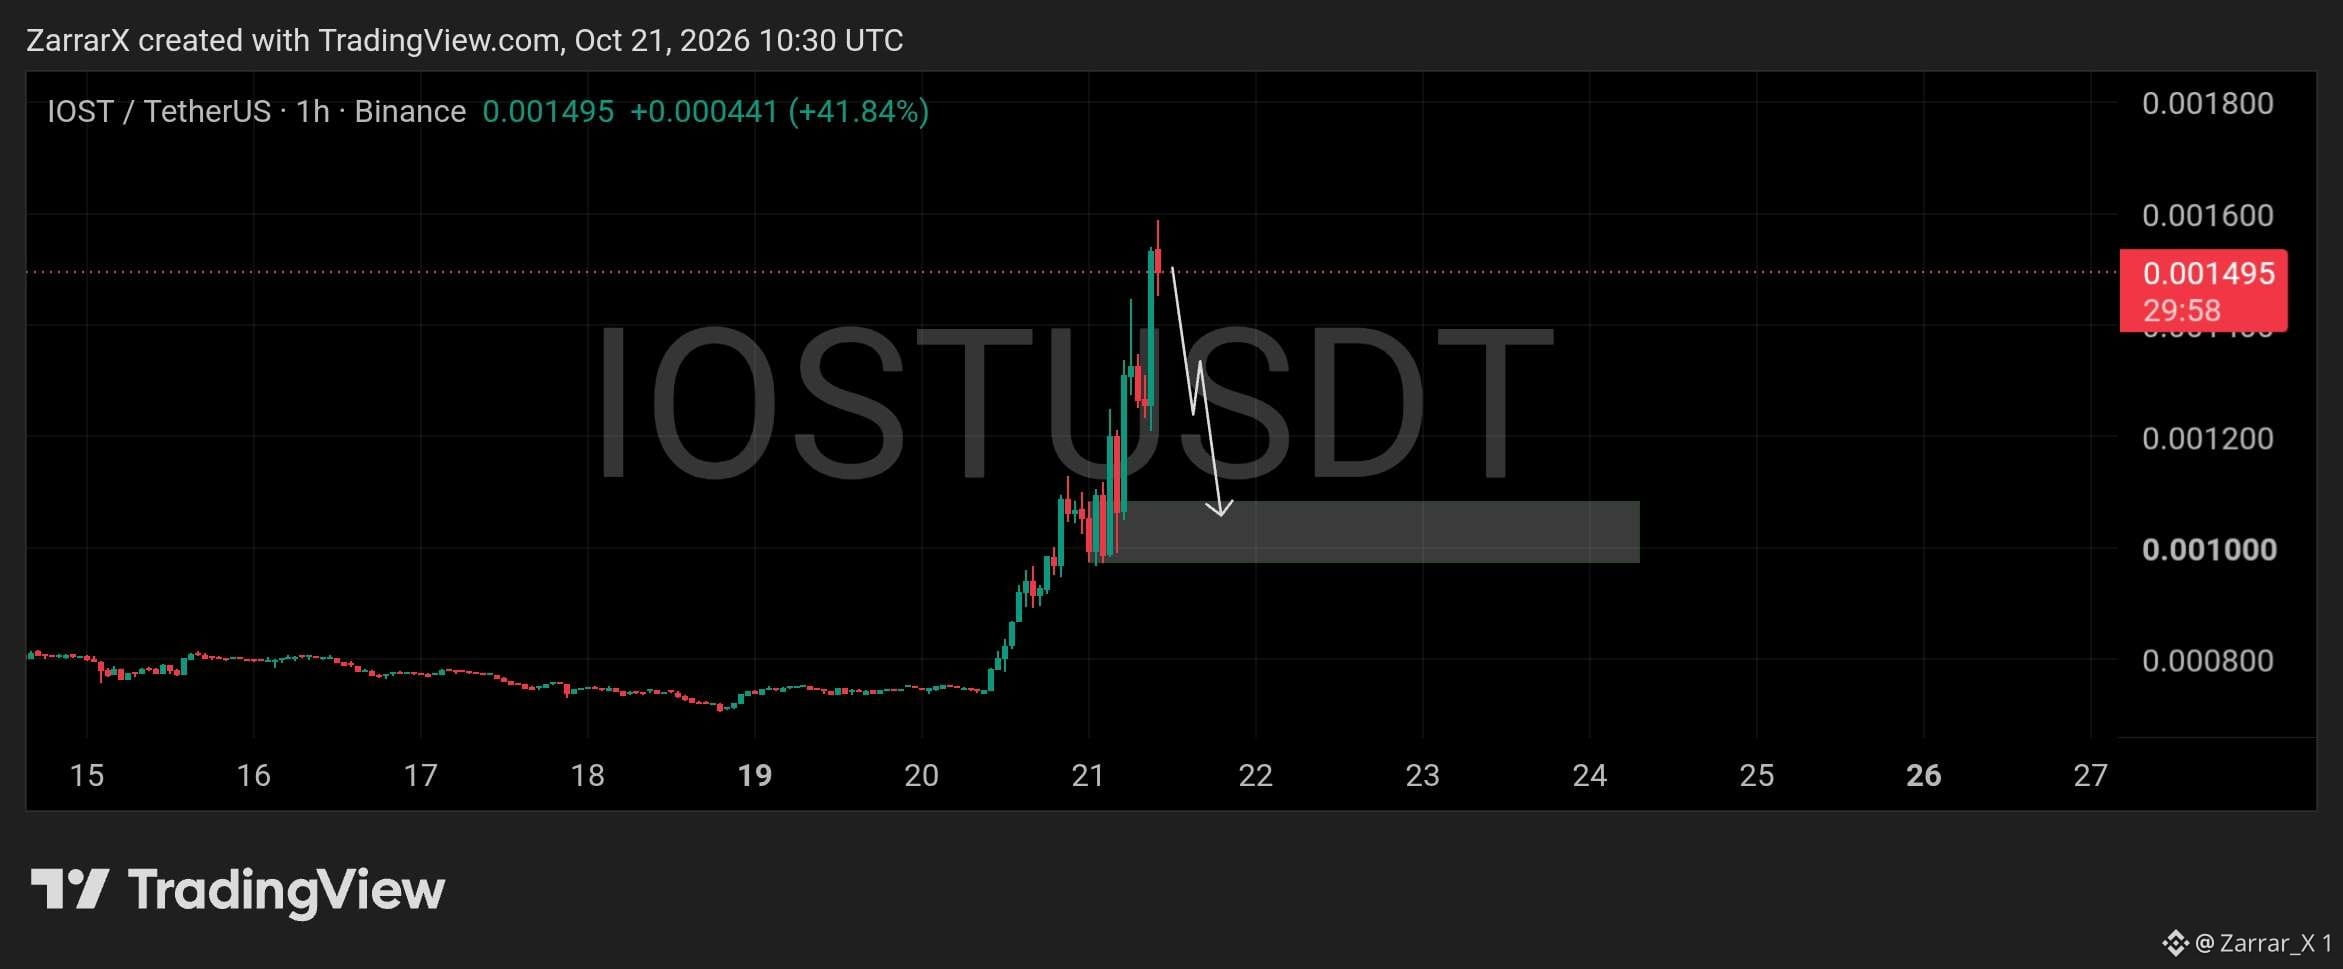
$IOST has pushed up sharply, gaining over 40% and breaking away from its prolonged consolidation around $0.00075. The move is strong, but price is now extended after the rapid rally, making a short-term pullback increasingly possible.
The key demand zone sits around $0.00098–$0.00108, where a retracement could find buyers and allow the market to stabilize. A reaction from this area would be important for determining whether the recent bullish momentum can continue.
For now, chasing the rally at current levels carries higher risk. A pullback into demand followed by a convincing bounce would offer a healthier continuation scenario, while a failure to hold this zone could weaken the breakout and invite further downside.
#Macro Insights# #Crypto #Altcoin Season#
$IOST has pushed up sharply, gaining over 40% and breaking away from its prolonged consolidation around $0.00075. The move is strong, but price is now extended after the rapid rally, making a short-term pullback increasingly possible.
The key demand zone sits around $0.00098–$0.00108, where a retracement could find buyers and allow the market to stabilize. A reaction from this area would be important for determining whether the recent bullish momentum can continue.
For now, chasing the rally at current levels carries higher risk. A pullback into demand followed by a convincing bounce would offer a healthier continuation scenario, while a failure to hold this zone could weaken the breakout and invite further downside.
#Macro Insights# #Crypto #Altcoin Season#
The key demand zone sits around $0.00098–$0.00108, where a retracement could find buyers and allow the market to stabilize. A reaction from this area would be important for determining whether the recent bullish momentum can continue.
For now, chasing the rally at current levels carries higher risk. A pullback into demand followed by a convincing bounce would offer a healthier continuation scenario, while a failure to hold this zone could weaken the breakout and invite further downside.
#Macro Insights# #Crypto #Altcoin Season#
67
·
--
JPMorgan Deploys JPM Coin on Ethereum Mainnet.
JPMorgan’s blockchain division, Kinexys, has deployed its U.S. dollar deposit token, JPM Coin (JPMD), on Ethereum mainnet, expanding beyond its earlier public blockchain rollout on Base.
Unlike USDC or USDT, JPMD is a permissioned deposit token representing dollar deposits held at JPMorgan. Access is restricted to approved institutional clients, with the token designed for 24/7 payments, cross-border liquidity management and faster settlement of assets and collateral.
The move could strengthen Ethereum’s position as infrastructure for institutional finance. JPMD can operate alongside tokenized assets and other onchain financial products, potentially making settlement between digital dollars and tokenized securities more efficient. Transactions on Ethereum mainnet also use ETH for gas fees, creating some additional demand for network blockspace.
However, this is a long-term infrastructure development, not an immediate bullish signal for ETH’s price. JPMD is not available to ordinary retail users, and its actual impact on Ethereum’s fee revenue and ETH burning will depend on transaction volume and how efficiently institutions process transactions.
JPMorgan’s decision highlights a growing trend: traditional banks are exploring public blockchains while keeping access to their own digital money restricted. The key question is how much institutional activity will eventually move onchain, and how much economic value that activity will generate for the underlying networks.
$ETH #Macro Insights# #Altcoin Season# #ETH
JPMorgan Deploys JPM Coin on Ethereum Mainnet.
JPMorgan’s blockchain division, Kinexys, has deployed its U.S. dollar deposit token, JPM Coin (JPMD), on Ethereum mainnet, expanding beyond its earlier public blockchain rollout on Base.
Unlike USDC or USDT, JPMD is a permissioned deposit token representing dollar deposits held at JPMorgan. Access is restricted to approved institutional clients, with the token designed for 24/7 payments, cross-border liquidity management and faster settlement of assets and collateral.
The move could strengthen Ethereum’s position as infrastructure for institutional finance. JPMD can operate alongside tokenized assets and other onchain financial products, potentially making settlement between digital dollars and tokenized securities more efficient. Transactions on Ethereum mainnet also use ETH for gas fees, creating some additional demand for network blockspace.
However, this is a long-term infrastructure development, not an immediate bullish signal for ETH’s price. JPMD is not available to ordinary retail users, and its actual impact on Ethereum’s fee revenue and ETH burning will depend on transaction volume and how efficiently institutions process transactions.
JPMorgan’s decision highlights a growing trend: traditional banks are exploring public blockchains while keeping access to their own digital money restricted. The key question is how much institutional activity will eventually move onchain, and how much economic value that activity will generate for the underlying networks.
$ETH #Macro Insights# #Altcoin Season# #ETH
JPMorgan’s blockchain division, Kinexys, has deployed its U.S. dollar deposit token, JPM Coin (JPMD), on Ethereum mainnet, expanding beyond its earlier public blockchain rollout on Base.
Unlike USDC or USDT, JPMD is a permissioned deposit token representing dollar deposits held at JPMorgan. Access is restricted to approved institutional clients, with the token designed for 24/7 payments, cross-border liquidity management and faster settlement of assets and collateral.
The move could strengthen Ethereum’s position as infrastructure for institutional finance. JPMD can operate alongside tokenized assets and other onchain financial products, potentially making settlement between digital dollars and tokenized securities more efficient. Transactions on Ethereum mainnet also use ETH for gas fees, creating some additional demand for network blockspace.
However, this is a long-term infrastructure development, not an immediate bullish signal for ETH’s price. JPMD is not available to ordinary retail users, and its actual impact on Ethereum’s fee revenue and ETH burning will depend on transaction volume and how efficiently institutions process transactions.
JPMorgan’s decision highlights a growing trend: traditional banks are exploring public blockchains while keeping access to their own digital money restricted. The key question is how much institutional activity will eventually move onchain, and how much economic value that activity will generate for the underlying networks.
$ETH #Macro Insights# #Altcoin Season# #ETH

34
·
--
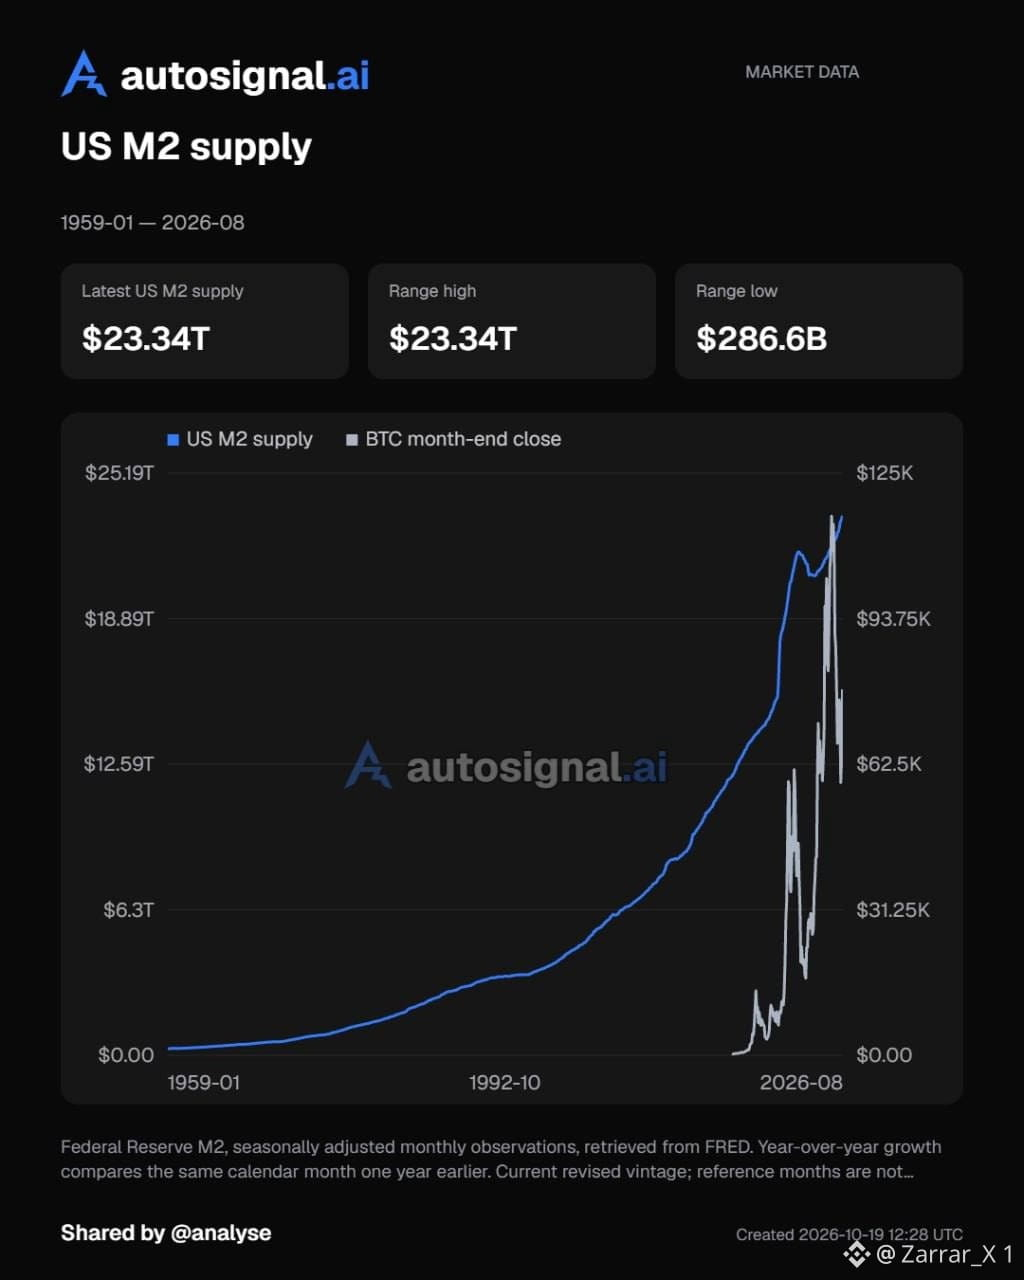
🇺🇸 US M2 Money Supply Hits a Record $23.34 Trillion.
The U.S. M2 money supply has reportedly climbed to a new all-time high of $23.34 trillion, highlighting the continued expansion of money circulating through the American economy.
M2 includes cash, checking deposits, savings deposits and certain other liquid assets. Its growth is closely watched by economists and investors because changes in money supply can influence spending, inflation expectations and financial-market liquidity.
For crypto markets, expanding liquidity can be a supportive backdrop for risk assets, including Bitcoin. However, a record M2 reading does not automatically mean money is flowing into crypto. Interest rates, credit conditions, investor demand and how quickly money circulates through the economy also matter.
$BTC #BTC Price Analysis# #Macro Insights# #Crypto
🇺🇸 US M2 Money Supply Hits a Record $23.34 Trillion.
The U.S. M2 money supply has reportedly climbed to a new all-time high of $23.34 trillion, highlighting the continued expansion of money circulating through the American economy.
M2 includes cash, checking deposits, savings deposits and certain other liquid assets. Its growth is closely watched by economists and investors because changes in money supply can influence spending, inflation expectations and financial-market liquidity.
For crypto markets, expanding liquidity can be a supportive backdrop for risk assets, including Bitcoin. However, a record M2 reading does not automatically mean money is flowing into crypto. Interest rates, credit conditions, investor demand and how quickly money circulates through the economy also matter.
$BTC #BTC Price Analysis# #Macro Insights# #Crypto
The U.S. M2 money supply has reportedly climbed to a new all-time high of $23.34 trillion, highlighting the continued expansion of money circulating through the American economy.
M2 includes cash, checking deposits, savings deposits and certain other liquid assets. Its growth is closely watched by economists and investors because changes in money supply can influence spending, inflation expectations and financial-market liquidity.
For crypto markets, expanding liquidity can be a supportive backdrop for risk assets, including Bitcoin. However, a record M2 reading does not automatically mean money is flowing into crypto. Interest rates, credit conditions, investor demand and how quickly money circulates through the economy also matter.
$BTC #BTC Price Analysis# #Macro Insights# #Crypto
43
·
--
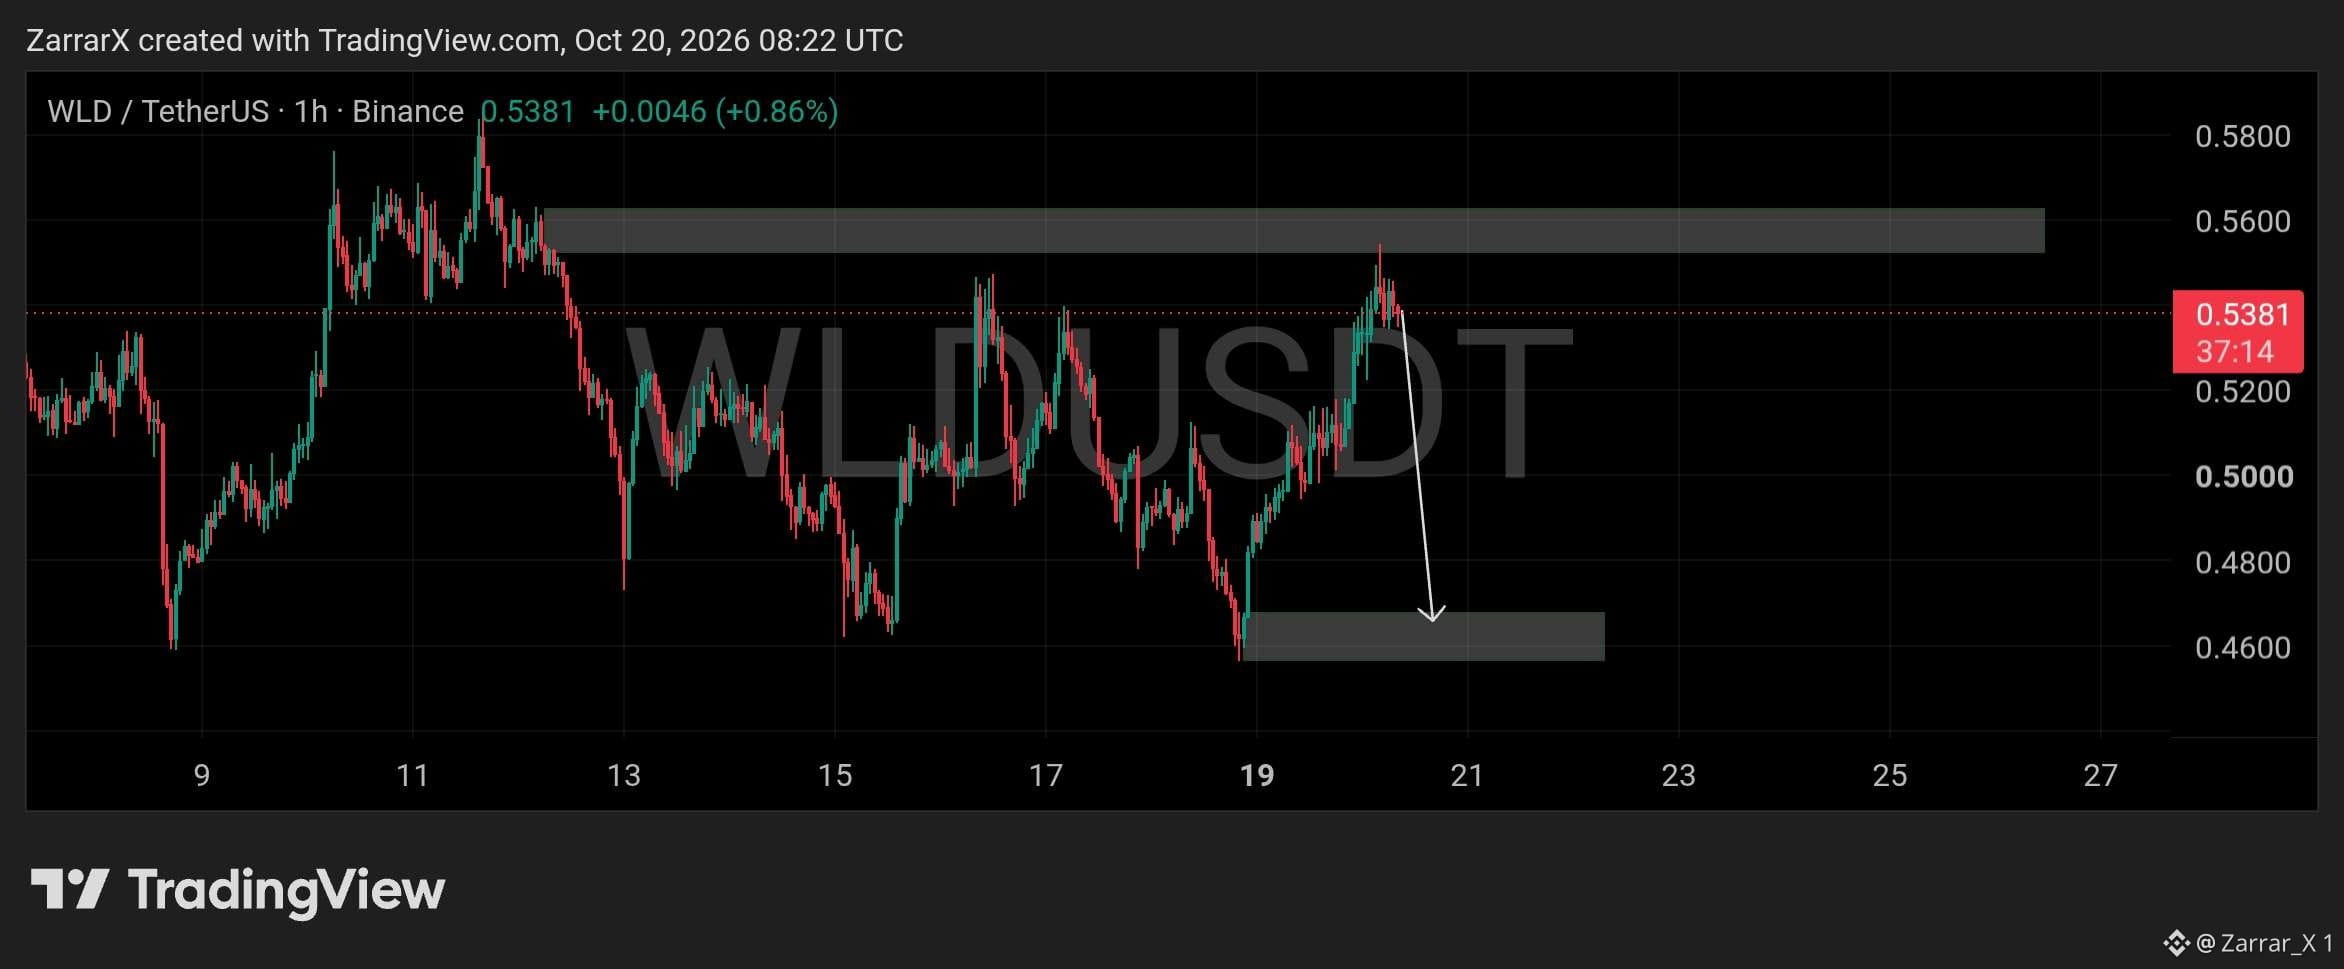
$WLD is facing rejection around $0.5400 after recovering from the recent dip near $0.4600. The latest push higher has lost momentum, leaving room for sellers to drive another corrective move on the 1-hour chart.
The $0.4580–$0.4670 zone is the key demand area to watch if the pullback continues. A return to this region would test whether buyers can defend the recent recovery and prevent price from revisiting the previous lows.
On the upside, $0.5530–$0.5630 remains a major resistance zone where sellers could re-enter. Unless buyers reclaim that area, another move lower remains possible, with the reaction around demand likely to determine the next direction for #WLD .
#Altcoin Season# #Crypto
$WLD is facing rejection around $0.5400 after recovering from the recent dip near $0.4600. The latest push higher has lost momentum, leaving room for sellers to drive another corrective move on the 1-hour chart.
The $0.4580–$0.4670 zone is the key demand area to watch if the pullback continues. A return to this region would test whether buyers can defend the recent recovery and prevent price from revisiting the previous lows.
On the upside, $0.5530–$0.5630 remains a major resistance zone where sellers could re-enter. Unless buyers reclaim that area, another move lower remains possible, with the reaction around demand likely to determine the next direction for #WLD .
#Altcoin Season# #Crypto
The $0.4580–$0.4670 zone is the key demand area to watch if the pullback continues. A return to this region would test whether buyers can defend the recent recovery and prevent price from revisiting the previous lows.
On the upside, $0.5530–$0.5630 remains a major resistance zone where sellers could re-enter. Unless buyers reclaim that area, another move lower remains possible, with the reaction around demand likely to determine the next direction for #WLD .
#Altcoin Season# #Crypto
60
·
--
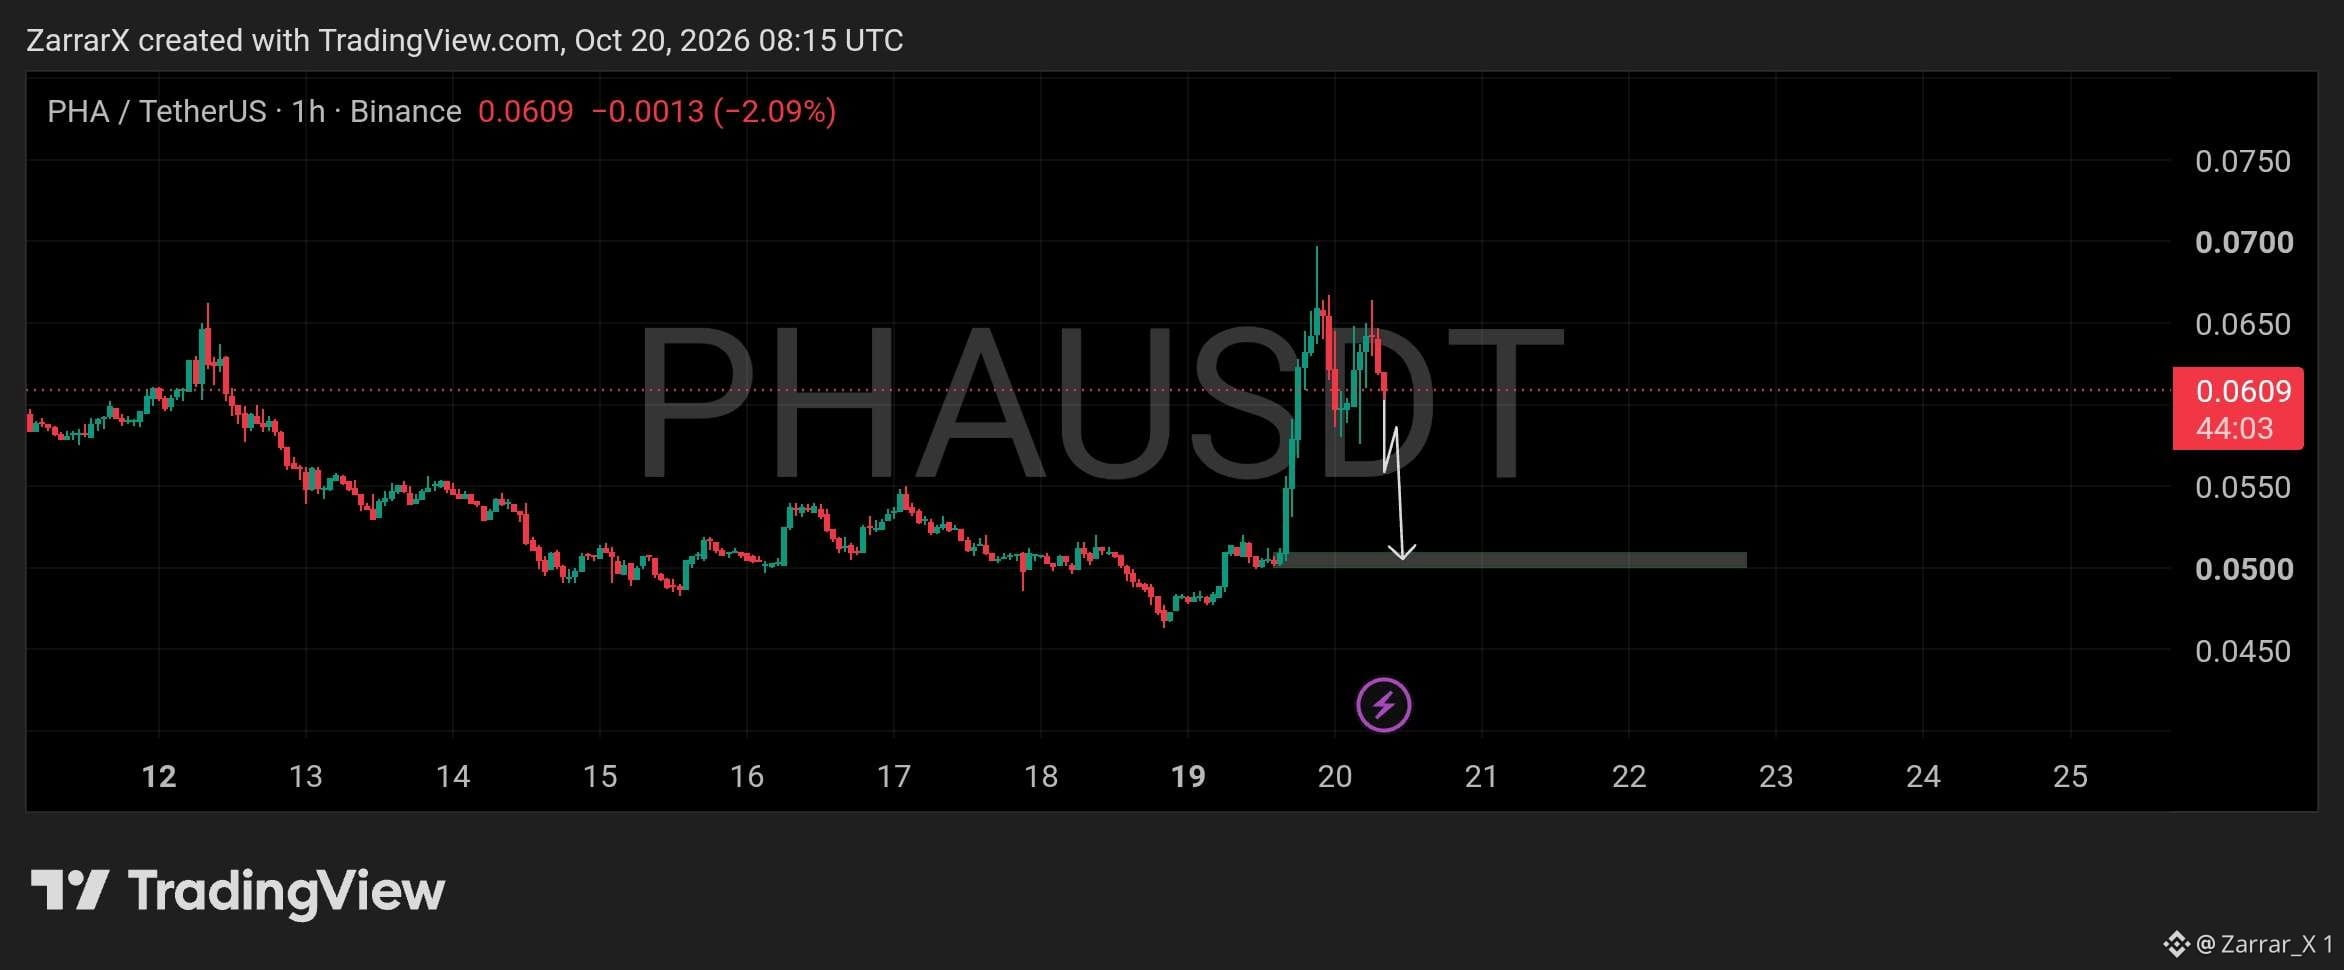
$PHA is pulling back after a sharp breakout from the $0.0500 area, with price currently around $0.0609. The initial surge pushed toward $0.0690 before sellers stepped in, and the latest candles suggest momentum is cooling as the market gives back part of its gains.
The $0.0500–$0.0510 zone is the key demand area to watch if selling pressure continues. A deeper retracement toward this region would test whether buyers can defend the breakout base and establish support after the recent volatility.
Another rejection around current levels could extend the correction toward demand, while a recovery above $0.0650 would indicate buyers are regaining strength. For now, the pullback remains the immediate focus, with the reaction at demand likely to determine whether $PHA can resume its upward move.
#PHA #Macro Insights# #Altcoin Season#
$PHA is pulling back after a sharp breakout from the $0.0500 area, with price currently around $0.0609. The initial surge pushed toward $0.0690 before sellers stepped in, and the latest candles suggest momentum is cooling as the market gives back part of its gains.
The $0.0500–$0.0510 zone is the key demand area to watch if selling pressure continues. A deeper retracement toward this region would test whether buyers can defend the breakout base and establish support after the recent volatility.
Another rejection around current levels could extend the correction toward demand, while a recovery above $0.0650 would indicate buyers are regaining strength. For now, the pullback remains the immediate focus, with the reaction at demand likely to determine whether $PHA can resume its upward move.
#PHA #Macro Insights# #Altcoin Season#
The $0.0500–$0.0510 zone is the key demand area to watch if selling pressure continues. A deeper retracement toward this region would test whether buyers can defend the breakout base and establish support after the recent volatility.
Another rejection around current levels could extend the correction toward demand, while a recovery above $0.0650 would indicate buyers are regaining strength. For now, the pullback remains the immediate focus, with the reaction at demand likely to determine whether $PHA can resume its upward move.
#PHA #Macro Insights# #Altcoin Season#
74
·
--
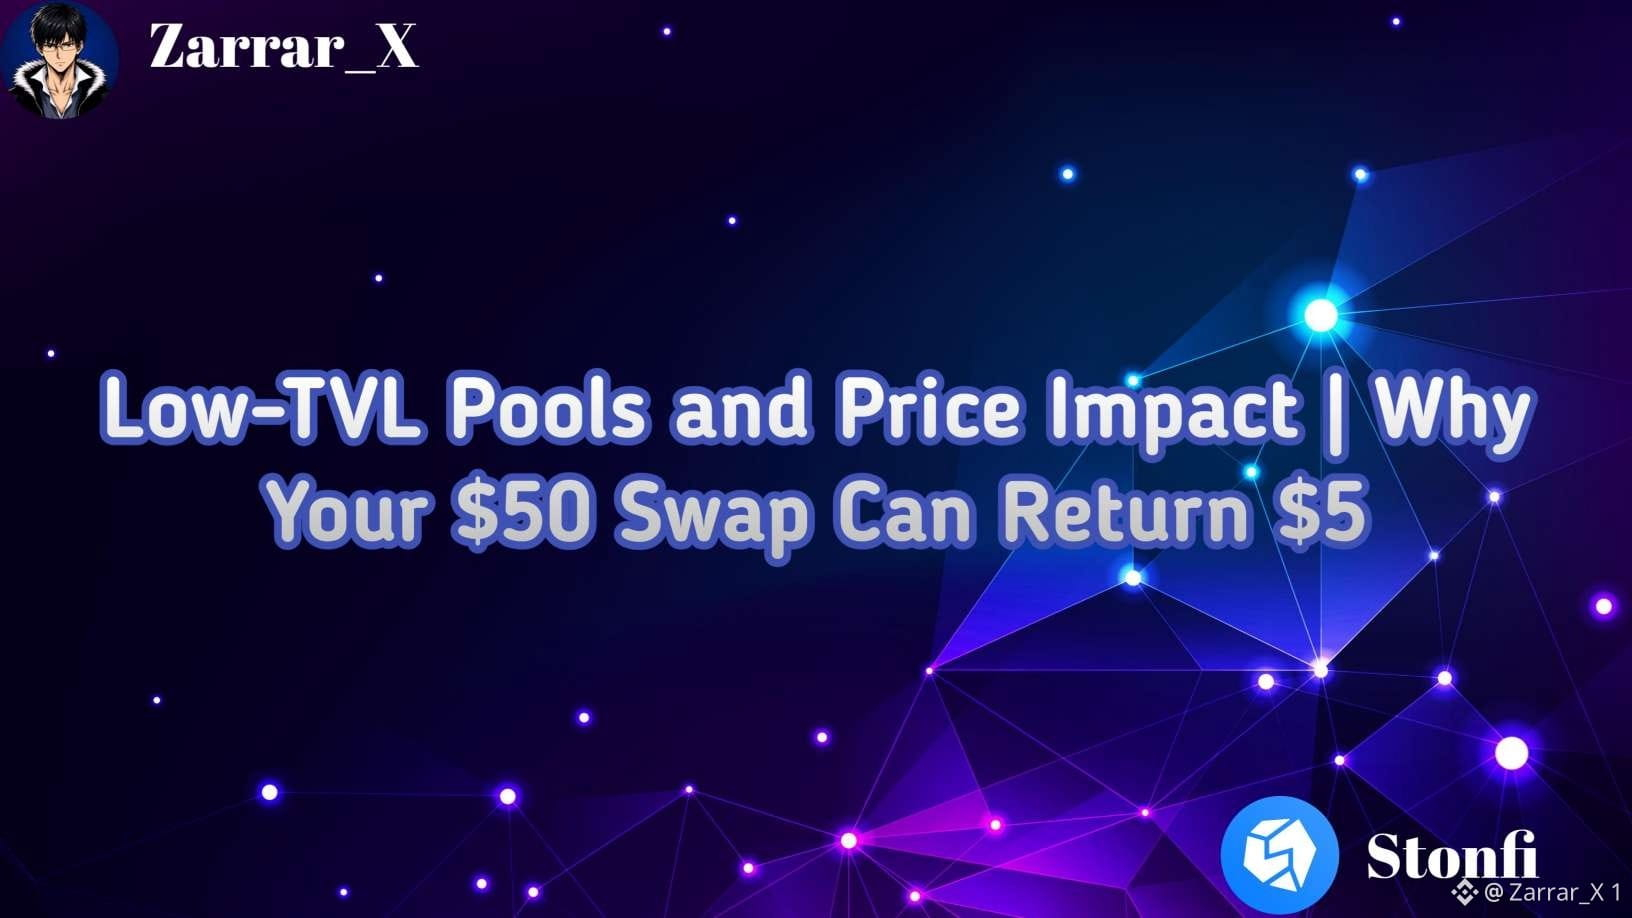
Why Can a Pool with $1–$10 TVL Produce a Terrible Swap?
When exploring new micro-cap tokens on a DEX, you might notice a coin listed with active price charts. You decide to buy $50 worth, only to realize after signing that you received less than $5 worth of tokens!
How can a trade lose 90% of its value instantly? The answer lies in Total Value Locked (TVL) and reserve depth.
Here is why shallow liquidity pools cause massive trade losses:
1️⃣ The Constant Product Formula (x * y = k)
Automated Market Makers (AMMs) calculate token prices based on the ratio of assets in the liquidity pool. When a pool only has $5 to $10 in total liquidity, its internal asset balance is extremely fragile.
2️⃣ Disproportionate Price Impact
If a pool contains $5 worth of TON and $5 worth of Token X, a $10 trade attempt doesn't just buy tokens, it heavily overwhelms the pool's entire balance. Your trade violently shifts the internal pool ratio, resulting in massive Price Impact (slippage caused by your own trade size).
3️⃣ Liquidity Depth vs. Tradability
Just because a token is technically "tradable" on a DEX does not mean the pool has sufficient execution depth for your trade size. Always check pool TVL and the "Price Impact" preview before tapping confirm!
– How Cross-Chain Routes Solve Fragmentation
When moving value across ecosystems into TON, protocols like STONfi coordinate routes so you don't get trapped in illiquid intermediate pools.
To learn more about direct, deep-liquidity cross-chain swaps from TON to Base, visit:
https://ston.fi/cross-chain-swap-from-ton-to-base
$BTC $ETH #BTC Price Analysis# #Macro Insights# #Altcoin Season#
Why Can a Pool with $1–$10 TVL Produce a Terrible Swap?
When exploring new micro-cap tokens on a DEX, you might notice a coin listed with active price charts. You decide to buy $50 worth, only to realize after signing that you received less than $5 worth of tokens!
How can a trade lose 90% of its value instantly? The answer lies in Total Value Locked (TVL) and reserve depth.
Here is why shallow liquidity pools cause massive trade losses:
1️⃣ The Constant Product Formula (x * y = k)
Automated Market Makers (AMMs) calculate token prices based on the ratio of assets in the liquidity pool. When a pool only has $5 to $10 in total liquidity, its internal asset balance is extremely fragile.
2️⃣ Disproportionate Price Impact
If a pool contains $5 worth of TON and $5 worth of Token X, a $10 trade attempt doesn't just buy tokens, it heavily overwhelms the pool's entire balance. Your trade violently shifts the internal pool ratio, resulting in massive Price Impact (slippage caused by your own trade size).
3️⃣ Liquidity Depth vs. Tradability
Just because a token is technically "tradable" on a DEX does not mean the pool has sufficient execution depth for your trade size. Always check pool TVL and the "Price Impact" preview before tapping confirm!
– How Cross-Chain Routes Solve Fragmentation
When moving value across ecosystems into TON, protocols like STONfi coordinate routes so you don't get trapped in illiquid intermediate pools.
To learn more about direct, deep-liquidity cross-chain swaps from TON to Base, visit:
https://ston.fi/cross-chain-swap-from-ton-to-base
$BTC $ETH #BTC Price Analysis# #Macro Insights# #Altcoin Season#
When exploring new micro-cap tokens on a DEX, you might notice a coin listed with active price charts. You decide to buy $50 worth, only to realize after signing that you received less than $5 worth of tokens!
How can a trade lose 90% of its value instantly? The answer lies in Total Value Locked (TVL) and reserve depth.
Here is why shallow liquidity pools cause massive trade losses:
1️⃣ The Constant Product Formula (x * y = k)
Automated Market Makers (AMMs) calculate token prices based on the ratio of assets in the liquidity pool. When a pool only has $5 to $10 in total liquidity, its internal asset balance is extremely fragile.
2️⃣ Disproportionate Price Impact
If a pool contains $5 worth of TON and $5 worth of Token X, a $10 trade attempt doesn't just buy tokens, it heavily overwhelms the pool's entire balance. Your trade violently shifts the internal pool ratio, resulting in massive Price Impact (slippage caused by your own trade size).
3️⃣ Liquidity Depth vs. Tradability
Just because a token is technically "tradable" on a DEX does not mean the pool has sufficient execution depth for your trade size. Always check pool TVL and the "Price Impact" preview before tapping confirm!
– How Cross-Chain Routes Solve Fragmentation
When moving value across ecosystems into TON, protocols like STONfi coordinate routes so you don't get trapped in illiquid intermediate pools.
To learn more about direct, deep-liquidity cross-chain swaps from TON to Base, visit:
https://ston.fi/cross-chain-swap-from-ton-to-base
$BTC $ETH #BTC Price Analysis# #Macro Insights# #Altcoin Season#
29
·
--
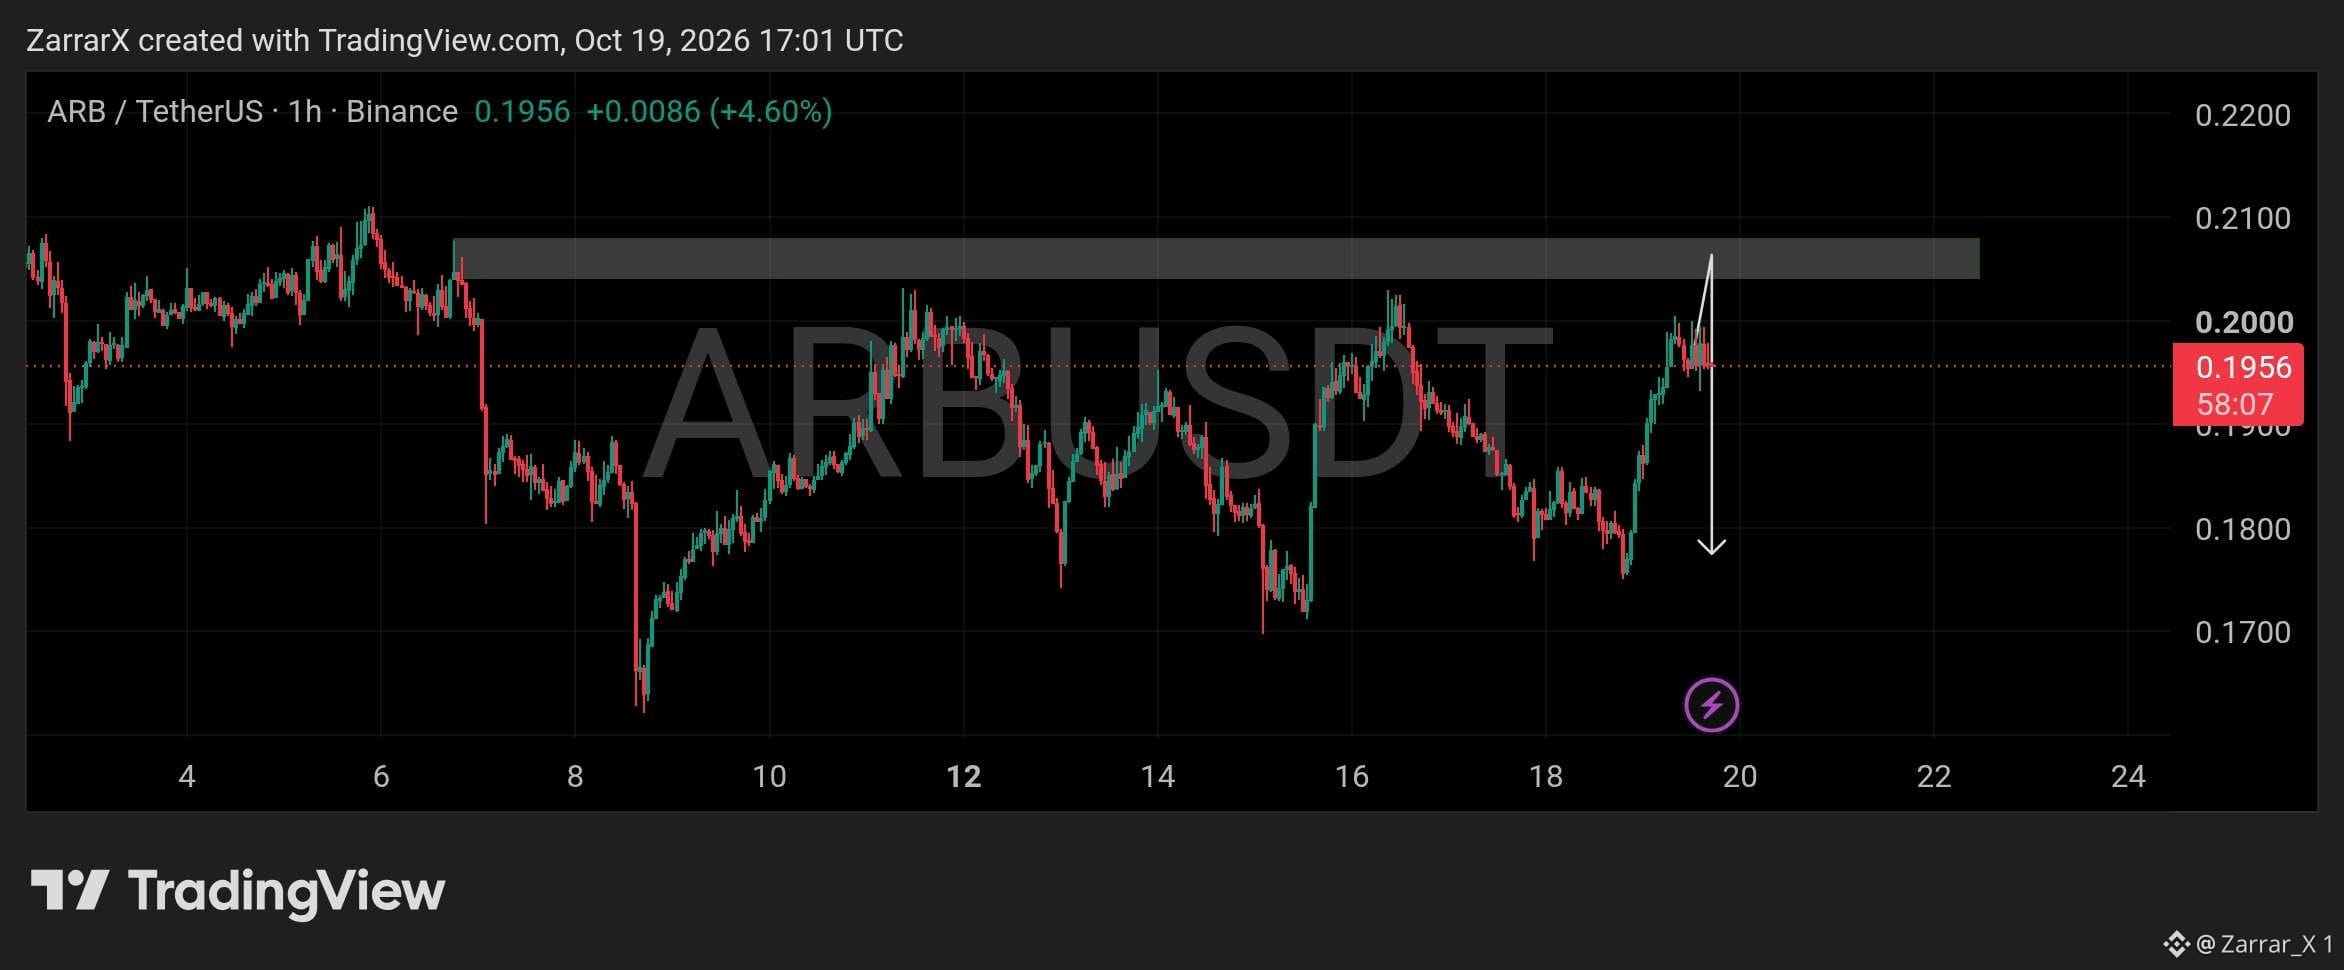
$ARB has climbed back to $0.1956 after rebounding from the $0.1760–$0.1800 area, showing renewed buying pressure on the 1-hour chart. However, price is now approaching a region where previous rallies have struggled, leaving room for another rejection.
The $0.2040–$0.2080 zone is the key resistance to watch. A push into this supply area followed by a rejection could send #ARB back toward $0.1850, with a deeper pullback potentially retesting the $0.1760–$0.1800 demand region.
For now, the chart favors caution as price approaches resistance after a sharp recovery. A clean breakout and hold above the supply zone would weaken the bearish outlook, while another rejection could bring sellers back into control.
#Altcoin Season# #Crypto
$ARB has climbed back to $0.1956 after rebounding from the $0.1760–$0.1800 area, showing renewed buying pressure on the 1-hour chart. However, price is now approaching a region where previous rallies have struggled, leaving room for another rejection.
The $0.2040–$0.2080 zone is the key resistance to watch. A push into this supply area followed by a rejection could send #ARB back toward $0.1850, with a deeper pullback potentially retesting the $0.1760–$0.1800 demand region.
For now, the chart favors caution as price approaches resistance after a sharp recovery. A clean breakout and hold above the supply zone would weaken the bearish outlook, while another rejection could bring sellers back into control.
#Altcoin Season# #Crypto
The $0.2040–$0.2080 zone is the key resistance to watch. A push into this supply area followed by a rejection could send #ARB back toward $0.1850, with a deeper pullback potentially retesting the $0.1760–$0.1800 demand region.
For now, the chart favors caution as price approaches resistance after a sharp recovery. A clean breakout and hold above the supply zone would weaken the bearish outlook, while another rejection could bring sellers back into control.
#Altcoin Season# #Crypto
41
·
--
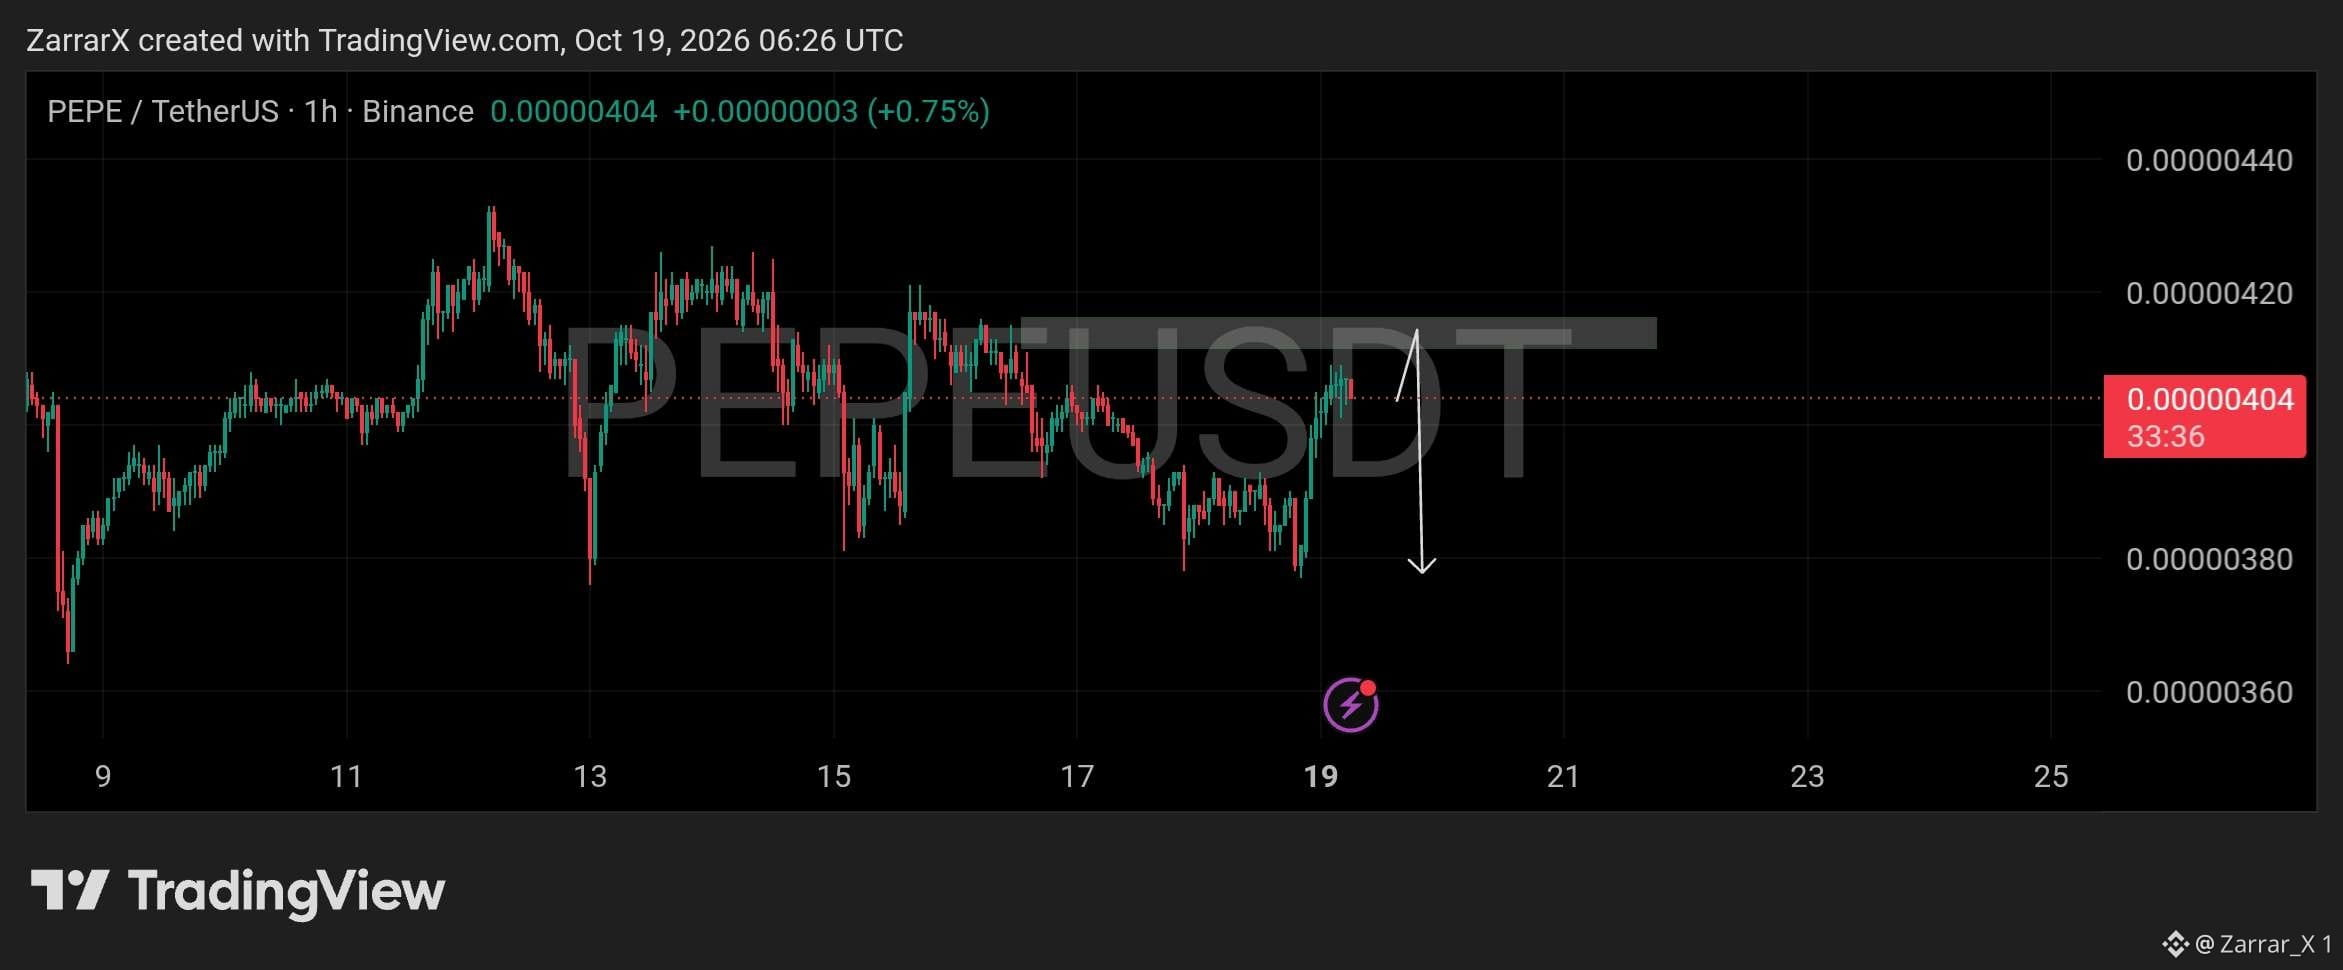
$PEPE is trading around $0.00000404 after recovering from the recent dip near $0.00000380. The rebound has brought price back toward a resistance area, but the broader 1-hour structure remains choppy, with sellers repeatedly stepping in during previous recovery attempts.
The $0.00000410–$0.00000416 zone is the immediate resistance to watch. A rejection here could send PEPE back toward $0.00000380–$0.00000385, where buyers have previously appeared and another reaction may develop.
A clean break above resistance would weaken the bearish outlook and open the door to a stronger recovery. Until then, another pullback remains possible, making the reaction around the current resistance more important than the recent bounce alone.
#PEPE #Altcoin Season# #Meme Alpha#
$PEPE is trading around $0.00000404 after recovering from the recent dip near $0.00000380. The rebound has brought price back toward a resistance area, but the broader 1-hour structure remains choppy, with sellers repeatedly stepping in during previous recovery attempts.
The $0.00000410–$0.00000416 zone is the immediate resistance to watch. A rejection here could send PEPE back toward $0.00000380–$0.00000385, where buyers have previously appeared and another reaction may develop.
A clean break above resistance would weaken the bearish outlook and open the door to a stronger recovery. Until then, another pullback remains possible, making the reaction around the current resistance more important than the recent bounce alone.
#PEPE #Altcoin Season# #Meme Alpha#
The $0.00000410–$0.00000416 zone is the immediate resistance to watch. A rejection here could send PEPE back toward $0.00000380–$0.00000385, where buyers have previously appeared and another reaction may develop.
A clean break above resistance would weaken the bearish outlook and open the door to a stronger recovery. Until then, another pullback remains possible, making the reaction around the current resistance more important than the recent bounce alone.
#PEPE #Altcoin Season# #Meme Alpha#
66
·
--
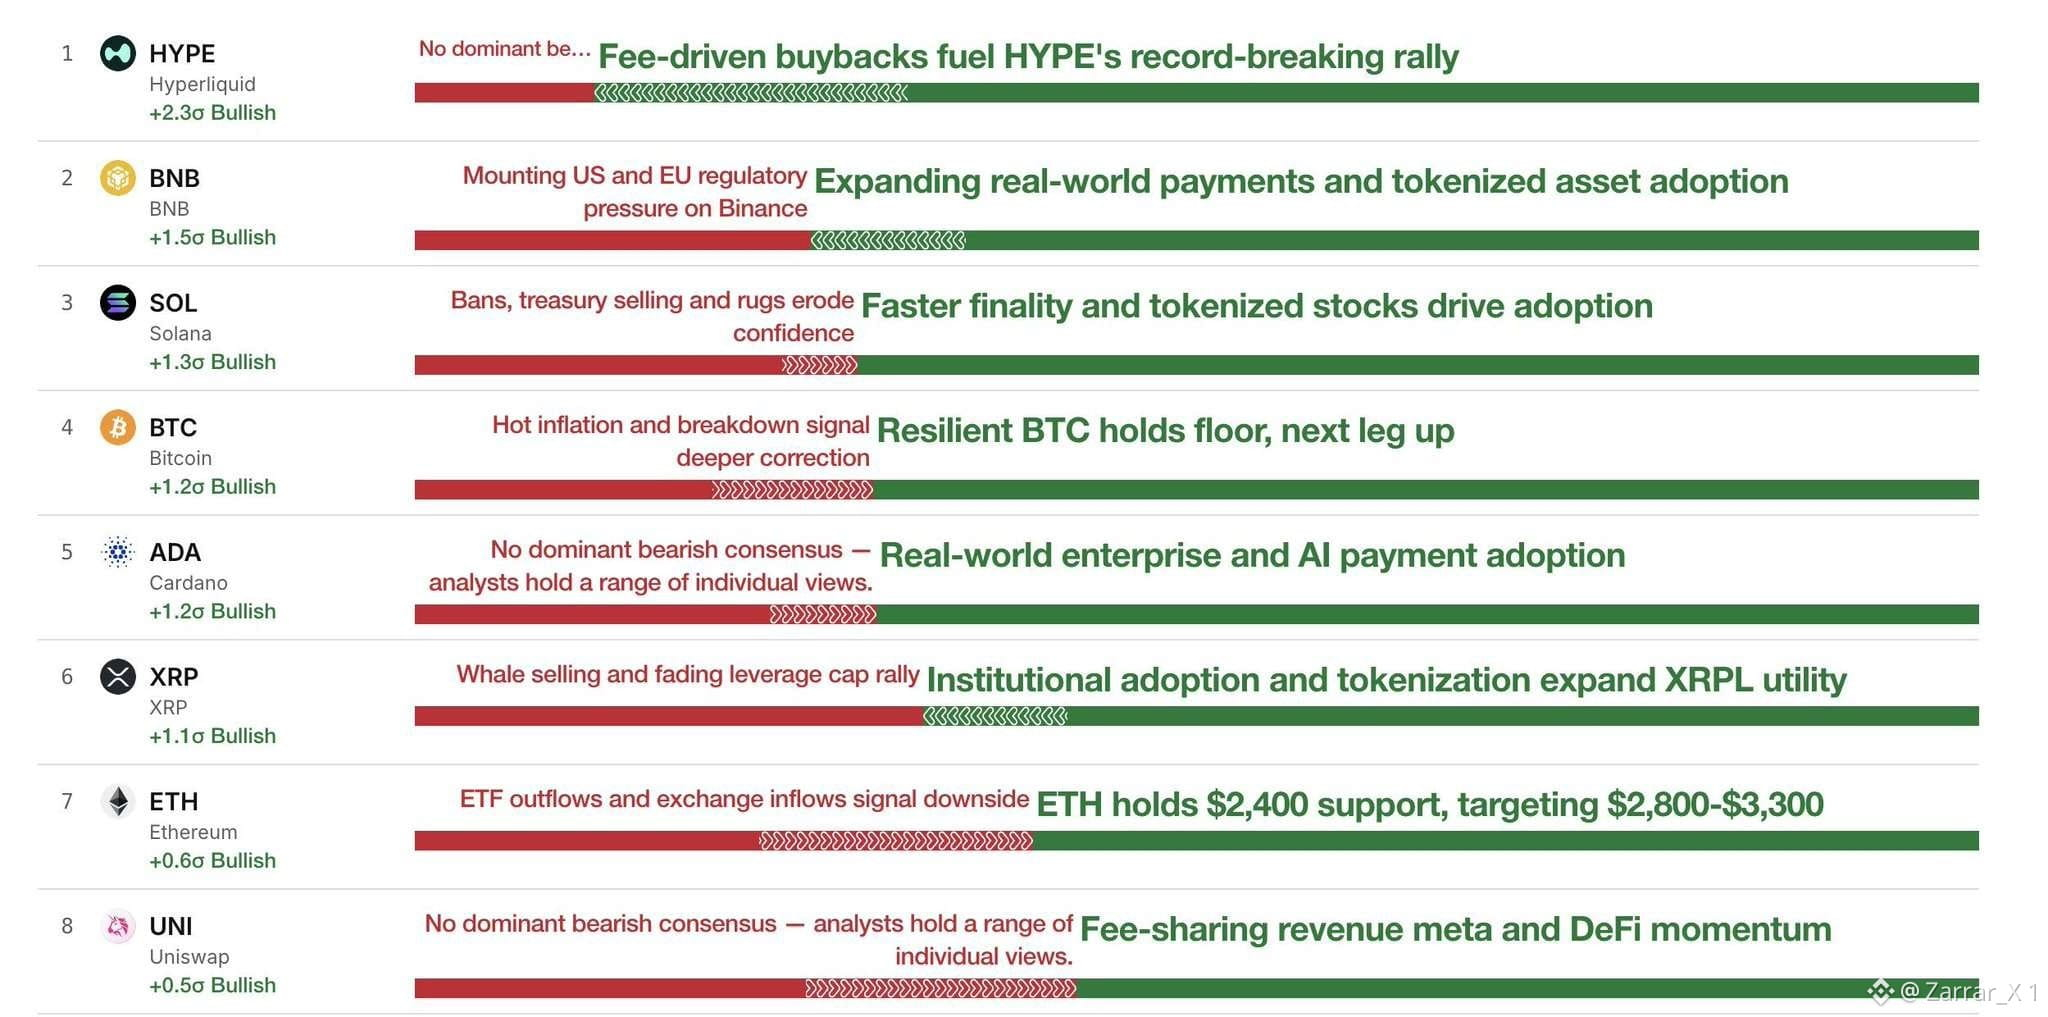
CryptoQuant CEO Names $HYPE the Most Bullish Crypto by Analyst Sentiment.
CryptoQuant CEO Ki Young Ju says Hyperliquid's #HYPE is currently the most bullish crypto asset based on analyst sentiment. CryptoQuant's October 18 data ranked HYPE highest among eight major cryptocurrencies, with sentiment standing 2.3 standard deviations above its historical baseline.
The bullish outlook reflects confidence in Hyperliquid's growing onchain derivatives market and its fee-funded HYPE buyback mechanism protocol uses trading-fee revenue to purchase tokens on the open market, creating a source of recurring demand tied to platform activity.
However, strong analyst sentiment has not prevented price weakness. HYPE had fallen roughly 15% over the preceding month in the latest reports, showing that bullish expectations do not always translate into immediate price gains.
The key question is whether trading activity and buybacks can sustain demand as market conditions fluctuate. Analyst sentiment offers a useful snapshot of expectations, but it is not a guarantee of future performance.
#Macro Insights# #Altcoin Season#
CryptoQuant CEO Names $HYPE the Most Bullish Crypto by Analyst Sentiment.
CryptoQuant CEO Ki Young Ju says Hyperliquid's #HYPE is currently the most bullish crypto asset based on analyst sentiment. CryptoQuant's October 18 data ranked HYPE highest among eight major cryptocurrencies, with sentiment standing 2.3 standard deviations above its historical baseline.
The bullish outlook reflects confidence in Hyperliquid's growing onchain derivatives market and its fee-funded HYPE buyback mechanism protocol uses trading-fee revenue to purchase tokens on the open market, creating a source of recurring demand tied to platform activity.
However, strong analyst sentiment has not prevented price weakness. HYPE had fallen roughly 15% over the preceding month in the latest reports, showing that bullish expectations do not always translate into immediate price gains.
The key question is whether trading activity and buybacks can sustain demand as market conditions fluctuate. Analyst sentiment offers a useful snapshot of expectations, but it is not a guarantee of future performance.
#Macro Insights# #Altcoin Season#
CryptoQuant CEO Ki Young Ju says Hyperliquid's #HYPE is currently the most bullish crypto asset based on analyst sentiment. CryptoQuant's October 18 data ranked HYPE highest among eight major cryptocurrencies, with sentiment standing 2.3 standard deviations above its historical baseline.
The bullish outlook reflects confidence in Hyperliquid's growing onchain derivatives market and its fee-funded HYPE buyback mechanism protocol uses trading-fee revenue to purchase tokens on the open market, creating a source of recurring demand tied to platform activity.
However, strong analyst sentiment has not prevented price weakness. HYPE had fallen roughly 15% over the preceding month in the latest reports, showing that bullish expectations do not always translate into immediate price gains.
The key question is whether trading activity and buybacks can sustain demand as market conditions fluctuate. Analyst sentiment offers a useful snapshot of expectations, but it is not a guarantee of future performance.
#Macro Insights# #Altcoin Season#
77
·
--
🇪🇺 USDC Becomes the EU’s First “Significant” E-Money Token Under MiCA.
The European Banking Authority (EBA) has classified Circle’s USDC as the European Union’s first significant e-money token under the Markets in Crypto-Assets Regulation (MiCA). USDC is the first of 45 notified e-money tokens to meet the regulatory significance threshold, marking the first application of this framework to a stablecoin.
From November 12, 2026, the EBA will take direct supervisory responsibility for USDC’s own-funds requirements, reserves, liquidity and recovery and redemption plans. France’s ACPR will continue overseeing areas including governance, management suitability and internal controls, creating a shared supervisory structure.
The decision places USDC under a higher level of regulatory scrutiny as its circulating supply approaches $73 billion. The EBA will reassess the token’s status annually, meaning its classification and the status of other notified e-money tokens remain subject to review.
The EBA has also established a cooperation arrangement with the New York State Department of Financial Services (NYDFS) to support cross-border stablecoin supervision. The move reflects growing efforts by regulators to coordinate oversight as dollar-pegged tokens expand across international financial markets.
$BTC $USDC #Macro Insights# #StableCoin #BTC Price Analysis#
🇪🇺 USDC Becomes the EU’s First “Significant” E-Money Token Under MiCA.
The European Banking Authority (EBA) has classified Circle’s USDC as the European Union’s first significant e-money token under the Markets in Crypto-Assets Regulation (MiCA). USDC is the first of 45 notified e-money tokens to meet the regulatory significance threshold, marking the first application of this framework to a stablecoin.
From November 12, 2026, the EBA will take direct supervisory responsibility for USDC’s own-funds requirements, reserves, liquidity and recovery and redemption plans. France’s ACPR will continue overseeing areas including governance, management suitability and internal controls, creating a shared supervisory structure.
The decision places USDC under a higher level of regulatory scrutiny as its circulating supply approaches $73 billion. The EBA will reassess the token’s status annually, meaning its classification and the status of other notified e-money tokens remain subject to review.
The EBA has also established a cooperation arrangement with the New York State Department of Financial Services (NYDFS) to support cross-border stablecoin supervision. The move reflects growing efforts by regulators to coordinate oversight as dollar-pegged tokens expand across international financial markets.
$BTC $USDC #Macro Insights# #StableCoin #BTC Price Analysis#
The European Banking Authority (EBA) has classified Circle’s USDC as the European Union’s first significant e-money token under the Markets in Crypto-Assets Regulation (MiCA). USDC is the first of 45 notified e-money tokens to meet the regulatory significance threshold, marking the first application of this framework to a stablecoin.
From November 12, 2026, the EBA will take direct supervisory responsibility for USDC’s own-funds requirements, reserves, liquidity and recovery and redemption plans. France’s ACPR will continue overseeing areas including governance, management suitability and internal controls, creating a shared supervisory structure.
The decision places USDC under a higher level of regulatory scrutiny as its circulating supply approaches $73 billion. The EBA will reassess the token’s status annually, meaning its classification and the status of other notified e-money tokens remain subject to review.
The EBA has also established a cooperation arrangement with the New York State Department of Financial Services (NYDFS) to support cross-border stablecoin supervision. The move reflects growing efforts by regulators to coordinate oversight as dollar-pegged tokens expand across international financial markets.
$BTC $USDC #Macro Insights# #StableCoin #BTC Price Analysis#

1
·
--
Can a Token Be Dangerous Even If a DEX Shows No Warning?
When trading new tokens on a DEX, many traders rely solely on interface security labels. If there is no "Fake" or "Honeypot" tag, they assume the token is 100% safe to buy.
The reality? No warning label DOES NOT equal a safety guarantee.
DEX interfaces like STONfi run automated security scans to detect known malicious patterns, but smart contract scams constantly evolve.
Here are 3 subtle risks that automated UI scanners might miss:
1️⃣ Dynamic Tax Changes & Unlocked Liquidity
A new contract might start with 0% buy/sell fees, but possess admin functions that allow the creator to raise transfer taxes to 99% later or instantly drain unlocked liquidity pools.
2️⃣ Proxy & Upgradable Contracts
Some tokens use proxy contract architectures. While initial code scans appear clean, malicious developers can modify contract logic after launch to freeze transfers or prevent selling.
3️⃣ Social Engineering & Malicious Metadata
Even if the token contract itself is basic ERC20/Jetton code, the project might run phishing links or fake token claim sites in its metadata to siphon wallet permissions.
The Takeaway: Interface warnings are a valuable first line of defense, but independent verification (checking contract ownership, LP locks, and audit reports) is essential before swapping.
Want to sharpen your security instinct and test your ability to spot crypto scams?
Test your knowledge with Stonverse’s interactive Cybersecurity Game:
https://stonverse.com/cybersecgame/
$AGT $BTC #BTC Price Analysis# #Altcoin Season# #Crypto
Can a Token Be Dangerous Even If a DEX Shows No Warning?
When trading new tokens on a DEX, many traders rely solely on interface security labels. If there is no "Fake" or "Honeypot" tag, they assume the token is 100% safe to buy.
The reality? No warning label DOES NOT equal a safety guarantee.
DEX interfaces like STONfi run automated security scans to detect known malicious patterns, but smart contract scams constantly evolve.
Here are 3 subtle risks that automated UI scanners might miss:
1️⃣ Dynamic Tax Changes & Unlocked Liquidity
A new contract might start with 0% buy/sell fees, but possess admin functions that allow the creator to raise transfer taxes to 99% later or instantly drain unlocked liquidity pools.
2️⃣ Proxy & Upgradable Contracts
Some tokens use proxy contract architectures. While initial code scans appear clean, malicious developers can modify contract logic after launch to freeze transfers or prevent selling.
3️⃣ Social Engineering & Malicious Metadata
Even if the token contract itself is basic ERC20/Jetton code, the project might run phishing links or fake token claim sites in its metadata to siphon wallet permissions.
The Takeaway: Interface warnings are a valuable first line of defense, but independent verification (checking contract ownership, LP locks, and audit reports) is essential before swapping.
Want to sharpen your security instinct and test your ability to spot crypto scams?
Test your knowledge with Stonverse’s interactive Cybersecurity Game:
https://stonverse.com/cybersecgame/
$AGT $BTC #BTC Price Analysis# #Altcoin Season# #Crypto
When trading new tokens on a DEX, many traders rely solely on interface security labels. If there is no "Fake" or "Honeypot" tag, they assume the token is 100% safe to buy.
The reality? No warning label DOES NOT equal a safety guarantee.
DEX interfaces like STONfi run automated security scans to detect known malicious patterns, but smart contract scams constantly evolve.
Here are 3 subtle risks that automated UI scanners might miss:
1️⃣ Dynamic Tax Changes & Unlocked Liquidity
A new contract might start with 0% buy/sell fees, but possess admin functions that allow the creator to raise transfer taxes to 99% later or instantly drain unlocked liquidity pools.
2️⃣ Proxy & Upgradable Contracts
Some tokens use proxy contract architectures. While initial code scans appear clean, malicious developers can modify contract logic after launch to freeze transfers or prevent selling.
3️⃣ Social Engineering & Malicious Metadata
Even if the token contract itself is basic ERC20/Jetton code, the project might run phishing links or fake token claim sites in its metadata to siphon wallet permissions.
The Takeaway: Interface warnings are a valuable first line of defense, but independent verification (checking contract ownership, LP locks, and audit reports) is essential before swapping.
Want to sharpen your security instinct and test your ability to spot crypto scams?
Test your knowledge with Stonverse’s interactive Cybersecurity Game:
https://stonverse.com/cybersecgame/
$AGT $BTC #BTC Price Analysis# #Altcoin Season# #Crypto
2
·
--
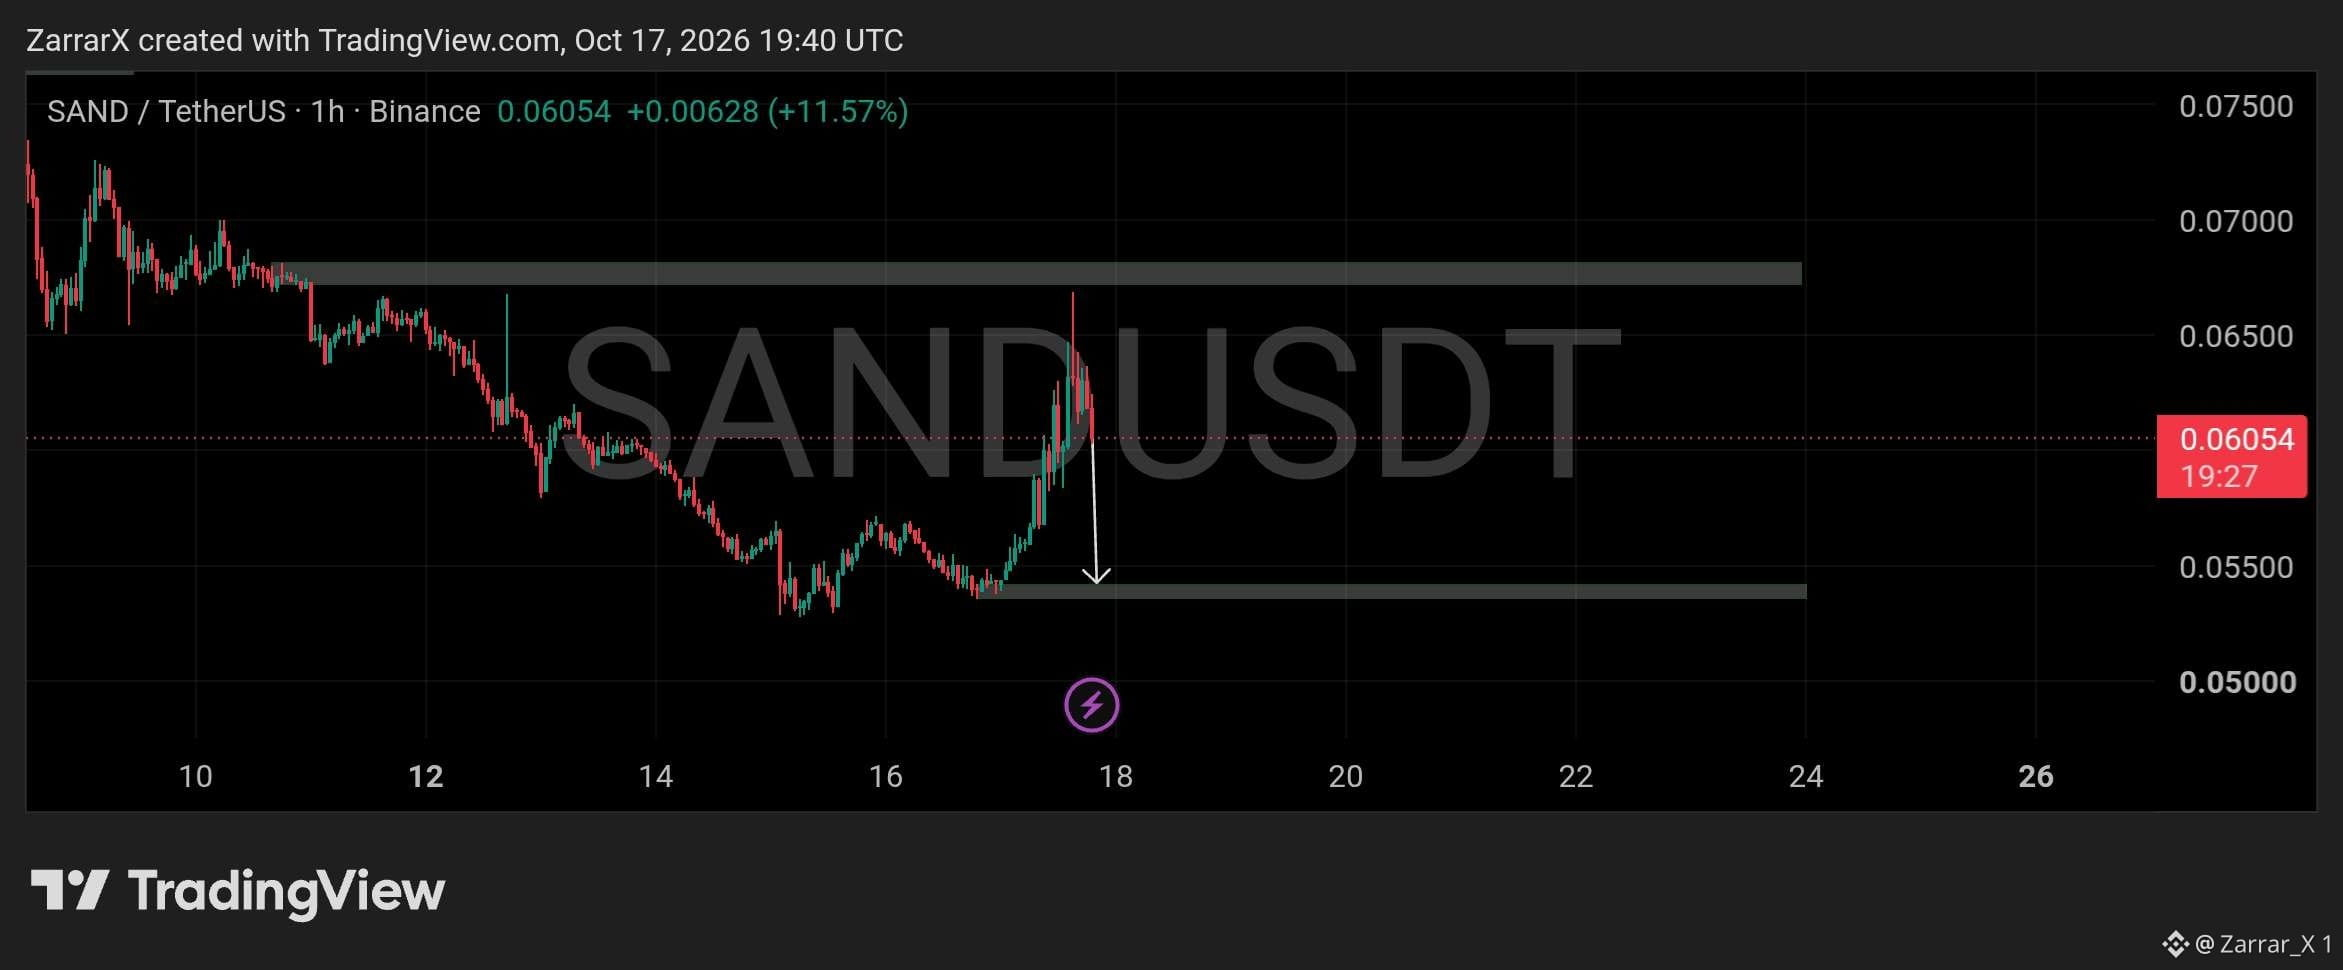
$SAND has rebounded to $0.0605, gaining over 11% after recovering from the $0.0530–$0.0540 demand zone. However, the broader 1-hour structure remains weak, and the recent spike is facing the possibility of a deeper pullback.
Price could revisit demand around $0.0540 before attempting another recovery. If buyers defend this zone, a renewed move upward could develop, while the $0.0670–$0.0680 region remains the major resistance to watch.
Failure to hold demand would put further downside in focus. For now, the reaction around $0.0540 will be important in determining whether this bounce can develop into a stronger recovery or fade.
#SAND #Altcoin Season# #Crypto
$SAND has rebounded to $0.0605, gaining over 11% after recovering from the $0.0530–$0.0540 demand zone. However, the broader 1-hour structure remains weak, and the recent spike is facing the possibility of a deeper pullback.
Price could revisit demand around $0.0540 before attempting another recovery. If buyers defend this zone, a renewed move upward could develop, while the $0.0670–$0.0680 region remains the major resistance to watch.
Failure to hold demand would put further downside in focus. For now, the reaction around $0.0540 will be important in determining whether this bounce can develop into a stronger recovery or fade.
#SAND #Altcoin Season# #Crypto
Price could revisit demand around $0.0540 before attempting another recovery. If buyers defend this zone, a renewed move upward could develop, while the $0.0670–$0.0680 region remains the major resistance to watch.
Failure to hold demand would put further downside in focus. For now, the reaction around $0.0540 will be important in determining whether this bounce can develop into a stronger recovery or fade.
#SAND #Altcoin Season# #Crypto
29
·
--
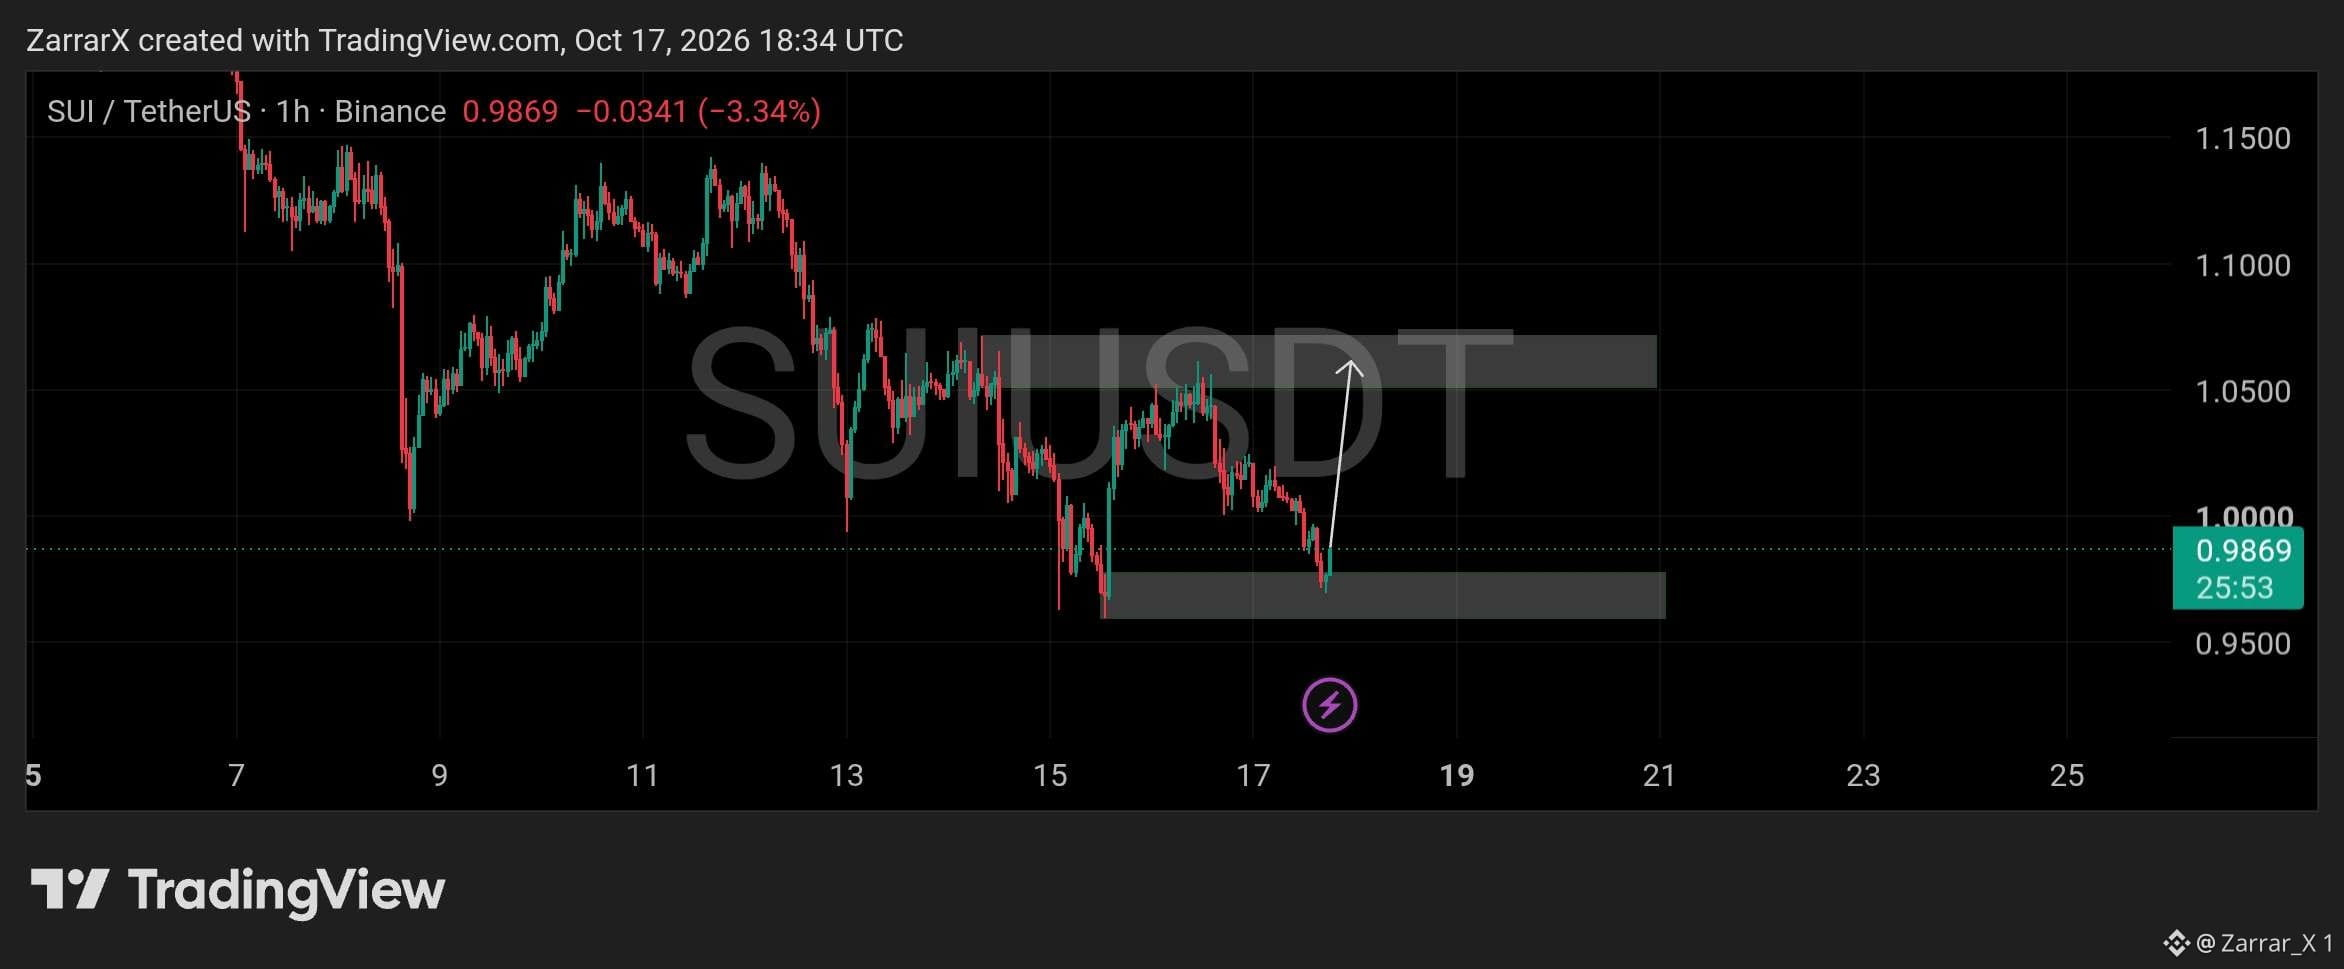
$SUI is testing the $0.9600–$0.9750 demand zone after an extended decline on the 1-hour chart. Price is currently around $0.9869, and this area could provide a base for a short-term recovery if buyers step in.
A successful bounce could push #sui toward $1.0200 before a larger test of the $1.0500–$1.0700 resistance zone. Buyers will need to build momentum to overcome the selling pressure above.
If demand fails to hold, further downside remains possible. For now, the reaction around $0.96–$0.975 will be key in determining whether a recovery can develop or the downtrend continues.
#Macro Insights# #Altcoin Season#
$SUI is testing the $0.9600–$0.9750 demand zone after an extended decline on the 1-hour chart. Price is currently around $0.9869, and this area could provide a base for a short-term recovery if buyers step in.
A successful bounce could push #sui toward $1.0200 before a larger test of the $1.0500–$1.0700 resistance zone. Buyers will need to build momentum to overcome the selling pressure above.
If demand fails to hold, further downside remains possible. For now, the reaction around $0.96–$0.975 will be key in determining whether a recovery can develop or the downtrend continues.
#Macro Insights# #Altcoin Season#
A successful bounce could push #sui toward $1.0200 before a larger test of the $1.0500–$1.0700 resistance zone. Buyers will need to build momentum to overcome the selling pressure above.
If demand fails to hold, further downside remains possible. For now, the reaction around $0.96–$0.975 will be key in determining whether a recovery can develop or the downtrend continues.
#Macro Insights# #Altcoin Season#
28
·
--
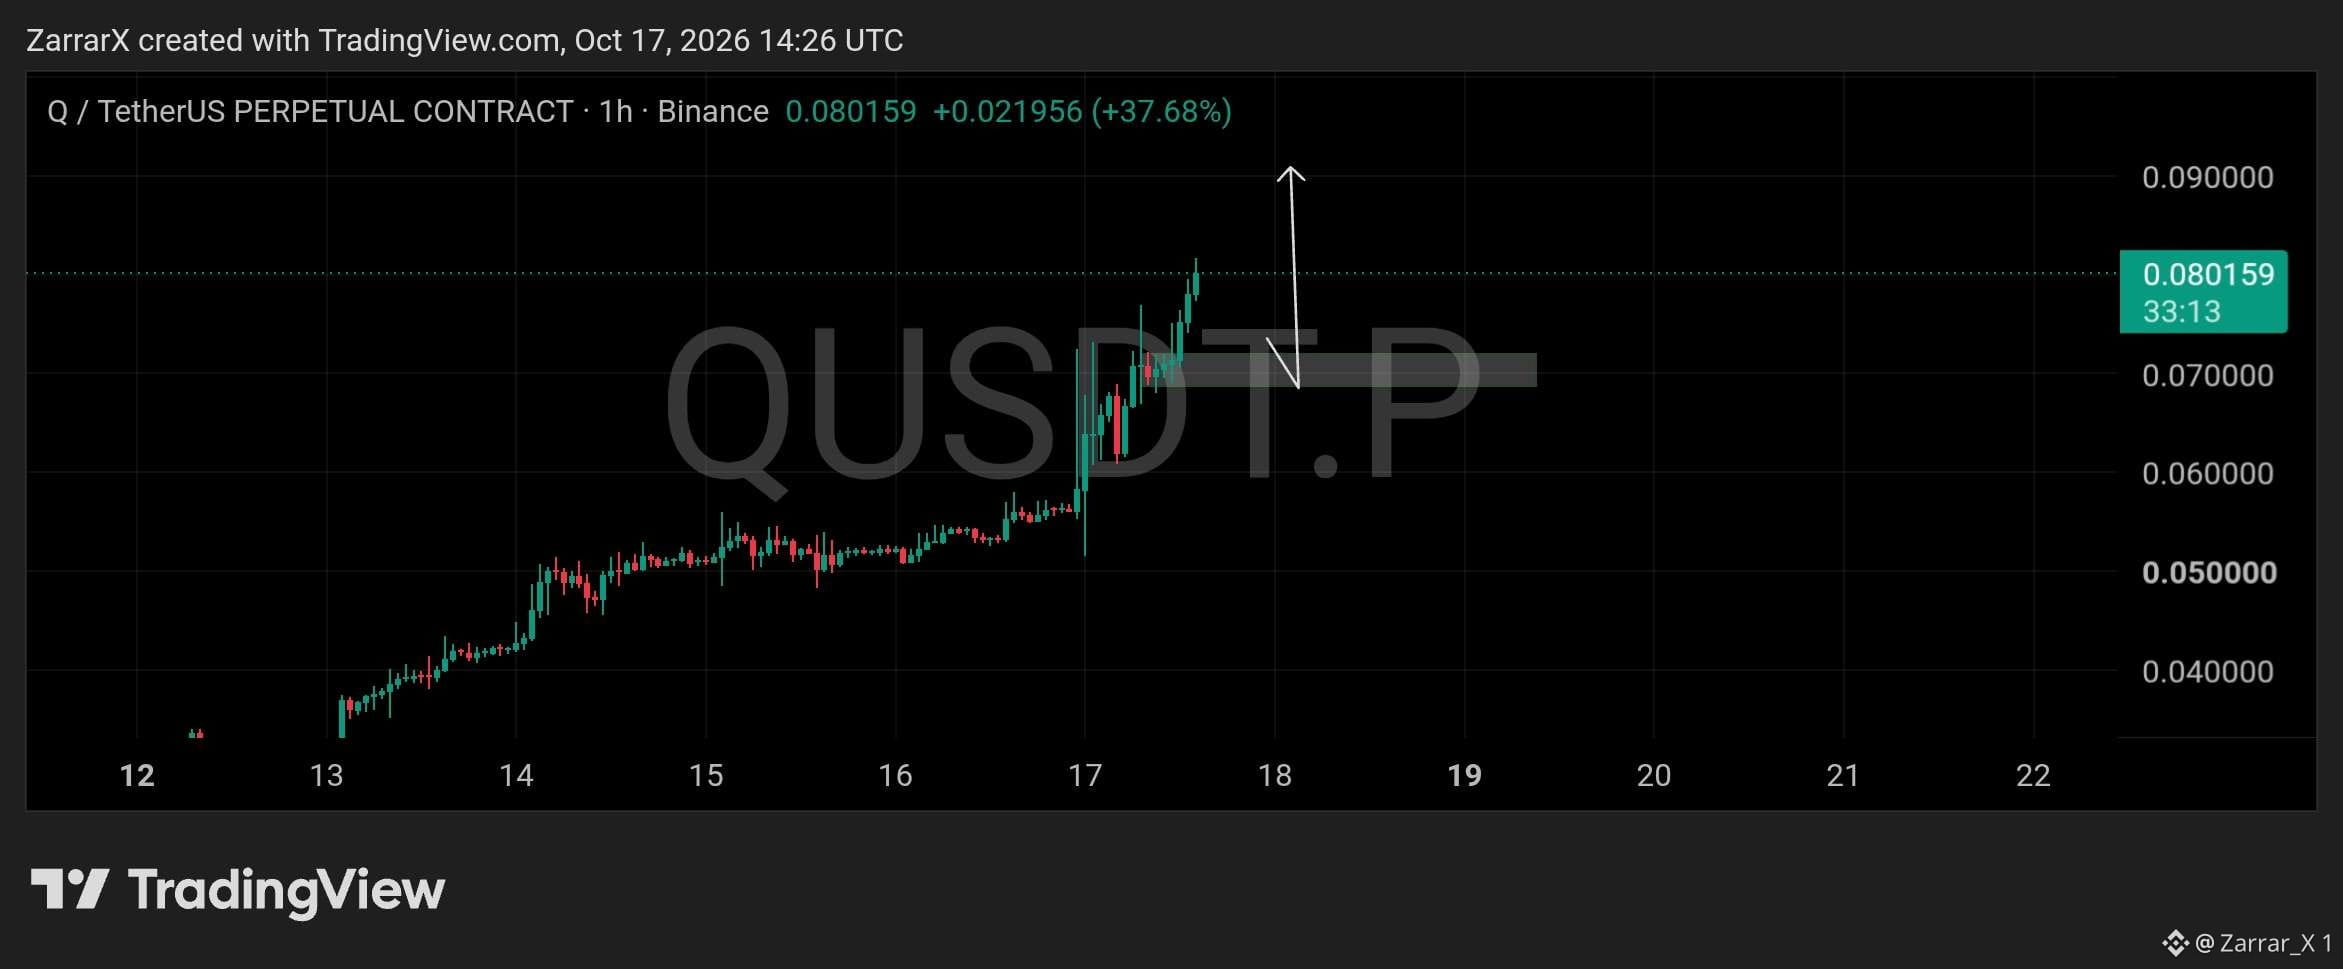
$Q has surged nearly 38% to $0.0802 on the 1-hour chart, extending a steady climb from below $0.04. Buyers remain in control, but the sharp rally increases the possibility of a short-term pullback.
The $0.0690–$0.0720 zone is the key area to watch for a retest. If buyers defend this former breakout region, price could regain momentum and push toward $0.0850–$0.0900.
A failure to hold this zone would weaken the immediate bullish structure and could lead to a deeper correction. Waiting for confirmation around support is safer than chasing the current spike.
#Altcoin Season# #Crypto #Meme Alpha#
$Q has surged nearly 38% to $0.0802 on the 1-hour chart, extending a steady climb from below $0.04. Buyers remain in control, but the sharp rally increases the possibility of a short-term pullback.
The $0.0690–$0.0720 zone is the key area to watch for a retest. If buyers defend this former breakout region, price could regain momentum and push toward $0.0850–$0.0900.
A failure to hold this zone would weaken the immediate bullish structure and could lead to a deeper correction. Waiting for confirmation around support is safer than chasing the current spike.
#Altcoin Season# #Crypto #Meme Alpha#
The $0.0690–$0.0720 zone is the key area to watch for a retest. If buyers defend this former breakout region, price could regain momentum and push toward $0.0850–$0.0900.
A failure to hold this zone would weaken the immediate bullish structure and could lead to a deeper correction. Waiting for confirmation around support is safer than chasing the current spike.
#Altcoin Season# #Crypto #Meme Alpha#
39
·
--
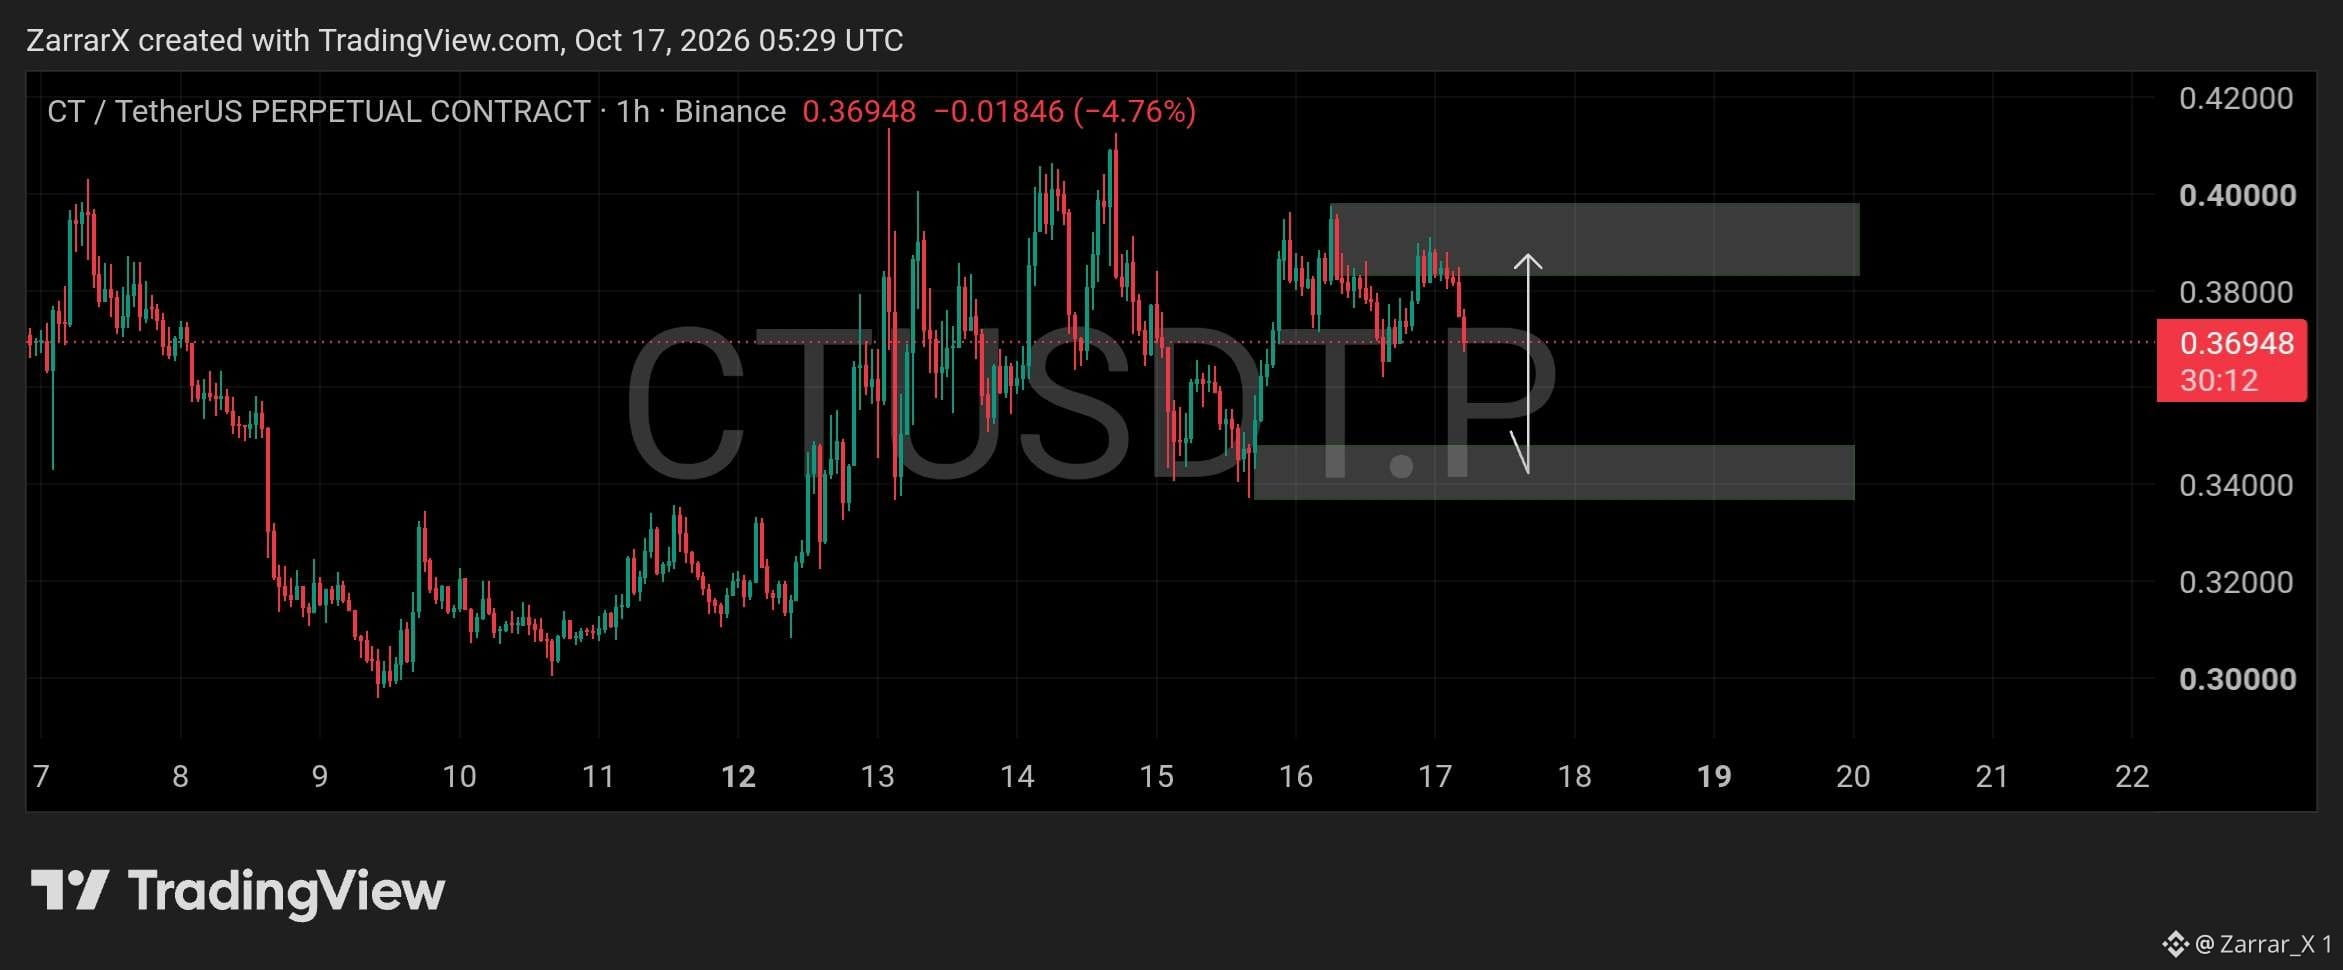
$CT is pulling back toward the $0.34–$0.35 demand zone after facing repeated rejection around $0.38–$0.40. Price is currently near $0.3695, with short-term selling pressure suggesting a possible continuation lower.
A reaction from demand could open the way for a recovery toward $0.38, followed by a retest of the $0.383–$0.398 resistance zone. Buyers would need to regain momentum to challenge that upper area.
If demand holds, CT could recover within its current range. A breakdown below $0.34, however, would weaken the bullish outlook and expose price to further downside.
#Altcoin Season# #BNBChain# #Crypto
$CT is pulling back toward the $0.34–$0.35 demand zone after facing repeated rejection around $0.38–$0.40. Price is currently near $0.3695, with short-term selling pressure suggesting a possible continuation lower.
A reaction from demand could open the way for a recovery toward $0.38, followed by a retest of the $0.383–$0.398 resistance zone. Buyers would need to regain momentum to challenge that upper area.
If demand holds, CT could recover within its current range. A breakdown below $0.34, however, would weaken the bullish outlook and expose price to further downside.
#Altcoin Season# #BNBChain# #Crypto
A reaction from demand could open the way for a recovery toward $0.38, followed by a retest of the $0.383–$0.398 resistance zone. Buyers would need to regain momentum to challenge that upper area.
If demand holds, CT could recover within its current range. A breakdown below $0.34, however, would weaken the bullish outlook and expose price to further downside.
#Altcoin Season# #BNBChain# #Crypto
53
·
--
Balanced vs. Single-Sided Liquidity Provision on STONfi.
When depositing assets into a DEX liquidity pool, most DeFi users know the classic rule: you must deposit equal values of two tokens (a 50/50 balanced deposit).
However, STONfi also offers Single-Sided Liquidity Provision. But how does single-sided LP actually work under the hood?
Here is a practical breakdown of both methods:
1️⃣ Balanced Provision (Standard 50/50)
In a standard deposit, you supply equal USD values of both assets, for example, $50 worth of STON and $50 worth of TON. Because your deposit matches the pool's required ratio, 100% of your capital enters the pool directly without internal conversions or extra price impact.
2️⃣ Single-Sided Provision (Automated Convenience)
What if you only hold TON, but want to provide liquidity to the STON/TON pool without manually swapping half of your tokens first?
When you choose Single-Sided Deposit, STONfi automatically performs an internal swap under the hood. It converts approximately 50% of your single asset into the paired token, balances the ratio, and adds the combined assets to the liquidity pool in a single transaction flow.
⚠️ What to Watch Before Confirming Single-Sided LP:
Because half of your deposit undergoes an automated swap, that internal trade is subject to standard DEX price impact and network fees. If the liquidity pool is shallow, single-sided provision can incur higher initial price impact than a manual balanced deposit. Always review the transaction preview before signing!
To deepen your understanding of AMM mechanics and liquidity pool structures, explore:
https://whatisdex.com/
$CNPY $BTC #BTC Price Analysis# #Macro Insights# #Altcoin Season#
Balanced vs. Single-Sided Liquidity Provision on STONfi.
When depositing assets into a DEX liquidity pool, most DeFi users know the classic rule: you must deposit equal values of two tokens (a 50/50 balanced deposit).
However, STONfi also offers Single-Sided Liquidity Provision. But how does single-sided LP actually work under the hood?
Here is a practical breakdown of both methods:
1️⃣ Balanced Provision (Standard 50/50)
In a standard deposit, you supply equal USD values of both assets, for example, $50 worth of STON and $50 worth of TON. Because your deposit matches the pool's required ratio, 100% of your capital enters the pool directly without internal conversions or extra price impact.
2️⃣ Single-Sided Provision (Automated Convenience)
What if you only hold TON, but want to provide liquidity to the STON/TON pool without manually swapping half of your tokens first?
When you choose Single-Sided Deposit, STONfi automatically performs an internal swap under the hood. It converts approximately 50% of your single asset into the paired token, balances the ratio, and adds the combined assets to the liquidity pool in a single transaction flow.
⚠️ What to Watch Before Confirming Single-Sided LP:
Because half of your deposit undergoes an automated swap, that internal trade is subject to standard DEX price impact and network fees. If the liquidity pool is shallow, single-sided provision can incur higher initial price impact than a manual balanced deposit. Always review the transaction preview before signing!
To deepen your understanding of AMM mechanics and liquidity pool structures, explore:
https://whatisdex.com/
$CNPY $BTC #BTC Price Analysis# #Macro Insights# #Altcoin Season#
When depositing assets into a DEX liquidity pool, most DeFi users know the classic rule: you must deposit equal values of two tokens (a 50/50 balanced deposit).
However, STONfi also offers Single-Sided Liquidity Provision. But how does single-sided LP actually work under the hood?
Here is a practical breakdown of both methods:
1️⃣ Balanced Provision (Standard 50/50)
In a standard deposit, you supply equal USD values of both assets, for example, $50 worth of STON and $50 worth of TON. Because your deposit matches the pool's required ratio, 100% of your capital enters the pool directly without internal conversions or extra price impact.
2️⃣ Single-Sided Provision (Automated Convenience)
What if you only hold TON, but want to provide liquidity to the STON/TON pool without manually swapping half of your tokens first?
When you choose Single-Sided Deposit, STONfi automatically performs an internal swap under the hood. It converts approximately 50% of your single asset into the paired token, balances the ratio, and adds the combined assets to the liquidity pool in a single transaction flow.
⚠️ What to Watch Before Confirming Single-Sided LP:
Because half of your deposit undergoes an automated swap, that internal trade is subject to standard DEX price impact and network fees. If the liquidity pool is shallow, single-sided provision can incur higher initial price impact than a manual balanced deposit. Always review the transaction preview before signing!
To deepen your understanding of AMM mechanics and liquidity pool structures, explore:
https://whatisdex.com/
$CNPY $BTC #BTC Price Analysis# #Macro Insights# #Altcoin Season#
74
·
--
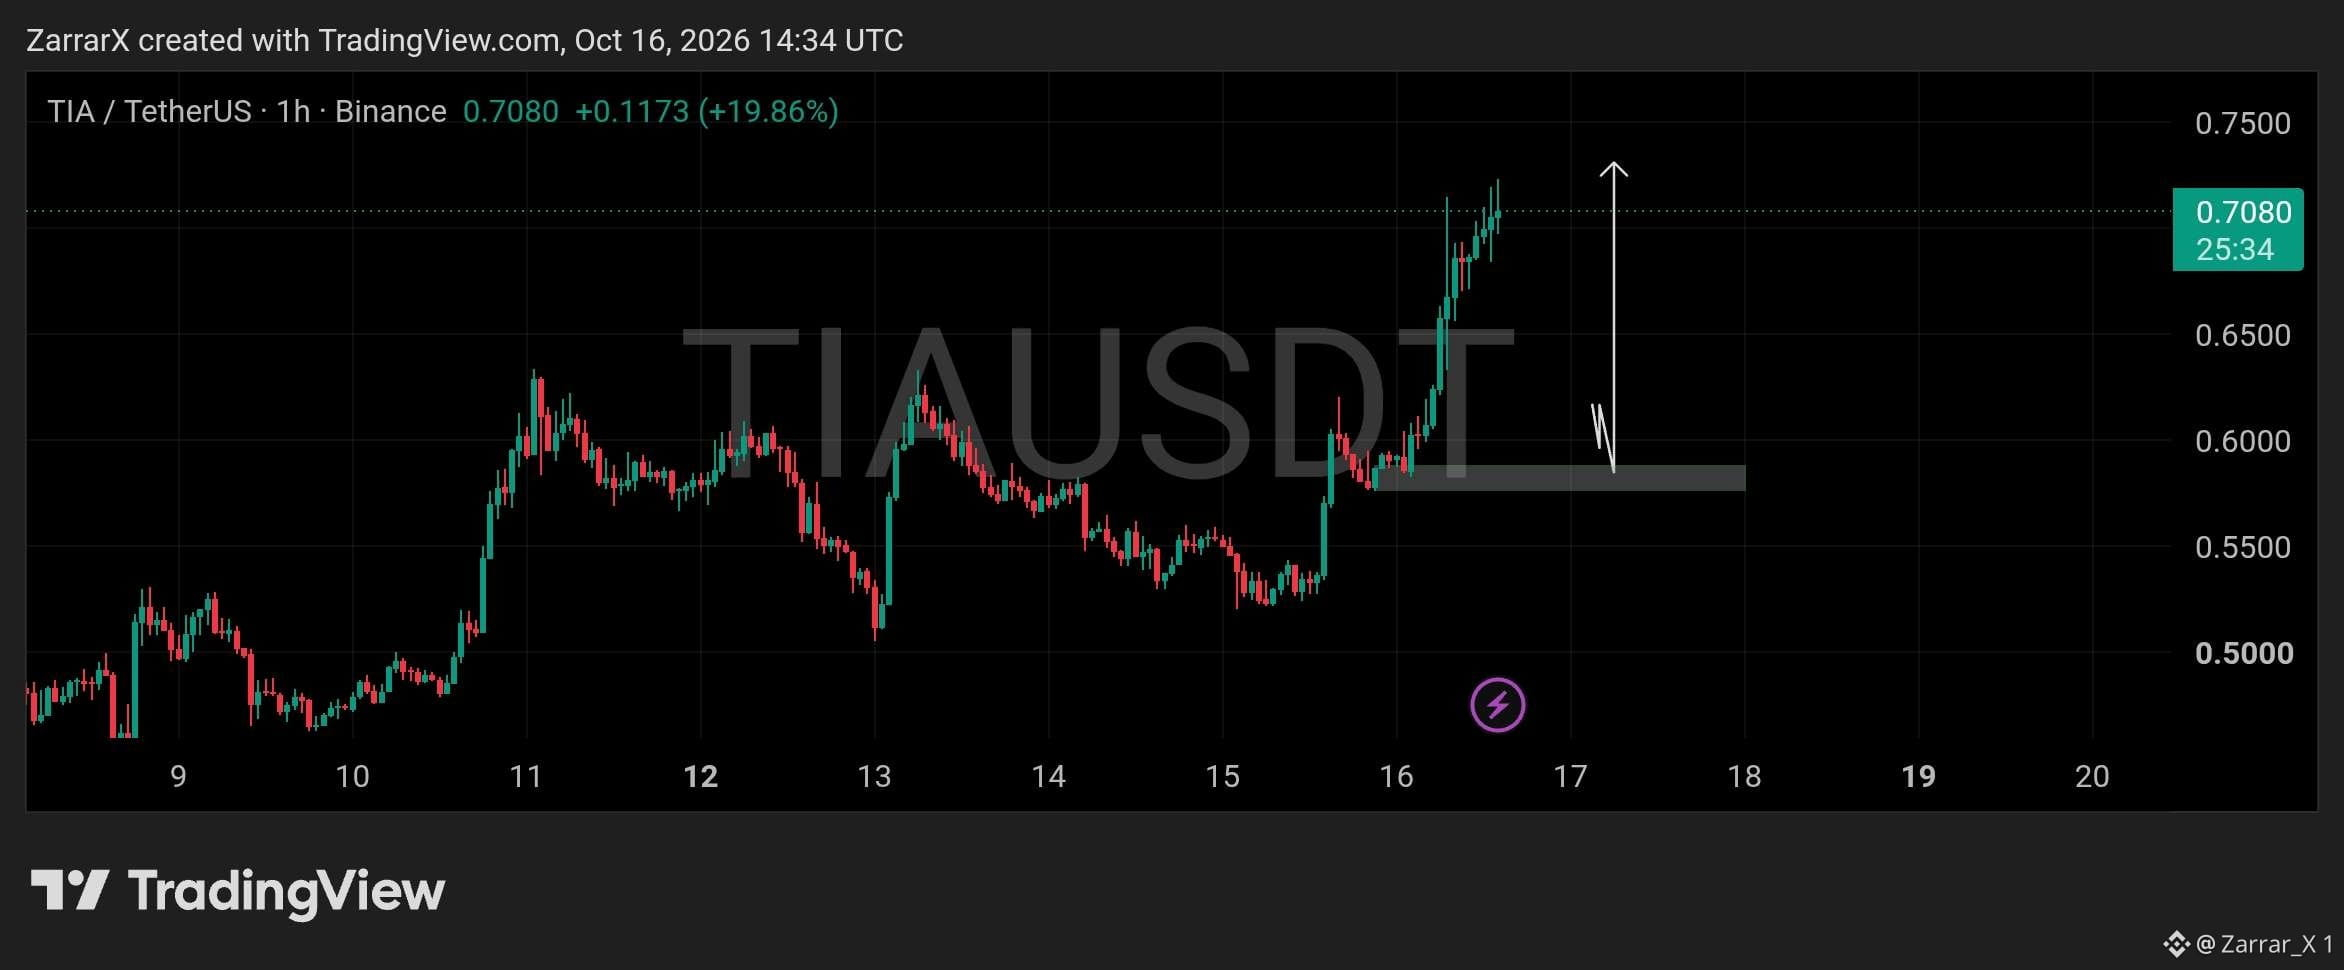
$TIA has surged nearly 20% to $0.7080 on the 1-hour chart, breaking above the previous consolidation range around $0.58–$0.60. Buyers are firmly in control of the current move, although the sharp rally leaves room for a short-term pullback.
The $0.576–$0.588 zone is now the key area to watch for a possible retest. If buyers defend this level, the uptrend could resume and push price toward $0.730–$0.750.
A deeper pullback could develop if momentum fades, so chasing the rally carries added risk. A successful retest and renewed buying pressure would provide stronger confirmation for continuation.
#Macro Insights# #Crypto #TIA
$TIA has surged nearly 20% to $0.7080 on the 1-hour chart, breaking above the previous consolidation range around $0.58–$0.60. Buyers are firmly in control of the current move, although the sharp rally leaves room for a short-term pullback.
The $0.576–$0.588 zone is now the key area to watch for a possible retest. If buyers defend this level, the uptrend could resume and push price toward $0.730–$0.750.
A deeper pullback could develop if momentum fades, so chasing the rally carries added risk. A successful retest and renewed buying pressure would provide stronger confirmation for continuation.
#Macro Insights# #Crypto #TIA
The $0.576–$0.588 zone is now the key area to watch for a possible retest. If buyers defend this level, the uptrend could resume and push price toward $0.730–$0.750.
A deeper pullback could develop if momentum fades, so chasing the rally carries added risk. A successful retest and renewed buying pressure would provide stronger confirmation for continuation.
#Macro Insights# #Crypto #TIA
52
·
--
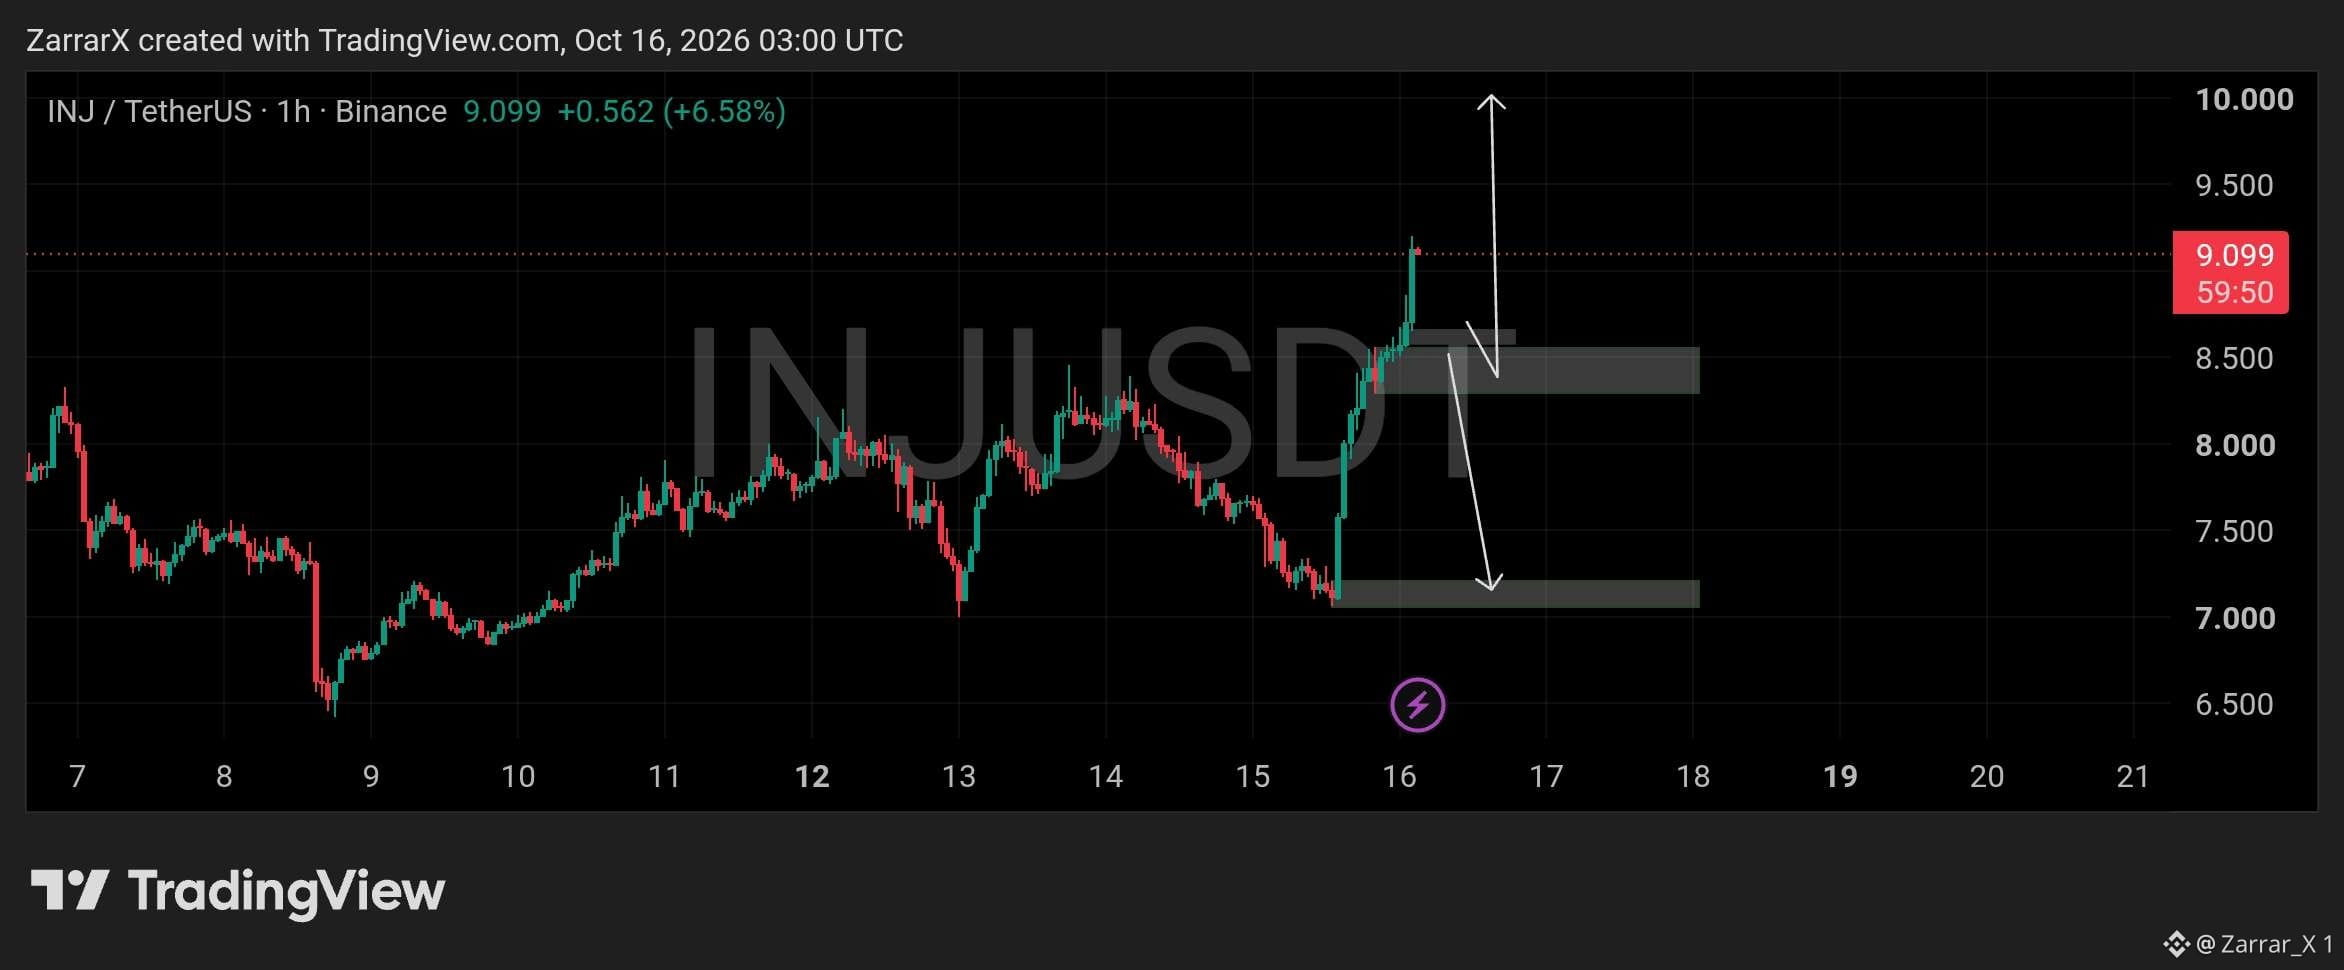
$INJ printed a strong impulse expansion on the 1-hour timeframe, rising to test $9.099 following a sharp recovery from lower accumulation levels.
Price is interacting with an immediate overhead supply block near the $8.300 – $8.600 region, while deeper structural support is established at the $7.050 – $7.200 demand shelf below.
The technical roadmap maps out a potential retracement down into the lower demand zone to sweep resting liquidity and retest structure before continuing its broader markup phase toward higher targets.
#INJ #Injective #Altcoin Season#
$INJ printed a strong impulse expansion on the 1-hour timeframe, rising to test $9.099 following a sharp recovery from lower accumulation levels.
Price is interacting with an immediate overhead supply block near the $8.300 – $8.600 region, while deeper structural support is established at the $7.050 – $7.200 demand shelf below.
The technical roadmap maps out a potential retracement down into the lower demand zone to sweep resting liquidity and retest structure before continuing its broader markup phase toward higher targets.
#INJ #Injective #Altcoin Season#
Price is interacting with an immediate overhead supply block near the $8.300 – $8.600 region, while deeper structural support is established at the $7.050 – $7.200 demand shelf below.
The technical roadmap maps out a potential retracement down into the lower demand zone to sweep resting liquidity and retest structure before continuing its broader markup phase toward higher targets.
#INJ #Injective #Altcoin Season#
66
·
--
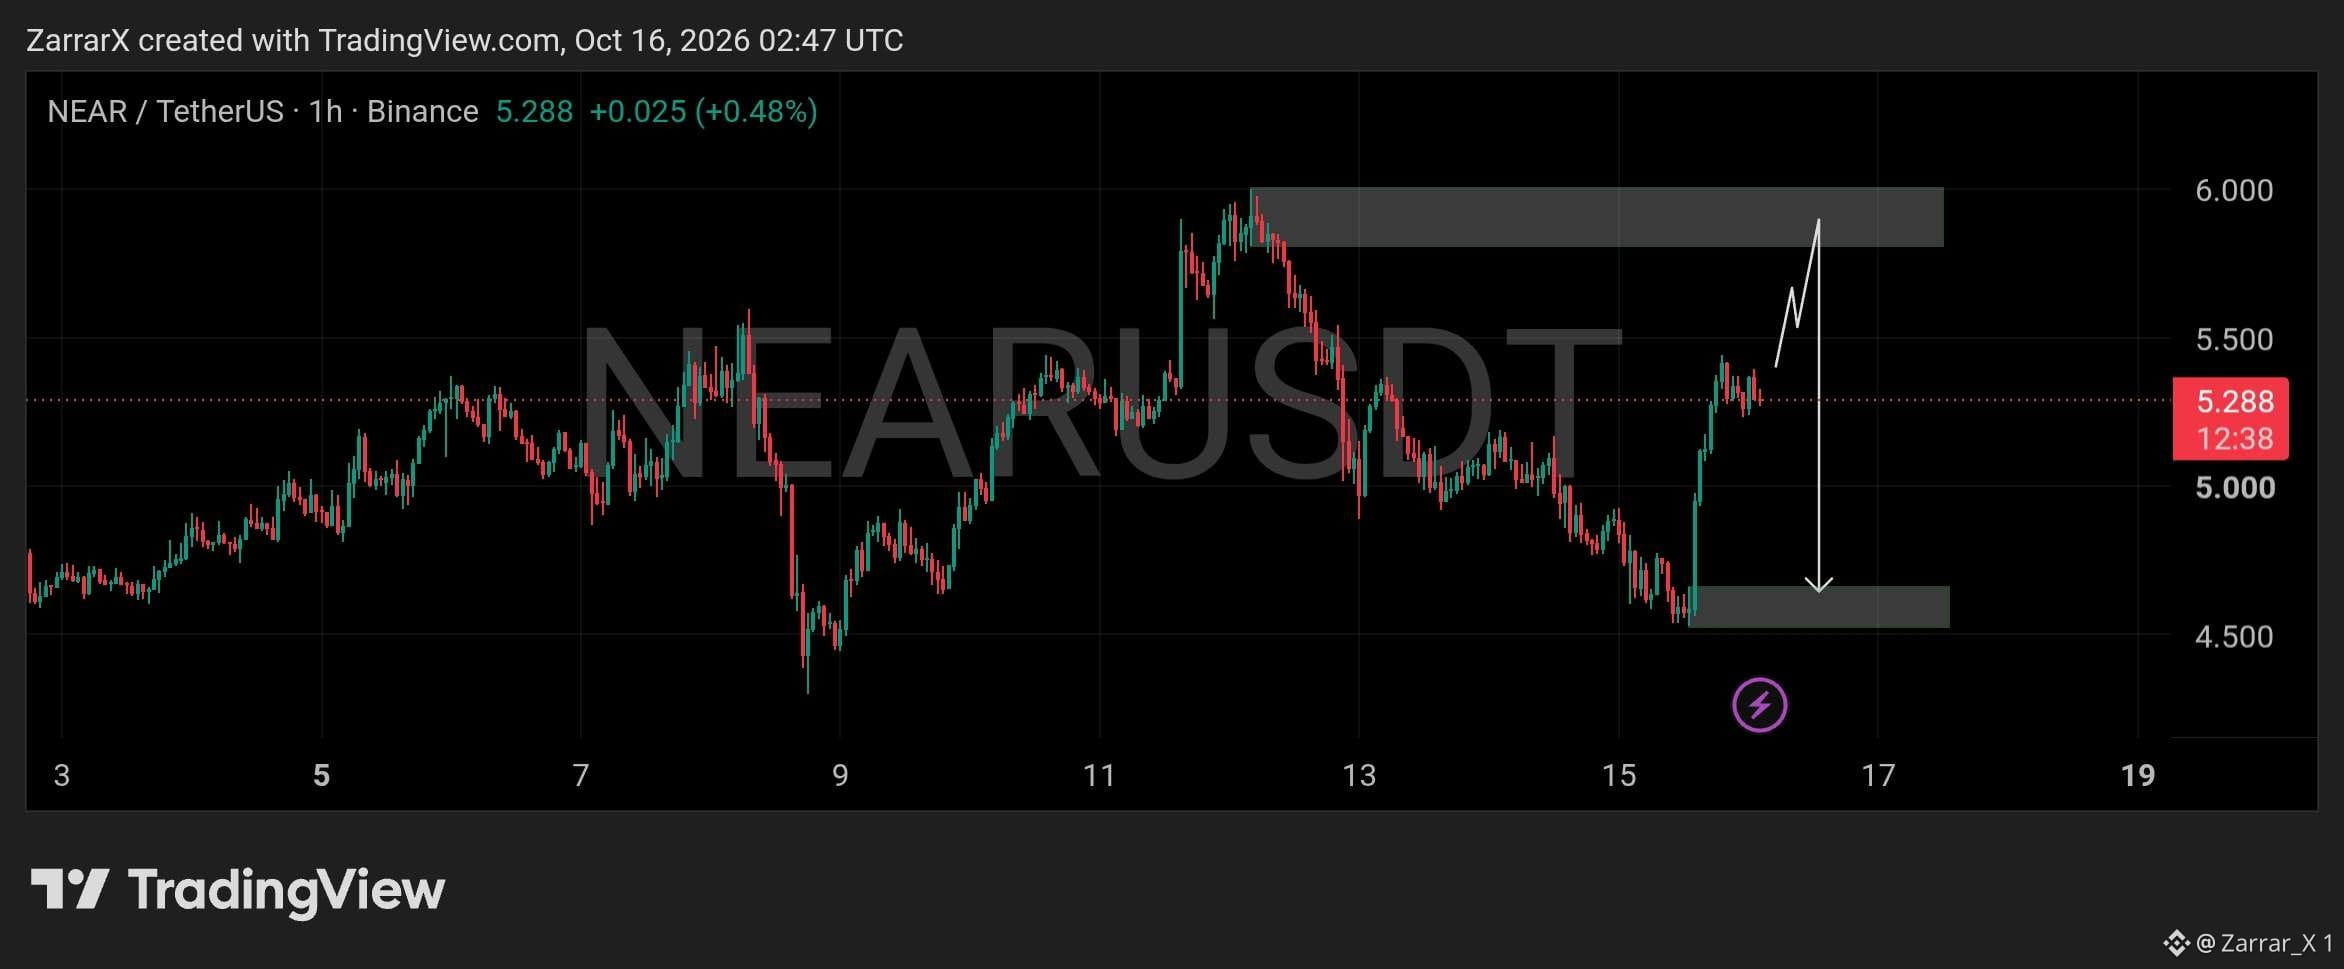
$NEAR has rebounded sharply from the $4.50–$4.65 demand zone and is now trading around $5.288 on the 1-hour chart. Buyers have regained short-term momentum, pushing price back above $5.00 after the recent decline.
A continuation toward $5.80–$6.00 resistance is possible if the current recovery holds. However, price may face selling pressure as it approaches this supply zone, making the reaction there important.
If #NEAR gets rejected, a pullback toward $4.50–$4.65 could follow. For now, the recovery is encouraging, but buyers need to sustain the momentum to challenge the upper resistance zone.
#Altcoin Season# #Crypto
$NEAR has rebounded sharply from the $4.50–$4.65 demand zone and is now trading around $5.288 on the 1-hour chart. Buyers have regained short-term momentum, pushing price back above $5.00 after the recent decline.
A continuation toward $5.80–$6.00 resistance is possible if the current recovery holds. However, price may face selling pressure as it approaches this supply zone, making the reaction there important.
If #NEAR gets rejected, a pullback toward $4.50–$4.65 could follow. For now, the recovery is encouraging, but buyers need to sustain the momentum to challenge the upper resistance zone.
#Altcoin Season# #Crypto
A continuation toward $5.80–$6.00 resistance is possible if the current recovery holds. However, price may face selling pressure as it approaches this supply zone, making the reaction there important.
If #NEAR gets rejected, a pullback toward $4.50–$4.65 could follow. For now, the recovery is encouraging, but buyers need to sustain the momentum to challenge the upper resistance zone.
#Altcoin Season# #Crypto
82
Войдите, чтобы посмотреть больше материала
Присоединяйтесь к пользователям криптовалют по всему миру на Binance Square
⚡️ Получайте новейшую и полезную информацию о криптоактивах.
💬 Нам доверяет крупнейшая в мире криптобиржа.
👍 Получите достоверные аналитические данные от верифицированных создателей контента.
Эл. почта/номер телефона
В тренде
BinancekzWin
Просмотров: 32,415
93 обсуждают
МЕН ЧАТТА ЖАЙ ҒАНА ОТЫРЫП, 10 BNB ҰТЫП АЛДЫМ 😭🔥
Деп айтқым келеді, бірақ бұл шындық емес, Бірақ шындықтың өзі де керемет 💅
Жеңіл, танымдық, қызықты белсенділіктерге қатысып, қомақты сыйлықтар ұтып алу? Оңай, Binance KZ мүмкіндікке толы!
Чатта үнемі розыгрыштар болып тұрады, мен де жиі ұтып аламын. Бірақ ең басты жеңіс- өзіңе жайлы, адекватты комьюнити табу. Араласу барысында көп пайдалы нәрсе үйренесің, саудада көмектесетін білім аласың.
Тегін $50 алу приятно, ал сол білімнің арқасында оны көбейту ол менің жеңісім 💅
#BinancekzWin
Cabbage hater
·Лайков: 0
·Просмотров: 65
BinancePick
Просмотров: 2.7M
144,021 обсуждают
EarningsSeason
Просмотров: 5M
24,704 обсуждают