
Wendy 1
217 Публикации

Wendy 1
Отправить жалобу
Заблокировать пользователя
🇻🇳 Verified Binance Square & CoinmarketCap | Research | Insight | Onchain | DM for Collab & Promo @wendyr9
0 подписок(и/а)
0 подписчиков(а)
0 понравилось
Посты
·
--
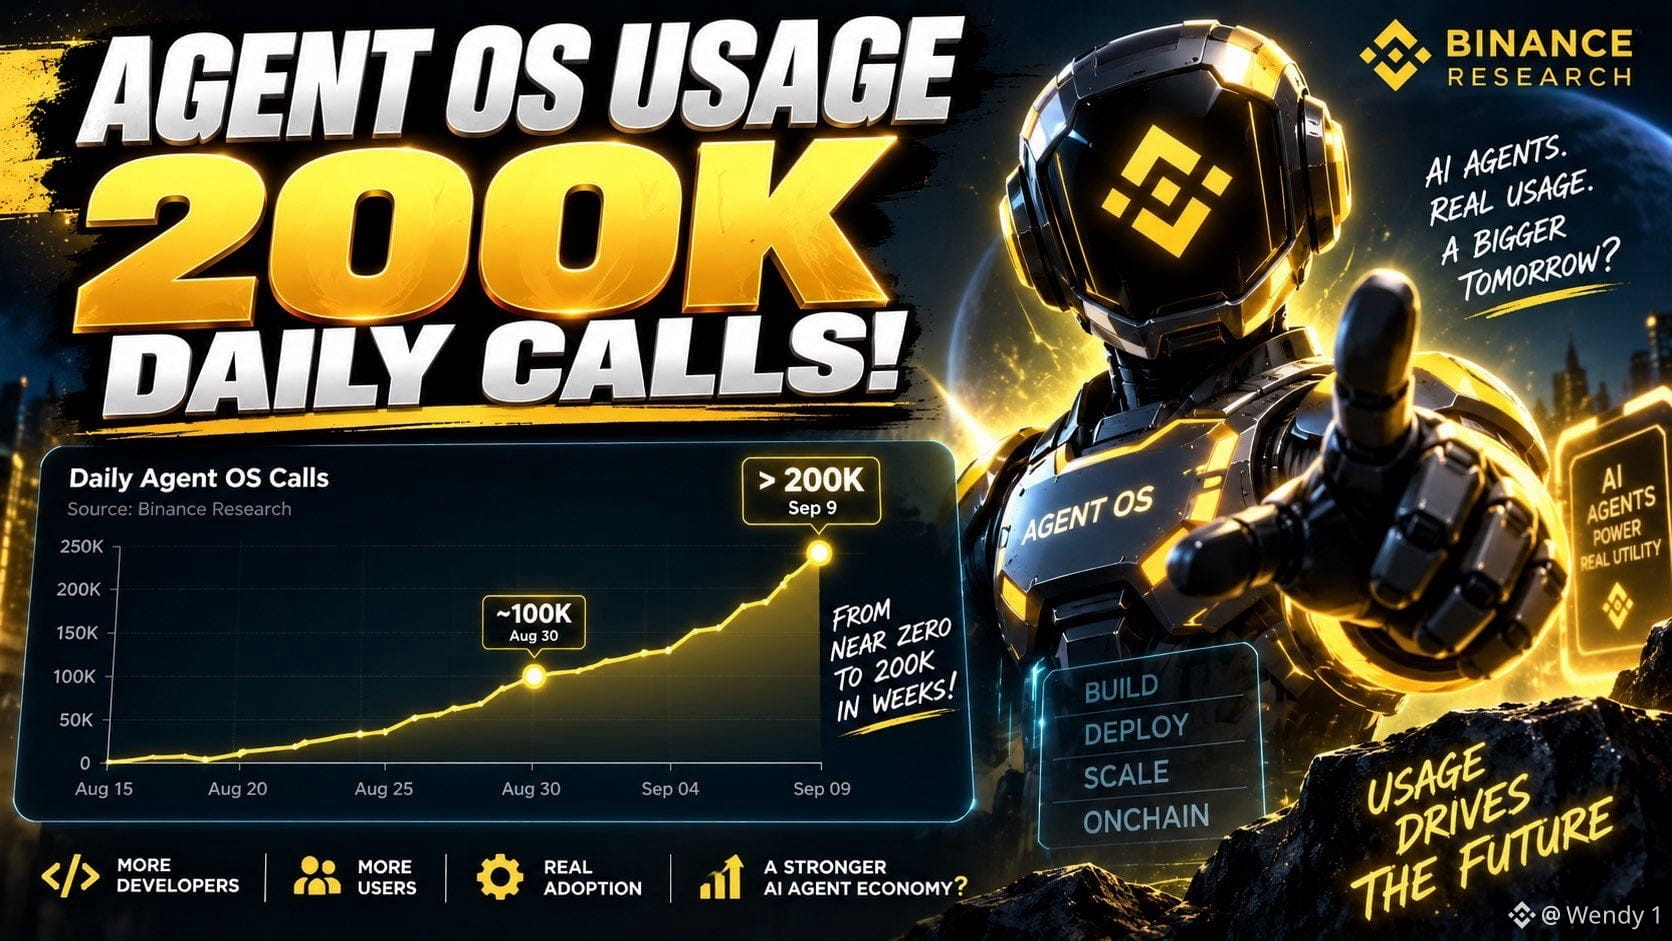
Agent OS usage just crossed 200K daily calls. 👀
That curve is getting hard to ignore.
According to Binance Research, daily Agent OS calls climbed from almost zero in mid-August to more than 200K per day by September 9.
The acceleration is the interesting part.
Around August 30, daily calls were already near 100K. A week later, the chart shows more than double that level.
This isn’t a price chart.
It’s usage.
If developers and users keep interacting with Agent OS at this pace, the next question is whether this activity can translate into sustained demand around the broader AI agent economy.
200K daily calls is a milestone.
Now let’s see if it becomes a new baseline. 👀
#Binance #AI #Crypto
Agent OS usage just crossed 200K daily calls. 👀
That curve is getting hard to ignore.
According to Binance Research, daily Agent OS calls climbed from almost zero in mid-August to more than 200K per day by September 9.
The acceleration is the interesting part.
Around August 30, daily calls were already near 100K. A week later, the chart shows more than double that level.
This isn’t a price chart.
It’s usage.
If developers and users keep interacting with Agent OS at this pace, the next question is whether this activity can translate into sustained demand around the broader AI agent economy.
200K daily calls is a milestone.
Now let’s see if it becomes a new baseline. 👀
#Binance #AI #Crypto
That curve is getting hard to ignore.
According to Binance Research, daily Agent OS calls climbed from almost zero in mid-August to more than 200K per day by September 9.
The acceleration is the interesting part.
Around August 30, daily calls were already near 100K. A week later, the chart shows more than double that level.
This isn’t a price chart.
It’s usage.
If developers and users keep interacting with Agent OS at this pace, the next question is whether this activity can translate into sustained demand around the broader AI agent economy.
200K daily calls is a milestone.
Now let’s see if it becomes a new baseline. 👀
#Binance #AI #Crypto
53
·
--
Patience paid off for this $USELESS holder. 👀
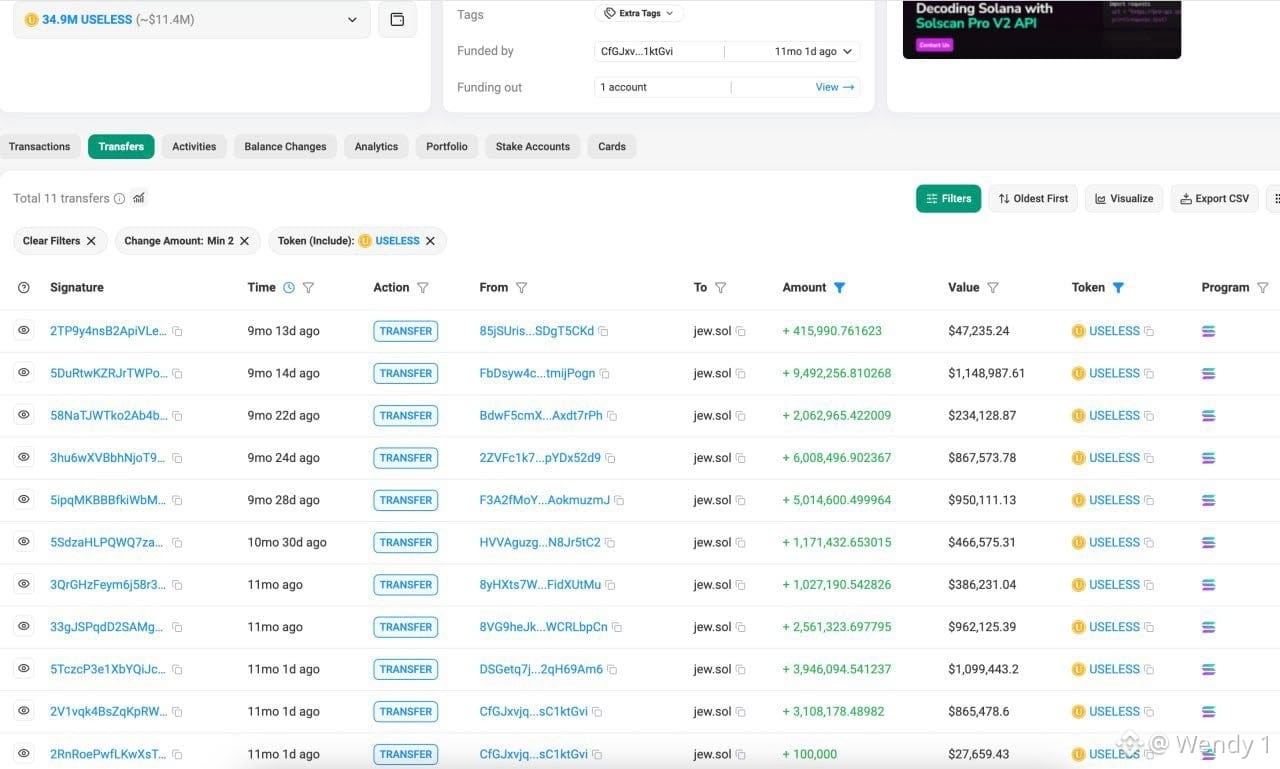
jew.sol has held 34.9M $USELESS , currently worth around $11.4M, for more than 9 months.
Back in September and October 2025, he spent about $6.4M accumulating the tokens at an average price of $0.1833.
The position got ugly first.
At one point, he was down more than $5M.
Now $USELESS has recovered strongly, leaving him with over $5M in unrealized profit.
Sometimes the hardest trade is simply waiting.
Disclaimer: This is not financial advice. Crypto assets can be highly volatile. Do your own research before making any trading or investment decisions.
Patience paid off for this $USELESS holder. 👀
jew.sol has held 34.9M $USELESS , currently worth around $11.4M, for more than 9 months.
Back in September and October 2025, he spent about $6.4M accumulating the tokens at an average price of $0.1833.
The position got ugly first.
At one point, he was down more than $5M.
Now $USELESS has recovered strongly, leaving him with over $5M in unrealized profit.
Sometimes the hardest trade is simply waiting.
Disclaimer: This is not financial advice. Crypto assets can be highly volatile. Do your own research before making any trading or investment decisions.
jew.sol has held 34.9M $USELESS , currently worth around $11.4M, for more than 9 months.
Back in September and October 2025, he spent about $6.4M accumulating the tokens at an average price of $0.1833.
The position got ugly first.
At one point, he was down more than $5M.
Now $USELESS has recovered strongly, leaving him with over $5M in unrealized profit.
Sometimes the hardest trade is simply waiting.
Disclaimer: This is not financial advice. Crypto assets can be highly volatile. Do your own research before making any trading or investment decisions.
48
·
--
One bad entry hurts.
Two FOMO trades in the same day cost this trader roughly $907K. 😬
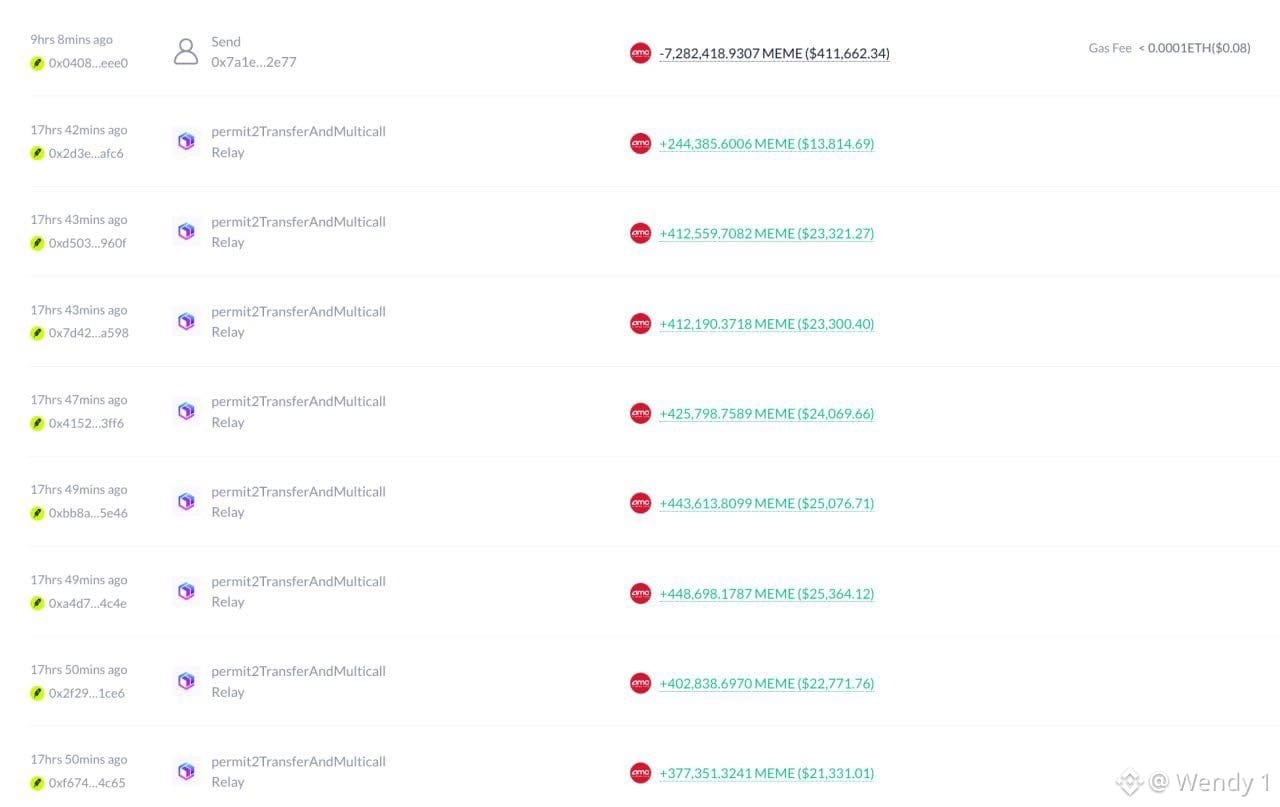
He spent $916.5K buying 7.28M $MEME around $0.126, then sold for just $353K.
Loss: $563K (-61.45%)
Then came $SLINK.
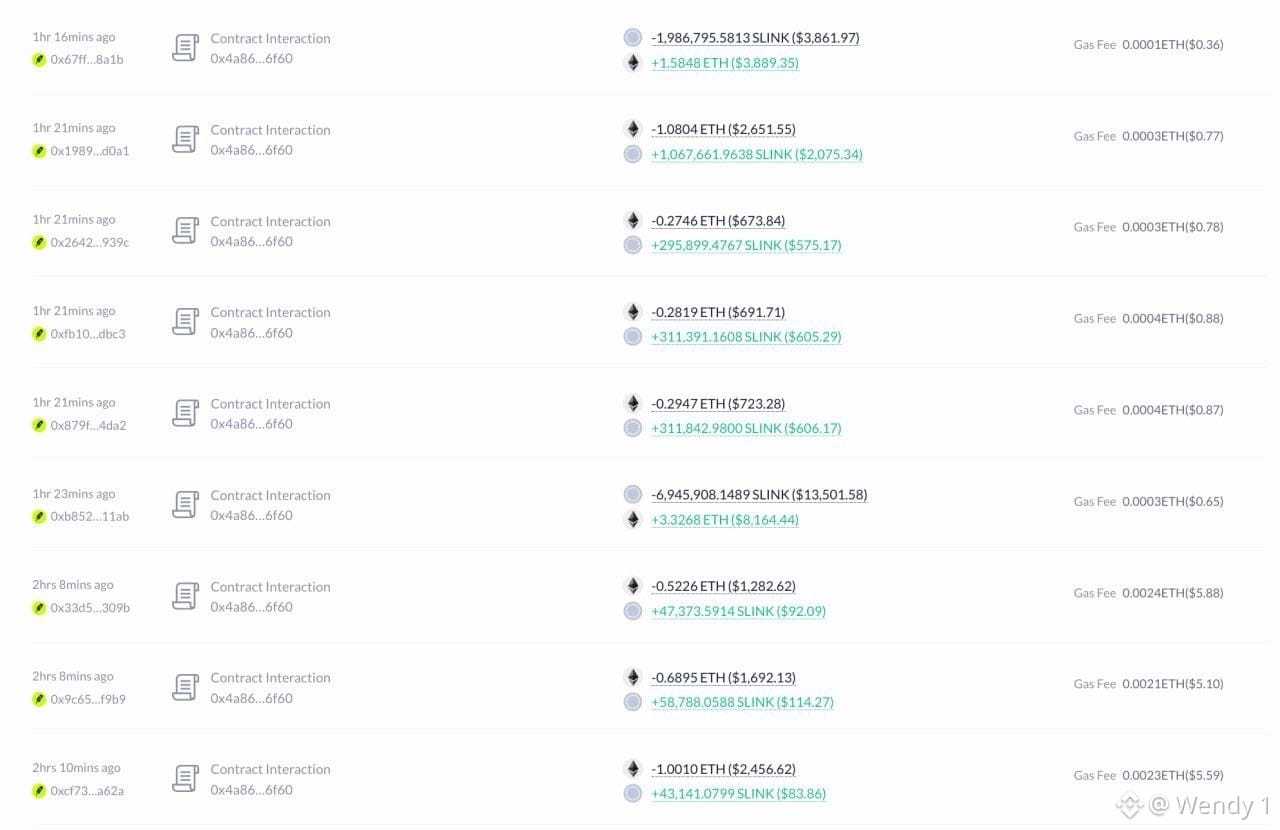
He spent another $356K to buy 8.93M $SLINK around $0.04, but eventually sold for only $12K.
Loss: $344K (-96.62%)
Total damage: ~$907K.
The painful part isn’t only the money. It’s what happened between the two trades.
After taking a huge loss on $MEME , he jumped straight into another trade instead of stepping back.
That’s FOMO.
A bad trade can happen to anyone. Chasing the next move right after one goes wrong can make it much worse.
The wallet activity is here:
https://debank.com/profile/0x010496b7017b9ed0c8e9c2ecebdc7d6b325c4af1
Don’t let one loss turn into the next one.
Disclaimer: This is not financial advice. Do your own research and manage your risk carefully.
One bad entry hurts.
Two FOMO trades in the same day cost this trader roughly $907K. 😬
He spent $916.5K buying 7.28M $MEME around $0.126, then sold for just $353K.
Loss: $563K (-61.45%)
Then came $SLINK.
He spent another $356K to buy 8.93M $SLINK around $0.04, but eventually sold for only $12K.
Loss: $344K (-96.62%)
Total damage: ~$907K.
The painful part isn’t only the money. It’s what happened between the two trades.
After taking a huge loss on $MEME , he jumped straight into another trade instead of stepping back.
That’s FOMO.
A bad trade can happen to anyone. Chasing the next move right after one goes wrong can make it much worse.
The wallet activity is here:
https://debank.com/profile/0x010496b7017b9ed0c8e9c2ecebdc7d6b325c4af1
Don’t let one loss turn into the next one.
Disclaimer: This is not financial advice. Do your own research and manage your risk carefully.
Two FOMO trades in the same day cost this trader roughly $907K. 😬
He spent $916.5K buying 7.28M $MEME around $0.126, then sold for just $353K.
Loss: $563K (-61.45%)
Then came $SLINK.
He spent another $356K to buy 8.93M $SLINK around $0.04, but eventually sold for only $12K.
Loss: $344K (-96.62%)
Total damage: ~$907K.
The painful part isn’t only the money. It’s what happened between the two trades.
After taking a huge loss on $MEME , he jumped straight into another trade instead of stepping back.
That’s FOMO.
A bad trade can happen to anyone. Chasing the next move right after one goes wrong can make it much worse.
The wallet activity is here:
https://debank.com/profile/0x010496b7017b9ed0c8e9c2ecebdc7d6b325c4af1
Don’t let one loss turn into the next one.
Disclaimer: This is not financial advice. Do your own research and manage your risk carefully.
79
·
--
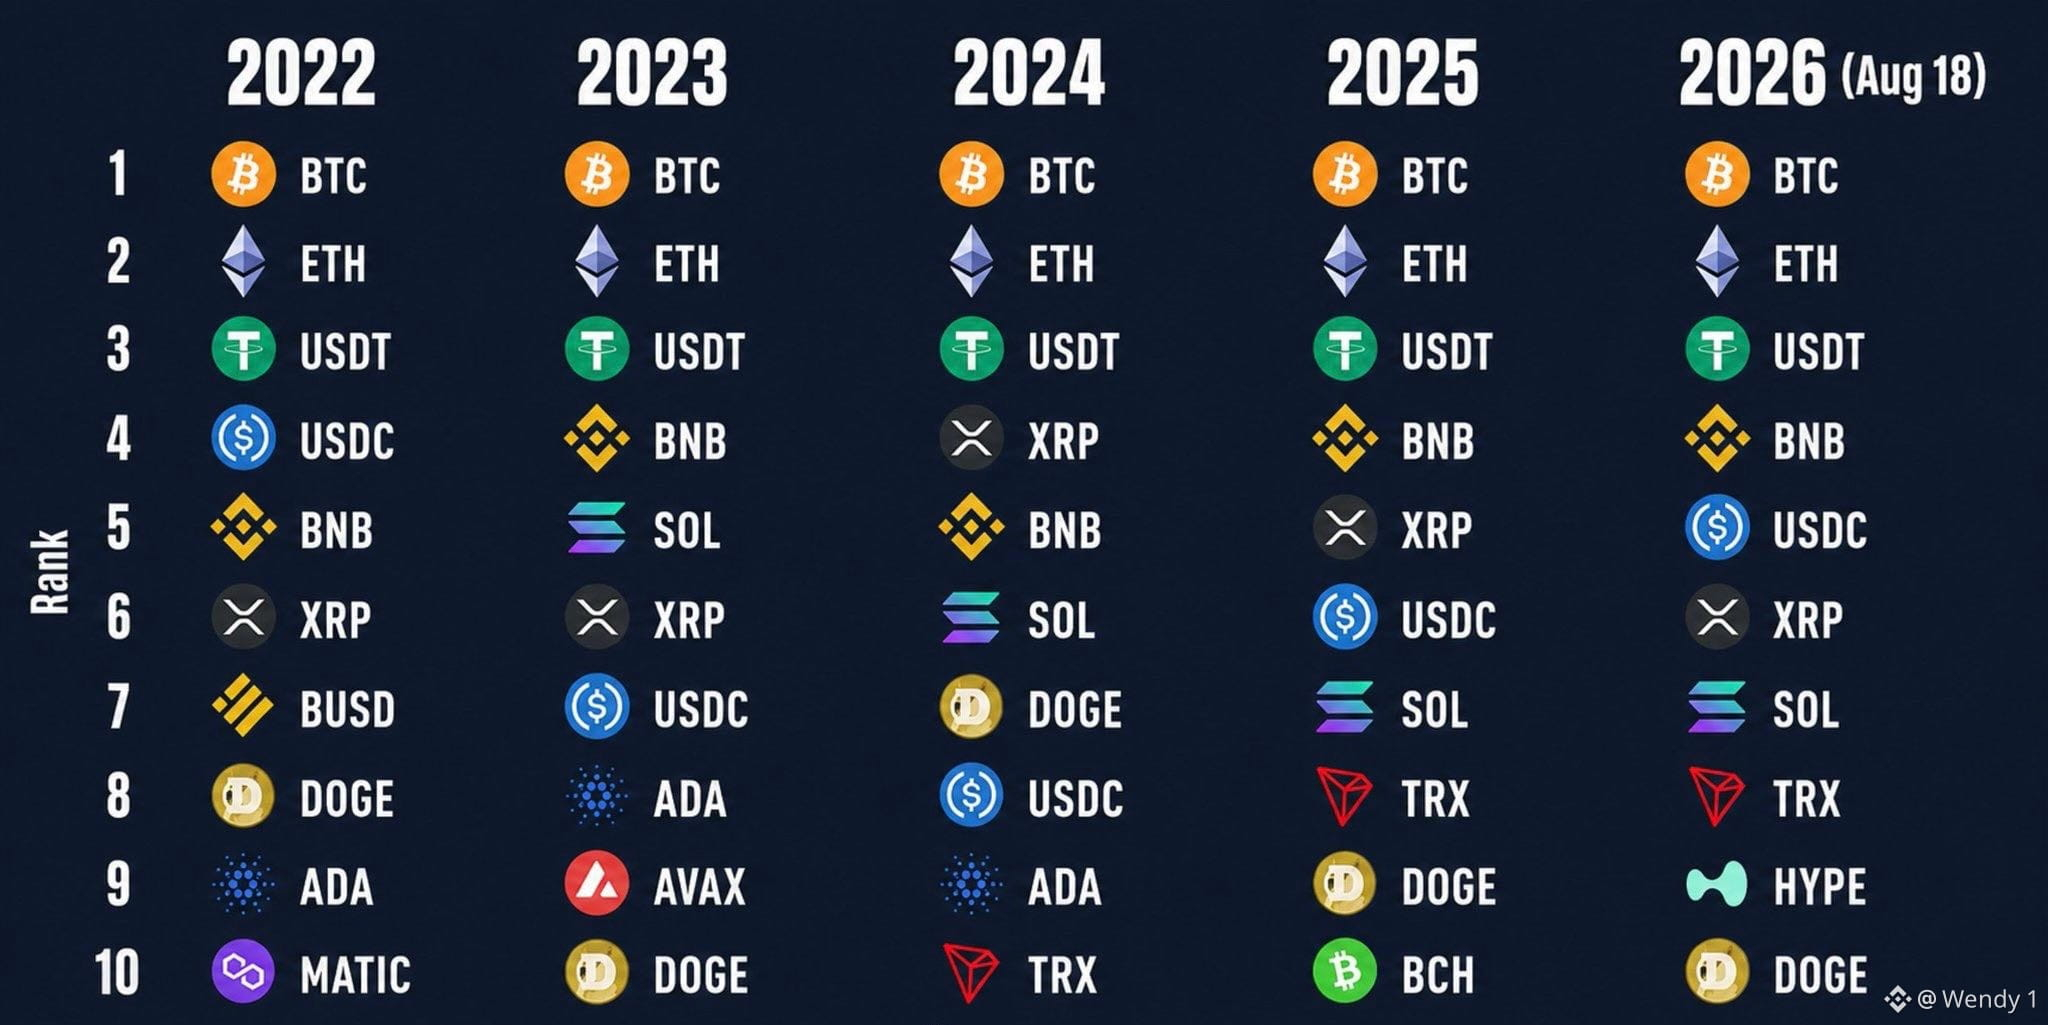
The Crypto Top 10 Has Changed, But Some Names Keep Surviving
Looking at the Top 10 crypto assets from 2022 to August 2026, one thing stands out:
Some projects come and go. Others keep showing up.
$BTC, $ETH and $USDT have remained in the Top 10 throughout the entire period shown.
Then there is another interesting group:
• $BNB appears in all 5 years
• $XRP appears in all 5 years
• $DOGE appears in 4 of the 5 years
• $SOL appears in 3 years
• $TRX and $ADA appear in 3 years
Meanwhile, $MATIC, $AVAX, $BCH and $HYPE appear only once in this snapshot.
That does not automatically tell us which token will perform best.
But it does show something worth paying attention to: survival matters.
Crypto narratives can change extremely quickly. A project can dominate attention for one cycle and disappear from the top ranks later.
Staying relevant through multiple market cycles is a different challenge.
So when evaluating an altcoin, I would not only ask:
“How much upside does it have?”
I would also ask:
“Can this project still be here in the next cycle?”
The Top 10 ranking is only one data point, but the historical persistence of these names is definitely worth watching.
The Crypto Top 10 Has Changed, But Some Names Keep Surviving
Looking at the Top 10 crypto assets from 2022 to August 2026, one thing stands out:
Some projects come and go. Others keep showing up.
$BTC, $ETH and $USDT have remained in the Top 10 throughout the entire period shown.
Then there is another interesting group:
• $BNB appears in all 5 years
• $XRP appears in all 5 years
• $DOGE appears in 4 of the 5 years
• $SOL appears in 3 years
• $TRX and $ADA appear in 3 years
Meanwhile, $MATIC, $AVAX, $BCH and $HYPE appear only once in this snapshot.
That does not automatically tell us which token will perform best.
But it does show something worth paying attention to: survival matters.
Crypto narratives can change extremely quickly. A project can dominate attention for one cycle and disappear from the top ranks later.
Staying relevant through multiple market cycles is a different challenge.
So when evaluating an altcoin, I would not only ask:
“How much upside does it have?”
I would also ask:
“Can this project still be here in the next cycle?”
The Top 10 ranking is only one data point, but the historical persistence of these names is definitely worth watching.
Looking at the Top 10 crypto assets from 2022 to August 2026, one thing stands out:
Some projects come and go. Others keep showing up.
$BTC, $ETH and $USDT have remained in the Top 10 throughout the entire period shown.
Then there is another interesting group:
• $BNB appears in all 5 years
• $XRP appears in all 5 years
• $DOGE appears in 4 of the 5 years
• $SOL appears in 3 years
• $TRX and $ADA appear in 3 years
Meanwhile, $MATIC, $AVAX, $BCH and $HYPE appear only once in this snapshot.
That does not automatically tell us which token will perform best.
But it does show something worth paying attention to: survival matters.
Crypto narratives can change extremely quickly. A project can dominate attention for one cycle and disappear from the top ranks later.
Staying relevant through multiple market cycles is a different challenge.
So when evaluating an altcoin, I would not only ask:
“How much upside does it have?”
I would also ask:
“Can this project still be here in the next cycle?”
The Top 10 ranking is only one data point, but the historical persistence of these names is definitely worth watching.
71
·
--
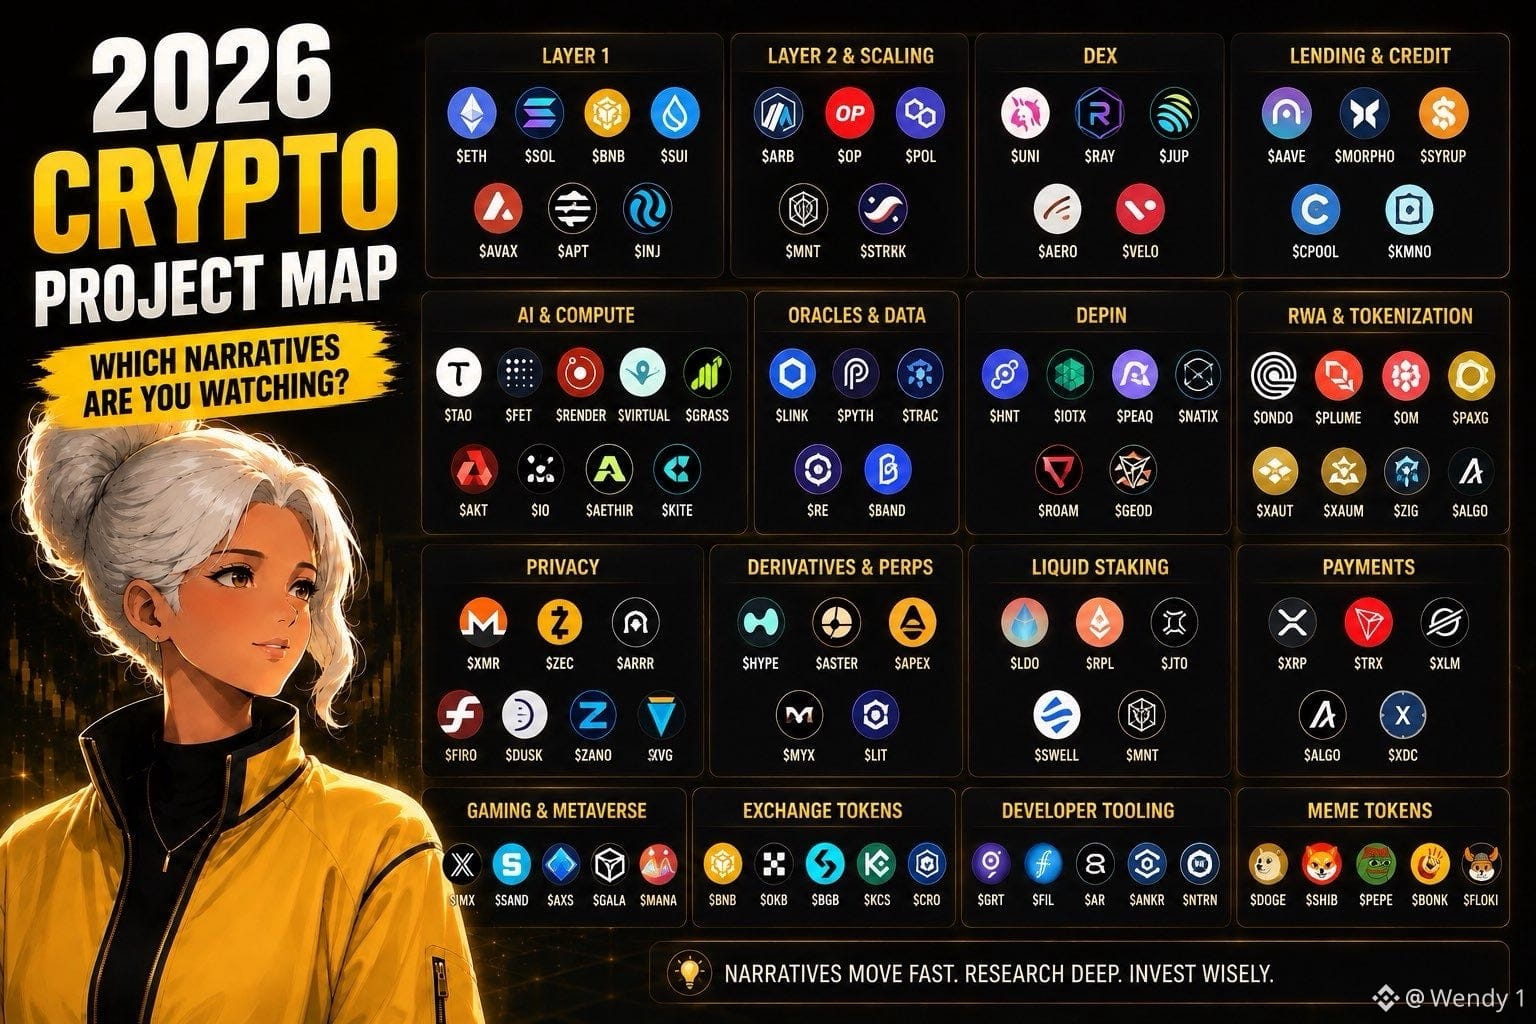
2026 Crypto Project Map: Which Narratives Are You Watching?
Crypto in 2026 is much bigger than just $BTC and $ETH.
This map gives a useful overview of the projects across the main sectors:
Layer 1: $ETH, $SOL, $BNB, $SUI, $AVAX, $APT, $INJ
Layer 2 & Scaling: $ARB, $OP, $POL, $MNT, $STRK
DEX: $UNI, $RAY, $JUP, $AERO, $VELO
Lending & Credit: $AAVE, $MORPHO, $SYRUP, $CPOOL, $KMNO
AI & Compute: $TAO, $FET, $RENDER, $VIRTUAL, $GRASS, $AKT, $IO, $AETHIR, $KITE
Oracles & Data: $LINK, $PYTH, $TRAC, $RE, $BAND
DePIN: $HNT, $IOTX, $PEAQ, $NATIX, $ROAM, $GEOD
RWA & Tokenization: $ONDO, $PLUME, $OM, $PAXG, $XAUT, $XAUM, $ZIG, $ALGO
Privacy: $XMR, $ZEC, $ARRR, $FIRO, $DUSK, $ZANO, $XVG
Derivatives & Perps: $HYPE, $ASTER, $APEX, $MYX, $LIT
There are also dedicated categories for Liquid Staking, Payments, Gaming & Metaverse, Exchange Tokens, Developer Tooling and Meme Tokens.
The useful part isn’t treating this as a list of tokens to buy.
It’s a way to step back and see where the major crypto narratives are developing, then do deeper research on the projects that actually have traction, adoption and sustainable token economics.
A strong narrative alone isn’t enough. The project still has to prove itself.
If you could pick only 3 sectors to watch for the rest of 2026, which ones would you choose?
Disclaimer: This is not financial advice. Please do your own research before making any investment decision.
2026 Crypto Project Map: Which Narratives Are You Watching?
Crypto in 2026 is much bigger than just $BTC and $ETH.
This map gives a useful overview of the projects across the main sectors:
Layer 1: $ETH, $SOL, $BNB, $SUI, $AVAX, $APT, $INJ
Layer 2 & Scaling: $ARB, $OP, $POL, $MNT, $STRK
DEX: $UNI, $RAY, $JUP, $AERO, $VELO
Lending & Credit: $AAVE, $MORPHO, $SYRUP, $CPOOL, $KMNO
AI & Compute: $TAO, $FET, $RENDER, $VIRTUAL, $GRASS, $AKT, $IO, $AETHIR, $KITE
Oracles & Data: $LINK, $PYTH, $TRAC, $RE, $BAND
DePIN: $HNT, $IOTX, $PEAQ, $NATIX, $ROAM, $GEOD
RWA & Tokenization: $ONDO, $PLUME, $OM, $PAXG, $XAUT, $XAUM, $ZIG, $ALGO
Privacy: $XMR, $ZEC, $ARRR, $FIRO, $DUSK, $ZANO, $XVG
Derivatives & Perps: $HYPE, $ASTER, $APEX, $MYX, $LIT
There are also dedicated categories for Liquid Staking, Payments, Gaming & Metaverse, Exchange Tokens, Developer Tooling and Meme Tokens.
The useful part isn’t treating this as a list of tokens to buy.
It’s a way to step back and see where the major crypto narratives are developing, then do deeper research on the projects that actually have traction, adoption and sustainable token economics.
A strong narrative alone isn’t enough. The project still has to prove itself.
If you could pick only 3 sectors to watch for the rest of 2026, which ones would you choose?
Disclaimer: This is not financial advice. Please do your own research before making any investment decision.
Crypto in 2026 is much bigger than just $BTC and $ETH.
This map gives a useful overview of the projects across the main sectors:
Layer 1: $ETH, $SOL, $BNB, $SUI, $AVAX, $APT, $INJ
Layer 2 & Scaling: $ARB, $OP, $POL, $MNT, $STRK
DEX: $UNI, $RAY, $JUP, $AERO, $VELO
Lending & Credit: $AAVE, $MORPHO, $SYRUP, $CPOOL, $KMNO
AI & Compute: $TAO, $FET, $RENDER, $VIRTUAL, $GRASS, $AKT, $IO, $AETHIR, $KITE
Oracles & Data: $LINK, $PYTH, $TRAC, $RE, $BAND
DePIN: $HNT, $IOTX, $PEAQ, $NATIX, $ROAM, $GEOD
RWA & Tokenization: $ONDO, $PLUME, $OM, $PAXG, $XAUT, $XAUM, $ZIG, $ALGO
Privacy: $XMR, $ZEC, $ARRR, $FIRO, $DUSK, $ZANO, $XVG
Derivatives & Perps: $HYPE, $ASTER, $APEX, $MYX, $LIT
There are also dedicated categories for Liquid Staking, Payments, Gaming & Metaverse, Exchange Tokens, Developer Tooling and Meme Tokens.
The useful part isn’t treating this as a list of tokens to buy.
It’s a way to step back and see where the major crypto narratives are developing, then do deeper research on the projects that actually have traction, adoption and sustainable token economics.
A strong narrative alone isn’t enough. The project still has to prove itself.
If you could pick only 3 sectors to watch for the rest of 2026, which ones would you choose?
Disclaimer: This is not financial advice. Please do your own research before making any investment decision.
5
·
--
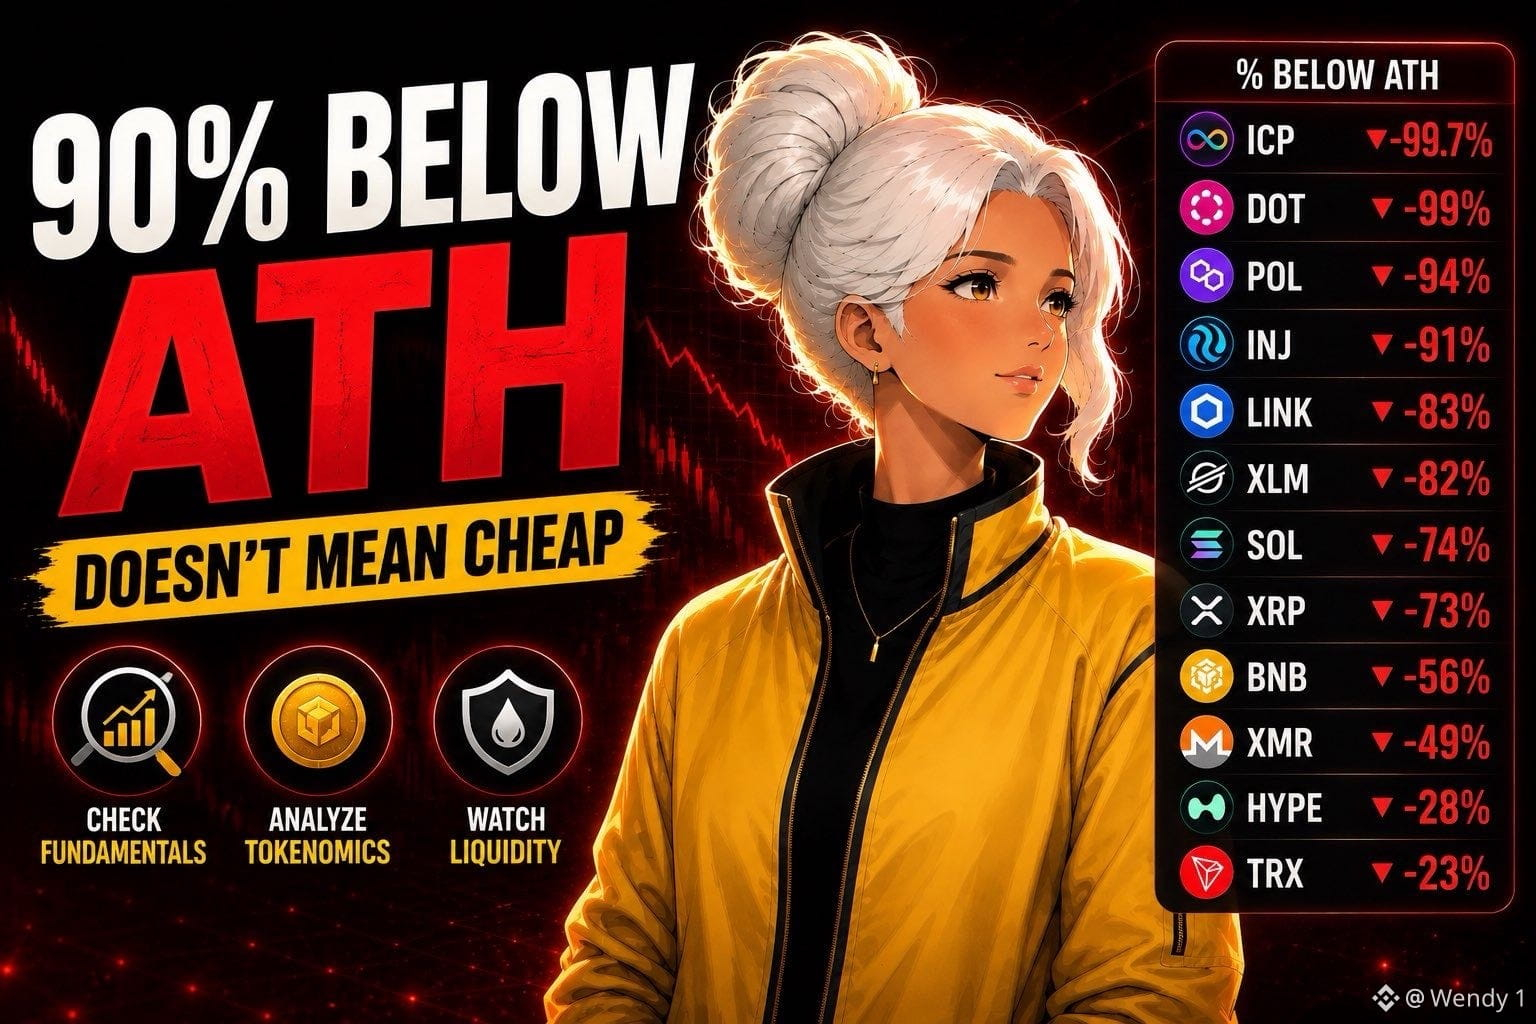
An altcoin being 90% below its ATH does not automatically mean it’s cheap.
The current distance from ATH is pretty extreme for some major tokens:
🔻 $ICP: -99.7%
🔻 $DOT: -99%
🔻 $POL: -94%
🔻 $INJ: -91%
🔻 $LINK: -83%
🔻 $XLM: -82%
🔻 $SOL: -74%
🔻 $XRP: -73%
🔻 $BNB: -56%
🔻 $XMR: -49%
🔻 $HYPE: -28%
🔻 $TRX: -23%
But there is an important distinction.
Being far below an ATH tells you how much an asset has fallen. It doesn’t tell you whether the asset is undervalued today.
For example, a token down 90% needs roughly a 900% gain just to return to its previous ATH.
So instead of looking at the drawdown alone, I’d check:
• Is the project still growing?
• Does the token still have real demand or utility?
• How does the current supply compare with upcoming unlocks?
• Is liquidity still healthy?
• Is price actually building a base, or still making lower lows?
The distance from ATH is a useful filter, but it shouldn’t be the investment thesis by itself.
Cheap and heavily discounted are not always the same thing.
Disclaimer: This is not financial advice. Crypto assets are highly volatile, so please do your own research before making investment decisions.
An altcoin being 90% below its ATH does not automatically mean it’s cheap.
The current distance from ATH is pretty extreme for some major tokens:
🔻 $ICP: -99.7%
🔻 $DOT: -99%
🔻 $POL: -94%
🔻 $INJ: -91%
🔻 $LINK: -83%
🔻 $XLM: -82%
🔻 $SOL: -74%
🔻 $XRP: -73%
🔻 $BNB: -56%
🔻 $XMR: -49%
🔻 $HYPE: -28%
🔻 $TRX: -23%
But there is an important distinction.
Being far below an ATH tells you how much an asset has fallen. It doesn’t tell you whether the asset is undervalued today.
For example, a token down 90% needs roughly a 900% gain just to return to its previous ATH.
So instead of looking at the drawdown alone, I’d check:
• Is the project still growing?
• Does the token still have real demand or utility?
• How does the current supply compare with upcoming unlocks?
• Is liquidity still healthy?
• Is price actually building a base, or still making lower lows?
The distance from ATH is a useful filter, but it shouldn’t be the investment thesis by itself.
Cheap and heavily discounted are not always the same thing.
Disclaimer: This is not financial advice. Crypto assets are highly volatile, so please do your own research before making investment decisions.
The current distance from ATH is pretty extreme for some major tokens:
🔻 $ICP: -99.7%
🔻 $DOT: -99%
🔻 $POL: -94%
🔻 $INJ: -91%
🔻 $LINK: -83%
🔻 $XLM: -82%
🔻 $SOL: -74%
🔻 $XRP: -73%
🔻 $BNB: -56%
🔻 $XMR: -49%
🔻 $HYPE: -28%
🔻 $TRX: -23%
But there is an important distinction.
Being far below an ATH tells you how much an asset has fallen. It doesn’t tell you whether the asset is undervalued today.
For example, a token down 90% needs roughly a 900% gain just to return to its previous ATH.
So instead of looking at the drawdown alone, I’d check:
• Is the project still growing?
• Does the token still have real demand or utility?
• How does the current supply compare with upcoming unlocks?
• Is liquidity still healthy?
• Is price actually building a base, or still making lower lows?
The distance from ATH is a useful filter, but it shouldn’t be the investment thesis by itself.
Cheap and heavily discounted are not always the same thing.
Disclaimer: This is not financial advice. Crypto assets are highly volatile, so please do your own research before making investment decisions.
31
·
--
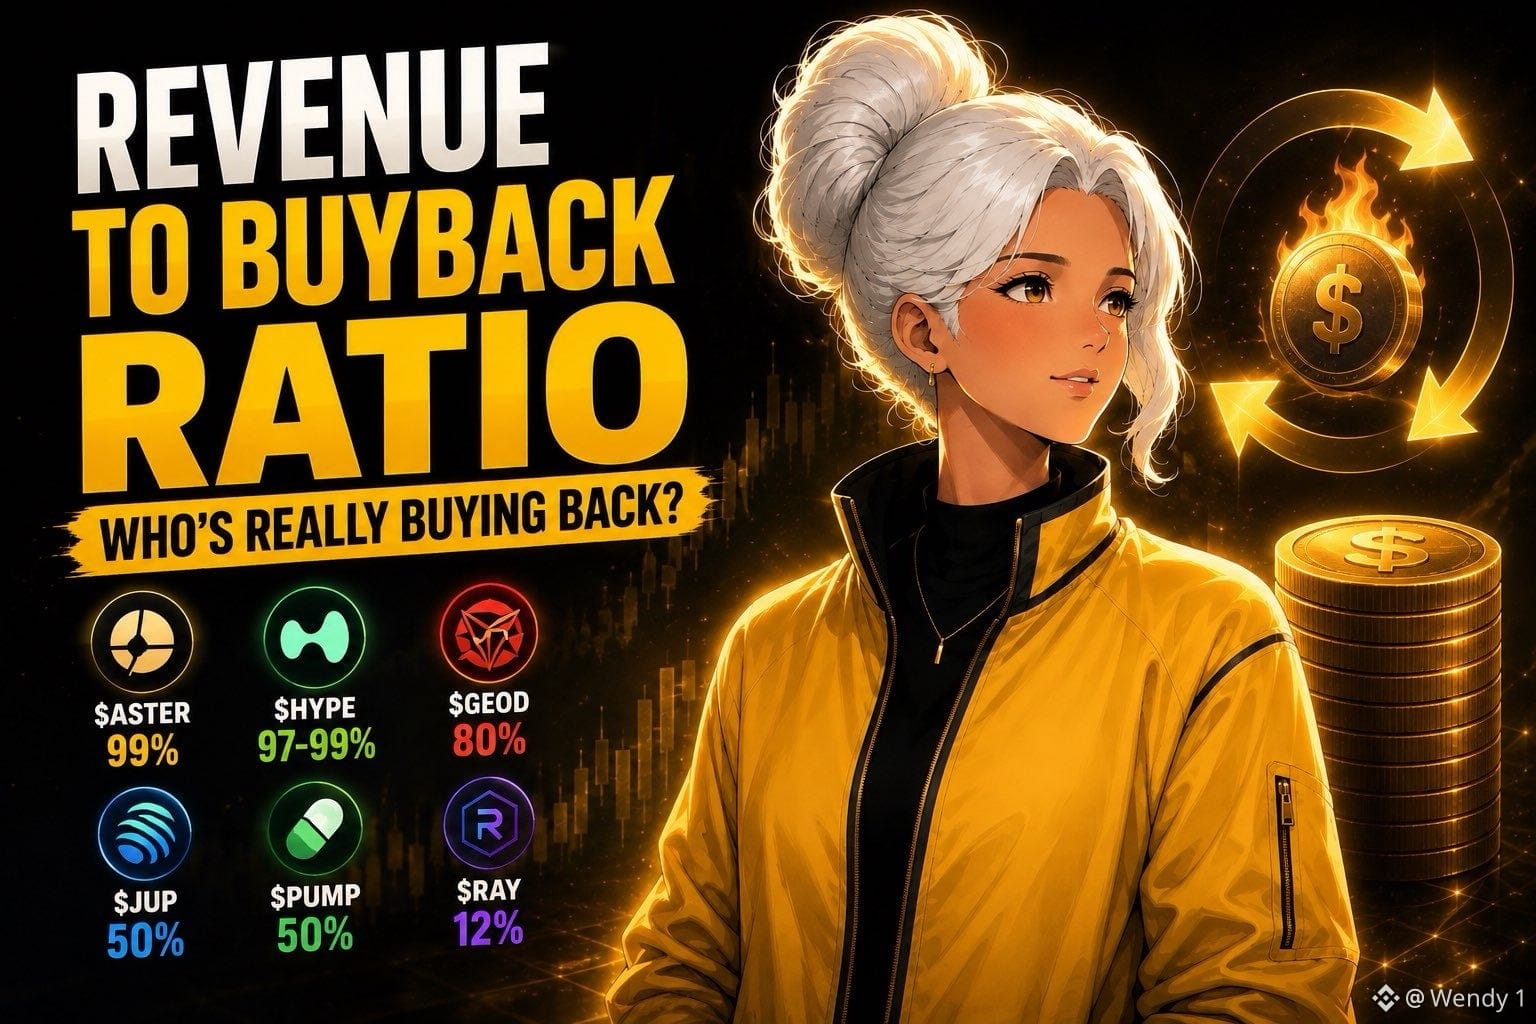
A high buyback ratio sounds great. But where does the money actually come from?
That is where the revenue-to-buyback ratio becomes useful.
It measures how much of a project’s actual revenue is directed toward buying back and burning its own token.
Here is how several projects compare:
🔥 $ASTER: 99%
🟢 $HYPE: 97% to 99%
🔴 $GEOD: 80%
🔵 $JUP: 50%
🟢 $PUMP: 50%
🟣 $RAY: 12%
At first glance, $ASTER and $HYPE stand out because most of their revenue is allocated toward buybacks and burns.
But there is an important catch.
The ratio alone doesn’t tell you how strong the buyback actually is.
A project can allocate 99% of revenue to buybacks, but if revenue falls, the actual dollar amount going into the market can shrink too.
Meanwhile, a project with a lower percentage but much larger revenue could potentially generate larger buybacks in absolute terms.
So before calling any model a winner, I would check three things:
1. Is revenue actually growing?
2. Are the announced buybacks being executed on-chain?
3. Are burns keeping up with new token issuance?
The percentage is a useful starting filter.
The real test is whether actual revenue keeps flowing back into the token, consistently and on-chain.
Disclaimer: This is not financial advice. Please do your own research before making investment decisions.
A high buyback ratio sounds great. But where does the money actually come from?
That is where the revenue-to-buyback ratio becomes useful.
It measures how much of a project’s actual revenue is directed toward buying back and burning its own token.
Here is how several projects compare:
🔥 $ASTER: 99%
🟢 $HYPE: 97% to 99%
🔴 $GEOD: 80%
🔵 $JUP: 50%
🟢 $PUMP: 50%
🟣 $RAY: 12%
At first glance, $ASTER and $HYPE stand out because most of their revenue is allocated toward buybacks and burns.
But there is an important catch.
The ratio alone doesn’t tell you how strong the buyback actually is.
A project can allocate 99% of revenue to buybacks, but if revenue falls, the actual dollar amount going into the market can shrink too.
Meanwhile, a project with a lower percentage but much larger revenue could potentially generate larger buybacks in absolute terms.
So before calling any model a winner, I would check three things:
1. Is revenue actually growing?
2. Are the announced buybacks being executed on-chain?
3. Are burns keeping up with new token issuance?
The percentage is a useful starting filter.
The real test is whether actual revenue keeps flowing back into the token, consistently and on-chain.
Disclaimer: This is not financial advice. Please do your own research before making investment decisions.
That is where the revenue-to-buyback ratio becomes useful.
It measures how much of a project’s actual revenue is directed toward buying back and burning its own token.
Here is how several projects compare:
🔥 $ASTER: 99%
🟢 $HYPE: 97% to 99%
🔴 $GEOD: 80%
🔵 $JUP: 50%
🟢 $PUMP: 50%
🟣 $RAY: 12%
At first glance, $ASTER and $HYPE stand out because most of their revenue is allocated toward buybacks and burns.
But there is an important catch.
The ratio alone doesn’t tell you how strong the buyback actually is.
A project can allocate 99% of revenue to buybacks, but if revenue falls, the actual dollar amount going into the market can shrink too.
Meanwhile, a project with a lower percentage but much larger revenue could potentially generate larger buybacks in absolute terms.
So before calling any model a winner, I would check three things:
1. Is revenue actually growing?
2. Are the announced buybacks being executed on-chain?
3. Are burns keeping up with new token issuance?
The percentage is a useful starting filter.
The real test is whether actual revenue keeps flowing back into the token, consistently and on-chain.
Disclaimer: This is not financial advice. Please do your own research before making investment decisions.
33
·
--
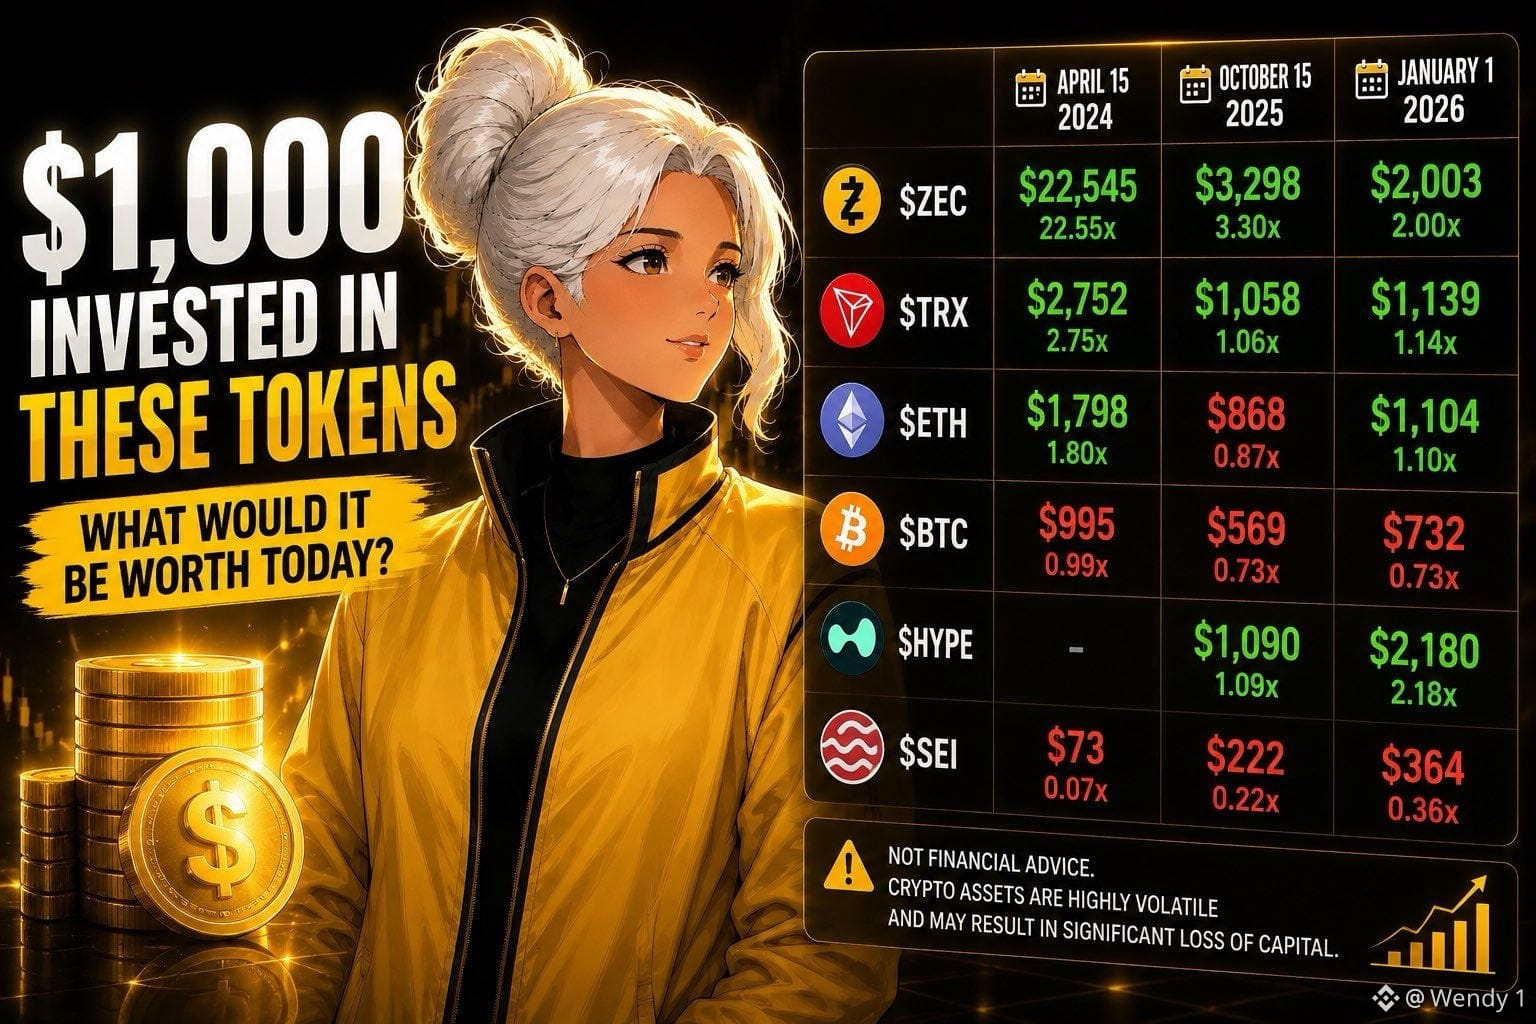
$1,000 Invested in These Tokens: What Would It Be Worth Today?
Same $1,000.
Very different results, depending on when you bought.
The chart compares three entry dates:
📅 April 15, 2024
📅 October 15, 2025
📅 January 1, 2026
A few results stand out.
$ZEC is the biggest outlier.
A $1,000 investment from April 2024 would be worth $22,545, or 22.55x.
$TRX is the most consistent winner.
All three entry points are still profitable:
2.75x from April 2024
1.06x from October 2025
1.14x from January 2026
Then there is $HYPE.
It wasn’t trading in April 2024, but a $1,000 investment from October 2025 would now be $1,090, while the January 2026 entry would be worth $2,180.
On the other side, $SEI has struggled across every entry point:
$73 from April 2024
$222 from October 2025
$364 from January 2026
Even $BTC isn’t immune to bad timing. The April 2024 entry is almost flat at $995, while the October 2025 and January 2026 entries are down to $569 and $732.
The bigger lesson here isn’t simply which token performed best.
Entry timing can completely change the outcome.
A strong project bought near a peak can still produce a painful loss, while a later entry into the same asset can look completely different.
Sometimes “Is this a good token?” isn’t enough.
The better question is:
“Where am I buying it in the cycle?”
Disclaimer: This is not financial advice. Crypto assets are highly volatile and may result in significant loss of capital.
#Crypto #BTC #ETH #ZEC #TRX
$1,000 Invested in These Tokens: What Would It Be Worth Today?
Same $1,000.
Very different results, depending on when you bought.
The chart compares three entry dates:
📅 April 15, 2024
📅 October 15, 2025
📅 January 1, 2026
A few results stand out.
$ZEC is the biggest outlier.
A $1,000 investment from April 2024 would be worth $22,545, or 22.55x.
$TRX is the most consistent winner.
All three entry points are still profitable:
2.75x from April 2024
1.06x from October 2025
1.14x from January 2026
Then there is $HYPE.
It wasn’t trading in April 2024, but a $1,000 investment from October 2025 would now be $1,090, while the January 2026 entry would be worth $2,180.
On the other side, $SEI has struggled across every entry point:
$73 from April 2024
$222 from October 2025
$364 from January 2026
Even $BTC isn’t immune to bad timing. The April 2024 entry is almost flat at $995, while the October 2025 and January 2026 entries are down to $569 and $732.
The bigger lesson here isn’t simply which token performed best.
Entry timing can completely change the outcome.
A strong project bought near a peak can still produce a painful loss, while a later entry into the same asset can look completely different.
Sometimes “Is this a good token?” isn’t enough.
The better question is:
“Where am I buying it in the cycle?”
Disclaimer: This is not financial advice. Crypto assets are highly volatile and may result in significant loss of capital.
#Crypto #BTC #ETH #ZEC #TRX
Same $1,000.
Very different results, depending on when you bought.
The chart compares three entry dates:
📅 April 15, 2024
📅 October 15, 2025
📅 January 1, 2026
A few results stand out.
$ZEC is the biggest outlier.
A $1,000 investment from April 2024 would be worth $22,545, or 22.55x.
$TRX is the most consistent winner.
All three entry points are still profitable:
2.75x from April 2024
1.06x from October 2025
1.14x from January 2026
Then there is $HYPE.
It wasn’t trading in April 2024, but a $1,000 investment from October 2025 would now be $1,090, while the January 2026 entry would be worth $2,180.
On the other side, $SEI has struggled across every entry point:
$73 from April 2024
$222 from October 2025
$364 from January 2026
Even $BTC isn’t immune to bad timing. The April 2024 entry is almost flat at $995, while the October 2025 and January 2026 entries are down to $569 and $732.
The bigger lesson here isn’t simply which token performed best.
Entry timing can completely change the outcome.
A strong project bought near a peak can still produce a painful loss, while a later entry into the same asset can look completely different.
Sometimes “Is this a good token?” isn’t enough.
The better question is:
“Where am I buying it in the cycle?”
Disclaimer: This is not financial advice. Crypto assets are highly volatile and may result in significant loss of capital.
#Crypto #BTC #ETH #ZEC #TRX
43
·
--
7 Token Unlocks to Watch This Week
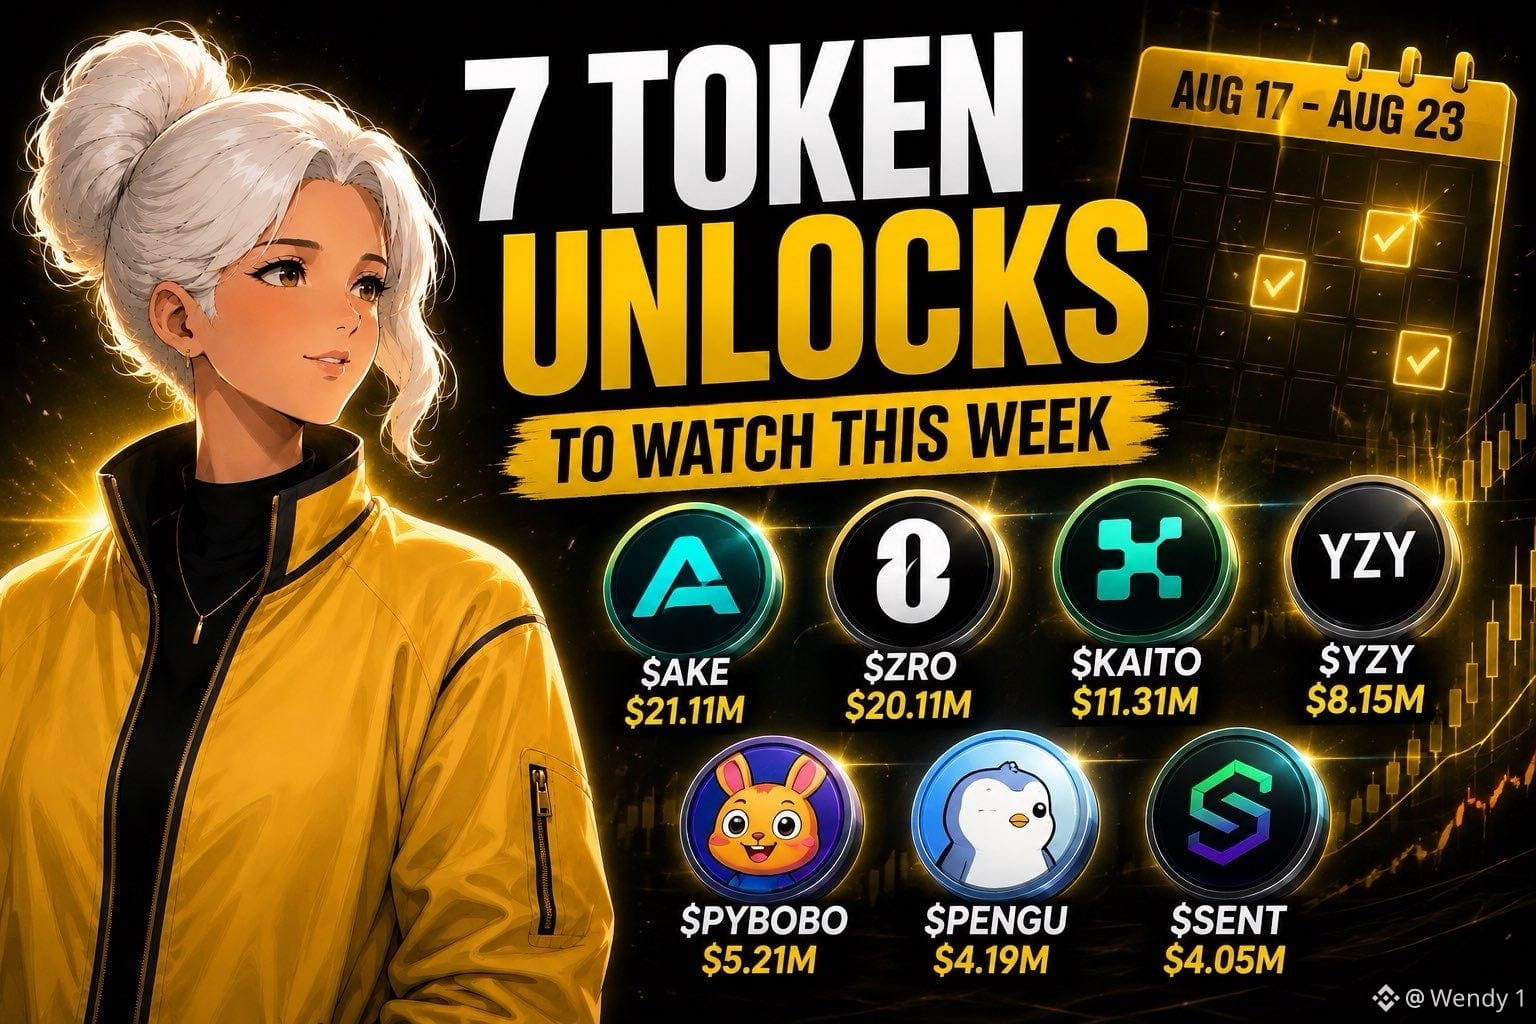
Token unlocks can quietly change the supply picture, and this week’s list has a few numbers worth watching.
Between August 17 and August 23, these seven tokens have the largest unlock values in the CryptoRank data:
• $AKE: $21.11M
• $ZRO: $20.11M
• $KAITO: $11.31M
• $YZY: $8.15M
• $PYBOBO: $5.21M
• $PENGU: $4.19M
• $SENT: $4.05M
The more interesting number isn’t always the dollar value.
For $KAITO, the scheduled unlock is worth about 13.5% of its current market cap according to the chart. That’s a much larger supply event relative to its market size than the headline $11.31M might suggest.
$AKE follows at 9.25%, while $ZRO is at 7.28%.
The timing is spread across the week:
$PENGU unlocks on August 17.
$ZRO and $KAITO follow on August 20.
$AKE, $YZY and $PYBOBO unlock on August 21.
$SENT follows on August 22.
An unlock does not automatically mean a token will sell off. The actual impact depends on who receives the tokens, whether they sell, and how much demand is available at the time.
Still, for anyone holding these assets, supply entering the market is worth keeping on the radar.
Disclaimer: This is not financial advice. Please check the project’s official tokenomics and unlock schedule before trading.
#Crypto #TokenUnlock #KAITO
7 Token Unlocks to Watch This Week
Token unlocks can quietly change the supply picture, and this week’s list has a few numbers worth watching.
Between August 17 and August 23, these seven tokens have the largest unlock values in the CryptoRank data:
• $AKE: $21.11M
• $ZRO: $20.11M
• $KAITO: $11.31M
• $YZY: $8.15M
• $PYBOBO: $5.21M
• $PENGU: $4.19M
• $SENT: $4.05M
The more interesting number isn’t always the dollar value.
For $KAITO, the scheduled unlock is worth about 13.5% of its current market cap according to the chart. That’s a much larger supply event relative to its market size than the headline $11.31M might suggest.
$AKE follows at 9.25%, while $ZRO is at 7.28%.
The timing is spread across the week:
$PENGU unlocks on August 17.
$ZRO and $KAITO follow on August 20.
$AKE, $YZY and $PYBOBO unlock on August 21.
$SENT follows on August 22.
An unlock does not automatically mean a token will sell off. The actual impact depends on who receives the tokens, whether they sell, and how much demand is available at the time.
Still, for anyone holding these assets, supply entering the market is worth keeping on the radar.
Disclaimer: This is not financial advice. Please check the project’s official tokenomics and unlock schedule before trading.
#Crypto #TokenUnlock #KAITO
Token unlocks can quietly change the supply picture, and this week’s list has a few numbers worth watching.
Between August 17 and August 23, these seven tokens have the largest unlock values in the CryptoRank data:
• $AKE: $21.11M
• $ZRO: $20.11M
• $KAITO: $11.31M
• $YZY: $8.15M
• $PYBOBO: $5.21M
• $PENGU: $4.19M
• $SENT: $4.05M
The more interesting number isn’t always the dollar value.
For $KAITO, the scheduled unlock is worth about 13.5% of its current market cap according to the chart. That’s a much larger supply event relative to its market size than the headline $11.31M might suggest.
$AKE follows at 9.25%, while $ZRO is at 7.28%.
The timing is spread across the week:
$PENGU unlocks on August 17.
$ZRO and $KAITO follow on August 20.
$AKE, $YZY and $PYBOBO unlock on August 21.
$SENT follows on August 22.
An unlock does not automatically mean a token will sell off. The actual impact depends on who receives the tokens, whether they sell, and how much demand is available at the time.
Still, for anyone holding these assets, supply entering the market is worth keeping on the radar.
Disclaimer: This is not financial advice. Please check the project’s official tokenomics and unlock schedule before trading.
#Crypto #TokenUnlock #KAITO
46
·
--
Only 7 people in Vietnam received this recognition. And I'm one of them. 🥹💛
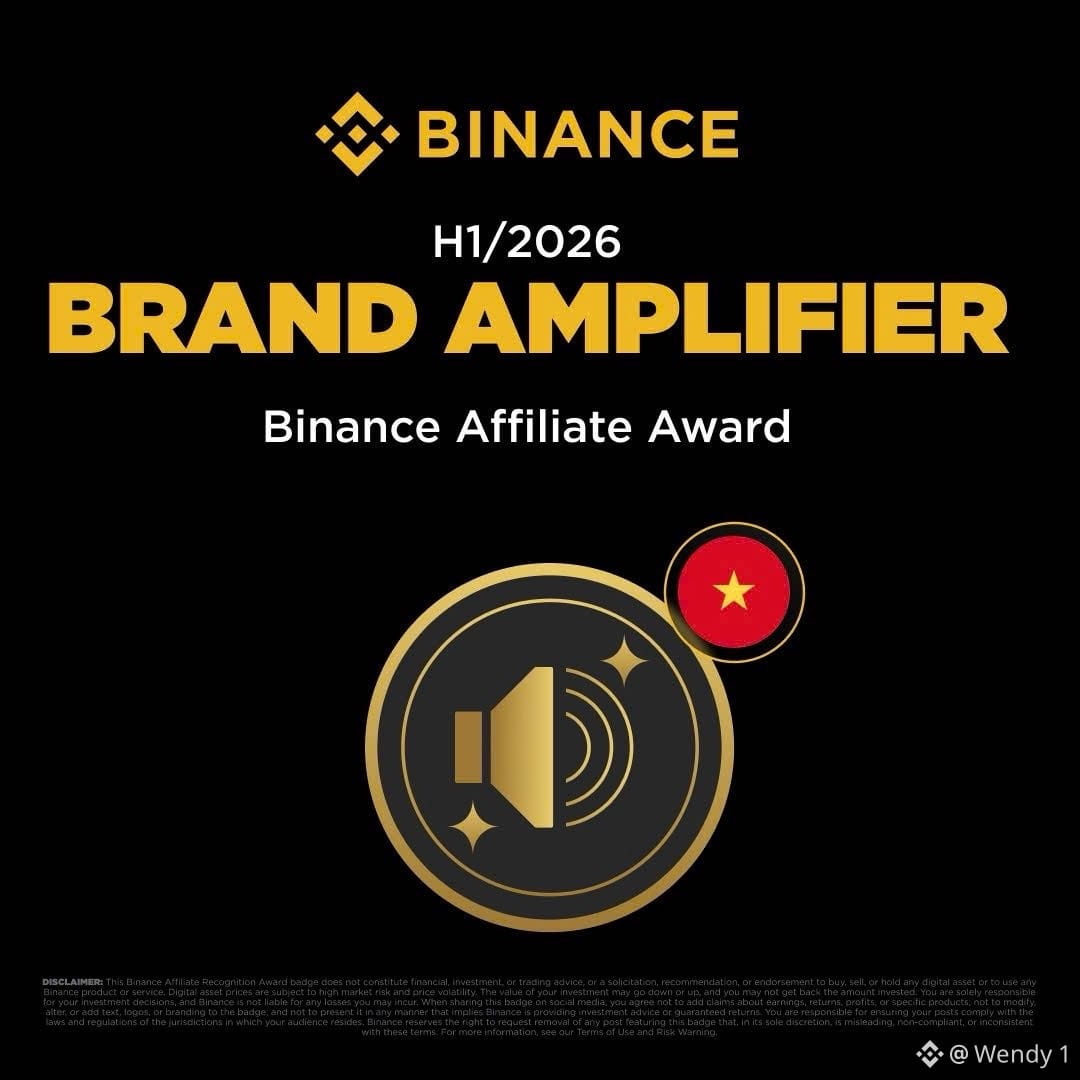
I’m very happy to share that I’ve been selected as a winner of the Binance Vietnam H1/2026 Affiliate Recognition Program, receiving the Brand Amplifier award.
According to my Binance Affiliate Manager, only 7 affiliates in Vietnam were selected for this recognition.
Honestly, this means a lot to me.
Over the past months, I’ve spent a lot of time creating content around Binance, from product updates and Binance P2P to different topics I believe are useful for the crypto community.
Some posts take only a few minutes to read, but quite a bit of time goes into researching and putting them together.
I never started creating content expecting an award.
So seeing Binance recognize that effort with the Brand Amplifier award feels really special.
The award recognizes affiliates who create quality Binance content across social platforms and help amplify the Binance brand within the Vietnamese crypto community.
I’m truly grateful for that.
Thank you to Binance, my Affiliate Manager, and everyone who has been reading my posts, leaving comments, sharing feedback, or simply following along.
This recognition wouldn't mean the same without the community behind it. ❤️
There’s also a little surprise mentioned in the award package.
Binance included 10 swag items for new-user giveaways.
I’m still waiting for the details on how I’ll receive them.
But if those 10 gifts are indeed for a community giveaway...
I already have an idea of what I want to do with them. 👀🎁
Stay tuned.
$BNB #Binance #BNBChain
Only 7 people in Vietnam received this recognition. And I'm one of them. 🥹💛
I’m very happy to share that I’ve been selected as a winner of the Binance Vietnam H1/2026 Affiliate Recognition Program, receiving the Brand Amplifier award.
According to my Binance Affiliate Manager, only 7 affiliates in Vietnam were selected for this recognition.
Honestly, this means a lot to me.
Over the past months, I’ve spent a lot of time creating content around Binance, from product updates and Binance P2P to different topics I believe are useful for the crypto community.
Some posts take only a few minutes to read, but quite a bit of time goes into researching and putting them together.
I never started creating content expecting an award.
So seeing Binance recognize that effort with the Brand Amplifier award feels really special.
The award recognizes affiliates who create quality Binance content across social platforms and help amplify the Binance brand within the Vietnamese crypto community.
I’m truly grateful for that.
Thank you to Binance, my Affiliate Manager, and everyone who has been reading my posts, leaving comments, sharing feedback, or simply following along.
This recognition wouldn't mean the same without the community behind it. ❤️
There’s also a little surprise mentioned in the award package.
Binance included 10 swag items for new-user giveaways.
I’m still waiting for the details on how I’ll receive them.
But if those 10 gifts are indeed for a community giveaway...
I already have an idea of what I want to do with them. 👀🎁
Stay tuned.
$BNB #Binance #BNBChain
I’m very happy to share that I’ve been selected as a winner of the Binance Vietnam H1/2026 Affiliate Recognition Program, receiving the Brand Amplifier award.
According to my Binance Affiliate Manager, only 7 affiliates in Vietnam were selected for this recognition.
Honestly, this means a lot to me.
Over the past months, I’ve spent a lot of time creating content around Binance, from product updates and Binance P2P to different topics I believe are useful for the crypto community.
Some posts take only a few minutes to read, but quite a bit of time goes into researching and putting them together.
I never started creating content expecting an award.
So seeing Binance recognize that effort with the Brand Amplifier award feels really special.
The award recognizes affiliates who create quality Binance content across social platforms and help amplify the Binance brand within the Vietnamese crypto community.
I’m truly grateful for that.
Thank you to Binance, my Affiliate Manager, and everyone who has been reading my posts, leaving comments, sharing feedback, or simply following along.
This recognition wouldn't mean the same without the community behind it. ❤️
There’s also a little surprise mentioned in the award package.
Binance included 10 swag items for new-user giveaways.
I’m still waiting for the details on how I’ll receive them.
But if those 10 gifts are indeed for a community giveaway...
I already have an idea of what I want to do with them. 👀🎁
Stay tuned.
$BNB #Binance #BNBChain
114
·
--
A BitMart User Says They Can’t Withdraw $10.1M. What We Know
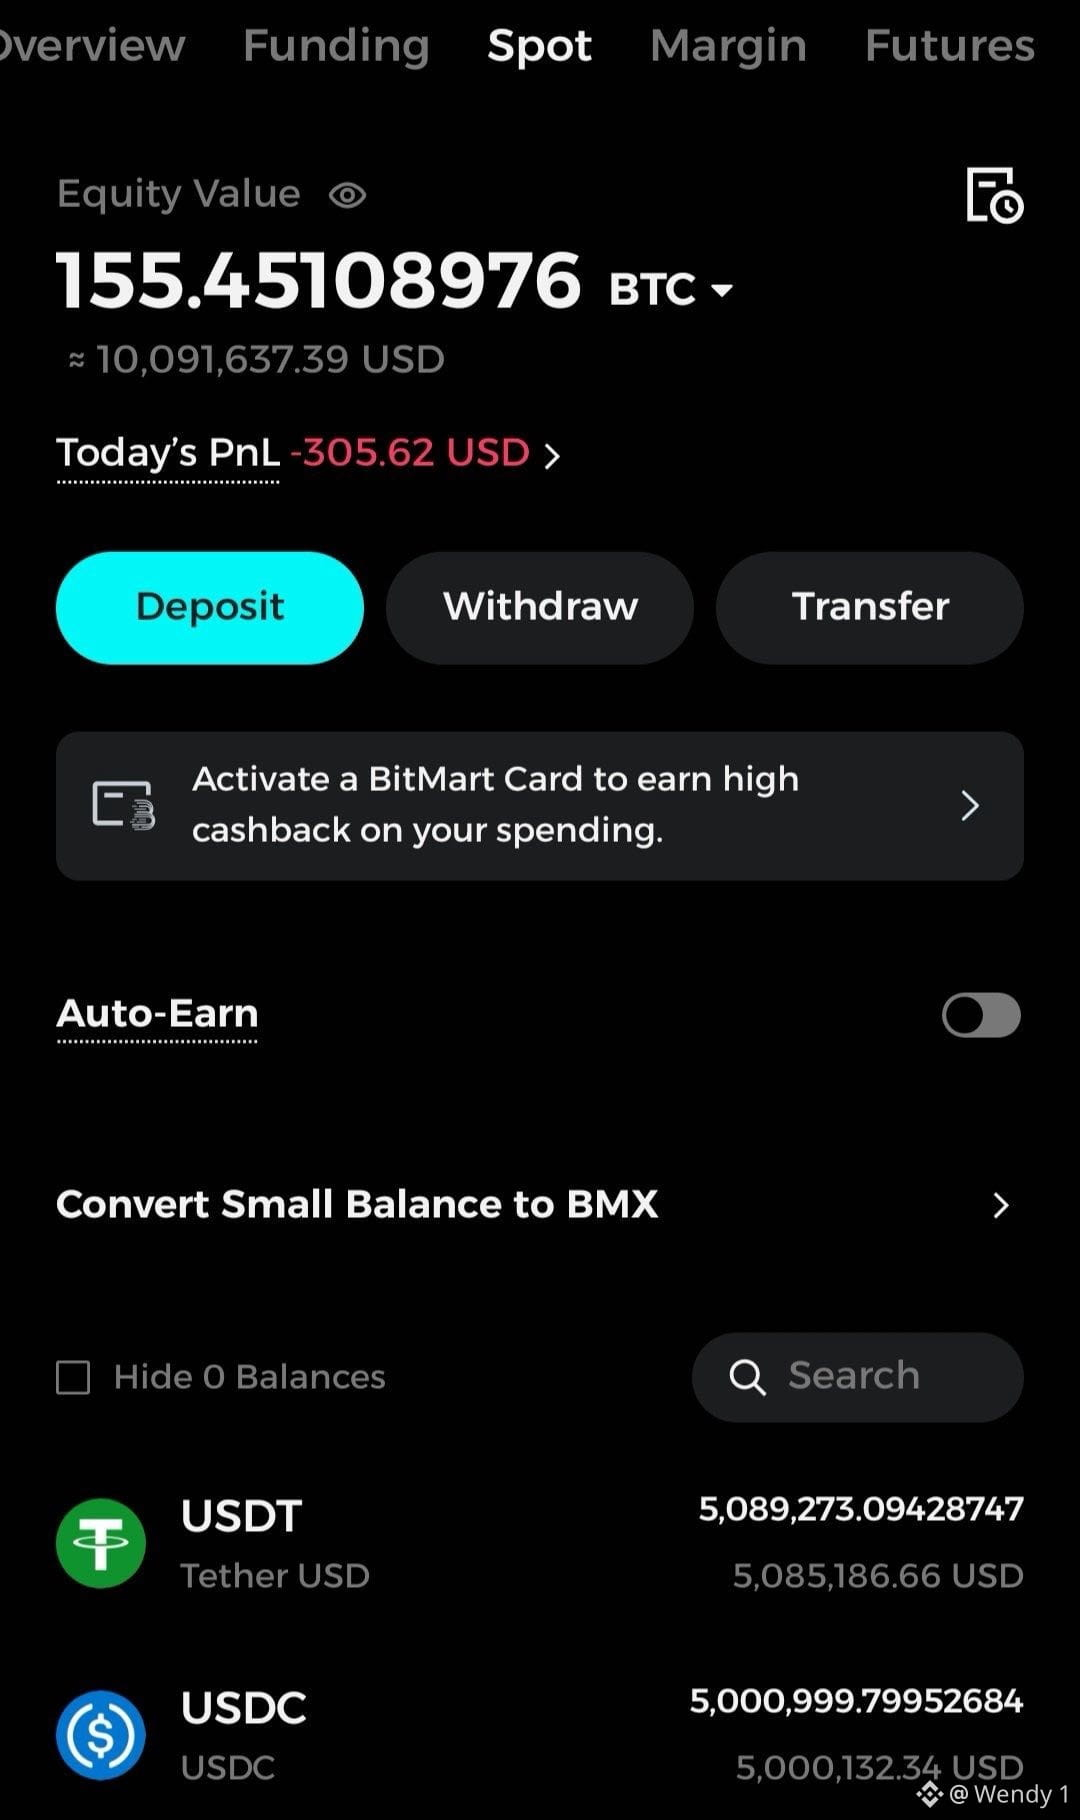
A BitMart user has publicly raised questions about withdrawals after claiming they have been unable to withdraw funds since July 26.
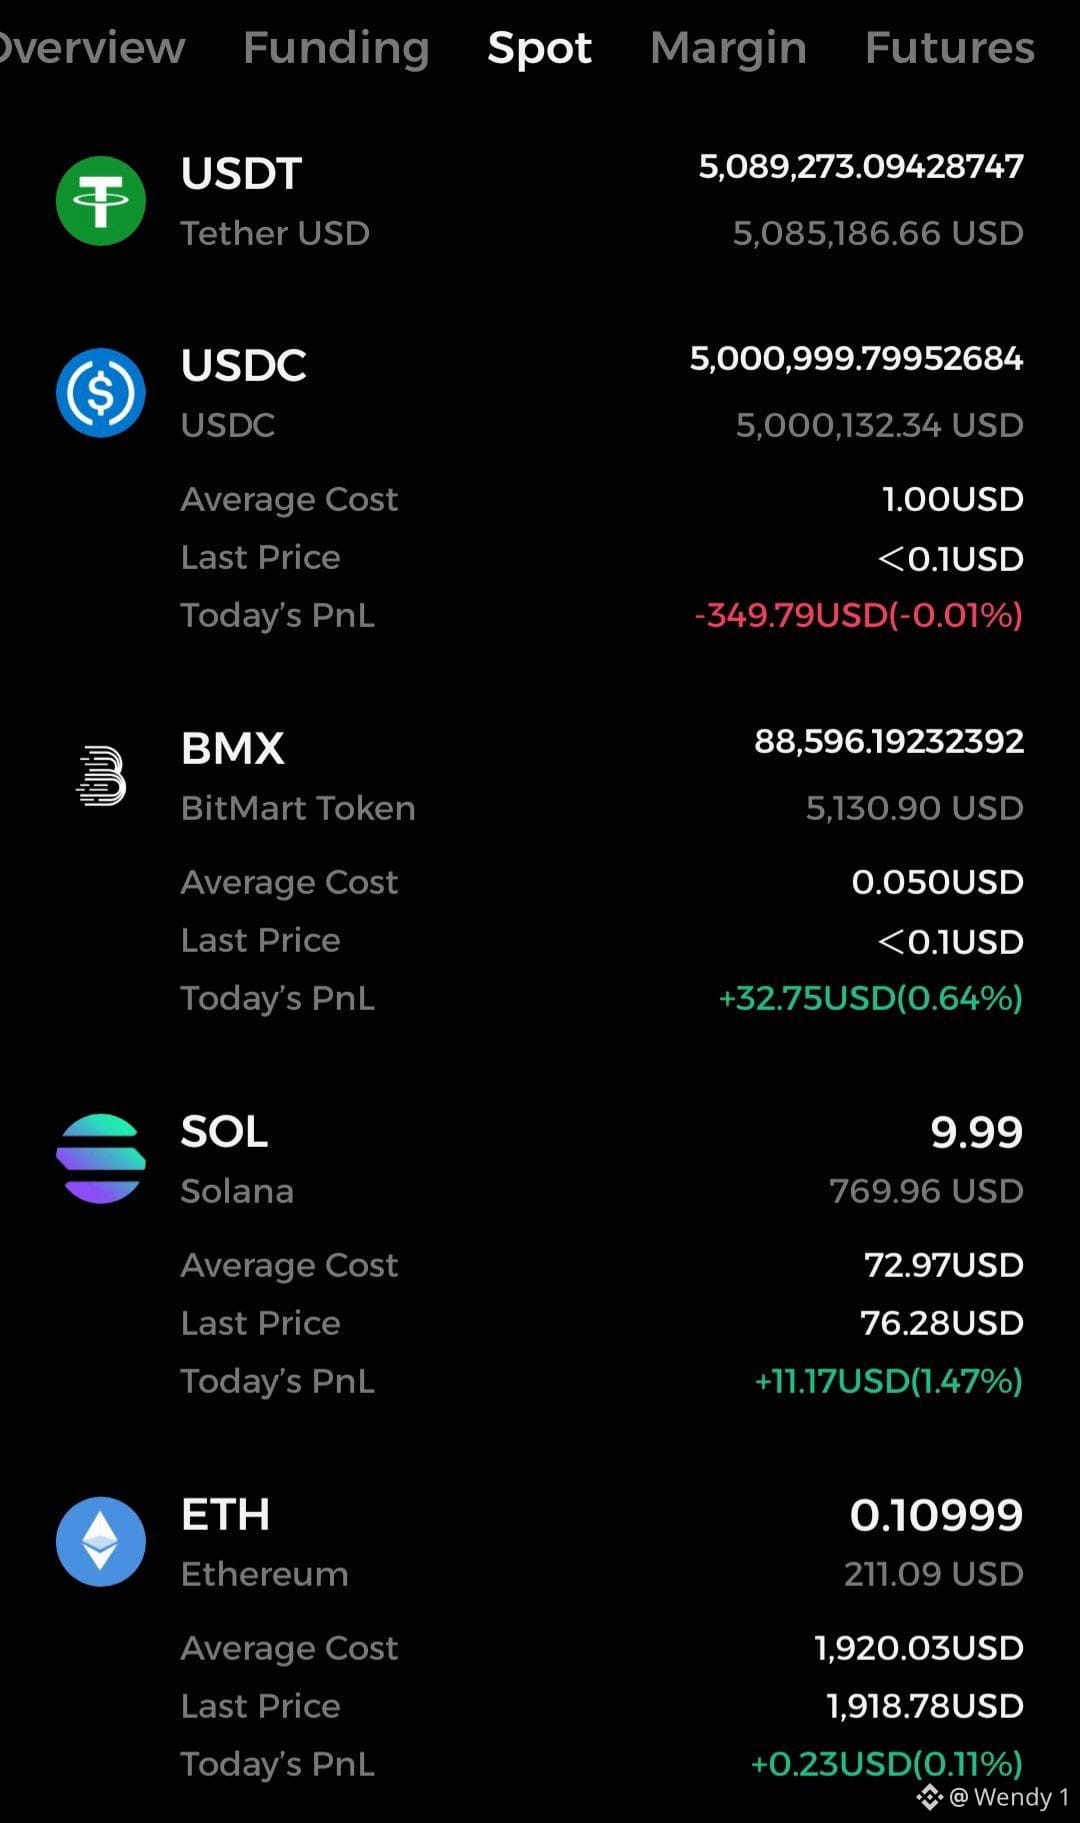
According to the post and screenshots shared by the user, their account previously held around $10.1 million, including:
* 155.45 BTC, worth roughly $10.09M in the screenshot
* 5.09M USDT
* 5.00M USDC
* Several smaller crypto positions
The user also claims that their BitMart VIP manager, identified as Tony, deleted his Telegram account on July 26, while other team members allegedly disappeared or deleted their accounts as well.
There is an important distinction here.
These are claims made by the user. The screenshots do not, by themselves, prove that BitMart has lost, frozen, or misappropriated customer funds.
But if withdrawals are indeed being delayed for a significant number of users, the situation deserves a clear explanation.
The questions are straightforward:
Why are withdrawals not being processed?
Where are the affected users’ funds?
And when can customers expect access to their money?
For a centralized exchange, withdrawal transparency matters just as much as trading features. Silence only makes users more concerned when their funds are involved.
Source: user-submitted post and screenshots. The claims have not been independently verified here.
#BitMart #Crypto #Bitcoin #USDT
A BitMart User Says They Can’t Withdraw $10.1M. What We Know
A BitMart user has publicly raised questions about withdrawals after claiming they have been unable to withdraw funds since July 26.
According to the post and screenshots shared by the user, their account previously held around $10.1 million, including:
* 155.45 BTC, worth roughly $10.09M in the screenshot
* 5.09M USDT
* 5.00M USDC
* Several smaller crypto positions
The user also claims that their BitMart VIP manager, identified as Tony, deleted his Telegram account on July 26, while other team members allegedly disappeared or deleted their accounts as well.
There is an important distinction here.
These are claims made by the user. The screenshots do not, by themselves, prove that BitMart has lost, frozen, or misappropriated customer funds.
But if withdrawals are indeed being delayed for a significant number of users, the situation deserves a clear explanation.
The questions are straightforward:
Why are withdrawals not being processed?
Where are the affected users’ funds?
And when can customers expect access to their money?
For a centralized exchange, withdrawal transparency matters just as much as trading features. Silence only makes users more concerned when their funds are involved.
Source: user-submitted post and screenshots. The claims have not been independently verified here.
#BitMart #Crypto #Bitcoin #USDT
A BitMart user has publicly raised questions about withdrawals after claiming they have been unable to withdraw funds since July 26.
According to the post and screenshots shared by the user, their account previously held around $10.1 million, including:
* 155.45 BTC, worth roughly $10.09M in the screenshot
* 5.09M USDT
* 5.00M USDC
* Several smaller crypto positions
The user also claims that their BitMart VIP manager, identified as Tony, deleted his Telegram account on July 26, while other team members allegedly disappeared or deleted their accounts as well.
There is an important distinction here.
These are claims made by the user. The screenshots do not, by themselves, prove that BitMart has lost, frozen, or misappropriated customer funds.
But if withdrawals are indeed being delayed for a significant number of users, the situation deserves a clear explanation.
The questions are straightforward:
Why are withdrawals not being processed?
Where are the affected users’ funds?
And when can customers expect access to their money?
For a centralized exchange, withdrawal transparency matters just as much as trading features. Silence only makes users more concerned when their funds are involved.
Source: user-submitted post and screenshots. The claims have not been independently verified here.
#BitMart #Crypto #Bitcoin #USDT
58
·
--
The Top 5 Cryptos by Market Cap Right Now
The gap between the biggest crypto assets is still pretty wide.
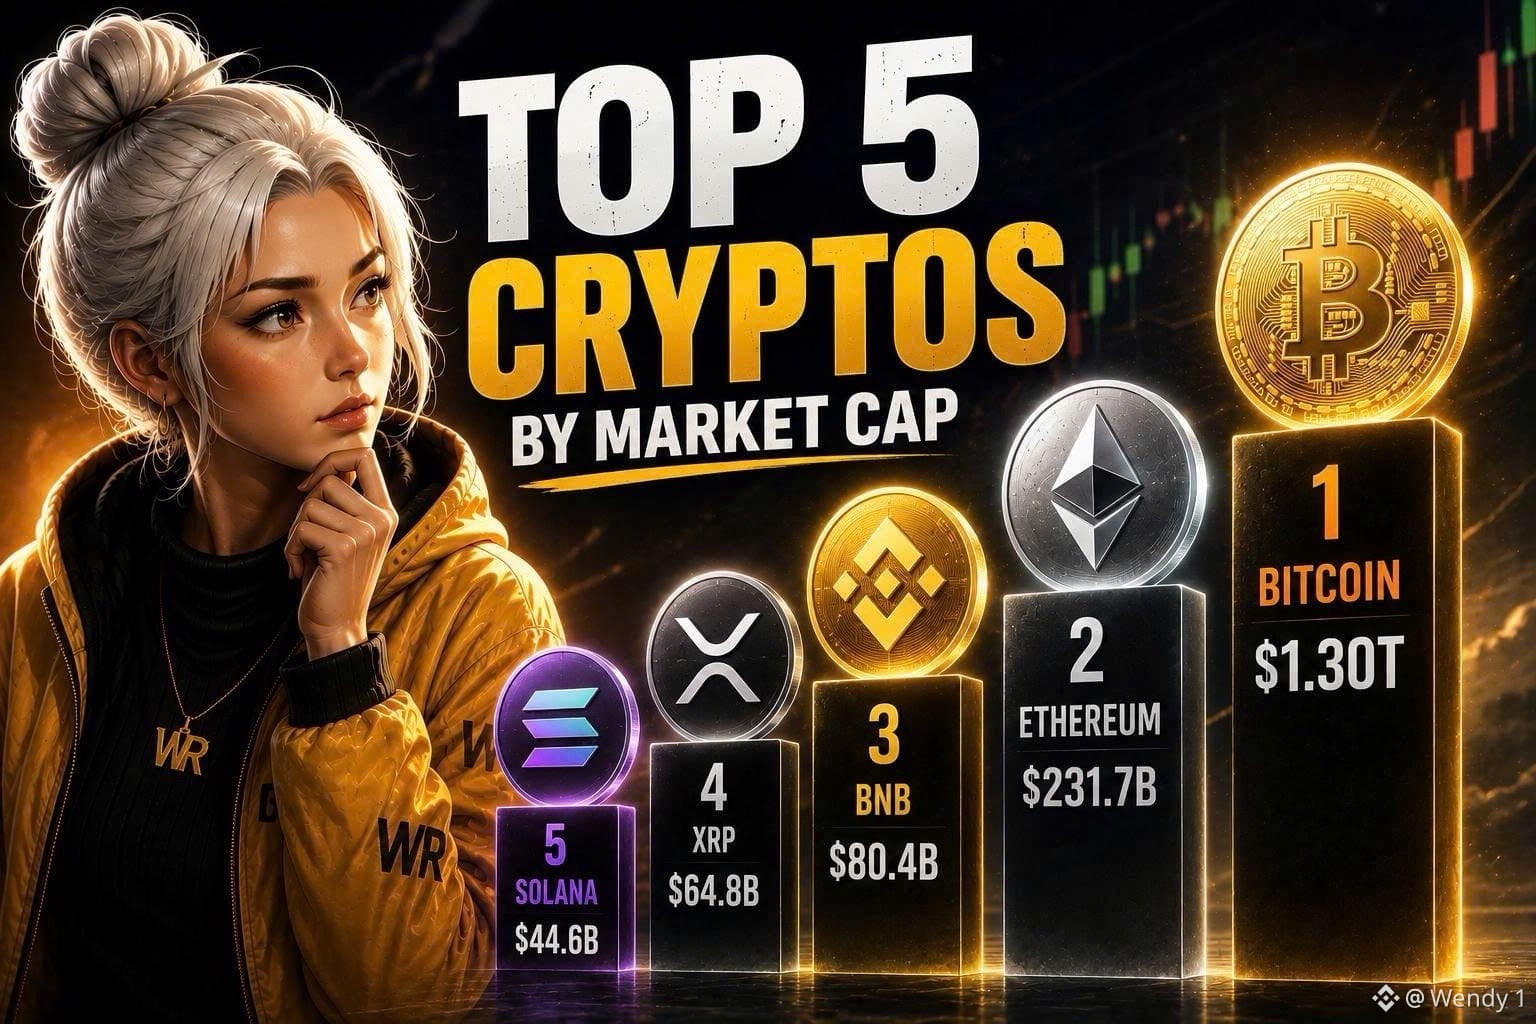
Here are the current top five by market capitalization:
🟠 Bitcoin: $1.30T
⚪ Ethereum: $231.7B
🟡 BNB: $80.4B
⚫ XRP: $64.8B
🟣 Solana: $44.6B
Bitcoin is still in a league of its own.
Its market cap is now more than 5x Ethereum’s, while ETH has a sizeable lead over the rest of the top five.
The closer race is further down the list.
BNB currently ranks third at $80.4B, followed by XRP at $64.8B and Solana at $44.6B.
These rankings can change quickly, though. Market cap moves with price, and a relatively small shift in the larger assets can reshape the order below them.
The interesting question isn’t just who’s in the top five today.
It’s which asset could move up the fastest from here?
Market cap figures provided in the source data.
#Bitcoin #Ethereum #BNB #XRP
The Top 5 Cryptos by Market Cap Right Now
The gap between the biggest crypto assets is still pretty wide.
Here are the current top five by market capitalization:
🟠 Bitcoin: $1.30T
⚪ Ethereum: $231.7B
🟡 BNB: $80.4B
⚫ XRP: $64.8B
🟣 Solana: $44.6B
Bitcoin is still in a league of its own.
Its market cap is now more than 5x Ethereum’s, while ETH has a sizeable lead over the rest of the top five.
The closer race is further down the list.
BNB currently ranks third at $80.4B, followed by XRP at $64.8B and Solana at $44.6B.
These rankings can change quickly, though. Market cap moves with price, and a relatively small shift in the larger assets can reshape the order below them.
The interesting question isn’t just who’s in the top five today.
It’s which asset could move up the fastest from here?
Market cap figures provided in the source data.
#Bitcoin #Ethereum #BNB #XRP
The gap between the biggest crypto assets is still pretty wide.
Here are the current top five by market capitalization:
🟠 Bitcoin: $1.30T
⚪ Ethereum: $231.7B
🟡 BNB: $80.4B
⚫ XRP: $64.8B
🟣 Solana: $44.6B
Bitcoin is still in a league of its own.
Its market cap is now more than 5x Ethereum’s, while ETH has a sizeable lead over the rest of the top five.
The closer race is further down the list.
BNB currently ranks third at $80.4B, followed by XRP at $64.8B and Solana at $44.6B.
These rankings can change quickly, though. Market cap moves with price, and a relatively small shift in the larger assets can reshape the order below them.
The interesting question isn’t just who’s in the top five today.
It’s which asset could move up the fastest from here?
Market cap figures provided in the source data.
#Bitcoin #Ethereum #BNB #XRP
71
·
--
Binance bStocks Is Pulling Ahead in Tokenized Stocks
The tokenized stock market has been growing, but the distribution of that growth is starting to look interesting.
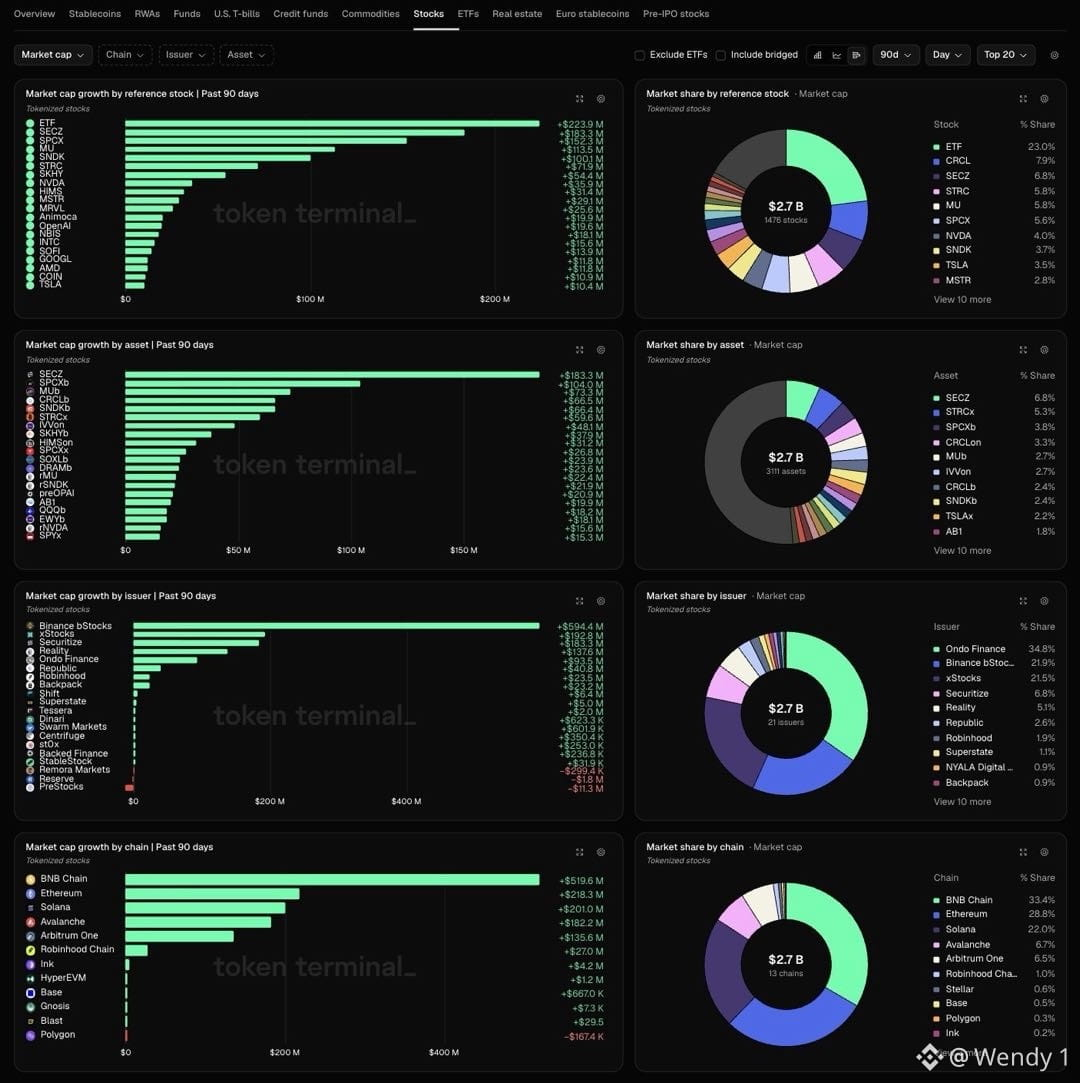
Over the past 90 days, Binance bStocks added $594.4 million in market cap, putting it well ahead of several other major platforms.
For comparison:
* xStocks: +$192.8M
* Securitize: +$183.3M
* Reality: +$137.6M
Then there’s the blockchain side.
BNB Chain added $519.6 million in tokenized stock market cap over the same period.
Ethereum added $218.3M, while Solana added $201.0M.
That gap is hard to ignore.
It suggests the growth of tokenized stocks isn’t happening evenly across chains. Binance bStocks is gaining market cap quickly, while BNB Chain is also taking a large share of the growth among the networks tracked here.
For me, the interesting question isn’t simply whether tokenized stocks will keep growing.
It’s where that growth will settle.
If more issuers and users continue choosing BNB Chain, the competition in tokenized equities could eventually become as much about liquidity and distribution as it is about the stocks themselves.
Source: Token Terminal.
Binance bStocks Is Pulling Ahead in Tokenized Stocks
The tokenized stock market has been growing, but the distribution of that growth is starting to look interesting.
Over the past 90 days, Binance bStocks added $594.4 million in market cap, putting it well ahead of several other major platforms.
For comparison:
* xStocks: +$192.8M
* Securitize: +$183.3M
* Reality: +$137.6M
Then there’s the blockchain side.
BNB Chain added $519.6 million in tokenized stock market cap over the same period.
Ethereum added $218.3M, while Solana added $201.0M.
That gap is hard to ignore.
It suggests the growth of tokenized stocks isn’t happening evenly across chains. Binance bStocks is gaining market cap quickly, while BNB Chain is also taking a large share of the growth among the networks tracked here.
For me, the interesting question isn’t simply whether tokenized stocks will keep growing.
It’s where that growth will settle.
If more issuers and users continue choosing BNB Chain, the competition in tokenized equities could eventually become as much about liquidity and distribution as it is about the stocks themselves.
Source: Token Terminal.
The tokenized stock market has been growing, but the distribution of that growth is starting to look interesting.
Over the past 90 days, Binance bStocks added $594.4 million in market cap, putting it well ahead of several other major platforms.
For comparison:
* xStocks: +$192.8M
* Securitize: +$183.3M
* Reality: +$137.6M
Then there’s the blockchain side.
BNB Chain added $519.6 million in tokenized stock market cap over the same period.
Ethereum added $218.3M, while Solana added $201.0M.
That gap is hard to ignore.
It suggests the growth of tokenized stocks isn’t happening evenly across chains. Binance bStocks is gaining market cap quickly, while BNB Chain is also taking a large share of the growth among the networks tracked here.
For me, the interesting question isn’t simply whether tokenized stocks will keep growing.
It’s where that growth will settle.
If more issuers and users continue choosing BNB Chain, the competition in tokenized equities could eventually become as much about liquidity and distribution as it is about the stocks themselves.
Source: Token Terminal.
52
·
--
X Is Changing How Creators Earn. Original Content Now Matters More. X has introduced its Original Content Rewards Program, while closing new enrollment for the existing Revenue Sharing program. At first glance, this looks like another creator monetization update. I think the bigger change is in what X is actually trying to reward. The new program puts more weight on original ideas, analysis, reporting, expertise, commentary, creativity, and personal perspective. Simply reposting someone else's content and adding a short caption is not enough. That distinction matters. X specifically says that minor edits, descriptive summaries, attribution, simple text overlays, or low-value reactions generally don't count as meaningful transformation. If the main value still comes from someone else's content, the post may not qualify as original. For creators who want to qualify, the main requirements include: • At least 500 verified followers • At least 500,000 Home Timeline impressions from verified users in the last 90 days • An X Premium, Premium+ or Premium Business subscription • A Personal or Business account in good standing • Regularly posting original content Eligible creators earn from qualified impressions, which are unique impressions from Premium users on the Home Timeline where at least 50% of the post is visible. Payments are scheduled every two weeks. There is also a clear shift for existing Revenue Sharing creators. Revenue Sharing earnings continue through September 7, 2026, with access to apply for Original Content Rewards rolling out from September 8. But the part I find most useful is much simpler: Before posting, ask yourself what you're actually adding. If the post would be just as valuable without your contribution, there probably isn't enough of your own perspective in it yet. That changes the creator game a little. The goal is no longer just to find something people will click on. You need to give them a reason to stay for your take.
X Is Changing How Creators Earn. Original Content Now Matters More. X has introduced its Original Content Rewards Program, while closing new enrollment for the existing Revenue Sharing program. At first glance, this looks like another creator monetization update. I think the bigger change is in what X is actually trying to reward. The new program puts more weight on original ideas, analysis, reporting, expertise, commentary, creativity, and personal perspective. Simply reposting someone else's content and adding a short caption is not enough. That distinction matters. X specifically says that minor edits, descriptive summaries, attribution, simple text overlays, or low-value reactions generally don't count as meaningful transformation. If the main value still comes from someone else's content, the post may not qualify as original. For creators who want to qualify, the main requirements include: • At least 500 verified followers • At least 500,000 Home Timeline impressions from verified users in the last 90 days • An X Premium, Premium+ or Premium Business subscription • A Personal or Business account in good standing • Regularly posting original content Eligible creators earn from qualified impressions, which are unique impressions from Premium users on the Home Timeline where at least 50% of the post is visible. Payments are scheduled every two weeks. There is also a clear shift for existing Revenue Sharing creators. Revenue Sharing earnings continue through September 7, 2026, with access to apply for Original Content Rewards rolling out from September 8. But the part I find most useful is much simpler: Before posting, ask yourself what you're actually adding. If the post would be just as valuable without your contribution, there probably isn't enough of your own perspective in it yet. That changes the creator game a little. The goal is no longer just to find something people will click on. You need to give them a reason to stay for your take.
72
·
--
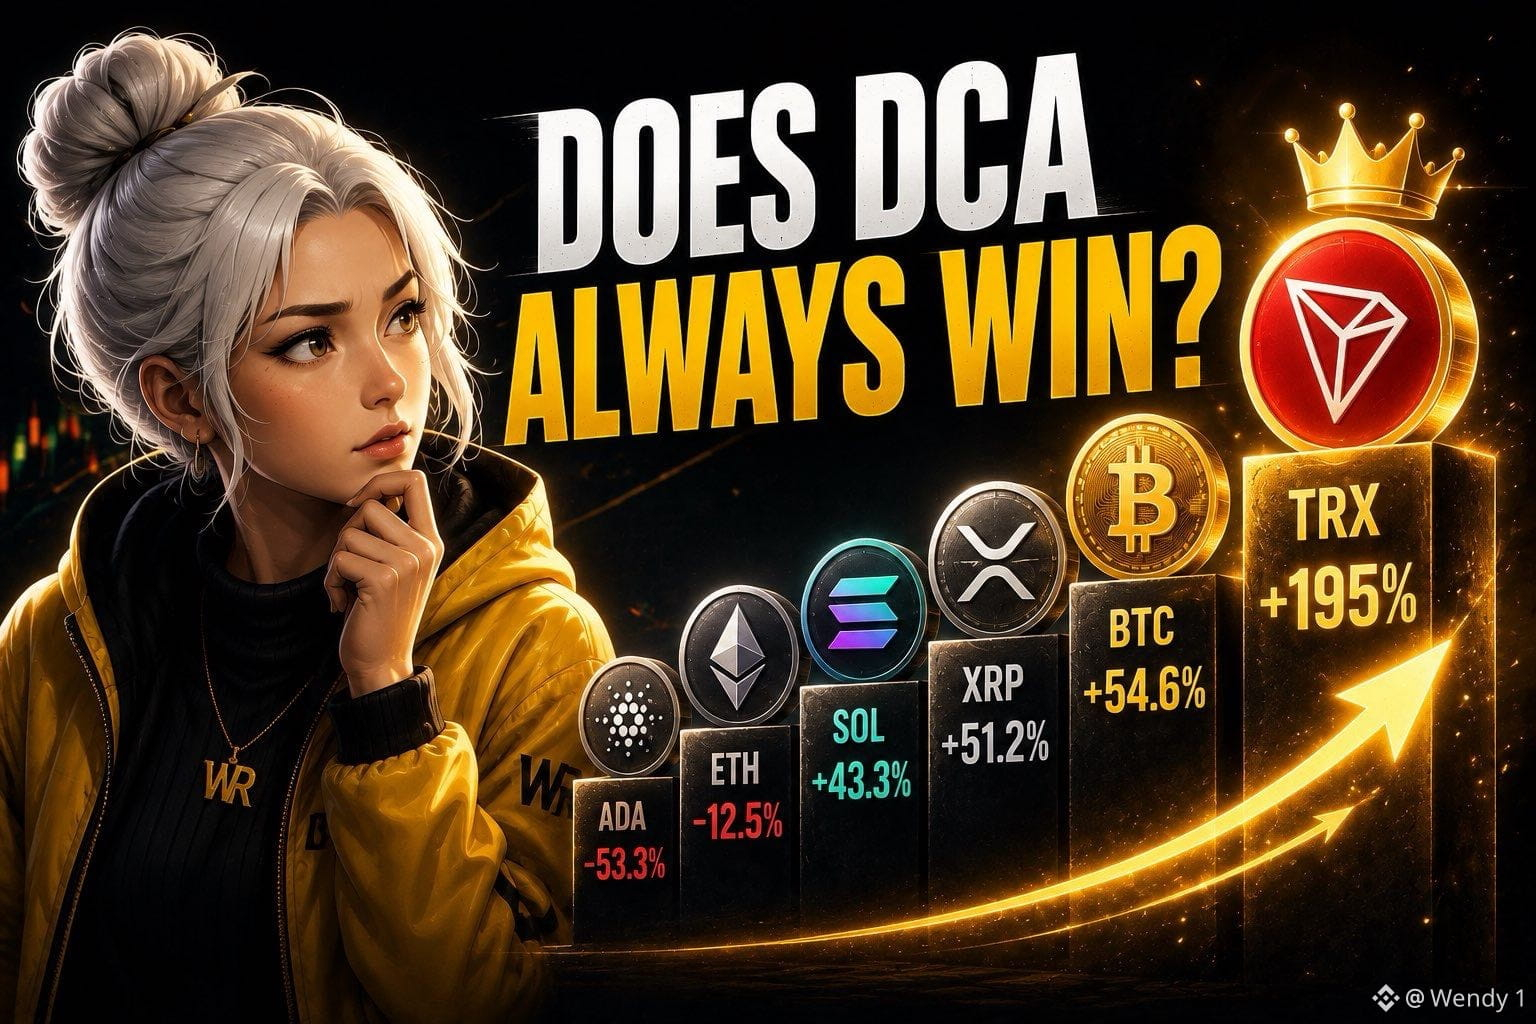
Does DCA Always Win? These Results Say Otherwise.
Dollar-cost averaging (DCA) is one of the most popular investing strategies in crypto, but your choice of asset still matters.
Assuming you invested $100 every month from 2022 through August 2026, your total investment would be $5,600.
The outcomes would have looked very different depending on the asset.
Performance
* $TRX: $16,521 (+195.0%)
* $BTC: $8,660 (+54.6%)
* $XRP: $8,465 (+51.2%)
* $SOL: $8,025 (+43.3%)
* $ETH: $4,898 (−12.5%)
* $ADA: $2,616 (−53.3%)
Consistency Beats Volatility
The standout performer is $TRX, which nearly tripled the invested capital through consistent monthly purchases.
$BTC, $XRP, and $SOL also generated positive returns despite experiencing multiple corrections during the period.
Meanwhile, $ETH and $ADA remind investors that DCA does not eliminate asset-specific risk. Investing consistently into an underperforming asset can still produce negative returns over several years.
The Lesson
DCA reduces the impact of trying to time the market, but it does not guarantee profits.
Long-term success still depends on choosing assets that continue to create value, attract users, and maintain market demand over time.
A disciplined strategy matters—but so does what you’re buying.
Does DCA Always Win? These Results Say Otherwise.
Dollar-cost averaging (DCA) is one of the most popular investing strategies in crypto, but your choice of asset still matters.
Assuming you invested $100 every month from 2022 through August 2026, your total investment would be $5,600.
The outcomes would have looked very different depending on the asset.
Performance
* $TRX: $16,521 (+195.0%)
* $BTC: $8,660 (+54.6%)
* $XRP: $8,465 (+51.2%)
* $SOL: $8,025 (+43.3%)
* $ETH: $4,898 (−12.5%)
* $ADA: $2,616 (−53.3%)
Consistency Beats Volatility
The standout performer is $TRX, which nearly tripled the invested capital through consistent monthly purchases.
$BTC, $XRP, and $SOL also generated positive returns despite experiencing multiple corrections during the period.
Meanwhile, $ETH and $ADA remind investors that DCA does not eliminate asset-specific risk. Investing consistently into an underperforming asset can still produce negative returns over several years.
The Lesson
DCA reduces the impact of trying to time the market, but it does not guarantee profits.
Long-term success still depends on choosing assets that continue to create value, attract users, and maintain market demand over time.
A disciplined strategy matters—but so does what you’re buying.
Dollar-cost averaging (DCA) is one of the most popular investing strategies in crypto, but your choice of asset still matters.
Assuming you invested $100 every month from 2022 through August 2026, your total investment would be $5,600.
The outcomes would have looked very different depending on the asset.
Performance
* $TRX: $16,521 (+195.0%)
* $BTC: $8,660 (+54.6%)
* $XRP: $8,465 (+51.2%)
* $SOL: $8,025 (+43.3%)
* $ETH: $4,898 (−12.5%)
* $ADA: $2,616 (−53.3%)
Consistency Beats Volatility
The standout performer is $TRX, which nearly tripled the invested capital through consistent monthly purchases.
$BTC, $XRP, and $SOL also generated positive returns despite experiencing multiple corrections during the period.
Meanwhile, $ETH and $ADA remind investors that DCA does not eliminate asset-specific risk. Investing consistently into an underperforming asset can still produce negative returns over several years.
The Lesson
DCA reduces the impact of trying to time the market, but it does not guarantee profits.
Long-term success still depends on choosing assets that continue to create value, attract users, and maintain market demand over time.
A disciplined strategy matters—but so does what you’re buying.
60
·
--
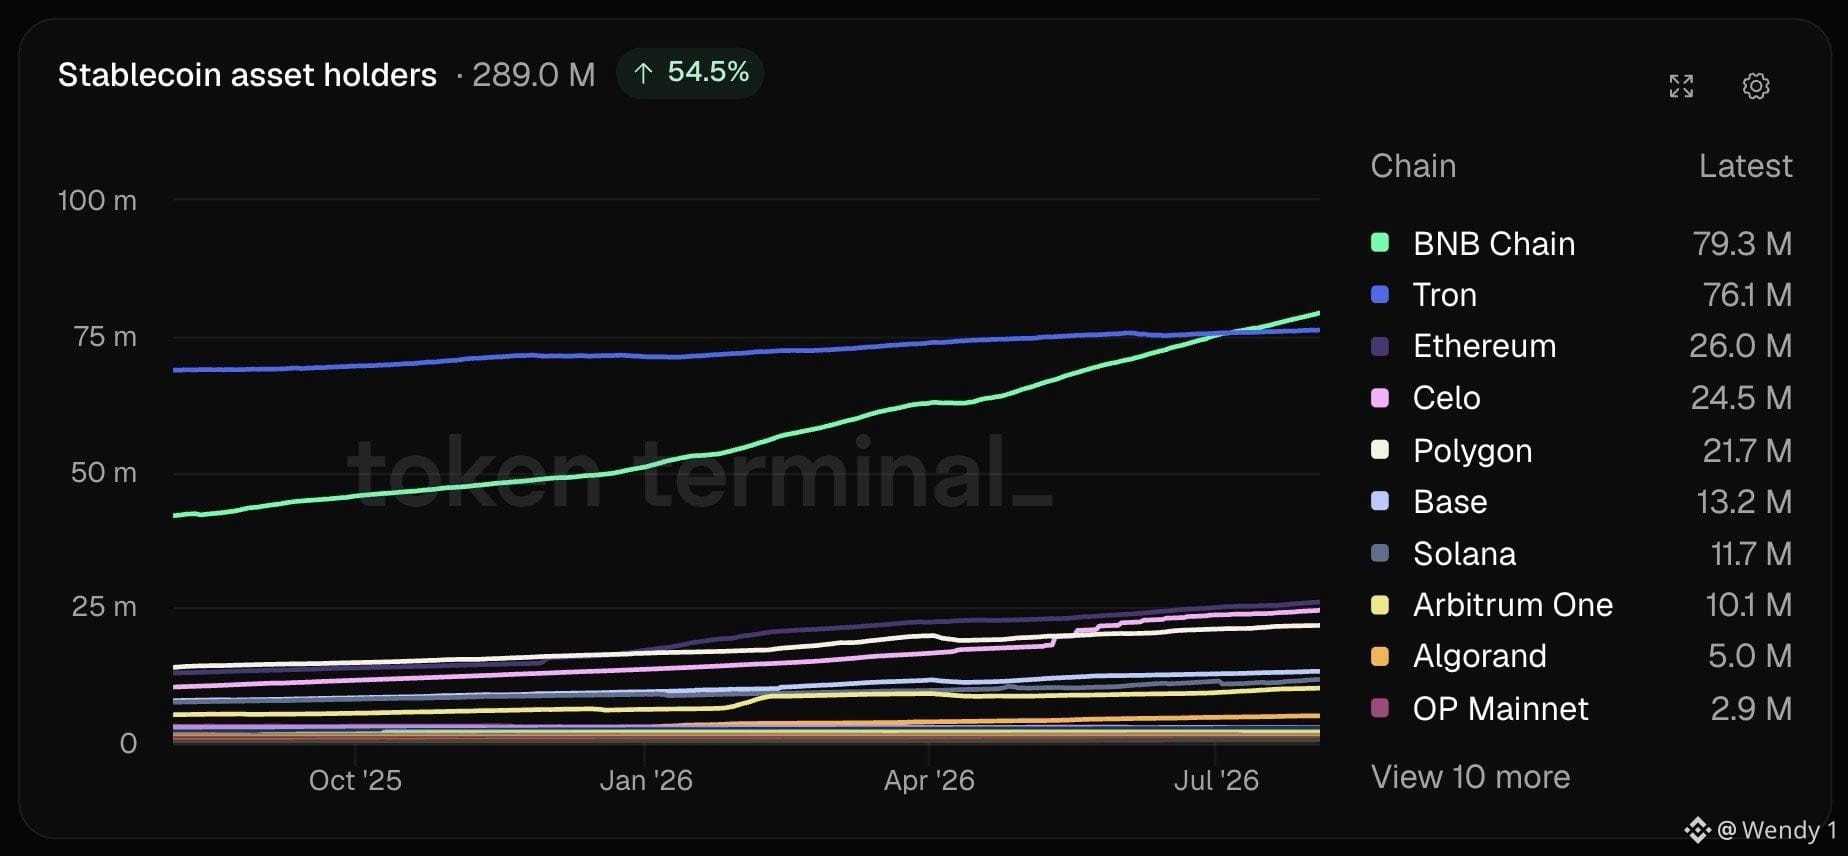
Stablecoin Adoption Continues to Accelerate as Holder Count Reaches 289 Million
Stablecoin adoption continues to gain momentum, with the total number of stablecoin asset holders reaching 289 million, representing 54.5% growth over the measured period.
One of the biggest developments is that BNB Chain has overtaken Tron to become the blockchain with the largest stablecoin holder base.
Latest Stablecoin Holder Rankings
* BNB Chain: 79.3M
* Tron: 76.1M
* Ethereum: 26.0M
* Celo: 24.5M
* Polygon: 21.7M
* Base: 13.2M
* Solana: 11.7M
* Arbitrum One: 10.1M
* Algorand: 5.0M
* OP Mainnet: 2.9M
The continued rise in stablecoin holders highlights growing participation across payments, trading, and DeFi. Meanwhile, BNB Chain’s rapid expansion suggests increasing user activity and adoption within its ecosystem.
As stablecoins become a core component of on-chain finance, tracking holder growth offers another useful indicator of overall blockchain adoption.
Stablecoin Adoption Continues to Accelerate as Holder Count Reaches 289 Million
Stablecoin adoption continues to gain momentum, with the total number of stablecoin asset holders reaching 289 million, representing 54.5% growth over the measured period.
One of the biggest developments is that BNB Chain has overtaken Tron to become the blockchain with the largest stablecoin holder base.
Latest Stablecoin Holder Rankings
* BNB Chain: 79.3M
* Tron: 76.1M
* Ethereum: 26.0M
* Celo: 24.5M
* Polygon: 21.7M
* Base: 13.2M
* Solana: 11.7M
* Arbitrum One: 10.1M
* Algorand: 5.0M
* OP Mainnet: 2.9M
The continued rise in stablecoin holders highlights growing participation across payments, trading, and DeFi. Meanwhile, BNB Chain’s rapid expansion suggests increasing user activity and adoption within its ecosystem.
As stablecoins become a core component of on-chain finance, tracking holder growth offers another useful indicator of overall blockchain adoption.
Stablecoin adoption continues to gain momentum, with the total number of stablecoin asset holders reaching 289 million, representing 54.5% growth over the measured period.
One of the biggest developments is that BNB Chain has overtaken Tron to become the blockchain with the largest stablecoin holder base.
Latest Stablecoin Holder Rankings
* BNB Chain: 79.3M
* Tron: 76.1M
* Ethereum: 26.0M
* Celo: 24.5M
* Polygon: 21.7M
* Base: 13.2M
* Solana: 11.7M
* Arbitrum One: 10.1M
* Algorand: 5.0M
* OP Mainnet: 2.9M
The continued rise in stablecoin holders highlights growing participation across payments, trading, and DeFi. Meanwhile, BNB Chain’s rapid expansion suggests increasing user activity and adoption within its ecosystem.
As stablecoins become a core component of on-chain finance, tracking holder growth offers another useful indicator of overall blockchain adoption.
72
·
--
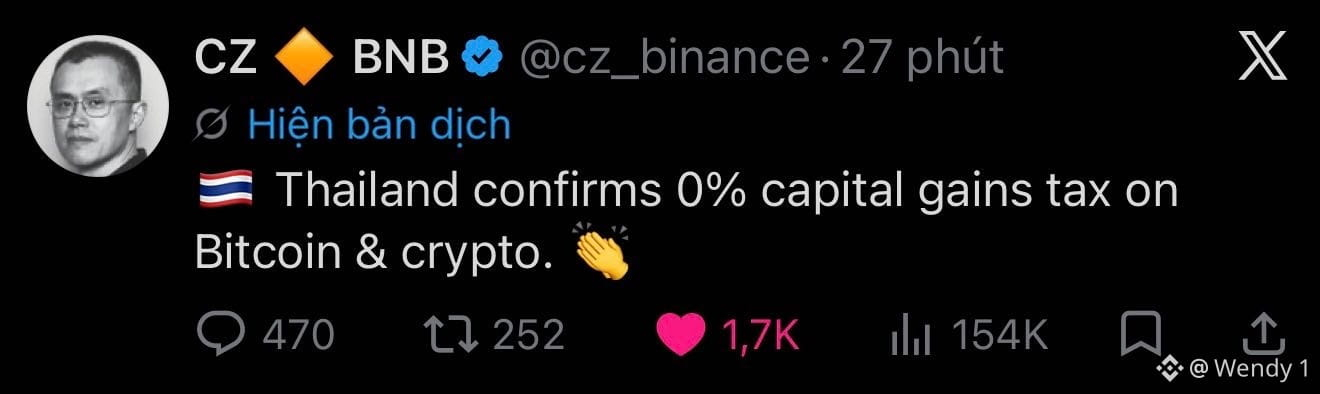
Thailand Confirms 0% Capital Gains Tax on Bitcoin and Crypto
Thailand has confirmed a 0% capital gains tax on Bitcoin and cryptocurrencies, a move that further strengthens its position as one of the more crypto-friendly jurisdictions in Asia.
The announcement, highlighted by Binance founder CZ, is expected to improve the country’s attractiveness for both retail and institutional participants in the digital asset industry.
Why It Matters
A zero capital gains tax can:
* Encourage greater participation in crypto investing.
* Attract blockchain startups, Web3 builders, and digital asset businesses.
* Enhance Thailand’s competitiveness as a regional crypto hub.
* Support long-term innovation and ecosystem growth.
As countries continue refining their digital asset regulations, tax policy is becoming an increasingly important factor in attracting capital and talent. Thailand’s latest move reflects the growing global competition to build a favorable environment for the crypto industry.
Thailand Confirms 0% Capital Gains Tax on Bitcoin and Crypto
Thailand has confirmed a 0% capital gains tax on Bitcoin and cryptocurrencies, a move that further strengthens its position as one of the more crypto-friendly jurisdictions in Asia.
The announcement, highlighted by Binance founder CZ, is expected to improve the country’s attractiveness for both retail and institutional participants in the digital asset industry.
Why It Matters
A zero capital gains tax can:
* Encourage greater participation in crypto investing.
* Attract blockchain startups, Web3 builders, and digital asset businesses.
* Enhance Thailand’s competitiveness as a regional crypto hub.
* Support long-term innovation and ecosystem growth.
As countries continue refining their digital asset regulations, tax policy is becoming an increasingly important factor in attracting capital and talent. Thailand’s latest move reflects the growing global competition to build a favorable environment for the crypto industry.
Thailand has confirmed a 0% capital gains tax on Bitcoin and cryptocurrencies, a move that further strengthens its position as one of the more crypto-friendly jurisdictions in Asia.
The announcement, highlighted by Binance founder CZ, is expected to improve the country’s attractiveness for both retail and institutional participants in the digital asset industry.
Why It Matters
A zero capital gains tax can:
* Encourage greater participation in crypto investing.
* Attract blockchain startups, Web3 builders, and digital asset businesses.
* Enhance Thailand’s competitiveness as a regional crypto hub.
* Support long-term innovation and ecosystem growth.
As countries continue refining their digital asset regulations, tax policy is becoming an increasingly important factor in attracting capital and talent. Thailand’s latest move reflects the growing global competition to build a favorable environment for the crypto industry.
84
·
--
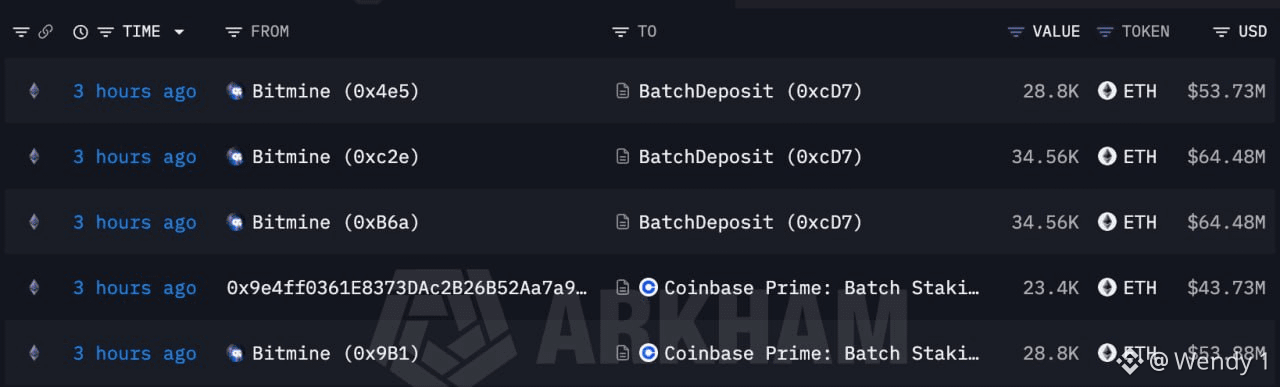
Tom Lee(@fundstrat)'s #Bitmine staked another 150,120 $ETH ($278M) 3 hours ago.
In total, #Bitmine has staked 5,067,309 $ETH ($9.38B), 87.4% of its total holdings.
Tom Lee(@fundstrat)'s #Bitmine staked another 150,120 $ETH ($278M) 3 hours ago.
In total, #Bitmine has staked 5,067,309 $ETH ($9.38B), 87.4% of its total holdings.
In total, #Bitmine has staked 5,067,309 $ETH ($9.38B), 87.4% of its total holdings.
34
·
--
Strategy Confirms Sale of 1,638 $BTC While Remaining the Largest Corporate Bitcoin Holder
Strategy has confirmed that it sold 1,638 $BTC during the past week, a transaction valued at approximately $102.4 million.
Following the sale, the company continues to hold:
* 842,138 $BTC
* Estimated Bitcoin reserve value of approximately $52.65 billion
* Roughly 4.01% of Bitcoin’s total maximum supply
What does this mean?
The transaction follows recent on-chain movements that attracted market attention. While some observers anticipated another sale based on wallet activity, the company has now officially confirmed the transaction.
Importantly, despite the sale, Strategy remains the largest publicly traded corporate holder of Bitcoin by a wide margin.
Why context matters
A corporate Bitcoin sale should not automatically be interpreted as a bearish signal.
Companies may sell assets for a variety of reasons, including:
* Treasury management.
* Funding operational requirements.
* Capital allocation.
* Balance sheet optimization.
Without additional context from the company, the transaction alone does not necessarily indicate a change in Strategy’s long-term Bitcoin strategy.
Given the scale of its remaining holdings, Strategy continues to be one of the most closely watched institutional participants in the Bitcoin market.
Disclaimer: This content is for informational and educational purposes only and should not be considered financial or investment advice. Investors should rely on official company disclosures when evaluating corporate treasury activity.
Strategy Confirms Sale of 1,638 $BTC While Remaining the Largest Corporate Bitcoin Holder
Strategy has confirmed that it sold 1,638 $BTC during the past week, a transaction valued at approximately $102.4 million.
Following the sale, the company continues to hold:
* 842,138 $BTC
* Estimated Bitcoin reserve value of approximately $52.65 billion
* Roughly 4.01% of Bitcoin’s total maximum supply
What does this mean?
The transaction follows recent on-chain movements that attracted market attention. While some observers anticipated another sale based on wallet activity, the company has now officially confirmed the transaction.
Importantly, despite the sale, Strategy remains the largest publicly traded corporate holder of Bitcoin by a wide margin.
Why context matters
A corporate Bitcoin sale should not automatically be interpreted as a bearish signal.
Companies may sell assets for a variety of reasons, including:
* Treasury management.
* Funding operational requirements.
* Capital allocation.
* Balance sheet optimization.
Without additional context from the company, the transaction alone does not necessarily indicate a change in Strategy’s long-term Bitcoin strategy.
Given the scale of its remaining holdings, Strategy continues to be one of the most closely watched institutional participants in the Bitcoin market.
Disclaimer: This content is for informational and educational purposes only and should not be considered financial or investment advice. Investors should rely on official company disclosures when evaluating corporate treasury activity.
Strategy has confirmed that it sold 1,638 $BTC during the past week, a transaction valued at approximately $102.4 million.
Following the sale, the company continues to hold:
* 842,138 $BTC
* Estimated Bitcoin reserve value of approximately $52.65 billion
* Roughly 4.01% of Bitcoin’s total maximum supply
What does this mean?
The transaction follows recent on-chain movements that attracted market attention. While some observers anticipated another sale based on wallet activity, the company has now officially confirmed the transaction.
Importantly, despite the sale, Strategy remains the largest publicly traded corporate holder of Bitcoin by a wide margin.
Why context matters
A corporate Bitcoin sale should not automatically be interpreted as a bearish signal.
Companies may sell assets for a variety of reasons, including:
* Treasury management.
* Funding operational requirements.
* Capital allocation.
* Balance sheet optimization.
Without additional context from the company, the transaction alone does not necessarily indicate a change in Strategy’s long-term Bitcoin strategy.
Given the scale of its remaining holdings, Strategy continues to be one of the most closely watched institutional participants in the Bitcoin market.
Disclaimer: This content is for informational and educational purposes only and should not be considered financial or investment advice. Investors should rely on official company disclosures when evaluating corporate treasury activity.
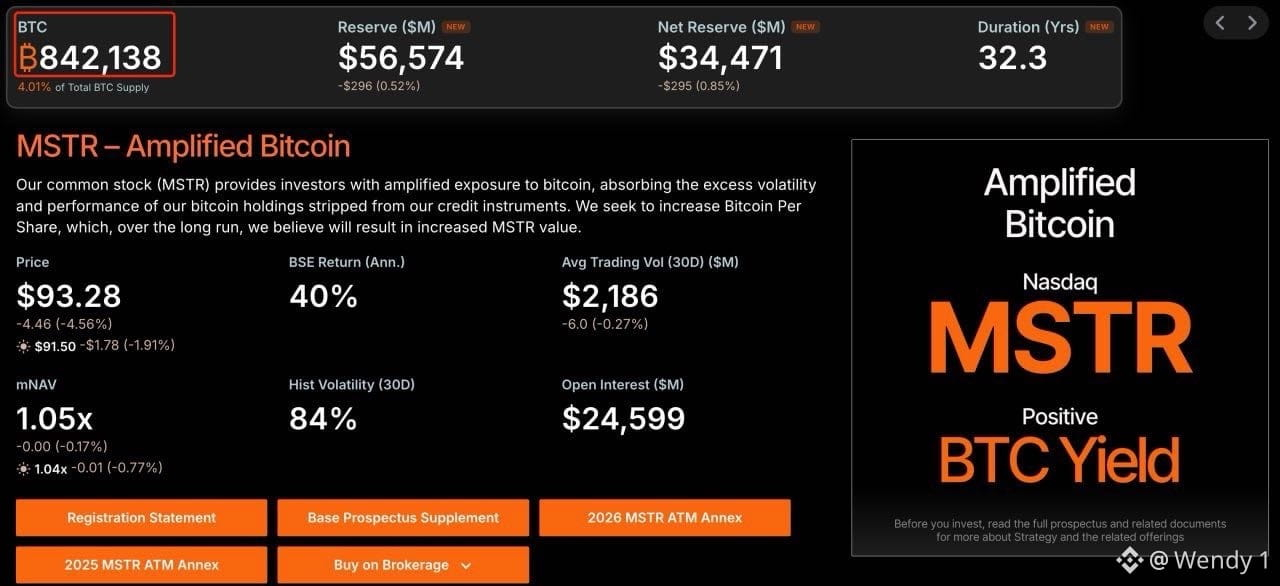
69
·
--
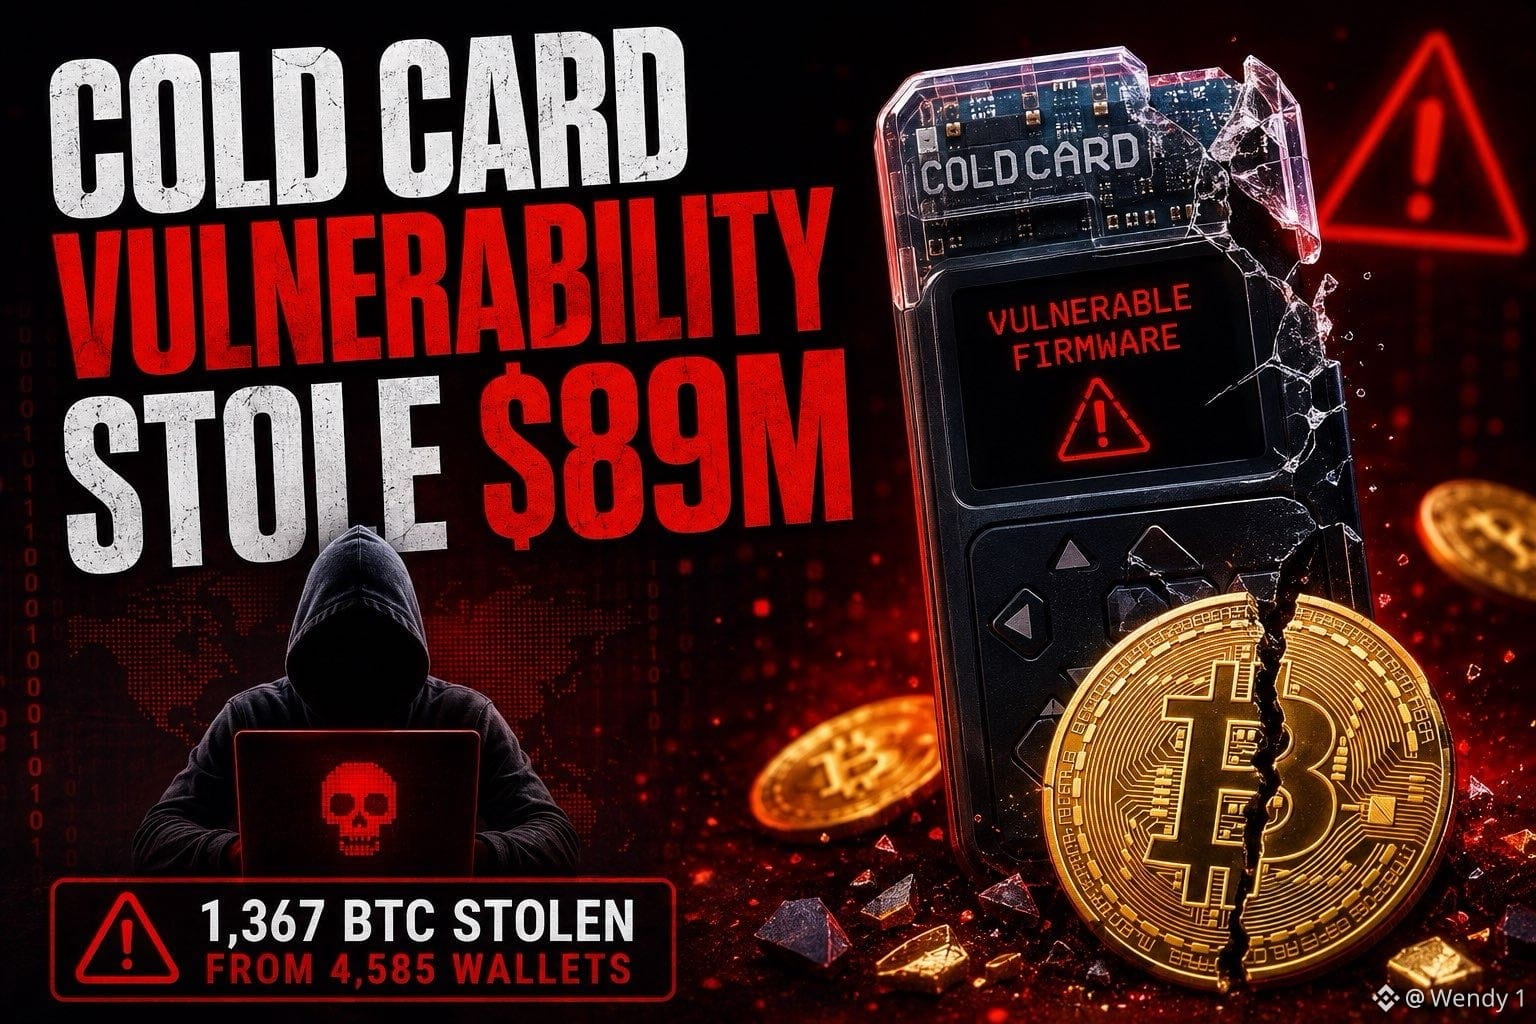
Coldcard Firmware Vulnerability Reportedly Linked to Nearly $89 Million in Stolen $BTC
According to Galaxy Research, a firmware vulnerability affecting certain Coldcard hardware wallets has reportedly resulted in the theft of 1,367 $BTC, worth approximately $89 million, from 4,585 wallet addresses as of August 2.
The report states that 1,082 $BTC was stolen in a single attack lasting just 41 minutes on July 30.
What caused the issue?
The reported vulnerability dates back to a firmware version introduced in March 2021.
Instead of generating recovery seeds exclusively through a hardware random number generator (hardware RNG), some affected firmware versions reportedly relied on a software-based random number generator using partially predictable inputs, including:
* Chip serial numbers.
* System clock values.
This significantly reduced the number of possible seed combinations, making it feasible for attackers to perform offline seed brute-force attacks without physical access to the device.
Recommended actions
Users who generated a wallet using an affected Coldcard firmware since March 2021 are advised to:
* Generate a new recovery seed using a secure and patched device.
* Transfer all $BTC and other assets to the newly created wallet.
* Avoid relying solely on a firmware update, as updating the firmware does not make an existing compromised seed secure again.
Coinkite, the manufacturer of Coldcard, has acknowledged the issue, and CEO Rodolfo Novak has publicly accepted responsibility for the vulnerability.
This incident serves as a reminder that the security of a hardware wallet depends not only on the physical device but also on the integrity of its firmware and seed generation process.
Disclaimer: This content is for informational and educational purposes only and should not be considered financial, security, or investment advice. Users should refer to official guidance from the wallet manufacturer before taking action.
Coldcard Firmware Vulnerability Reportedly Linked to Nearly $89 Million in Stolen $BTC
According to Galaxy Research, a firmware vulnerability affecting certain Coldcard hardware wallets has reportedly resulted in the theft of 1,367 $BTC, worth approximately $89 million, from 4,585 wallet addresses as of August 2.
The report states that 1,082 $BTC was stolen in a single attack lasting just 41 minutes on July 30.
What caused the issue?
The reported vulnerability dates back to a firmware version introduced in March 2021.
Instead of generating recovery seeds exclusively through a hardware random number generator (hardware RNG), some affected firmware versions reportedly relied on a software-based random number generator using partially predictable inputs, including:
* Chip serial numbers.
* System clock values.
This significantly reduced the number of possible seed combinations, making it feasible for attackers to perform offline seed brute-force attacks without physical access to the device.
Recommended actions
Users who generated a wallet using an affected Coldcard firmware since March 2021 are advised to:
* Generate a new recovery seed using a secure and patched device.
* Transfer all $BTC and other assets to the newly created wallet.
* Avoid relying solely on a firmware update, as updating the firmware does not make an existing compromised seed secure again.
Coinkite, the manufacturer of Coldcard, has acknowledged the issue, and CEO Rodolfo Novak has publicly accepted responsibility for the vulnerability.
This incident serves as a reminder that the security of a hardware wallet depends not only on the physical device but also on the integrity of its firmware and seed generation process.
Disclaimer: This content is for informational and educational purposes only and should not be considered financial, security, or investment advice. Users should refer to official guidance from the wallet manufacturer before taking action.
According to Galaxy Research, a firmware vulnerability affecting certain Coldcard hardware wallets has reportedly resulted in the theft of 1,367 $BTC, worth approximately $89 million, from 4,585 wallet addresses as of August 2.
The report states that 1,082 $BTC was stolen in a single attack lasting just 41 minutes on July 30.
What caused the issue?
The reported vulnerability dates back to a firmware version introduced in March 2021.
Instead of generating recovery seeds exclusively through a hardware random number generator (hardware RNG), some affected firmware versions reportedly relied on a software-based random number generator using partially predictable inputs, including:
* Chip serial numbers.
* System clock values.
This significantly reduced the number of possible seed combinations, making it feasible for attackers to perform offline seed brute-force attacks without physical access to the device.
Recommended actions
Users who generated a wallet using an affected Coldcard firmware since March 2021 are advised to:
* Generate a new recovery seed using a secure and patched device.
* Transfer all $BTC and other assets to the newly created wallet.
* Avoid relying solely on a firmware update, as updating the firmware does not make an existing compromised seed secure again.
Coinkite, the manufacturer of Coldcard, has acknowledged the issue, and CEO Rodolfo Novak has publicly accepted responsibility for the vulnerability.
This incident serves as a reminder that the security of a hardware wallet depends not only on the physical device but also on the integrity of its firmware and seed generation process.
Disclaimer: This content is for informational and educational purposes only and should not be considered financial, security, or investment advice. Users should refer to official guidance from the wallet manufacturer before taking action.
59
Войдите, чтобы посмотреть больше материала
Присоединяйтесь к пользователям криптовалют по всему миру на Binance Square
⚡️ Получайте новейшую и полезную информацию о криптоактивах.
💬 Нам доверяет крупнейшая в мире криптобиржа.
👍 Получите достоверные аналитические данные от верифицированных создателей контента.
Эл. почта/номер телефона
В тренде
USAugustPPIRisesLessThanExpected
Просмотров: 42,592
757 обсуждают
🚨 US AUG PPI: Rises LESS Than Expected! Bullish for Crypto? 🚀
PPI +0.4% MoM as expected, but CORE PPI only +0.2% vs +0.3% expected - cooling!
What it means:
• Wholesale inflation softer than feared
• Fed rate hike chance now 62% - but dovish signals coming
• Core PCE revisions expected downward - bullish
• BTC usually pumps on softer PPI
Fed meeting Sep 15-16 - Market now expects pause, not hike?
Is this the green light for Q4 rally?
#Bitcoin #PPI #Fed #CryptoNews #BTC#usaugustppiriseslessthanexpected
True News
·Лайков: 1
·Просмотров: 1.4k
SECApprovesNasdaqTexasCommodityTrustRule
Просмотров: 24,739
560 обсуждают
ECBRaisesRatesSecondTimeTo2.5%
Просмотров: 22,334
406 обсуждают