
Trading Heights 1
645 Публикации

Trading Heights 1
Отправить жалобу
Заблокировать пользователя
Crypto investor since 2016 | Navigating market cycles with insights on trends, project analysis & growth opportunities | Passionate about blockchain innovation.
0 подписок(и/а)
15 подписчиков(а)
22 понравилось
Посты
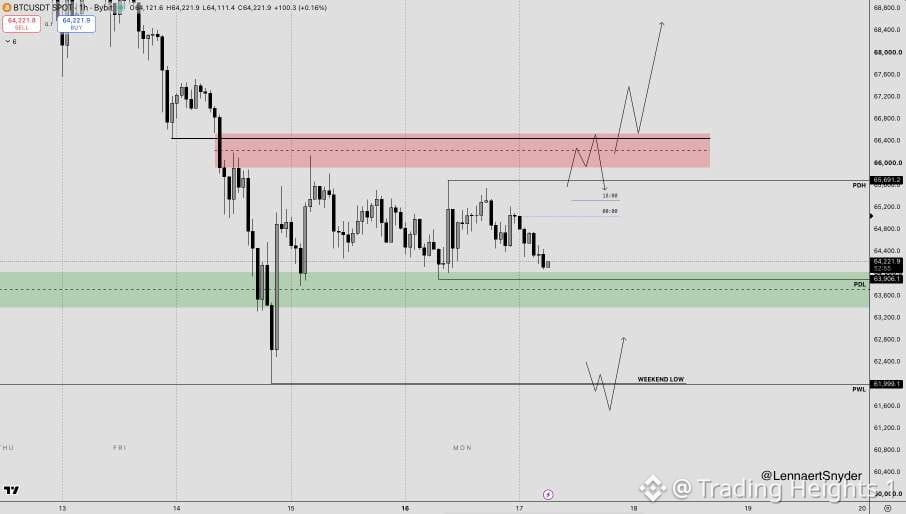
$BTC is still in the accumulation phase.
As explained earlier, this is healthy PA after such a heavy distribution to the downside.
Price is stabilising and accumulating orders, it's important to stay patient in circumstances like this.
For new potential positions on Bitcoin, I'm looking at the following:
Today we saw an immediate repricing to the downside after the 00:00 open, I expect to at least wick above there/retest that price level.
If that happens, and price manages to test the 66.4K imbalance, I'll look for short-triggers towards the 62K PWL.
If price reprices above the 66.4K imbalance with speed and strength, that same region can be used as support for longs.
The current low is a weekend low, and I don't like that for a sustainable move up.
Therefore, a sweep of that low is what I'm looking at for longs after the trigger.
If you're a good scalper you can look for continuation shorts if we lose the 63.9K PDL and use it as resistance.
Don't get chopped up in the middle, quality setups will form soon enough.
$BTC
#BTC Price Analysis#
$BTC is still in the accumulation phase.
As explained earlier, this is healthy PA after such a heavy distribution to the downside.
Price is stabilising and accumulating orders, it's important to stay patient in circumstances like this.
For new potential positions on Bitcoin, I'm looking at the following:
Today we saw an immediate repricing to the downside after the 00:00 open, I expect to at least wick above there/retest that price level.
If that happens, and price manages to test the 66.4K imbalance, I'll look for short-triggers towards the 62K PWL.
If price reprices above the 66.4K imbalance with speed and strength, that same region can be used as support for longs.
The current low is a weekend low, and I don't like that for a sustainable move up.
Therefore, a sweep of that low is what I'm looking at for longs after the trigger.
If you're a good scalper you can look for continuation shorts if we lose the 63.9K PDL and use it as resistance.
Don't get chopped up in the middle, quality setups will form soon enough.
$BTC
#BTC Price Analysis#
As explained earlier, this is healthy PA after such a heavy distribution to the downside.
Price is stabilising and accumulating orders, it's important to stay patient in circumstances like this.
For new potential positions on Bitcoin, I'm looking at the following:
Today we saw an immediate repricing to the downside after the 00:00 open, I expect to at least wick above there/retest that price level.
If that happens, and price manages to test the 66.4K imbalance, I'll look for short-triggers towards the 62K PWL.
If price reprices above the 66.4K imbalance with speed and strength, that same region can be used as support for longs.
The current low is a weekend low, and I don't like that for a sustainable move up.
Therefore, a sweep of that low is what I'm looking at for longs after the trigger.
If you're a good scalper you can look for continuation shorts if we lose the 63.9K PDL and use it as resistance.
Don't get chopped up in the middle, quality setups will form soon enough.
$BTC
#BTC Price Analysis#
56
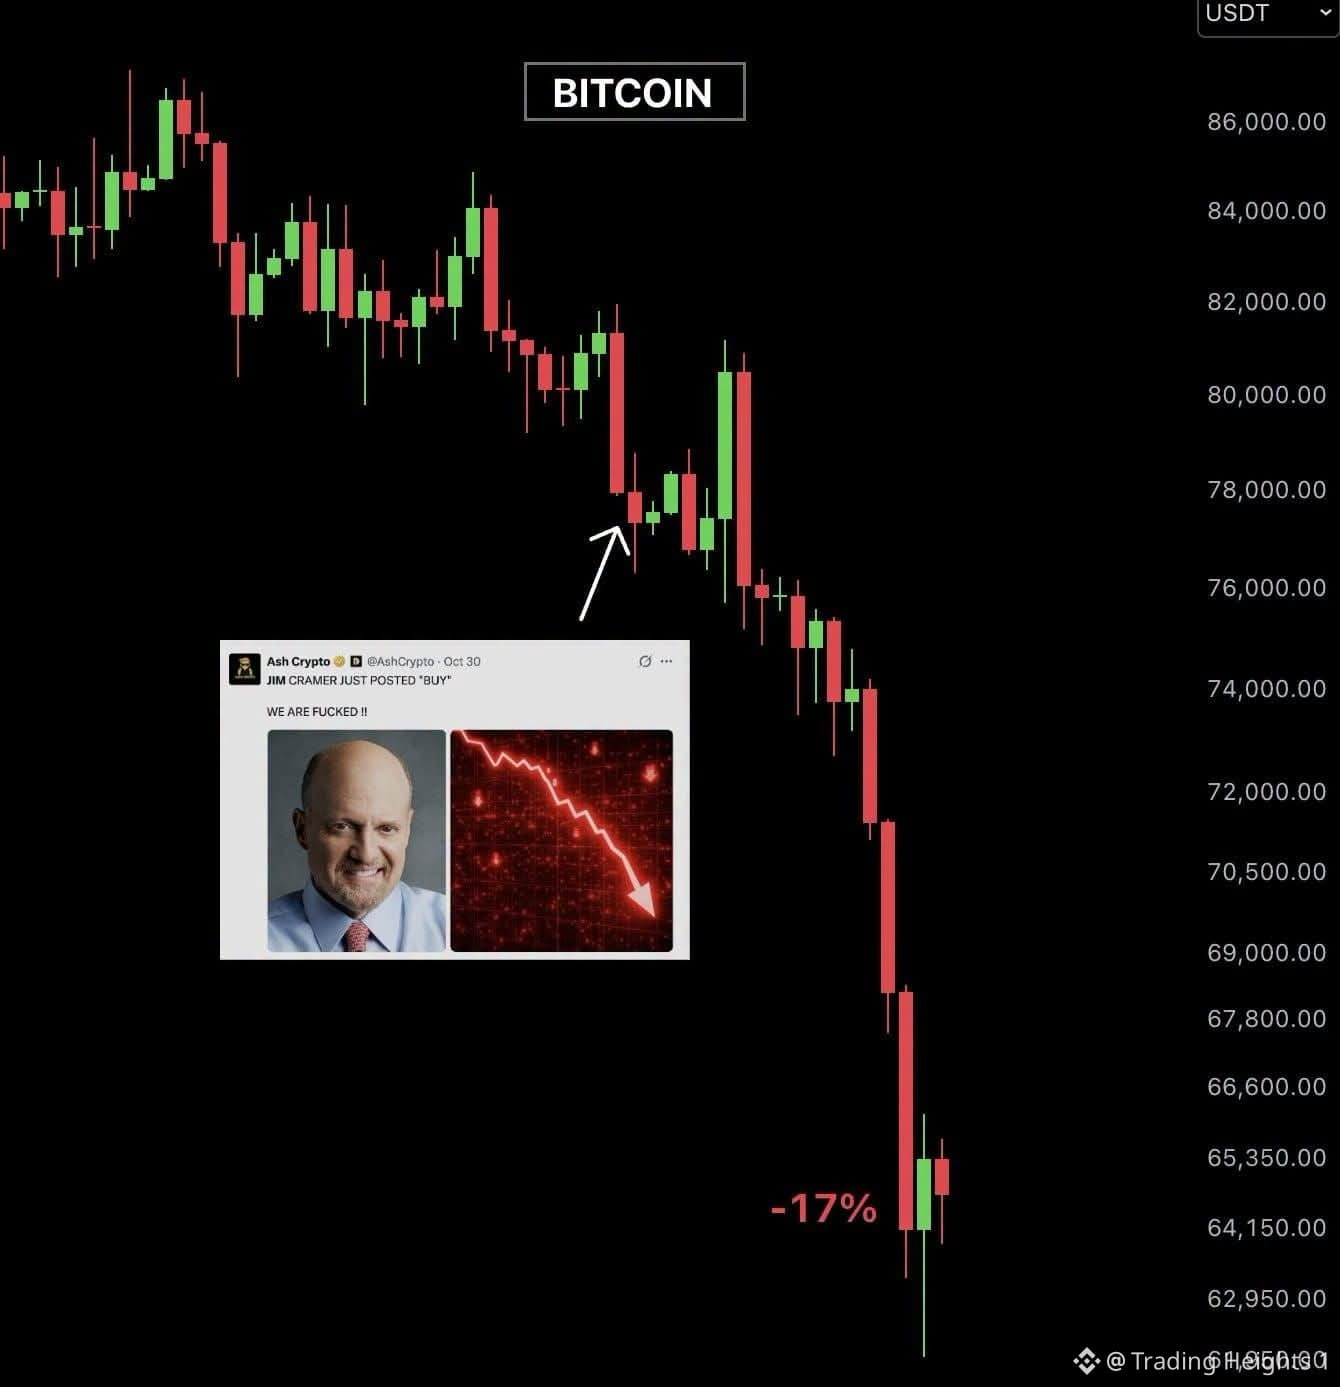
𝐁𝐢𝐭𝐜𝐨𝐢𝐧 𝐢𝐬 𝐝𝐨𝐰𝐧 $𝟏𝟑,𝟐𝟖𝟒 𝐬𝐢𝐧𝐜𝐞 𝐉𝐢𝐦 𝐂𝐫𝐚𝐦𝐞𝐫 𝐬𝐚𝐢𝐝 “𝐁𝐔𝐘.” 💀
The math is absolutely brutal.
Imagine buying Bitcoin the moment Cramer gave the green light, only to watch the market move $13,284 in the opposite direction.
Cramer says BUY → Bitcoin says GOODBYE.
At this point, the inverse Cramer strategy deserves its own trading indicator.
Wall Street has analysts, algorithms, and billions in research.
Meanwhile, the internet just waits for Cramer to make a prediction and considers doing the exact opposite.
You literally can't make this shit up.
$BTC
#BTC Price Analysis#
𝐁𝐢𝐭𝐜𝐨𝐢𝐧 𝐢𝐬 𝐝𝐨𝐰𝐧 $𝟏𝟑,𝟐𝟖𝟒 𝐬𝐢𝐧𝐜𝐞 𝐉𝐢𝐦 𝐂𝐫𝐚𝐦𝐞𝐫 𝐬𝐚𝐢𝐝 “𝐁𝐔𝐘.” 💀
The math is absolutely brutal.
Imagine buying Bitcoin the moment Cramer gave the green light, only to watch the market move $13,284 in the opposite direction.
Cramer says BUY → Bitcoin says GOODBYE.
At this point, the inverse Cramer strategy deserves its own trading indicator.
Wall Street has analysts, algorithms, and billions in research.
Meanwhile, the internet just waits for Cramer to make a prediction and considers doing the exact opposite.
You literally can't make this shit up.
$BTC
#BTC Price Analysis#
The math is absolutely brutal.
Imagine buying Bitcoin the moment Cramer gave the green light, only to watch the market move $13,284 in the opposite direction.
Cramer says BUY → Bitcoin says GOODBYE.
At this point, the inverse Cramer strategy deserves its own trading indicator.
Wall Street has analysts, algorithms, and billions in research.
Meanwhile, the internet just waits for Cramer to make a prediction and considers doing the exact opposite.
You literally can't make this shit up.
$BTC
#BTC Price Analysis#
55
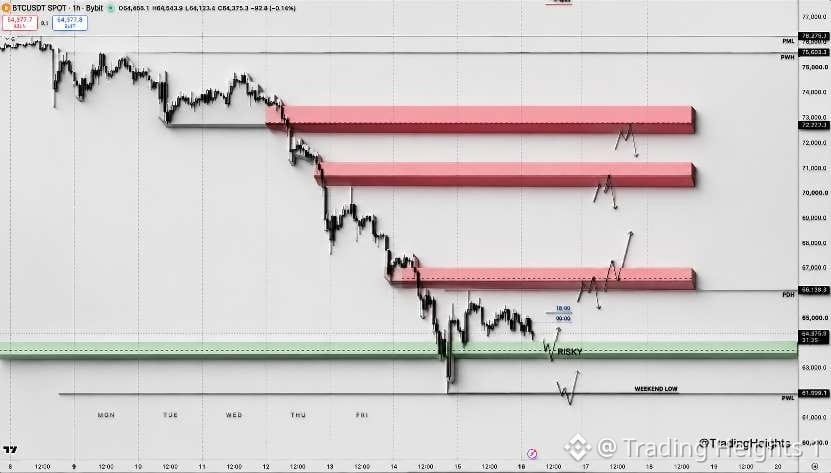
$BTC closes above the 63.5K last line of defence on the daily.
In yesterdays post I shared my HTF approach on Bitcoin for probably the rest of this year.
The green box is the daily 63.5K imbalance, as long as we keep closing within/above it on the daily, a relief bounce is likely.
The thing I don't like, is that the current 62K low was printed on a Saturday.
And we all know that weekend highs/lows almost always get taken out in the next week.
Longs after the trigger in the 63.5K region could still work, but it's lower probable and more risky due to that weekend low.
Can we see a bounce from a weekend low? Of course, and if that happens, the short thesis is even stronger.
I have three short-POI's annotated from aggressive to defensive.
If we reprice higher with the weekend-low intact, I'll look for short triggers in the 66.4K region.
If we reprice above the first red box, the next POI's are in-play for shorts after the trigger. With the 72.6K region as highest quality POI.
For longs, my approach is to catch a potential relief bounce.
Either after the sweep of the current low. Or if we reprice above 66.5K with speed and aggression.
DXY is strong and further rate hikes are being priced in, this puts pressure on risk assets.
$BTC
#BTC Price Analysis#
$BTC closes above the 63.5K last line of defence on the daily.
In yesterdays post I shared my HTF approach on Bitcoin for probably the rest of this year.
The green box is the daily 63.5K imbalance, as long as we keep closing within/above it on the daily, a relief bounce is likely.
The thing I don't like, is that the current 62K low was printed on a Saturday.
And we all know that weekend highs/lows almost always get taken out in the next week.
Longs after the trigger in the 63.5K region could still work, but it's lower probable and more risky due to that weekend low.
Can we see a bounce from a weekend low? Of course, and if that happens, the short thesis is even stronger.
I have three short-POI's annotated from aggressive to defensive.
If we reprice higher with the weekend-low intact, I'll look for short triggers in the 66.4K region.
If we reprice above the first red box, the next POI's are in-play for shorts after the trigger. With the 72.6K region as highest quality POI.
For longs, my approach is to catch a potential relief bounce.
Either after the sweep of the current low. Or if we reprice above 66.5K with speed and aggression.
DXY is strong and further rate hikes are being priced in, this puts pressure on risk assets.
$BTC
#BTC Price Analysis#
In yesterdays post I shared my HTF approach on Bitcoin for probably the rest of this year.
The green box is the daily 63.5K imbalance, as long as we keep closing within/above it on the daily, a relief bounce is likely.
The thing I don't like, is that the current 62K low was printed on a Saturday.
And we all know that weekend highs/lows almost always get taken out in the next week.
Longs after the trigger in the 63.5K region could still work, but it's lower probable and more risky due to that weekend low.
Can we see a bounce from a weekend low? Of course, and if that happens, the short thesis is even stronger.
I have three short-POI's annotated from aggressive to defensive.
If we reprice higher with the weekend-low intact, I'll look for short triggers in the 66.4K region.
If we reprice above the first red box, the next POI's are in-play for shorts after the trigger. With the 72.6K region as highest quality POI.
For longs, my approach is to catch a potential relief bounce.
Either after the sweep of the current low. Or if we reprice above 66.5K with speed and aggression.
DXY is strong and further rate hikes are being priced in, this puts pressure on risk assets.
$BTC
#BTC Price Analysis#
60
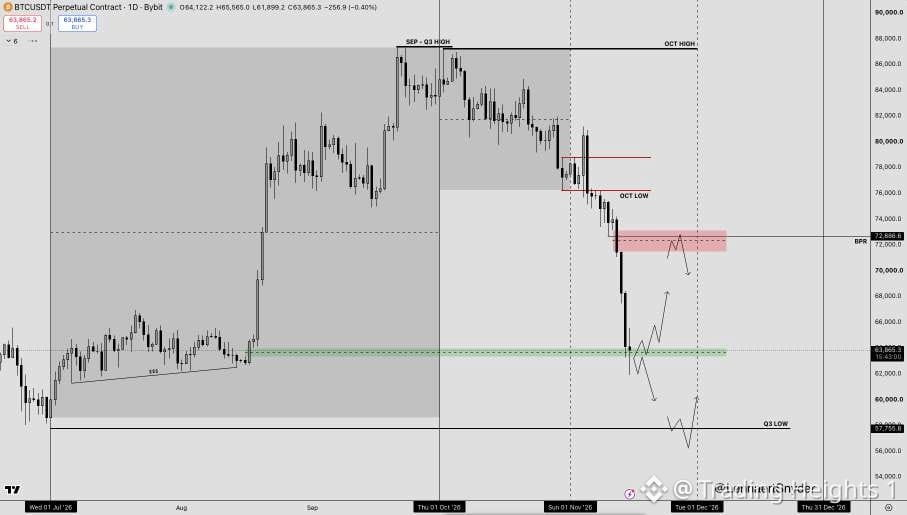
$BTC swept the 62.7K low, this is my HTF approach for the upcoming weeks/rest of the year.
The chart below shows my most important reference points for the rest of this year probably.
The grey box on the left is the Q3 range, next to that you see Q4 divided into three months, with the October range in grey.
The 63.4K imbalance was the last line of defence within the upward move that started on August 17th.
We now got rid of all of the buyers within that move, this means we swept lots of SSL, over a billion in longs liquidated.
As long as we wick below, but the daily bodies close within the 63.4K imbalance, I'll try and long a potential relief bounce.
Of course the local trend is down, but from RR perspective and the place in the range, longs are in favour.
If we lose the 63.4K imbalance with speed and strength, that same region can be used for shorts towards 59K and 57.7K.
The highest quality short-POI for me lays at 72.6K. We have a daily imbalance there + BPR + the 50% level of the Q3 range. Very strong confluences.
That said, since we rejected the Q3 high and lost the 50%, sweeping the 57.8K Q3 low is a very interesting scenario for longs.
There are other scenarios for bounces to scalp-long in between of course, 59K and 60K for example. But these are my HTF objectives.
Do you remember what I mentioned at the beginning of November? If we lose the October low and use it as resistance on price...
$BTC #BTC Price Analysis#
$BTC swept the 62.7K low, this is my HTF approach for the upcoming weeks/rest of the year.
The chart below shows my most important reference points for the rest of this year probably.
The grey box on the left is the Q3 range, next to that you see Q4 divided into three months, with the October range in grey.
The 63.4K imbalance was the last line of defence within the upward move that started on August 17th.
We now got rid of all of the buyers within that move, this means we swept lots of SSL, over a billion in longs liquidated.
As long as we wick below, but the daily bodies close within the 63.4K imbalance, I'll try and long a potential relief bounce.
Of course the local trend is down, but from RR perspective and the place in the range, longs are in favour.
If we lose the 63.4K imbalance with speed and strength, that same region can be used for shorts towards 59K and 57.7K.
The highest quality short-POI for me lays at 72.6K. We have a daily imbalance there + BPR + the 50% level of the Q3 range. Very strong confluences.
That said, since we rejected the Q3 high and lost the 50%, sweeping the 57.8K Q3 low is a very interesting scenario for longs.
There are other scenarios for bounces to scalp-long in between of course, 59K and 60K for example. But these are my HTF objectives.
Do you remember what I mentioned at the beginning of November? If we lose the October low and use it as resistance on price...
$BTC #BTC Price Analysis#
The chart below shows my most important reference points for the rest of this year probably.
The grey box on the left is the Q3 range, next to that you see Q4 divided into three months, with the October range in grey.
The 63.4K imbalance was the last line of defence within the upward move that started on August 17th.
We now got rid of all of the buyers within that move, this means we swept lots of SSL, over a billion in longs liquidated.
As long as we wick below, but the daily bodies close within the 63.4K imbalance, I'll try and long a potential relief bounce.
Of course the local trend is down, but from RR perspective and the place in the range, longs are in favour.
If we lose the 63.4K imbalance with speed and strength, that same region can be used for shorts towards 59K and 57.7K.
The highest quality short-POI for me lays at 72.6K. We have a daily imbalance there + BPR + the 50% level of the Q3 range. Very strong confluences.
That said, since we rejected the Q3 high and lost the 50%, sweeping the 57.8K Q3 low is a very interesting scenario for longs.
There are other scenarios for bounces to scalp-long in between of course, 59K and 60K for example. But these are my HTF objectives.
Do you remember what I mentioned at the beginning of November? If we lose the October low and use it as resistance on price...
$BTC #BTC Price Analysis#
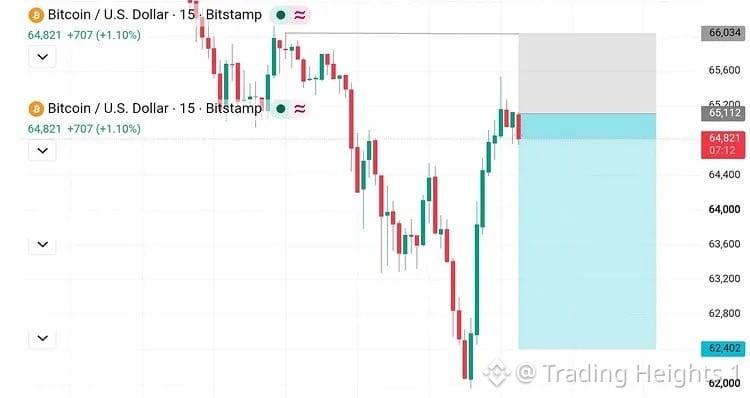
📉 $BTCUSD M15 Short Setup
Entry : 65112
SL : 66034
TP : 62402
Trade with proper risk management 🥇
$BTC #BTC Price Analysis#
📉 $BTCUSD M15 Short Setup
Entry : 65112
SL : 66034
TP : 62402
Trade with proper risk management 🥇
$BTC #BTC Price Analysis#
Entry : 65112
SL : 66034
TP : 62402
Trade with proper risk management 🥇
$BTC #BTC Price Analysis#
27
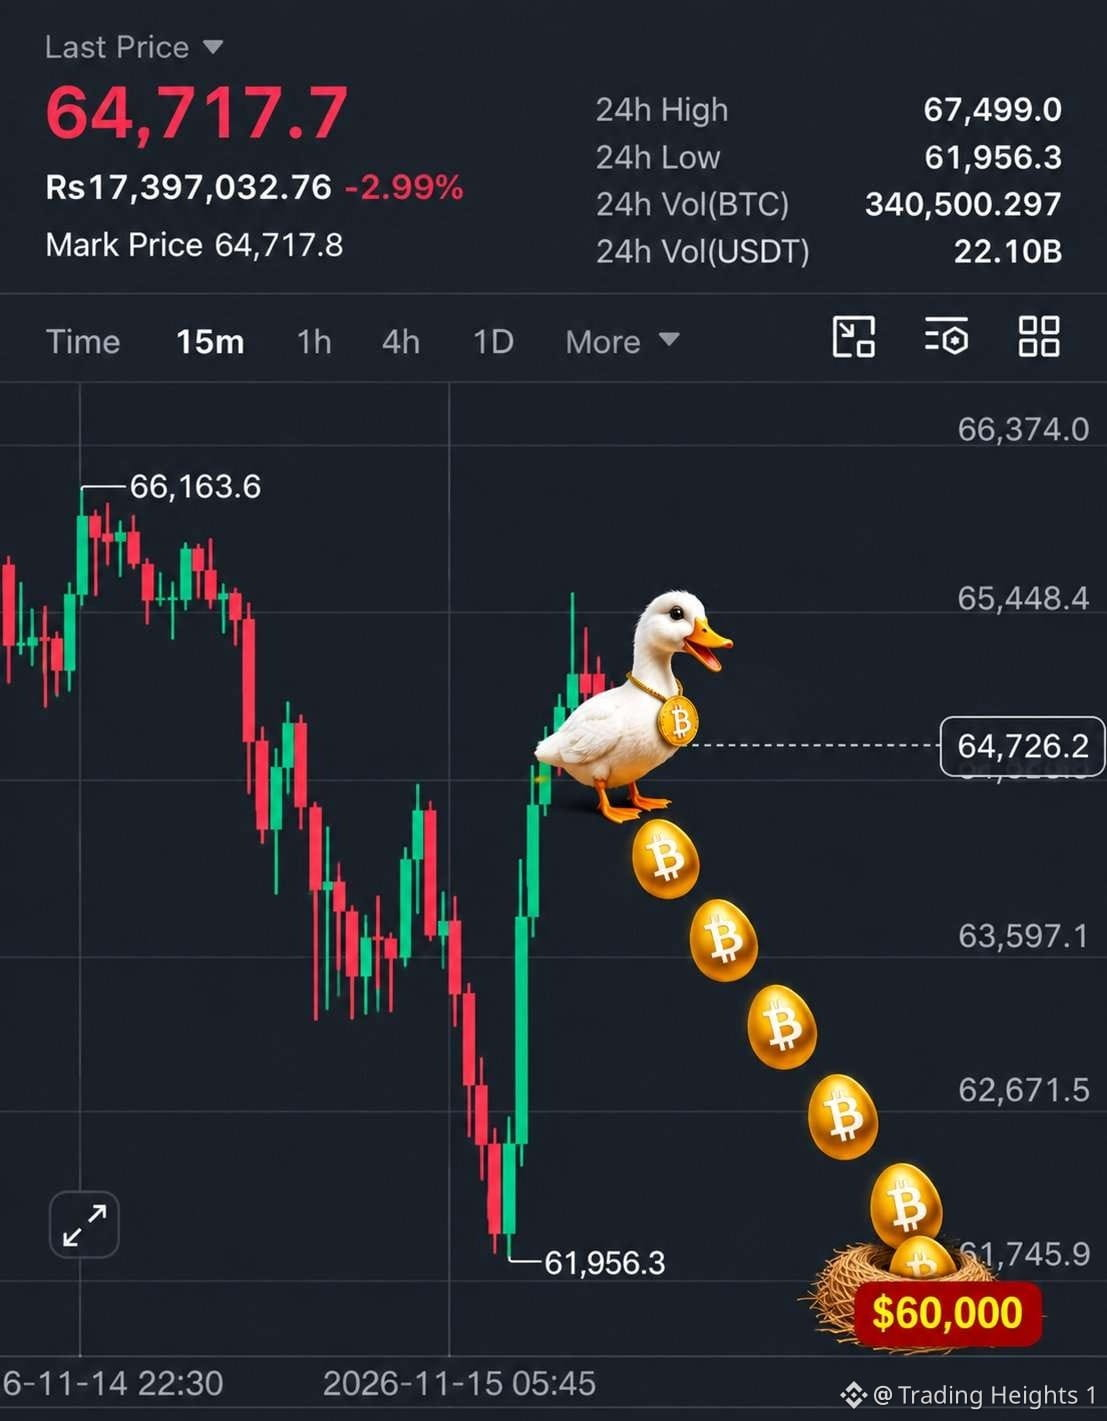
$BTC dips below $65,000.
People were calling me crazy when I predicted that $BTC would dump to $62,000, i made this prediction when $BTC was trading at $86,000.
Now see all my predictions gone right, what about you haters.
Accept the reality rather than thinking about a pump every time.
#BTC Price Analysis#
$BTC dips below $65,000.
People were calling me crazy when I predicted that $BTC would dump to $62,000, i made this prediction when $BTC was trading at $86,000.
Now see all my predictions gone right, what about you haters.
Accept the reality rather than thinking about a pump every time.
#BTC Price Analysis#
People were calling me crazy when I predicted that $BTC would dump to $62,000, i made this prediction when $BTC was trading at $86,000.
Now see all my predictions gone right, what about you haters.
Accept the reality rather than thinking about a pump every time.
#BTC Price Analysis#
26
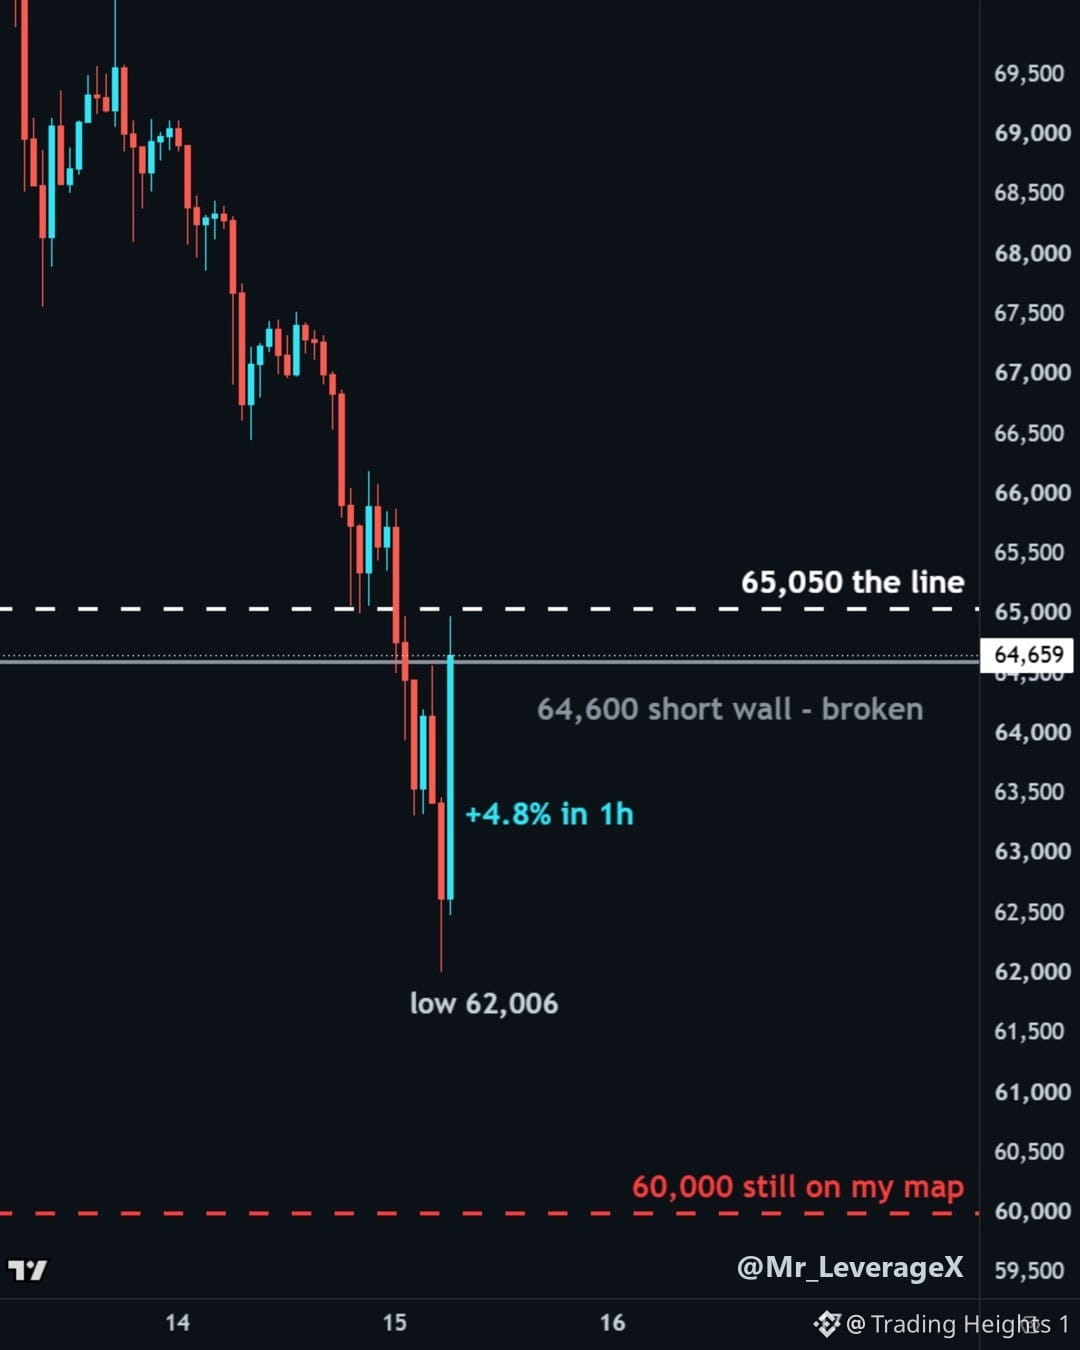
BITCOIN JUST BOUNCED +$2,900 IN AN HOUR. I'M NOT BUYING IT.
$BTC went from 62,006 to 64,985. Shorts got squeezed through 64,600.
My line is 65,050.
Hourly close above it: the squeeze runs to 66,600.
No close: back to 63,400, a retest of 62,006, and 60,000 is still on my map.
#BTC Price Analysis#
BITCOIN JUST BOUNCED +$2,900 IN AN HOUR. I'M NOT BUYING IT.
$BTC went from 62,006 to 64,985. Shorts got squeezed through 64,600.
My line is 65,050.
Hourly close above it: the squeeze runs to 66,600.
No close: back to 63,400, a retest of 62,006, and 60,000 is still on my map.
#BTC Price Analysis#
$BTC went from 62,006 to 64,985. Shorts got squeezed through 64,600.
My line is 65,050.
Hourly close above it: the squeeze runs to 66,600.
No close: back to 63,400, a retest of 62,006, and 60,000 is still on my map.
#BTC Price Analysis#
42
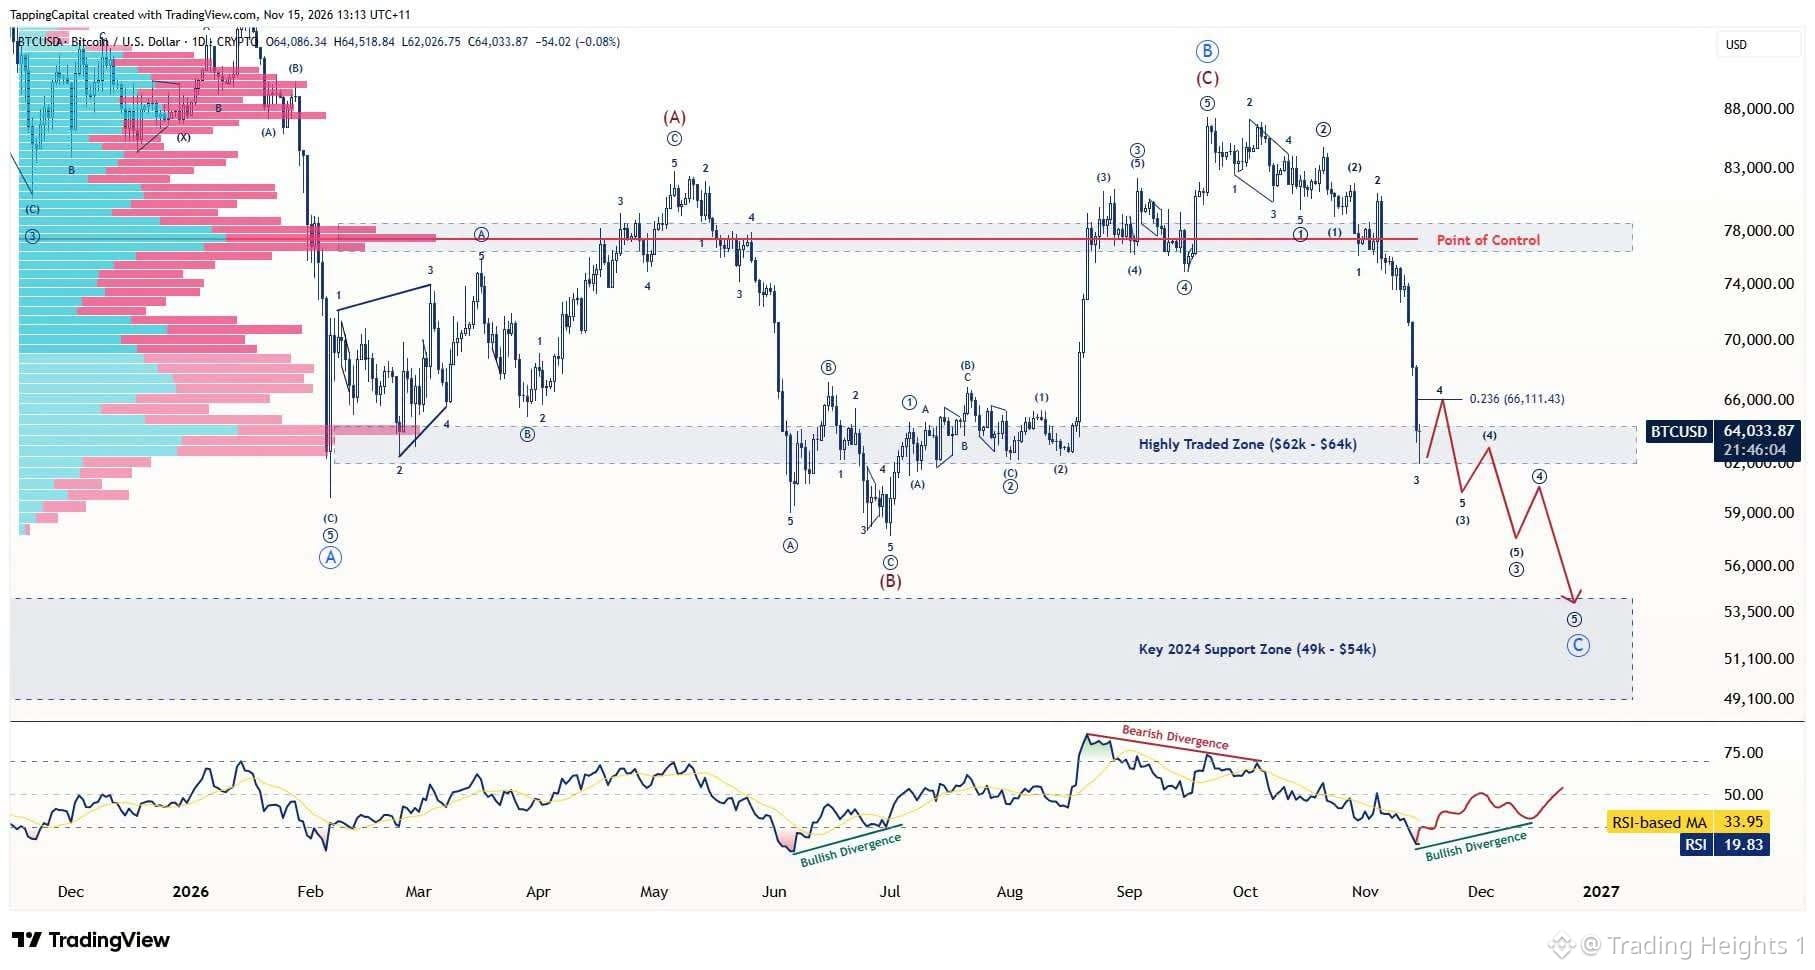
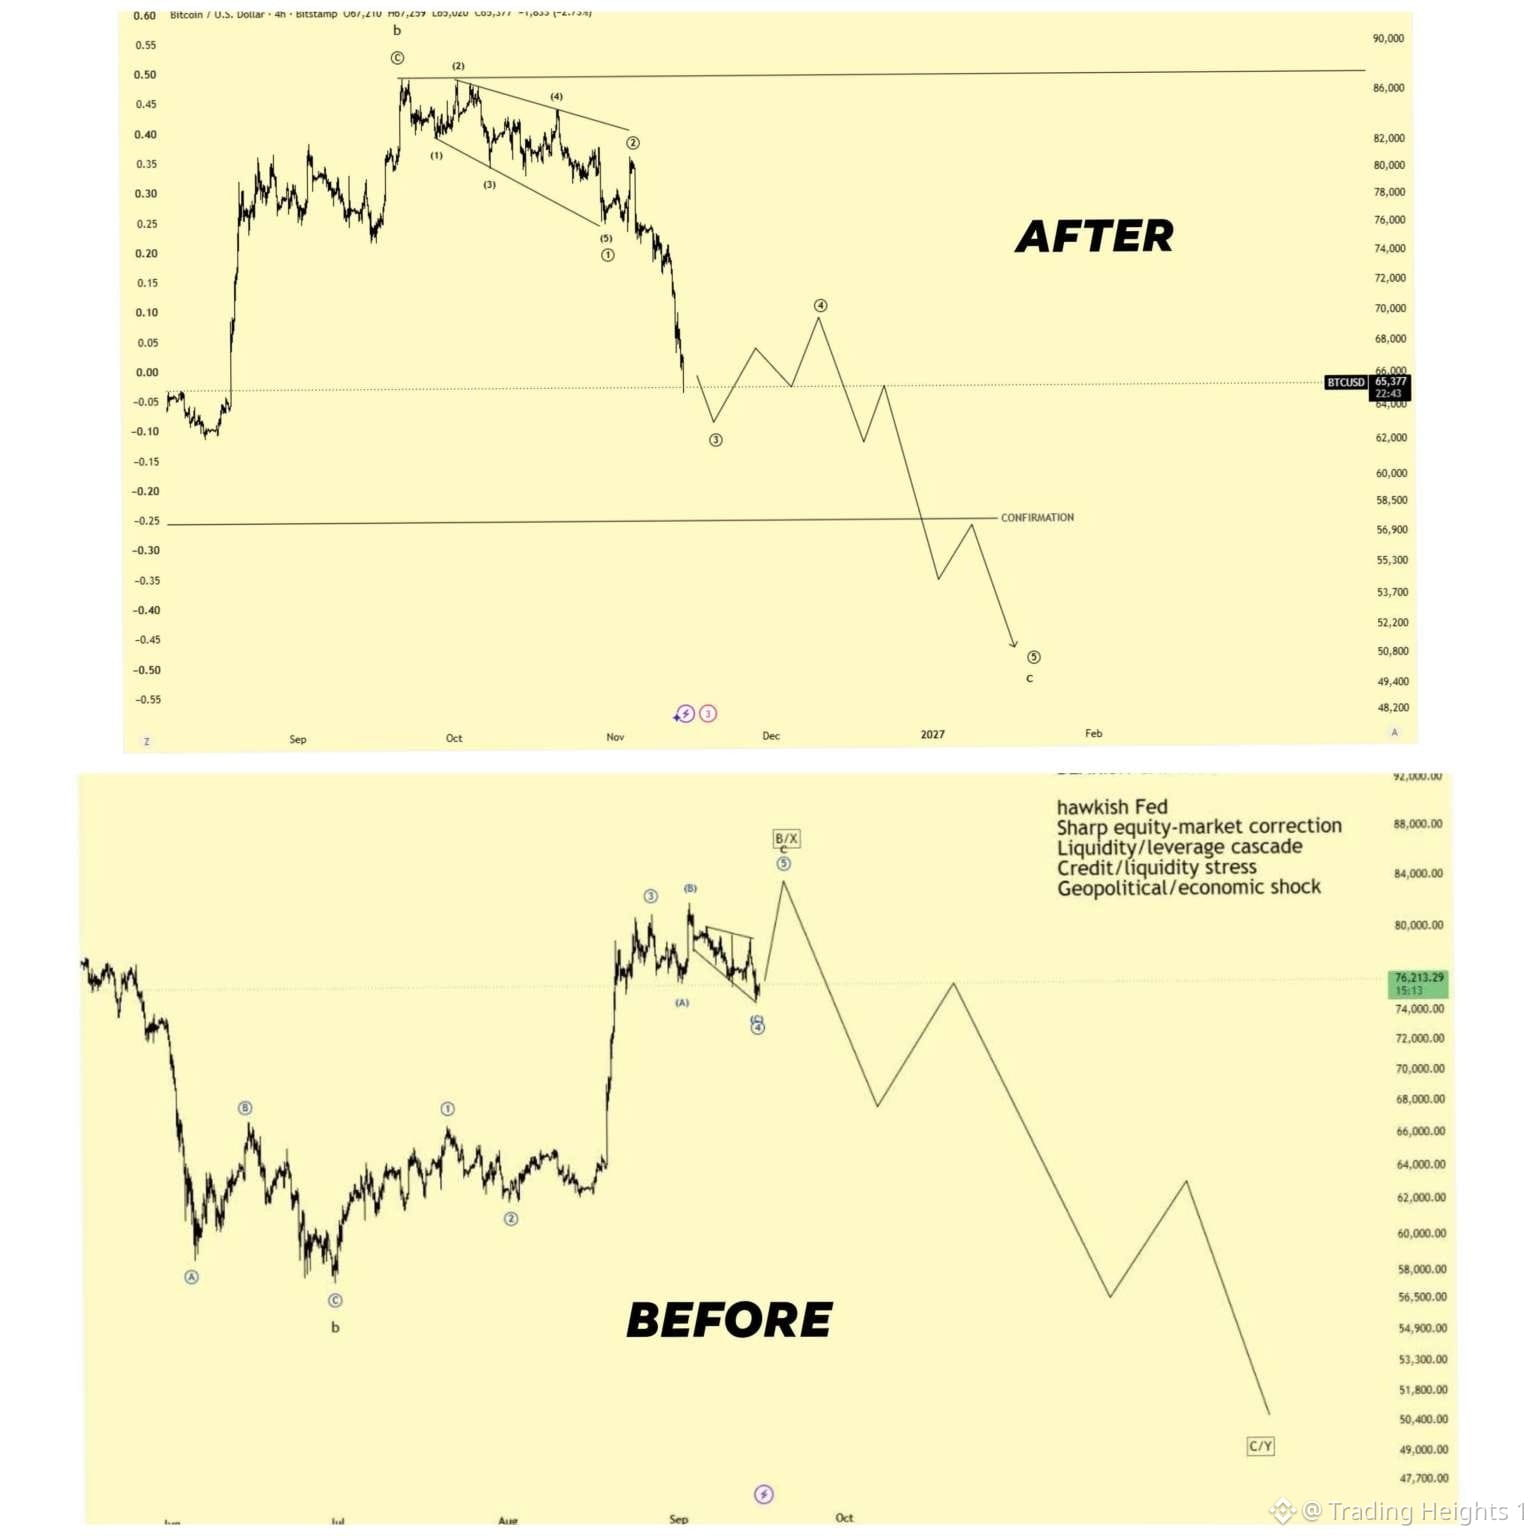
Bitcoin: An Impulsive Decline, and What Needs to Happen Next
Bitcoin has sold off hard from the $87k high, and the structure of this move tells us more than the size of it.
What I am seeing
The decline looks impulsive. It started with a series of Wave 1 and Wave 2 pairs off the $87k high, then delivered a direct Wave 3 from $81k down to $62k.
That drop landed in the $62k to $64k zone, which is the most heavily traded level on the chart and a key area of support.
What the count needs from here
If this count is correct, the multiple 1s and 2s that started the move need to be balanced by multiple 4s and 5s to finish it.
In practice, that means a sequence of bounces (Wave 4s), each followed by a lower low (Wave 5s). There are three potential Wave 4s to work through before the larger structure is complete. On my chart, that path points toward the key 2024 support zone between $49k and $54k.
Daily RSI: a relief bounce is due
The Daily RSI dropped below 20 and looks to have bottomed. From here I would expect a short term relief bounce, which would make up the first of those three potential Wave 4s.
What we want to see next is bullish divergence forming, similar to what we saw in June. That means price making a series of lower lows while the RSI makes higher lows. It is a sign that selling momentum is fading even as price keeps falling.
Weekly RSI: more work to do
The Weekly RSI has only dropped to 38. That is well short of the February low of 27 and the June low of 32.
My expectation here is the same as on the Daily. I would look for lower lows in price while the Weekly RSI makes higher lows, giving us bullish divergence on the higher timeframe as well.
The short version
1. The decline from $87k looks impulsive, with Wave 3 running from $81k to $62k
2. Price is sitting in the most traded zone on the chart at $62k to $64k
3. A relief bounce from here would be the first of three potential Wave 4s
$BTC #BTC Price Analysis#
Bitcoin: An Impulsive Decline, and What Needs to Happen Next
Bitcoin has sold off hard from the $87k high, and the structure of this move tells us more than the size of it.
What I am seeing
The decline looks impulsive. It started with a series of Wave 1 and Wave 2 pairs off the $87k high, then delivered a direct Wave 3 from $81k down to $62k.
That drop landed in the $62k to $64k zone, which is the most heavily traded level on the chart and a key area of support.
What the count needs from here
If this count is correct, the multiple 1s and 2s that started the move need to be balanced by multiple 4s and 5s to finish it.
In practice, that means a sequence of bounces (Wave 4s), each followed by a lower low (Wave 5s). There are three potential Wave 4s to work through before the larger structure is complete. On my chart, that path points toward the key 2024 support zone between $49k and $54k.
Daily RSI: a relief bounce is due
The Daily RSI dropped below 20 and looks to have bottomed. From here I would expect a short term relief bounce, which would make up the first of those three potential Wave 4s.
What we want to see next is bullish divergence forming, similar to what we saw in June. That means price making a series of lower lows while the RSI makes higher lows. It is a sign that selling momentum is fading even as price keeps falling.
Weekly RSI: more work to do
The Weekly RSI has only dropped to 38. That is well short of the February low of 27 and the June low of 32.
My expectation here is the same as on the Daily. I would look for lower lows in price while the Weekly RSI makes higher lows, giving us bullish divergence on the higher timeframe as well.
The short version
1. The decline from $87k looks impulsive, with Wave 3 running from $81k to $62k
2. Price is sitting in the most traded zone on the chart at $62k to $64k
3. A relief bounce from here would be the first of three potential Wave 4s
$BTC #BTC Price Analysis#
Bitcoin has sold off hard from the $87k high, and the structure of this move tells us more than the size of it.
What I am seeing
The decline looks impulsive. It started with a series of Wave 1 and Wave 2 pairs off the $87k high, then delivered a direct Wave 3 from $81k down to $62k.
That drop landed in the $62k to $64k zone, which is the most heavily traded level on the chart and a key area of support.
What the count needs from here
If this count is correct, the multiple 1s and 2s that started the move need to be balanced by multiple 4s and 5s to finish it.
In practice, that means a sequence of bounces (Wave 4s), each followed by a lower low (Wave 5s). There are three potential Wave 4s to work through before the larger structure is complete. On my chart, that path points toward the key 2024 support zone between $49k and $54k.
Daily RSI: a relief bounce is due
The Daily RSI dropped below 20 and looks to have bottomed. From here I would expect a short term relief bounce, which would make up the first of those three potential Wave 4s.
What we want to see next is bullish divergence forming, similar to what we saw in June. That means price making a series of lower lows while the RSI makes higher lows. It is a sign that selling momentum is fading even as price keeps falling.
Weekly RSI: more work to do
The Weekly RSI has only dropped to 38. That is well short of the February low of 27 and the June low of 32.
My expectation here is the same as on the Daily. I would look for lower lows in price while the Weekly RSI makes higher lows, giving us bullish divergence on the higher timeframe as well.
The short version
1. The decline from $87k looks impulsive, with Wave 3 running from $81k to $62k
2. Price is sitting in the most traded zone on the chart at $62k to $64k
3. A relief bounce from here would be the first of three potential Wave 4s
$BTC #BTC Price Analysis#
62
Every time I post my Expanded Flat thesis, at least 90% of traders laugh at it.
But at this point, I'm assigning the Expanded Flat the highest probability of playing out.
A decisive break below the $57K local low would significantly strengthen this scenario and increase the probability of the Expanded Flat playing out. If that happens, my downside targets of $40K–$50K could become reachable. #BTC Price Analysis#
$BTC
Every time I post my Expanded Flat thesis, at least 90% of traders laugh at it.
But at this point, I'm assigning the Expanded Flat the highest probability of playing out.
A decisive break below the $57K local low would significantly strengthen this scenario and increase the probability of the Expanded Flat playing out. If that happens, my downside targets of $40K–$50K could become reachable. #BTC Price Analysis#
$BTC
But at this point, I'm assigning the Expanded Flat the highest probability of playing out.
A decisive break below the $57K local low would significantly strengthen this scenario and increase the probability of the Expanded Flat playing out. If that happens, my downside targets of $40K–$50K could become reachable. #BTC Price Analysis#
$BTC
62
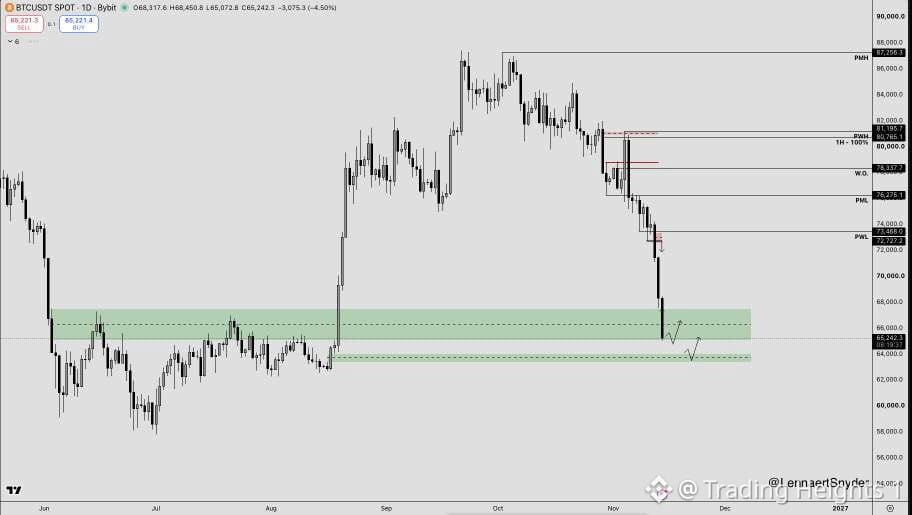
$BTC is currently testing crucial support levels.
We tapped the bottom of the 65.1K imbalance, with the last line of defence at the daily 63.7K imbalance below.
As long as the daily bodies close within these regions we hold. Seeing body closures below 62.7K would be a very weak sign.
So going into next week it will be very important to monitor the daily closes on Bitcoin.
Both regions are valid for longs after the trigger if we hold them on the daily.
This drop happened on a Saturday, and we all know that weekend moves get retested/erased in the next week.
Just like that, we completely retraced the 63K impulse, great volatility though.
$BTC #BTC Price Analysis#
$BTC is currently testing crucial support levels.
We tapped the bottom of the 65.1K imbalance, with the last line of defence at the daily 63.7K imbalance below.
As long as the daily bodies close within these regions we hold. Seeing body closures below 62.7K would be a very weak sign.
So going into next week it will be very important to monitor the daily closes on Bitcoin.
Both regions are valid for longs after the trigger if we hold them on the daily.
This drop happened on a Saturday, and we all know that weekend moves get retested/erased in the next week.
Just like that, we completely retraced the 63K impulse, great volatility though.
$BTC #BTC Price Analysis#
We tapped the bottom of the 65.1K imbalance, with the last line of defence at the daily 63.7K imbalance below.
As long as the daily bodies close within these regions we hold. Seeing body closures below 62.7K would be a very weak sign.
So going into next week it will be very important to monitor the daily closes on Bitcoin.
Both regions are valid for longs after the trigger if we hold them on the daily.
This drop happened on a Saturday, and we all know that weekend moves get retested/erased in the next week.
Just like that, we completely retraced the 63K impulse, great volatility though.
$BTC #BTC Price Analysis#
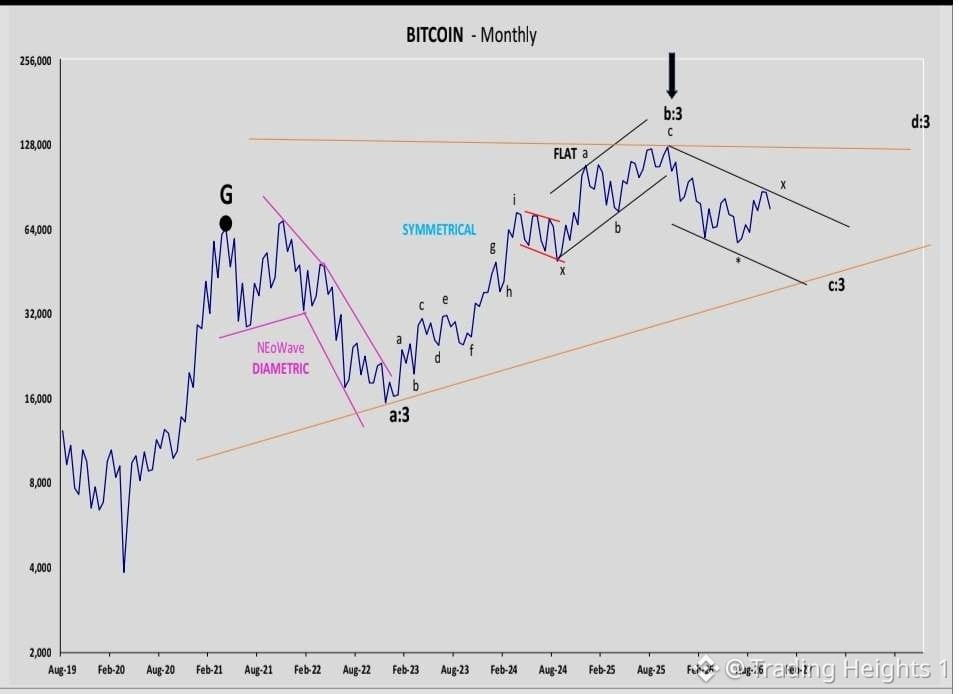
🚨 𝐁𝐈𝐓𝐂𝐎𝐈𝐍 𝐌𝐀𝐘 𝐅𝐀𝐂𝐄 𝐀 𝐃𝐄𝐄𝐏𝐄𝐑 𝐁𝐄𝐀𝐑 𝐌𝐀𝐑𝐊𝐄𝐓!
🔶 Bitcoin's decline from the 2021 high may be forming a massive contracting Triangle.
🔶 Current decline is potentially Wave C, with Wave D and Wave E still ahead.
🔶 Long-term downside target remains below $50,000, with a possible drop under $40,000 during 2027.
🔶 Temporary rallies may not necessarily signal a new bull market.
𝐓𝐇𝐄 𝐁𝐈𝐆𝐆𝐄𝐑 𝐏𝐈𝐂𝐓𝐔𝐑𝐄 𝐌𝐀𝐓𝐓𝐄𝐑𝐒! Don't mistake every bounce for a trend reversal.
#Bitcoin Price Prediction: What is Bitcoins next move?# $BTC
🚨 𝐁𝐈𝐓𝐂𝐎𝐈𝐍 𝐌𝐀𝐘 𝐅𝐀𝐂𝐄 𝐀 𝐃𝐄𝐄𝐏𝐄𝐑 𝐁𝐄𝐀𝐑 𝐌𝐀𝐑𝐊𝐄𝐓!
🔶 Bitcoin's decline from the 2021 high may be forming a massive contracting Triangle.
🔶 Current decline is potentially Wave C, with Wave D and Wave E still ahead.
🔶 Long-term downside target remains below $50,000, with a possible drop under $40,000 during 2027.
🔶 Temporary rallies may not necessarily signal a new bull market.
𝐓𝐇𝐄 𝐁𝐈𝐆𝐆𝐄𝐑 𝐏𝐈𝐂𝐓𝐔𝐑𝐄 𝐌𝐀𝐓𝐓𝐄𝐑𝐒! Don't mistake every bounce for a trend reversal.
#Bitcoin Price Prediction: What is Bitcoins next move?# $BTC
🔶 Bitcoin's decline from the 2021 high may be forming a massive contracting Triangle.
🔶 Current decline is potentially Wave C, with Wave D and Wave E still ahead.
🔶 Long-term downside target remains below $50,000, with a possible drop under $40,000 during 2027.
🔶 Temporary rallies may not necessarily signal a new bull market.
𝐓𝐇𝐄 𝐁𝐈𝐆𝐆𝐄𝐑 𝐏𝐈𝐂𝐓𝐔𝐑𝐄 𝐌𝐀𝐓𝐓𝐄𝐑𝐒! Don't mistake every bounce for a trend reversal.
#Bitcoin Price Prediction: What is Bitcoins next move?# $BTC
70
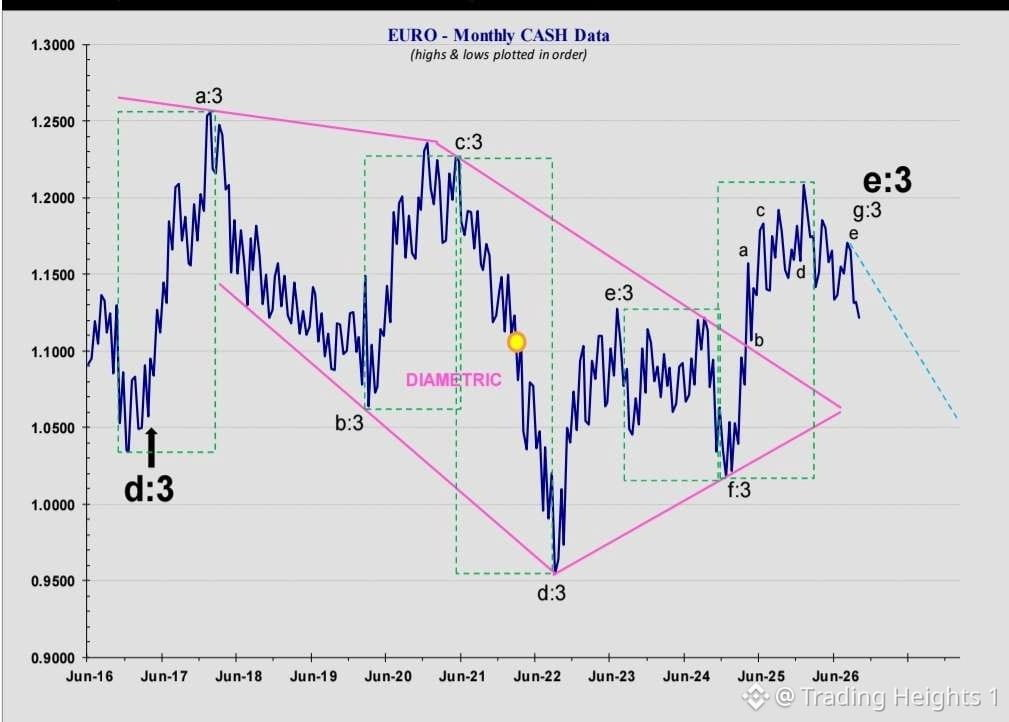
𝐄𝐔𝐑𝐎 𝐎𝐔𝐓𝐋𝐎𝐎𝐊: 𝐀 𝐍𝐄𝐖 𝐌𝐔𝐋𝐓𝐈-𝐘𝐄𝐀𝐑 𝐁𝐄𝐀𝐑 𝐌𝐀𝐑𝐊𝐄𝐓?
🔸 The EUR/USD monthly chart is showing a potential completion of a major NEoWave Diametric structure.
🔸 Five waves (a-c-d-f-g) have developed with remarkably similar time durations, strengthening the Diametric interpretation.
🔸 The sharp decline from the August 2026 high raises the possibility that a major bearish phase has begun.
🔸 According to this analysis, waves e, g and the larger e may already be complete.
🔸 𝐖𝐡𝐚𝐭 𝐂𝐨𝐦𝐞𝐬 𝐍𝐞𝐱𝐭?
➮ Further downside is expected during the remainder of 2026 to strengthen confirmation of the larger bearish structure.
➮ If confirmed, this scenario could indicate a new multi-year bear market, potentially lasting 5–10 years.
💎 𝐊𝐞𝐲 𝐓𝐚𝐤𝐞𝐚𝐰𝐚𝐲
The August 2026 high could become a significant long-term turning point for the Euro. However, further price action is required before declaring the larger bearish pattern fully confirmed.
Technical analysis is a scenario, not a certainty.
$EURC
𝐄𝐔𝐑𝐎 𝐎𝐔𝐓𝐋𝐎𝐎𝐊: 𝐀 𝐍𝐄𝐖 𝐌𝐔𝐋𝐓𝐈-𝐘𝐄𝐀𝐑 𝐁𝐄𝐀𝐑 𝐌𝐀𝐑𝐊𝐄𝐓?
🔸 The EUR/USD monthly chart is showing a potential completion of a major NEoWave Diametric structure.
🔸 Five waves (a-c-d-f-g) have developed with remarkably similar time durations, strengthening the Diametric interpretation.
🔸 The sharp decline from the August 2026 high raises the possibility that a major bearish phase has begun.
🔸 According to this analysis, waves e, g and the larger e may already be complete.
🔸 𝐖𝐡𝐚𝐭 𝐂𝐨𝐦𝐞𝐬 𝐍𝐞𝐱𝐭?
➮ Further downside is expected during the remainder of 2026 to strengthen confirmation of the larger bearish structure.
➮ If confirmed, this scenario could indicate a new multi-year bear market, potentially lasting 5–10 years.
💎 𝐊𝐞𝐲 𝐓𝐚𝐤𝐞𝐚𝐰𝐚𝐲
The August 2026 high could become a significant long-term turning point for the Euro. However, further price action is required before declaring the larger bearish pattern fully confirmed.
Technical analysis is a scenario, not a certainty.
$EURC
🔸 The EUR/USD monthly chart is showing a potential completion of a major NEoWave Diametric structure.
🔸 Five waves (a-c-d-f-g) have developed with remarkably similar time durations, strengthening the Diametric interpretation.
🔸 The sharp decline from the August 2026 high raises the possibility that a major bearish phase has begun.
🔸 According to this analysis, waves e, g and the larger e may already be complete.
🔸 𝐖𝐡𝐚𝐭 𝐂𝐨𝐦𝐞𝐬 𝐍𝐞𝐱𝐭?
➮ Further downside is expected during the remainder of 2026 to strengthen confirmation of the larger bearish structure.
➮ If confirmed, this scenario could indicate a new multi-year bear market, potentially lasting 5–10 years.
💎 𝐊𝐞𝐲 𝐓𝐚𝐤𝐞𝐚𝐰𝐚𝐲
The August 2026 high could become a significant long-term turning point for the Euro. However, further price action is required before declaring the larger bearish pattern fully confirmed.
Technical analysis is a scenario, not a certainty.
$EURC
66
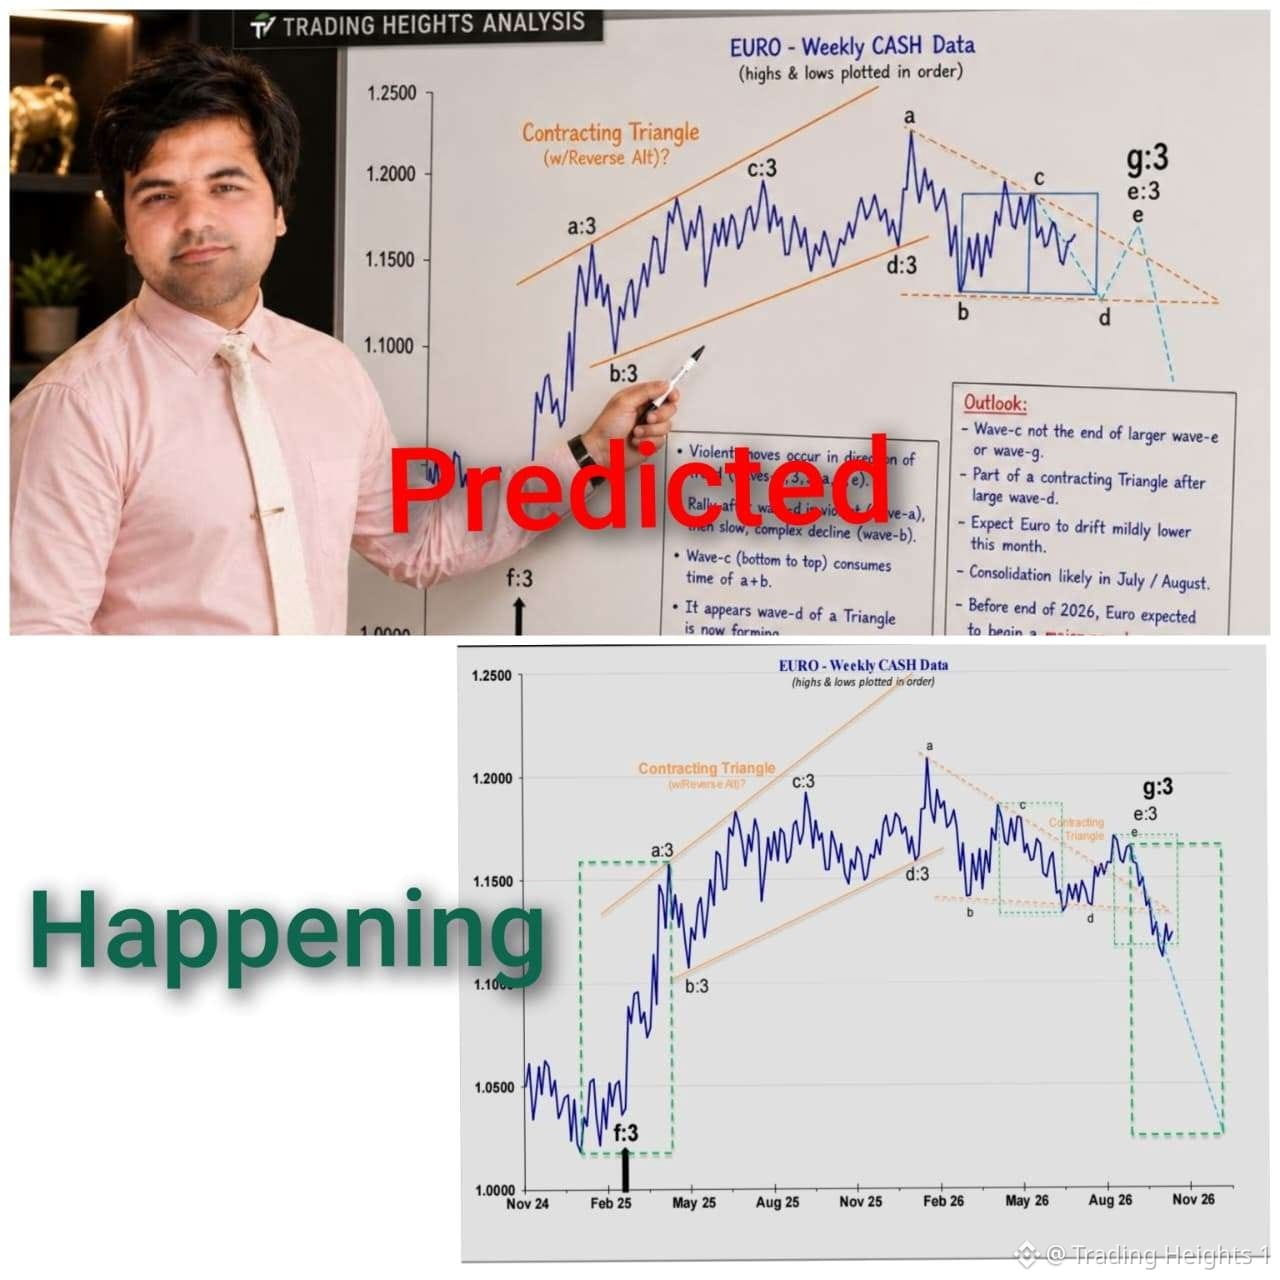
𝐄𝐔𝐑𝐎 𝐏𝐑𝐄𝐃𝐈𝐂𝐓𝐈𝐎𝐍: 𝐅𝐎𝐑𝐄𝐂𝐀𝐒𝐓 𝐕𝐒 𝐑𝐄𝐀𝐋𝐈𝐓𝐘 📉
💎 🟠 Our earlier EUR/USD analysis anticipated a contracting triangle and further downside.
💎 🟠 The projected bearish move is now unfolding, with price following the expected path.
💎 🟠 The broader wave structure still suggests potential weakness ahead.
💎 🟠 The next projected downside zone remains around 1.03, subject to confirmation.
🎯 The power of technical analysis is identifying potential market moves before they happen.
📊 Prediction made. Market is responding. Discipline over emotions!
$EUROP $EURC
𝐄𝐔𝐑𝐎 𝐏𝐑𝐄𝐃𝐈𝐂𝐓𝐈𝐎𝐍: 𝐅𝐎𝐑𝐄𝐂𝐀𝐒𝐓 𝐕𝐒 𝐑𝐄𝐀𝐋𝐈𝐓𝐘 📉
💎 🟠 Our earlier EUR/USD analysis anticipated a contracting triangle and further downside.
💎 🟠 The projected bearish move is now unfolding, with price following the expected path.
💎 🟠 The broader wave structure still suggests potential weakness ahead.
💎 🟠 The next projected downside zone remains around 1.03, subject to confirmation.
🎯 The power of technical analysis is identifying potential market moves before they happen.
📊 Prediction made. Market is responding. Discipline over emotions!
$EUROP $EURC
💎 🟠 Our earlier EUR/USD analysis anticipated a contracting triangle and further downside.
💎 🟠 The projected bearish move is now unfolding, with price following the expected path.
💎 🟠 The broader wave structure still suggests potential weakness ahead.
💎 🟠 The next projected downside zone remains around 1.03, subject to confirmation.
🎯 The power of technical analysis is identifying potential market moves before they happen.
📊 Prediction made. Market is responding. Discipline over emotions!
$EUROP $EURC
57
BREAKING: World's largest crypto exchange Binance hacked with over $5.6 billion stolen:
• $1.45 billion $BTC
• $875 million $ETH
• $234 million $TRX
• $50 million $XAUT
• $1.57 billion $USDT
• $823 million #USDC
• $75 million $WBETH
• $88.5 million #RLUSD
+ $447.5 million additional cryptocurrencies
This is the largest hack in crypto history.
#Macro Insights#
BREAKING: World's largest crypto exchange Binance hacked with over $5.6 billion stolen:
• $1.45 billion $BTC
• $875 million $ETH
• $234 million $TRX
• $50 million $XAUT
• $1.57 billion $USDT
• $823 million #USDC
• $75 million $WBETH
• $88.5 million #RLUSD
+ $447.5 million additional cryptocurrencies
This is the largest hack in crypto history.
#Macro Insights#
• $1.45 billion $BTC
• $875 million $ETH
• $234 million $TRX
• $50 million $XAUT
• $1.57 billion $USDT
• $823 million #USDC
• $75 million $WBETH
• $88.5 million #RLUSD
+ $447.5 million additional cryptocurrencies
This is the largest hack in crypto history.
#Macro Insights#

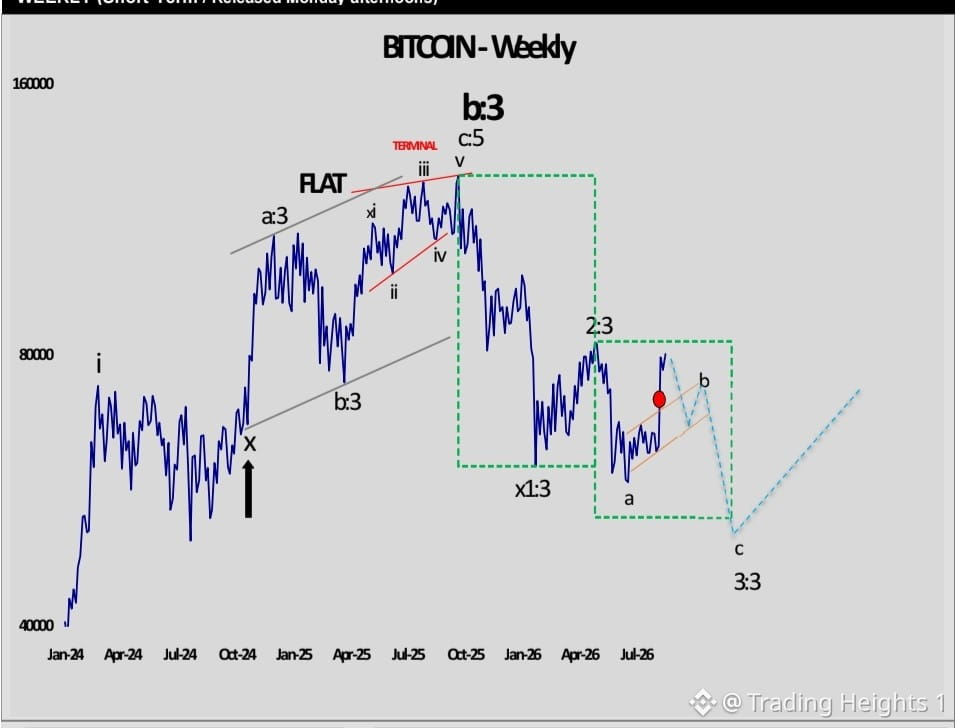
BITCOIN MARKET ALERT Possible Bearish Turn Ahead ◆ $82,815 Resistance Level ◇ Bitcoin’s recent violent rally exceeded expectations, but if BTC remains below $82,815 in the coming weeks, the rally may represent only a temporary correction. ◆ Potential Wave-3 Decline ◇ Elliott Wave analysis suggests Bitcoin could enter a larger bearish phase, with a possible target below $50,000. ◆ September Risk Zone ◇ A sizeable decline may develop into September, with the broader bearish trend potentially resuming by October. ◆ Wave-4 Recovery Possibility ◇ After a major decline, a recovery bounce could occur — but monthly charts suggest it may take 6 months or longer. ◆ Market Reaction Warning ◇ The recent surge was influenced by optimism around the CLARITY Act vote and digital asset regulation news, but sharp news-driven rallies often fade quickly. ━━━━━━━━━━━━━━━━━━ ⚠️ Disclaimer: This analysis is for educational purposes only and does not constitute financial advice. Always do your own research before making investment decisions. $BTC #BTC Price Analysis#
BITCOIN MARKET ALERT Possible Bearish Turn Ahead ◆ $82,815 Resistance Level ◇ Bitcoin’s recent violent rally exceeded expectations, but if BTC remains below $82,815 in the coming weeks, the rally may represent only a temporary correction. ◆ Potential Wave-3 Decline ◇ Elliott Wave analysis suggests Bitcoin could enter a larger bearish phase, with a possible target below $50,000. ◆ September Risk Zone ◇ A sizeable decline may develop into September, with the broader bearish trend potentially resuming by October. ◆ Wave-4 Recovery Possibility ◇ After a major decline, a recovery bounce could occur — but monthly charts suggest it may take 6 months or longer. ◆ Market Reaction Warning ◇ The recent surge was influenced by optimism around the CLARITY Act vote and digital asset regulation news, but sharp news-driven rallies often fade quickly. ━━━━━━━━━━━━━━━━━━ ⚠️ Disclaimer: This analysis is for educational purposes only and does not constitute financial advice. Always do your own research before making investment decisions. $BTC #BTC Price Analysis#
78
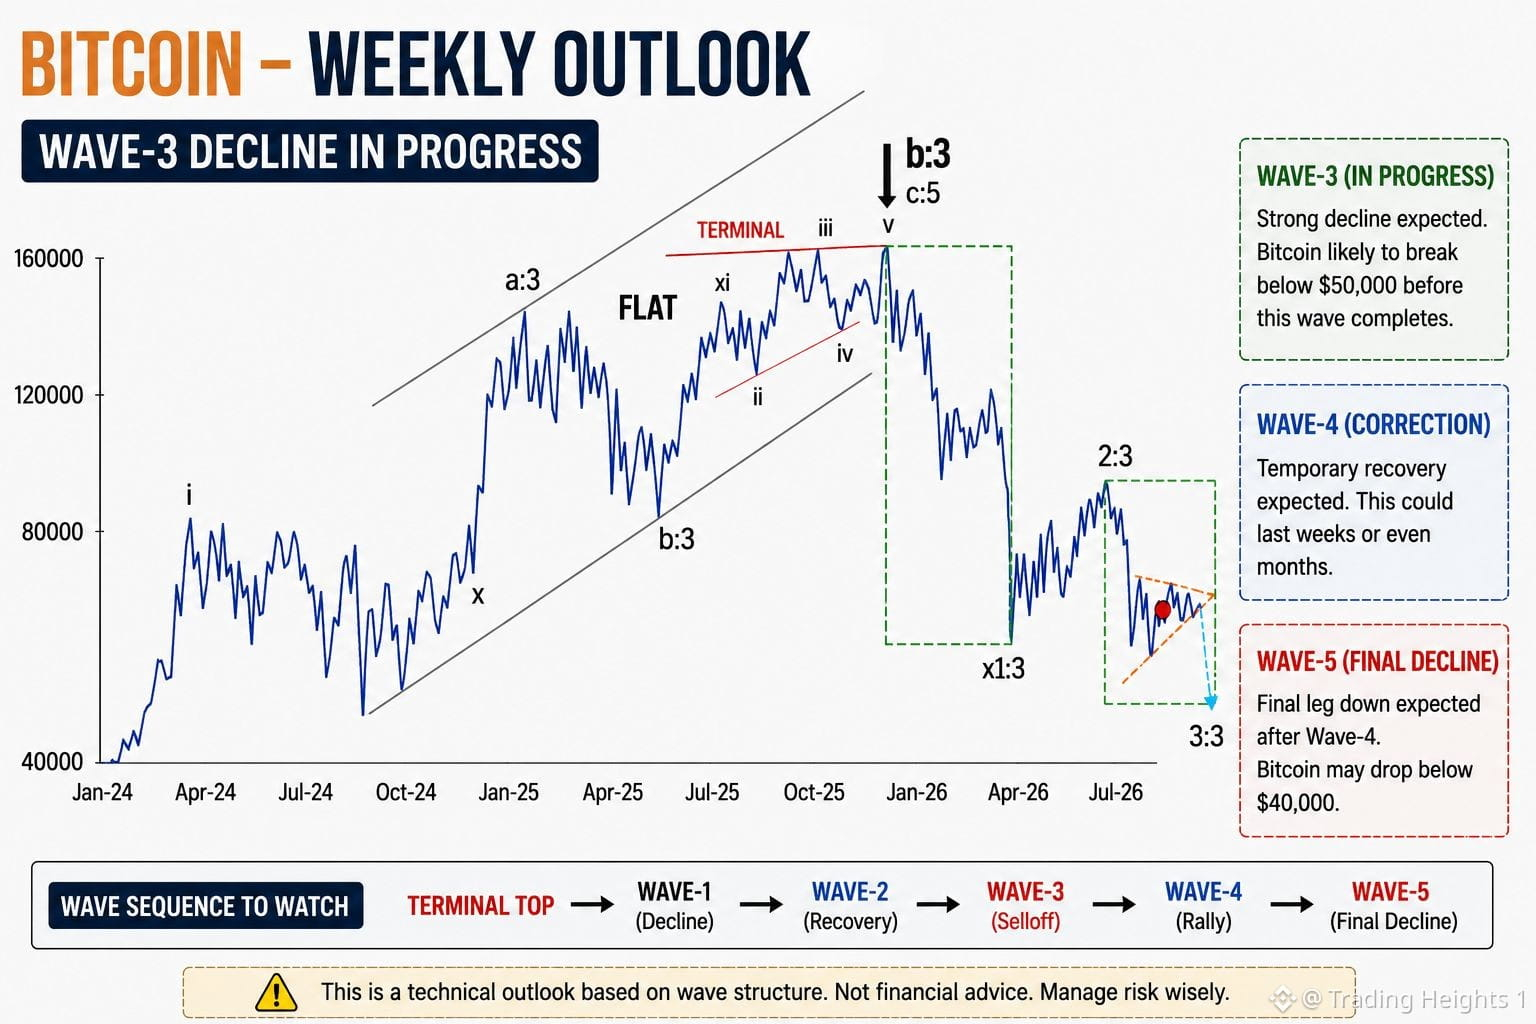
Bitcoin: Major Wave-3 Decline May Be Developing Bitcoin’s weekly structure is signaling that the market may be entering one of the most important phases of the current bearish cycle. Following the completion of a major Terminal pattern near the previous high, price entered a powerful decline labeled Wave-1. That initial selloff was followed by a corrective recovery into Wave-2, which appears to have completed around the recent local high. The key focus now is Wave-3. If the current wave interpretation remains valid, Wave-3 should become substantially more aggressive than the preceding decline. The developing structure suggests Bitcoin could break below the major $50,000 psychological level before this wave is complete. After Wave-3, a temporary Wave-4 recovery could develop and potentially last several weeks or even months. However, that rebound would not necessarily confirm a new bull market. A final Wave-5 decline could follow, with the larger bearish structure potentially pushing Bitcoin below $40,000. The critical sequence to watch is: Terminal Top → Wave-1 Decline → Wave-2 Recovery → Wave-3 Selloff → Wave-4 Rally → Wave-5 Final Decline This remains a technical scenario, not a certainty. Price behavior and structural confirmation should determine whether the bearish wave count remains valid. #Bitcoin #BTC $BTC #BTC Price Analysis#
Bitcoin: Major Wave-3 Decline May Be Developing Bitcoin’s weekly structure is signaling that the market may be entering one of the most important phases of the current bearish cycle. Following the completion of a major Terminal pattern near the previous high, price entered a powerful decline labeled Wave-1. That initial selloff was followed by a corrective recovery into Wave-2, which appears to have completed around the recent local high. The key focus now is Wave-3. If the current wave interpretation remains valid, Wave-3 should become substantially more aggressive than the preceding decline. The developing structure suggests Bitcoin could break below the major $50,000 psychological level before this wave is complete. After Wave-3, a temporary Wave-4 recovery could develop and potentially last several weeks or even months. However, that rebound would not necessarily confirm a new bull market. A final Wave-5 decline could follow, with the larger bearish structure potentially pushing Bitcoin below $40,000. The critical sequence to watch is: Terminal Top → Wave-1 Decline → Wave-2 Recovery → Wave-3 Selloff → Wave-4 Rally → Wave-5 Final Decline This remains a technical scenario, not a certainty. Price behavior and structural confirmation should determine whether the bearish wave count remains valid. #Bitcoin #BTC $BTC #BTC Price Analysis#
73
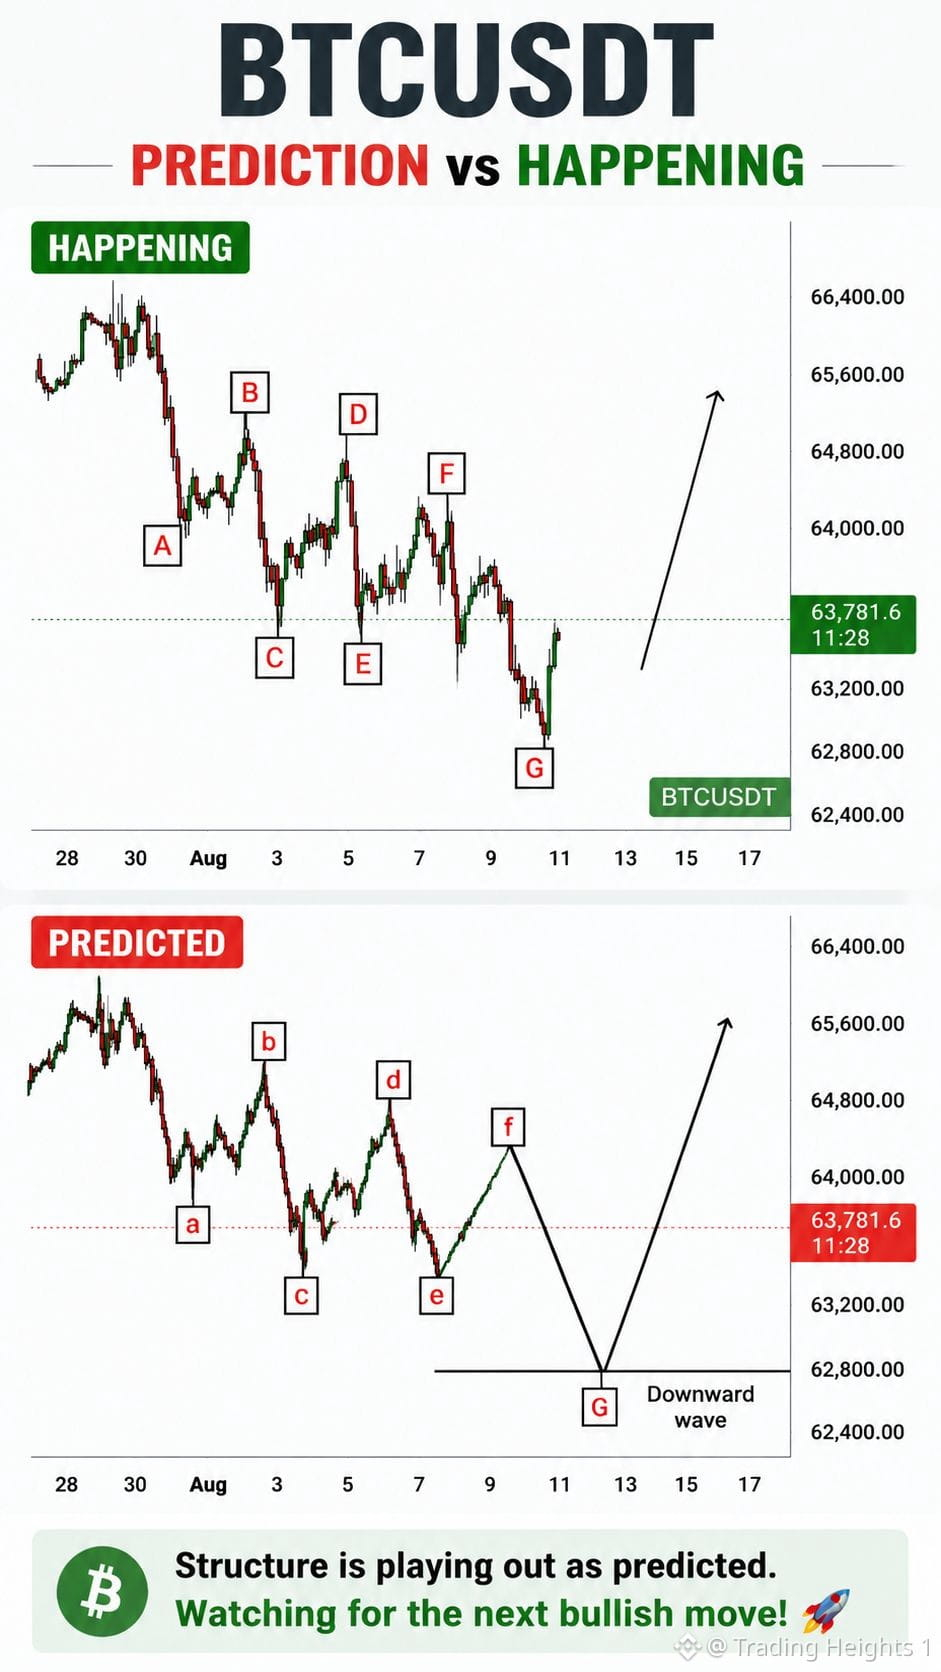
🚨 BTC Prediction vs Reality — Structure Playing Out Bitcoin is currently showing an interesting development that closely follows my previously mapped market structure. In the original analysis, I expected BTC to develop a multi-leg corrective sequence labeled A-B-C-D-E-F-G, with Wave G producing the final downward move before the possibility of a larger bullish reaction. Now, the actual market structure is developing remarkably close to that projection. Waves A through F formed a series of alternating highs and lows, followed by another strong decline toward the anticipated G region. BTC has subsequently shown an initial reaction from the lower area. The key point now is not simply that the forecast worked. What matters is whether G represents a genuine completion of the corrective structure. If the low is confirmed, Bitcoin could transition from correction into a meaningful bullish move. However, confirmation is essential. A strong recovery, improving momentum and the successful reclaim of nearby resistance would strengthen the bullish scenario. Until confirmation appears, the structure should remain under observation rather than assuming the bottom is guaranteed. Prediction ➜ Execution ➜ Confirmation. Watching BTC closely for the next major move. 📈 #Bitcoin #BTC $BTC #BTC Price Analysis#
🚨 BTC Prediction vs Reality — Structure Playing Out Bitcoin is currently showing an interesting development that closely follows my previously mapped market structure. In the original analysis, I expected BTC to develop a multi-leg corrective sequence labeled A-B-C-D-E-F-G, with Wave G producing the final downward move before the possibility of a larger bullish reaction. Now, the actual market structure is developing remarkably close to that projection. Waves A through F formed a series of alternating highs and lows, followed by another strong decline toward the anticipated G region. BTC has subsequently shown an initial reaction from the lower area. The key point now is not simply that the forecast worked. What matters is whether G represents a genuine completion of the corrective structure. If the low is confirmed, Bitcoin could transition from correction into a meaningful bullish move. However, confirmation is essential. A strong recovery, improving momentum and the successful reclaim of nearby resistance would strengthen the bullish scenario. Until confirmation appears, the structure should remain under observation rather than assuming the bottom is guaranteed. Prediction ➜ Execution ➜ Confirmation. Watching BTC closely for the next major move. 📈 #Bitcoin #BTC $BTC #BTC Price Analysis#
76
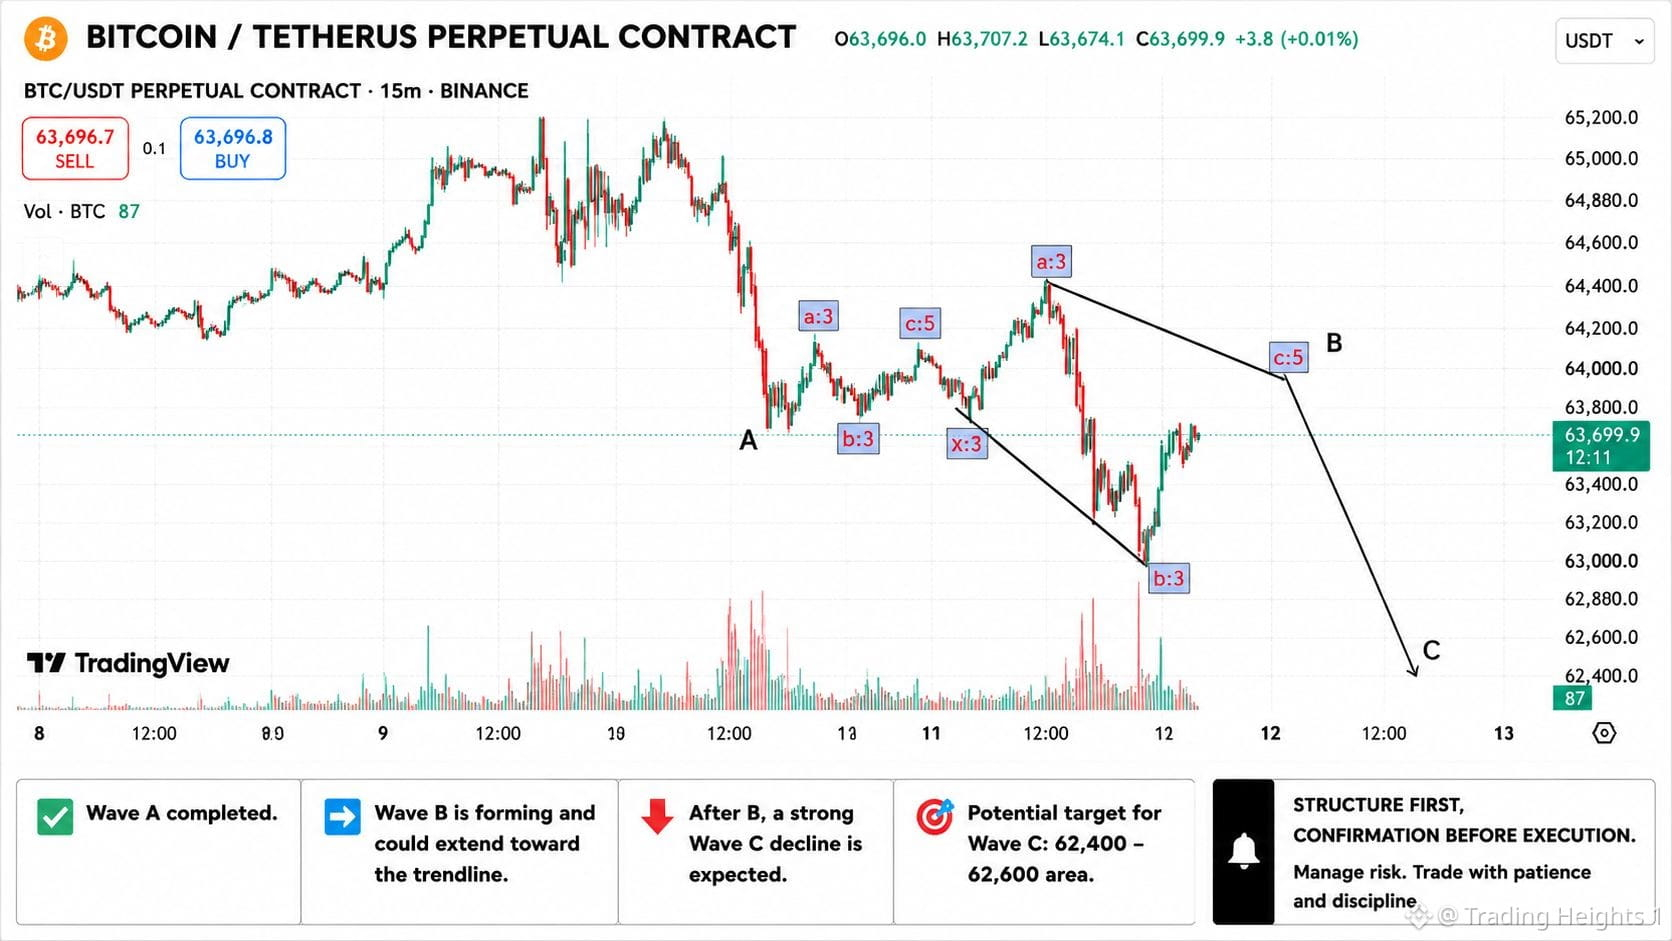
Bitcoin is developing a complex corrective structure. 📉 Wave B is expected to complete near the descending resistance before a potential Wave C decline toward the lower target zone. Structure first, confirmation before execution. #Bitcoin #BTC $BTC
Bitcoin is developing a complex corrective structure. 📉 Wave B is expected to complete near the descending resistance before a potential Wave C decline toward the lower target zone. Structure first, confirmation before execution. #Bitcoin #BTC $BTC
73
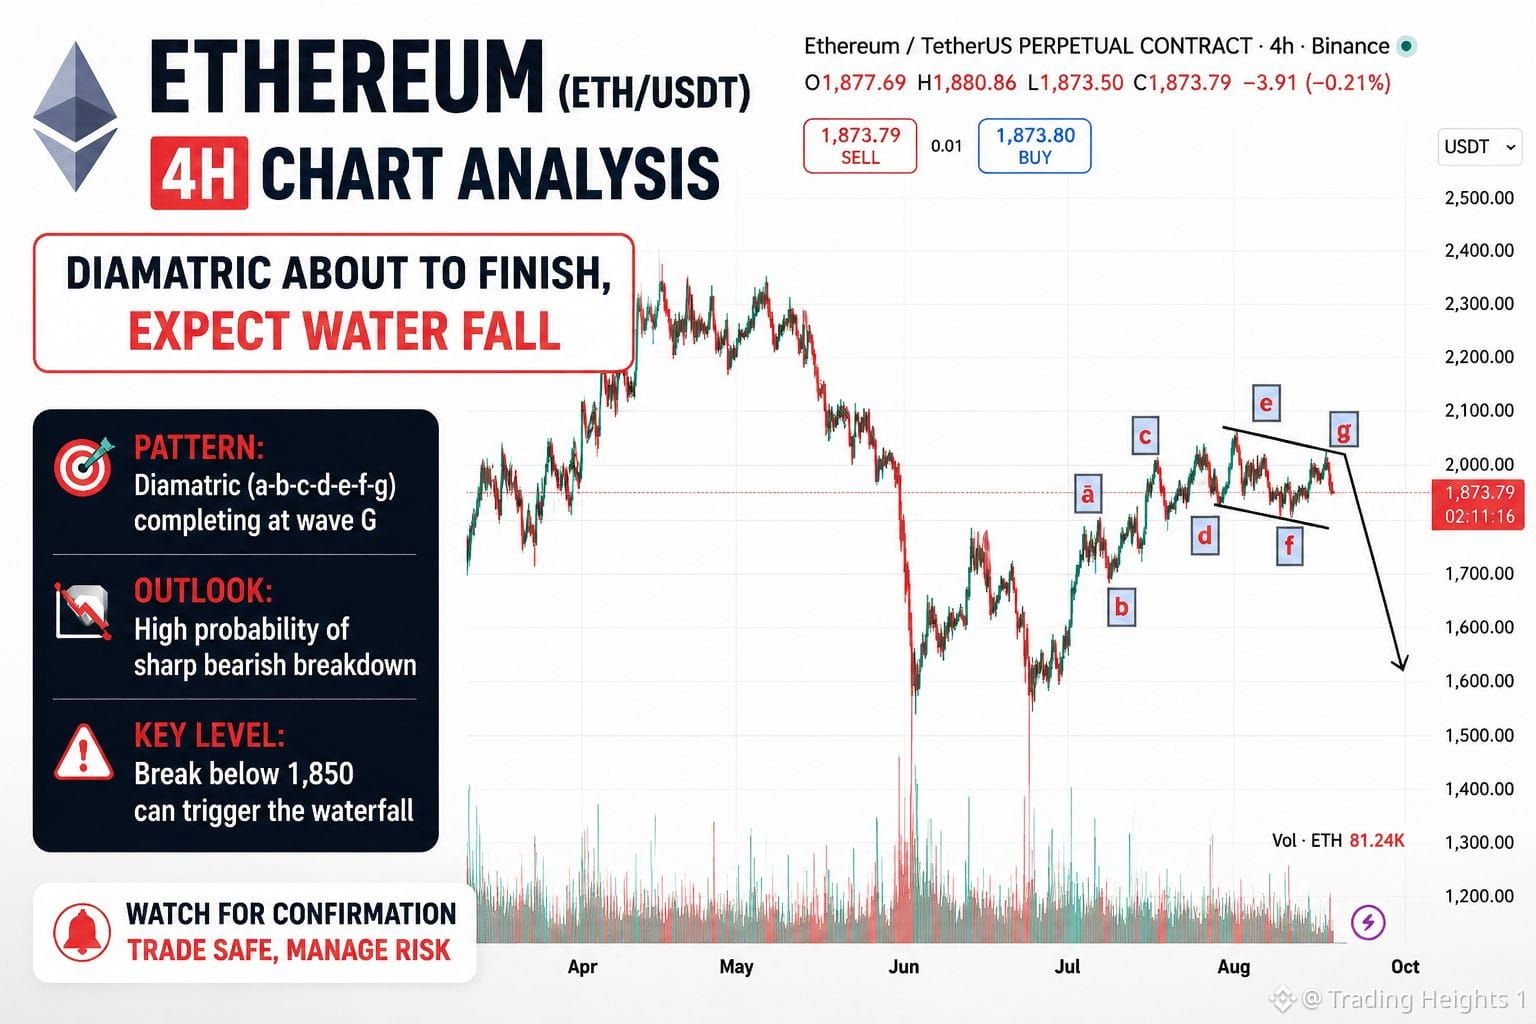
ETH 4H: Diametric structure appears close to completion around wave G. If the pattern confirms, a sharp bearish move could follow. Watching for breakdown confirmation before expecting the waterfall. 📉 #ETH #Crypto $ETH
ETH 4H: Diametric structure appears close to completion around wave G. If the pattern confirms, a sharp bearish move could follow. Watching for breakdown confirmation before expecting the waterfall. 📉 #ETH #Crypto $ETH
52
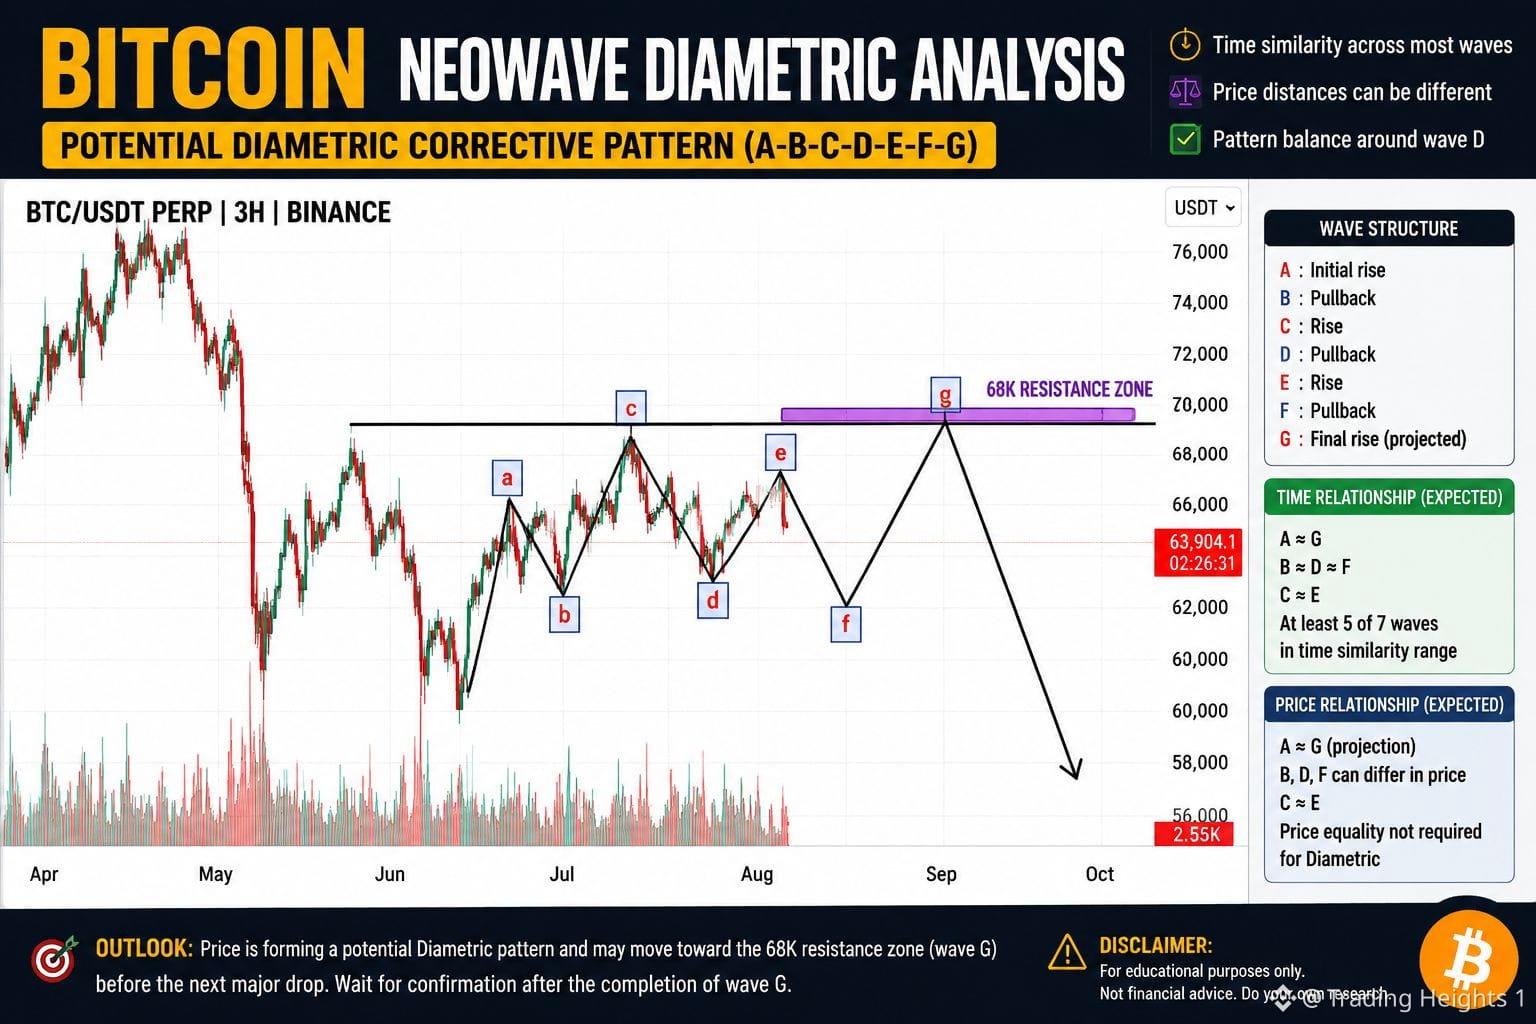
BTC appears to be forming a complex corrective structure, with price potentially moving toward the upper resistance/liquidity zone before the next major reaction. Watching the final swings closely for confirmation. #BTC #Bitcoin #BTC Price Analysis#
BTC appears to be forming a complex corrective structure, with price potentially moving toward the upper resistance/liquidity zone before the next major reaction. Watching the final swings closely for confirmation. #BTC #Bitcoin #BTC Price Analysis#
55
Войдите, чтобы посмотреть больше материала
Присоединяйтесь к пользователям криптовалют по всему миру на Binance Square
⚡️ Получайте новейшую и полезную информацию о криптоактивах.
💬 Нам доверяет крупнейшая в мире криптобиржа.
👍 Получите достоверные аналитические данные от верифицированных создателей контента.
Эл. почта/номер телефона
В тренде
NvidiaBeatsEstimatesWith$130BQ4Outlook
Просмотров: 204
7 обсуждают
Nvidia Beats With $115.8 Billion in Revenue, Guides to $130 Billion and Adds $150 Billion Buyback
Binance News
·Лайков: 18
·Просмотров: 18.6k
AnthropicIPOPriceCouldExceed$80
Просмотров: 240
24 обсуждают
CanNvidia’sDataCenterGrowthContinue?
Просмотров: 691
18 обсуждают