

AshokRomeo
59 Публикации

AshokRomeo
Отправить жалобу
Заблокировать пользователя
hello I'm ashok ,I am doing job in textile industries,my passion to become big crypto player 🙏 I will do it by my self ,best crypto trader
Трейдер с частыми сделками
5.4 г
7 подписок(и/а)
30 подписчиков(а)
36 понравилось
Посты
Все
Цитирования
·
--
Рост
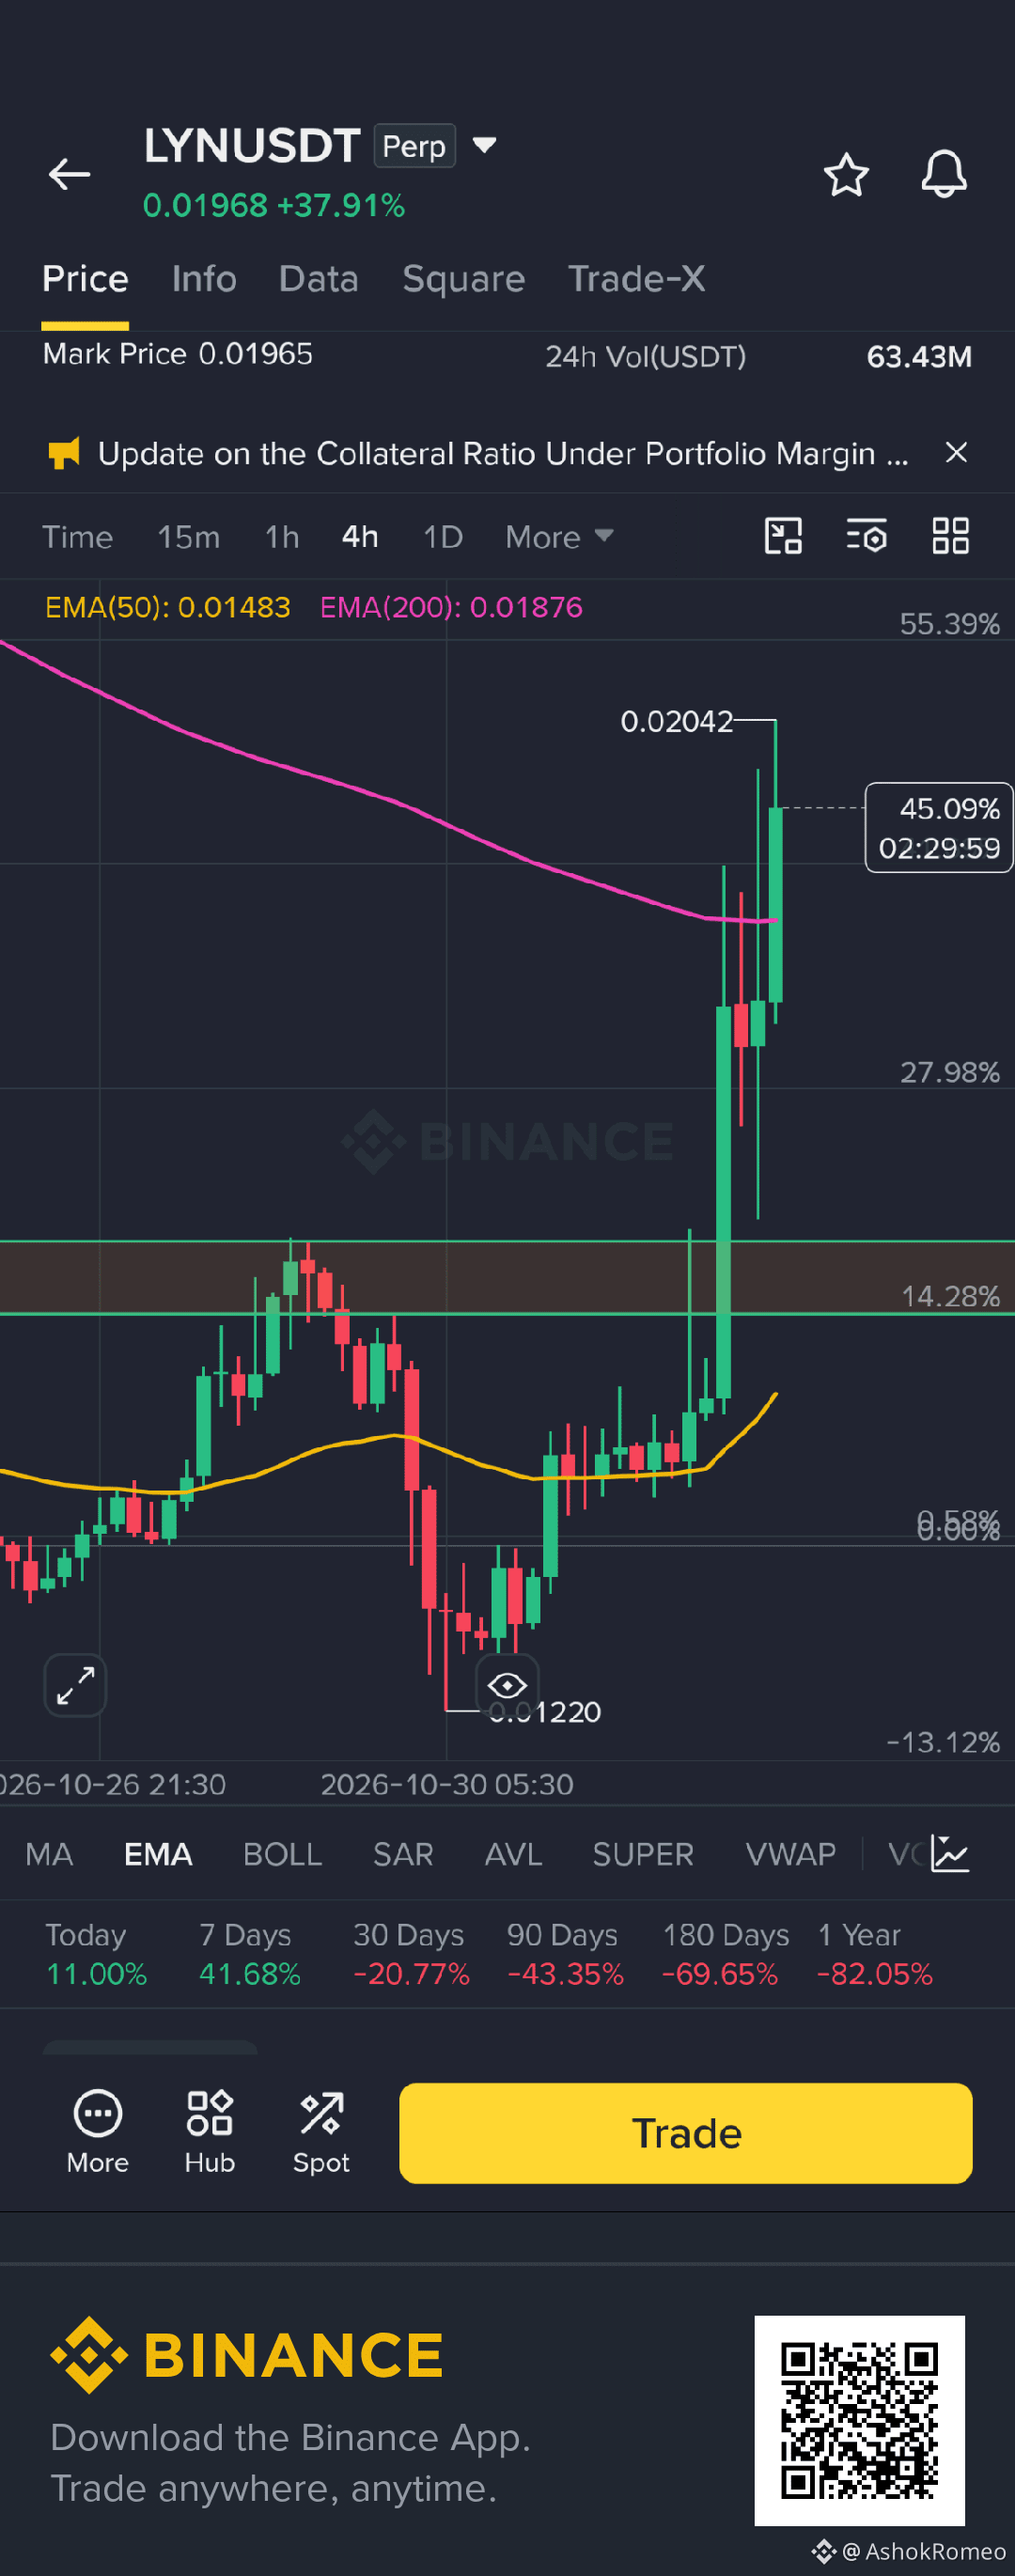
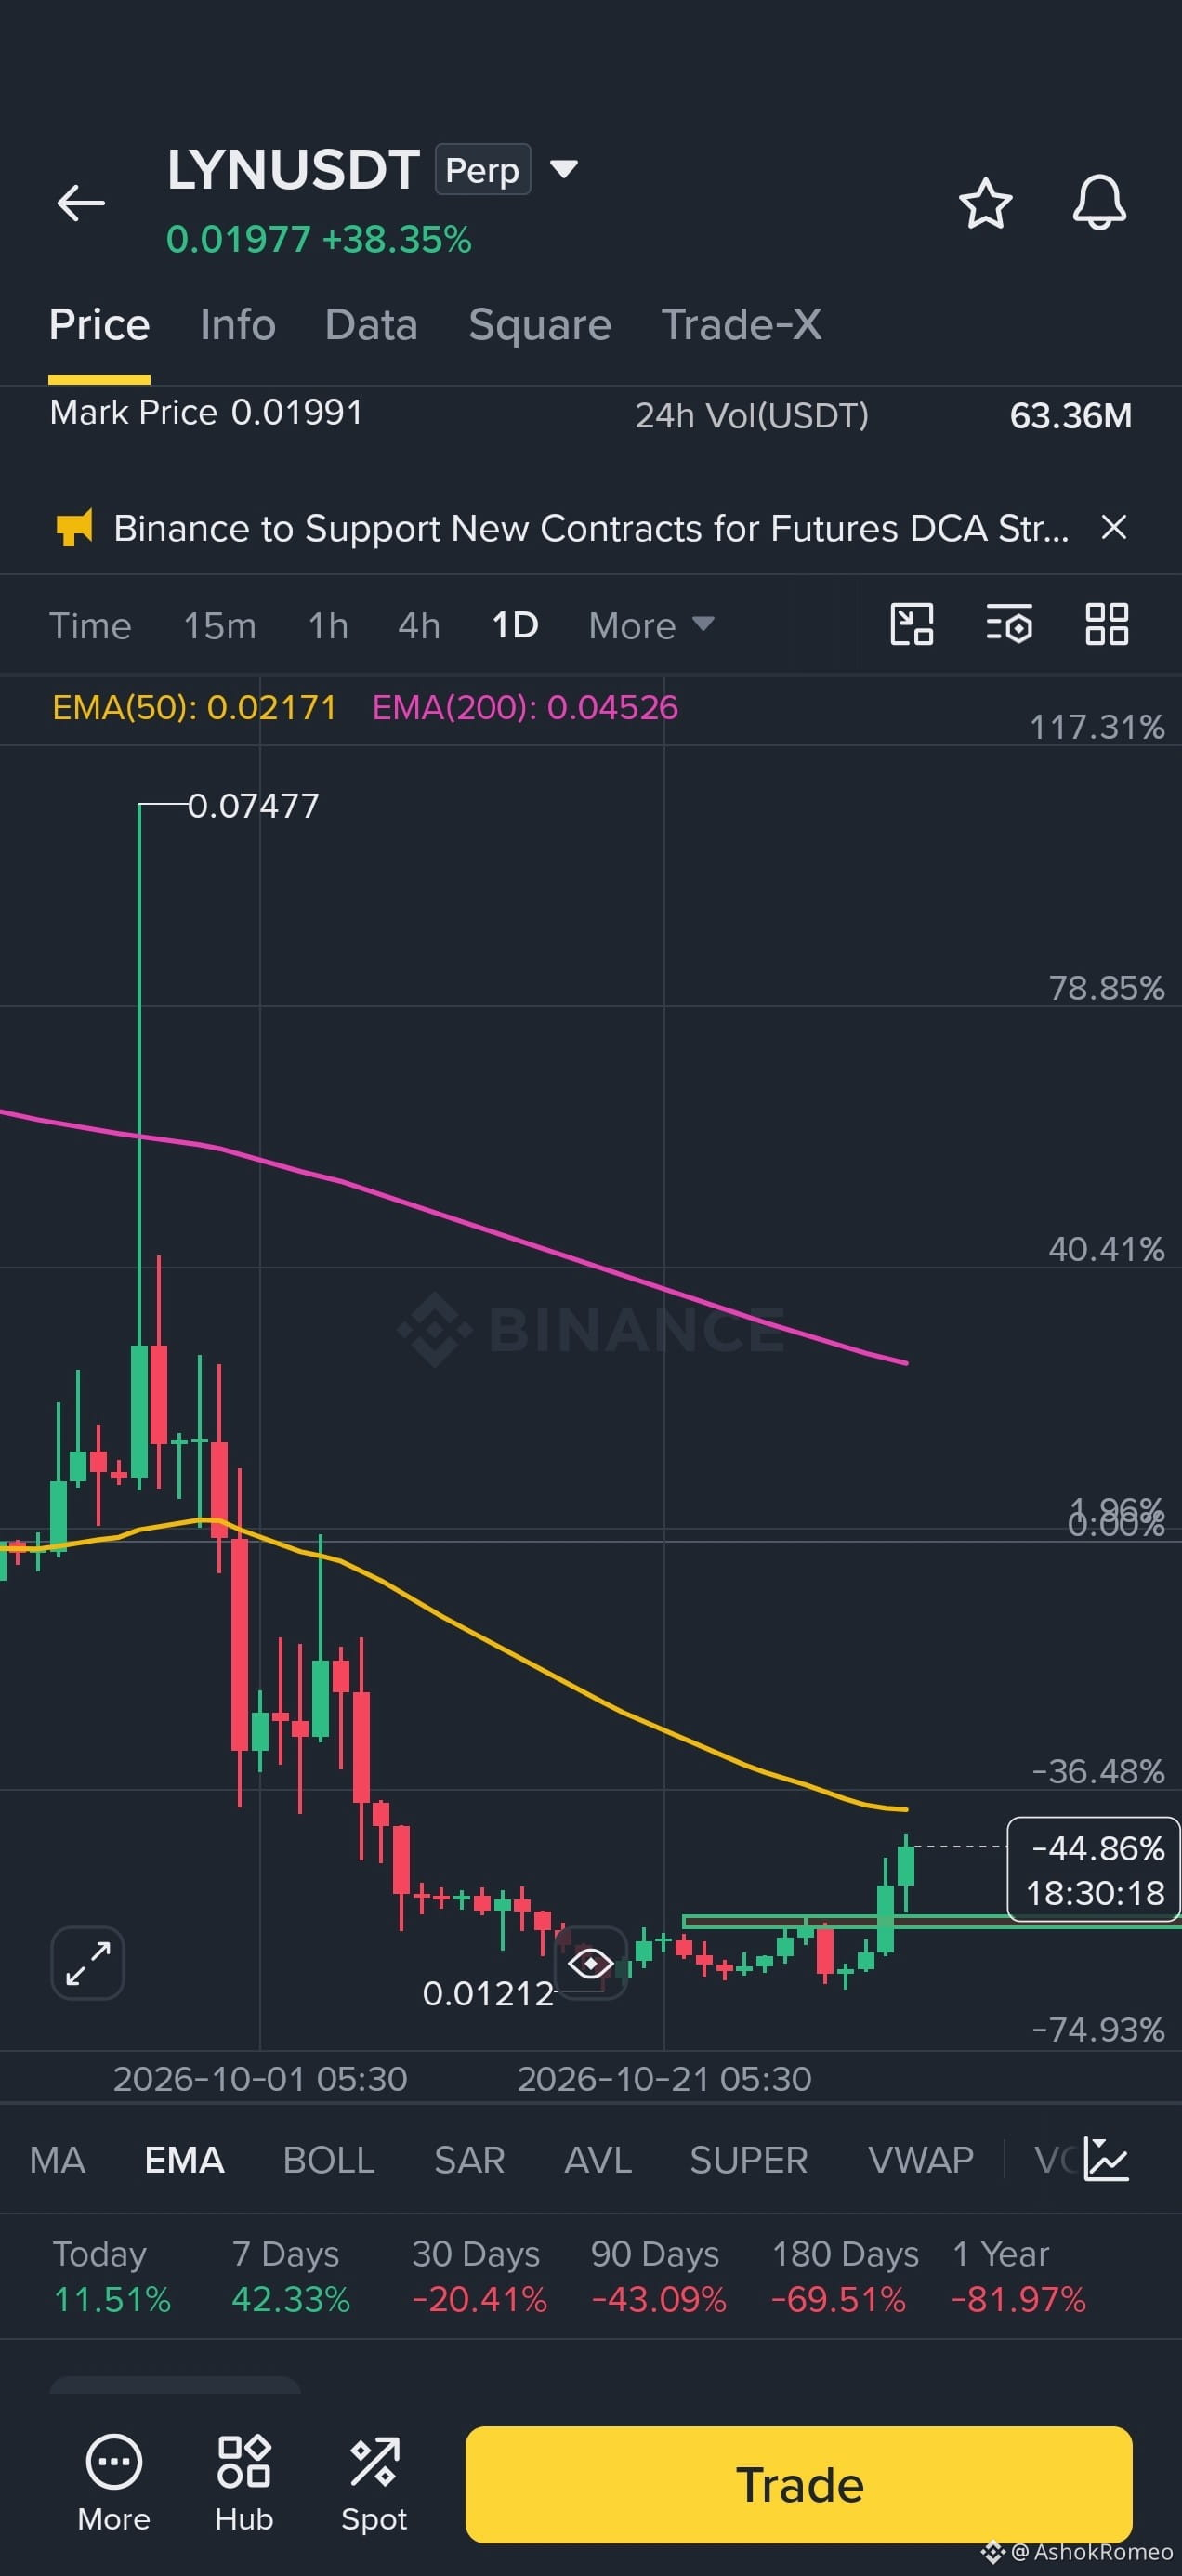
$LYN
fight start between bull vs bear
let's see who win then market going for that trend
my view is bullish
what about you ?
{future}(LYNUSDT)
$LYN
fight start between bull vs bear
let's see who win then market going for that trend
my view is bullish
what about you ?
fight start between bull vs bear
let's see who win then market going for that trend
my view is bullish
what about you ?
2
256
·
--
Рост
$HYPE is ready to fly 💸
$HYPE is ready to fly 💸
AshokRomeo
·
--
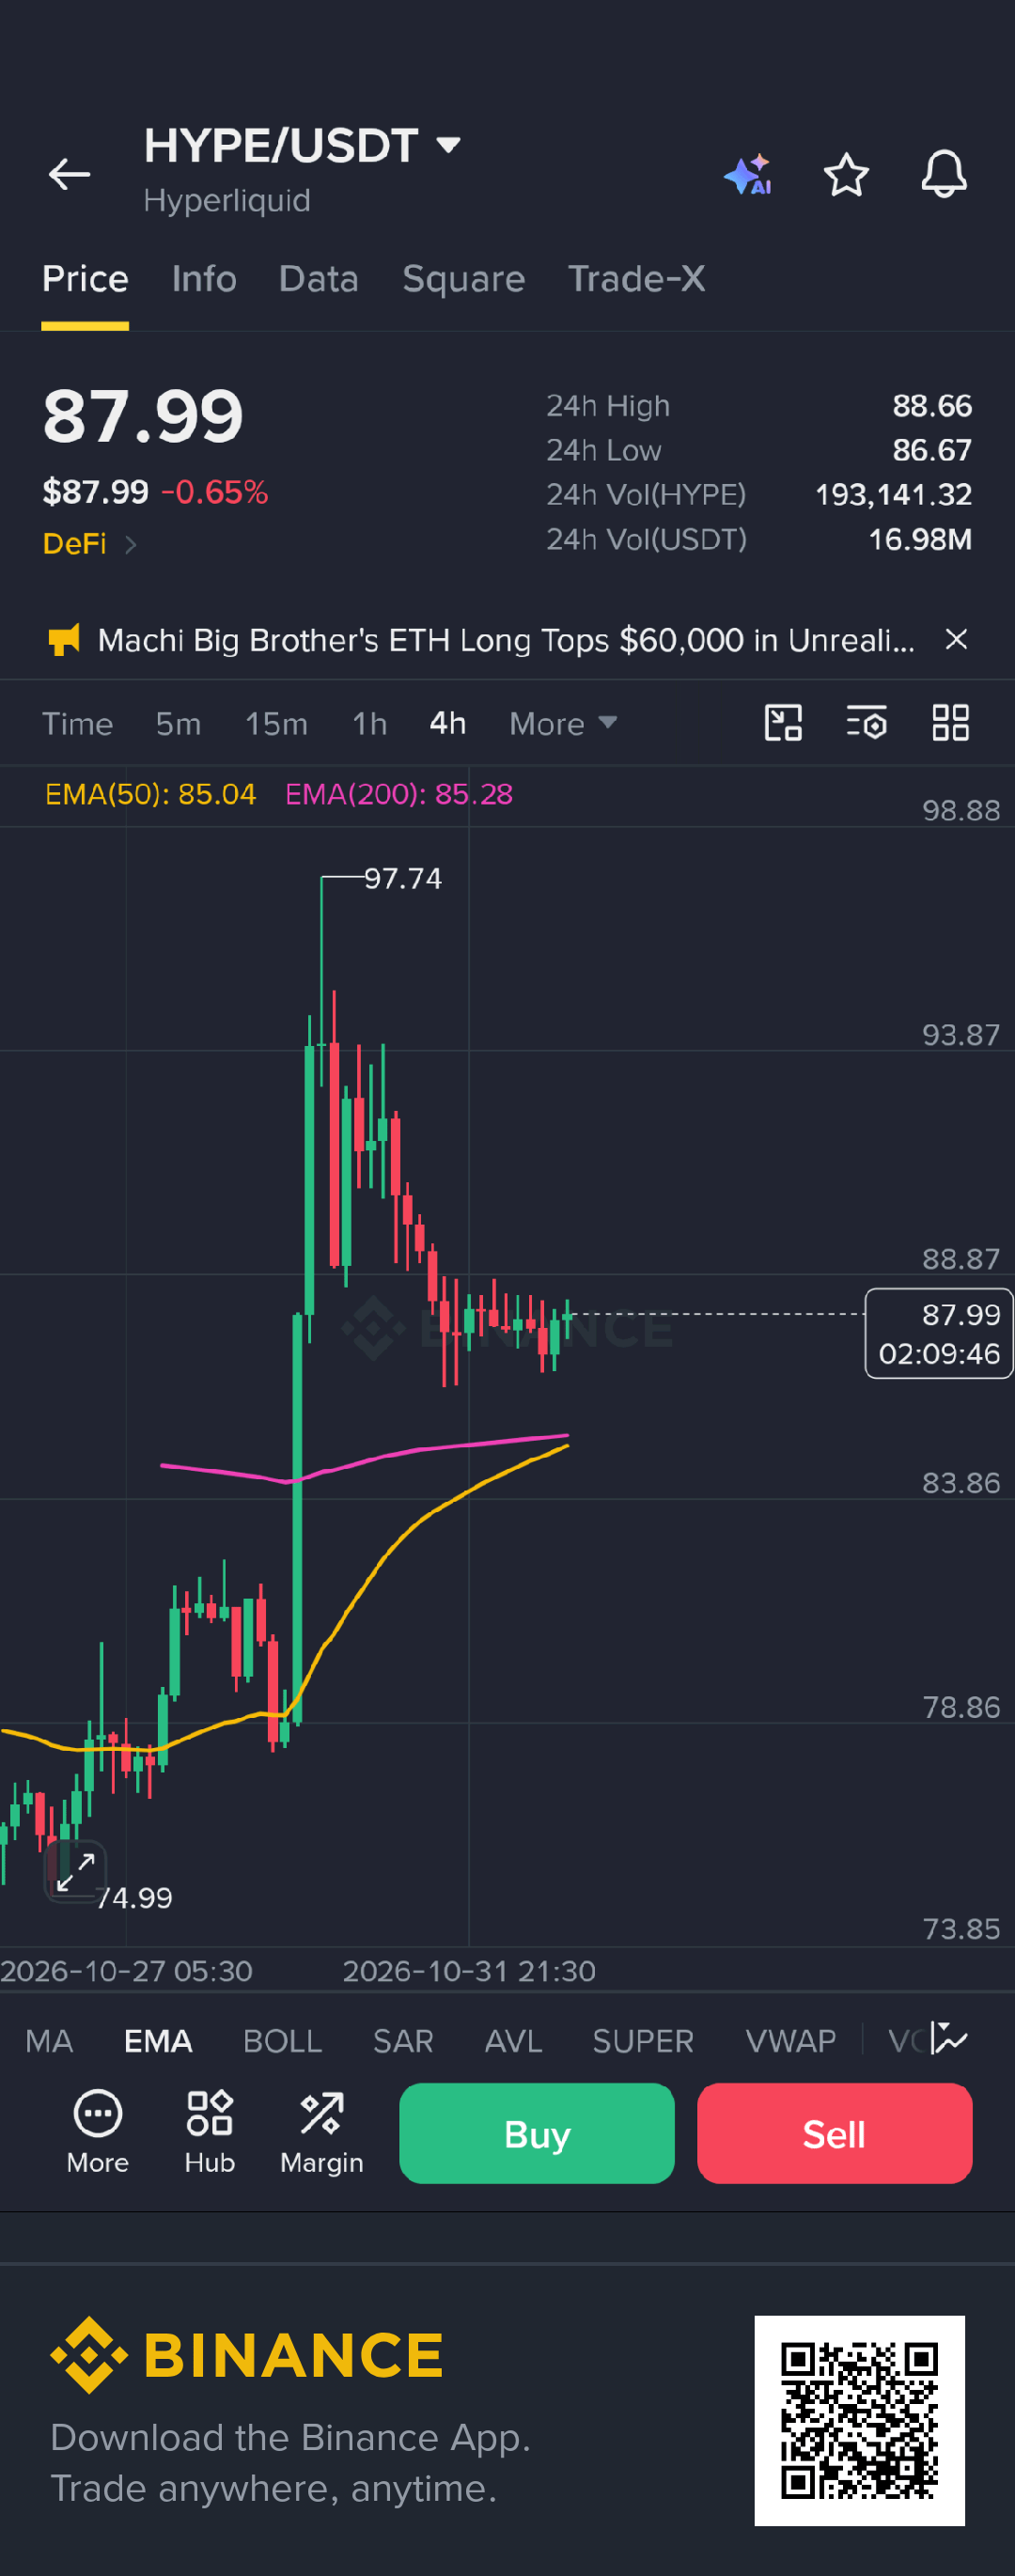
Рост$HYPE
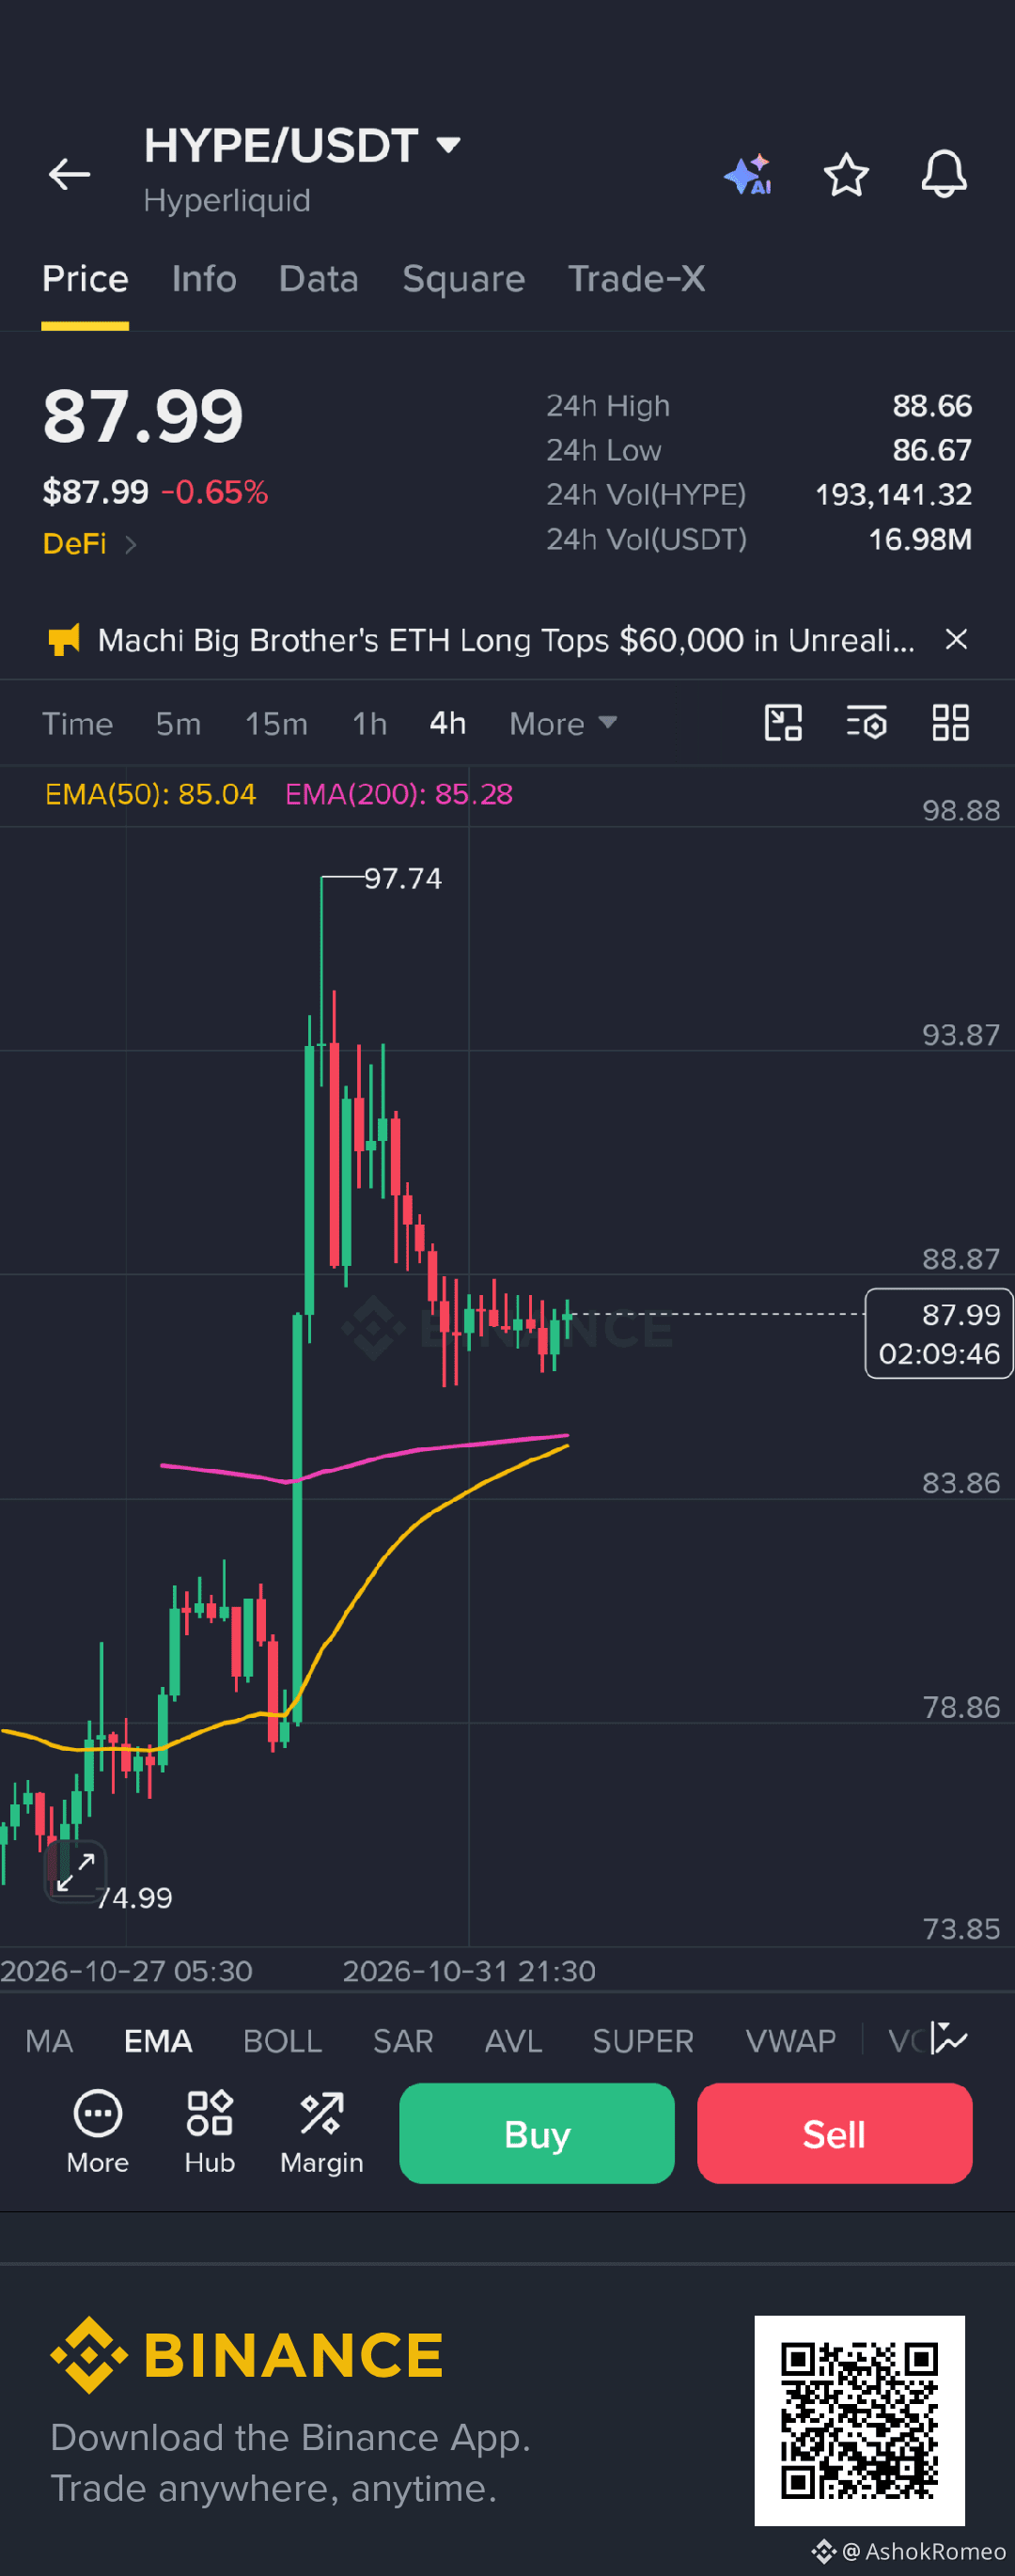
looking good in 4H
good buying is coming
I'm bullish
sky rocket 🚀 to moon 🌝 #hype
looking good in 4H
good buying is coming
I'm bullish
sky rocket 🚀 to moon 🌝 #hype
1
80
·
--
Статья
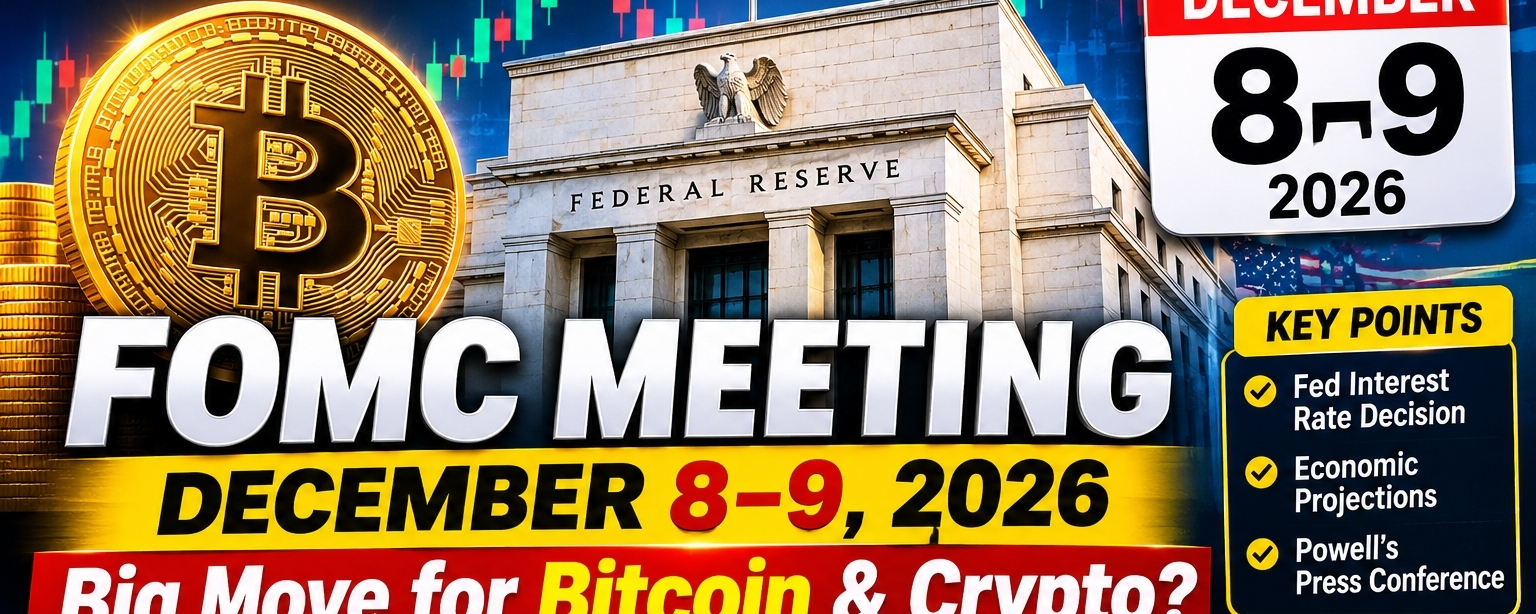
🚨 FOMC MEETING DECEMBER 8–9: A Major Catalyst for Bitcoin & Crypto Markets?🚨 FOMC MEETING DECEMBER 8–9: A Major Catalyst for Bitcoin & Crypto Markets?
The Federal Reserve's next policy meeting is approaching, and crypto traders should prepare for potential volatility.
The Federal Open Market Committee (FOMC) will meet on December 8–9, 2026. The meeting will be particularly important because investors will be watching the Fed's interest-rate decision, economic projections, and comments from the Fed Chair.
🔥 Why Does FOMC Matter for Crypto?
The Federal Reserve's monetary policy can influence global liquidity, the US dollar, bond yields, and investor appetite for risk.
Here is how different outcomes could affect crypto:
📈 Scenario 1: Dovish Fed
- Signals potential rate cuts or easier monetary policy.
- Could weaken the US dollar.
- May improve risk appetite.
- Bitcoin and altcoins could benefit.
📉 Scenario 2: Hawkish Fed
- Signals higher rates or tighter monetary policy.
- Could strengthen the US dollar.
- May reduce risk appetite.
- Bitcoin and altcoins could face selling pressure.
⚖️ Scenario 3: No Major Policy Change
- Markets may react more to the Fed's guidance.
- Bitcoin could experience short-term volatility.
- Traders will focus on future interest-rate expectations.
👀 3 Things Every Crypto Trader Should Watch
1. Interest Rate Decision: Will the Fed change rates or maintain its current policy?
2. Economic Projections: What do the latest inflation and growth projections indicate?
3. Powell's Press Conference: Any signals about future monetary policy could move the market.
🎯 My Market Watchlist
Before the FOMC announcement, keep an eye on:
- BTC – Bitcoin price structure
- ETH – Ethereum momentum
- DXY – US Dollar Index
- US Treasury Yields – Interest-rate expectations
- TOTAL3 – Altcoin market capitalization
💡 Final Thoughts
FOMC is not just another economic event. It is a major macroeconomic catalyst that can influence the entire crypto market.
However, a dovish Fed does not guarantee a Bitcoin rally, and a hawkish Fed does not guarantee a crash.
Smart traders watch the data, liquidity, market structure, and price confirmation instead of blindly predicting the outcome.
🚀 Will the December FOMC meeting bring a bullish opportunity for Bitcoin, or will the Fed create another wave of volatility?
What is your expectation? BULLISH or BEARISH?
#Bitcoin #BTC #FOMC #FederalReserve #CryptoMarket #Ethereum #Altcoins #BinanceSquare #CryptoAnalysis #MacroEconomics
🚨 FOMC MEETING DECEMBER 8–9: A Major Catalyst for Bitcoin & Crypto Markets?
🚨 FOMC MEETING DECEMBER 8–9: A Major Catalyst for Bitcoin & Crypto Markets?
The Federal Reserve's next policy meeting is approaching, and crypto traders should prepare for potential volatility.
The Federal Open Market Committee (FOMC) will meet on December 8–9, 2026. The meeting will be particularly important because investors will be watching the Fed's interest-rate decision, economic projections, and comments from the Fed Chair.
🔥 Why Does FOMC Matter for Crypto?
The Federal Reserve's monetary policy can influence global liquidity, the US dollar, bond yields, and investor appetite for risk.
Here is how different outcomes could affect crypto:
📈 Scenario 1: Dovish Fed
- Signals potential rate cuts or easier monetary policy.
- Could weaken the US dollar.
- May improve risk appetite.
- Bitcoin and altcoins could benefit.
📉 Scenario 2: Hawkish Fed
- Signals higher rates or tighter monetary policy.
- Could strengthen the US dollar.
- May reduce risk appetite.
- Bitcoin and altcoins could face selling pressure.
⚖️ Scenario 3: No Major Policy Change
- Markets may react more to the Fed's guidance.
- Bitcoin could experience short-term volatility.
- Traders will focus on future interest-rate expectations.
👀 3 Things Every Crypto Trader Should Watch
1. Interest Rate Decision: Will the Fed change rates or maintain its current policy?
2. Economic Projections: What do the latest inflation and growth projections indicate?
3. Powell's Press Conference: Any signals about future monetary policy could move the market.
🎯 My Market Watchlist
Before the FOMC announcement, keep an eye on:
- BTC – Bitcoin price structure
- ETH – Ethereum momentum
- DXY – US Dollar Index
- US Treasury Yields – Interest-rate expectations
- TOTAL3 – Altcoin market capitalization
💡 Final Thoughts
FOMC is not just another economic event. It is a major macroeconomic catalyst that can influence the entire crypto market.
However, a dovish Fed does not guarantee a Bitcoin rally, and a hawkish Fed does not guarantee a crash.
Smart traders watch the data, liquidity, market structure, and price confirmation instead of blindly predicting the outcome.
🚀 Will the December FOMC meeting bring a bullish opportunity for Bitcoin, or will the Fed create another wave of volatility?
What is your expectation? BULLISH or BEARISH?
#Bitcoin #BTC #FOMC #FederalReserve #CryptoMarket #Ethereum #Altcoins #BinanceSquare #CryptoAnalysis #MacroEconomics
The Federal Reserve's next policy meeting is approaching, and crypto traders should prepare for potential volatility.
The Federal Open Market Committee (FOMC) will meet on December 8–9, 2026. The meeting will be particularly important because investors will be watching the Fed's interest-rate decision, economic projections, and comments from the Fed Chair.
🔥 Why Does FOMC Matter for Crypto?
The Federal Reserve's monetary policy can influence global liquidity, the US dollar, bond yields, and investor appetite for risk.
Here is how different outcomes could affect crypto:
📈 Scenario 1: Dovish Fed
- Signals potential rate cuts or easier monetary policy.
- Could weaken the US dollar.
- May improve risk appetite.
- Bitcoin and altcoins could benefit.
📉 Scenario 2: Hawkish Fed
- Signals higher rates or tighter monetary policy.
- Could strengthen the US dollar.
- May reduce risk appetite.
- Bitcoin and altcoins could face selling pressure.
⚖️ Scenario 3: No Major Policy Change
- Markets may react more to the Fed's guidance.
- Bitcoin could experience short-term volatility.
- Traders will focus on future interest-rate expectations.
👀 3 Things Every Crypto Trader Should Watch
1. Interest Rate Decision: Will the Fed change rates or maintain its current policy?
2. Economic Projections: What do the latest inflation and growth projections indicate?
3. Powell's Press Conference: Any signals about future monetary policy could move the market.
🎯 My Market Watchlist
Before the FOMC announcement, keep an eye on:
- BTC – Bitcoin price structure
- ETH – Ethereum momentum
- DXY – US Dollar Index
- US Treasury Yields – Interest-rate expectations
- TOTAL3 – Altcoin market capitalization
💡 Final Thoughts
FOMC is not just another economic event. It is a major macroeconomic catalyst that can influence the entire crypto market.
However, a dovish Fed does not guarantee a Bitcoin rally, and a hawkish Fed does not guarantee a crash.
Smart traders watch the data, liquidity, market structure, and price confirmation instead of blindly predicting the outcome.
🚀 Will the December FOMC meeting bring a bullish opportunity for Bitcoin, or will the Fed create another wave of volatility?
What is your expectation? BULLISH or BEARISH?
#Bitcoin #BTC #FOMC #FederalReserve #CryptoMarket #Ethereum #Altcoins #BinanceSquare #CryptoAnalysis #MacroEconomics
1
26
·
--

Статья
🚨 $136 MILLION DeFi Risk? Threshold Pauses tBTC Operations as Aave and Gauntlet Take Action🚨 $136 MILLION DeFi Risk? Threshold Pauses tBTC Operations as Aave and Gauntlet Take Action
The Bitcoin-backed DeFi market is facing a serious security-related development. Is this a warning sign for DeFi liquidity?
The Threshold Network has temporarily suspended new tBTC minting and Bitcoin redemption requests while carrying out security maintenance.
But the bigger story is how major DeFi players are responding.
🔴 What Happened?
Here are the key developments:
- Threshold Network: Paused new BTC deposits, tBTC minting and redemption requests.
- Bitcoin reserves: Approximately 4,320 BTC backing 4,185 tBTC in circulation.
- Aave: Froze its Ethereum Core tBTC reserve to prevent additional exposure.
- Gauntlet: Added a tBTC-backed lending market to its emergency exclusion list.
- DeFi exposure: Around $136 million worth of tBTC was supplied to Aave's Ethereum Core market.
🟢 Is Bitcoin Actually at Risk?
There is an important distinction.
Threshold has stated that:
- tBTC remains fully backed.
- No unauthorized BTC transfers have been detected.
- No unauthorized minting has been detected.
- The security response is precautionary.
The situation is linked to a critical Linux kernel vulnerability, although Threshold reported no evidence that the vulnerability had been exploited against its tBTC nodes.
This is a security precaution, not a confirmed Bitcoin theft or bridge exploit.
⚠️ Why Should Crypto Investors Pay Attention?
There are three major risks to watch:
1. Liquidity Risk
If redemptions remain suspended, holders cannot directly redeem tBTC for native BTC through the normal process.
2. DeFi Lending Risk
Aave and Gauntlet are limiting exposure to protect lending markets and existing liquidity.
3. Market Confidence
Even when an asset is fully backed, restrictions on redemption can create uncertainty and potential price differences in secondary markets.
📊 My Market Analysis
This development highlights an important issue in crypto:
Having sufficient reserves does not automatically guarantee immediate liquidity.
Bitcoin-backed DeFi products depend on secure bridges, reliable redemption mechanisms and confidence in the underlying infrastructure.
If Threshold resolves the issue quickly, market confidence may recover.
However, a prolonged suspension could increase pressure on tBTC liquidity and other connected DeFi markets.
🔍 What Happens Next?
Keep watching these three developments:
1. Threshold's official announcement about reopening minting and redemptions.
2. Aave's decision on restoring its tBTC market.
3. tBTC's market price and liquidity compared with BTC.
💬 What Do You Think?
Is this simply a temporary security precaution, or does it expose a bigger weakness in Bitcoin-backed DeFi?
Would you trust a Bitcoin-backed token if direct redemptions were temporarily suspended?
Share your opinion below.
Follow for more Crypto News, DeFi Analysis, Bitcoin Updates and Emerging Market Opportunities.
$BTC
$SOL
$ETH
#Bitcoin #BTC #DeFi #Aave #Threshold #tBTC #CryptoSecurity #CryptoNews
🚨 $136 MILLION DeFi Risk? Threshold Pauses tBTC Operations as Aave and Gauntlet Take Action
🚨 $136 MILLION DeFi Risk? Threshold Pauses tBTC Operations as Aave and Gauntlet Take Action
The Bitcoin-backed DeFi market is facing a serious security-related development. Is this a warning sign for DeFi liquidity?
The Threshold Network has temporarily suspended new tBTC minting and Bitcoin redemption requests while carrying out security maintenance.
But the bigger story is how major DeFi players are responding.
🔴 What Happened?
Here are the key developments:
- Threshold Network: Paused new BTC deposits, tBTC minting and redemption requests.
- Bitcoin reserves: Approximately 4,320 BTC backing 4,185 tBTC in circulation.
- Aave: Froze its Ethereum Core tBTC reserve to prevent additional exposure.
- Gauntlet: Added a tBTC-backed lending market to its emergency exclusion list.
- DeFi exposure: Around $136 million worth of tBTC was supplied to Aave's Ethereum Core market.
🟢 Is Bitcoin Actually at Risk?
There is an important distinction.
Threshold has stated that:
- tBTC remains fully backed.
- No unauthorized BTC transfers have been detected.
- No unauthorized minting has been detected.
- The security response is precautionary.
The situation is linked to a critical Linux kernel vulnerability, although Threshold reported no evidence that the vulnerability had been exploited against its tBTC nodes.
This is a security precaution, not a confirmed Bitcoin theft or bridge exploit.
⚠️ Why Should Crypto Investors Pay Attention?
There are three major risks to watch:
1. Liquidity Risk
If redemptions remain suspended, holders cannot directly redeem tBTC for native BTC through the normal process.
2. DeFi Lending Risk
Aave and Gauntlet are limiting exposure to protect lending markets and existing liquidity.
3. Market Confidence
Even when an asset is fully backed, restrictions on redemption can create uncertainty and potential price differences in secondary markets.
📊 My Market Analysis
This development highlights an important issue in crypto:
Having sufficient reserves does not automatically guarantee immediate liquidity.
Bitcoin-backed DeFi products depend on secure bridges, reliable redemption mechanisms and confidence in the underlying infrastructure.
If Threshold resolves the issue quickly, market confidence may recover.
However, a prolonged suspension could increase pressure on tBTC liquidity and other connected DeFi markets.
🔍 What Happens Next?
Keep watching these three developments:
1. Threshold's official announcement about reopening minting and redemptions.
2. Aave's decision on restoring its tBTC market.
3. tBTC's market price and liquidity compared with BTC.
💬 What Do You Think?
Is this simply a temporary security precaution, or does it expose a bigger weakness in Bitcoin-backed DeFi?
Would you trust a Bitcoin-backed token if direct redemptions were temporarily suspended?
Share your opinion below.
Follow for more Crypto News, DeFi Analysis, Bitcoin Updates and Emerging Market Opportunities.
$BTC
$SOL
$ETH
#Bitcoin #BTC #DeFi #Aave #Threshold #tBTC #CryptoSecurity #CryptoNews
The Bitcoin-backed DeFi market is facing a serious security-related development. Is this a warning sign for DeFi liquidity?
The Threshold Network has temporarily suspended new tBTC minting and Bitcoin redemption requests while carrying out security maintenance.
But the bigger story is how major DeFi players are responding.
🔴 What Happened?
Here are the key developments:
- Threshold Network: Paused new BTC deposits, tBTC minting and redemption requests.
- Bitcoin reserves: Approximately 4,320 BTC backing 4,185 tBTC in circulation.
- Aave: Froze its Ethereum Core tBTC reserve to prevent additional exposure.
- Gauntlet: Added a tBTC-backed lending market to its emergency exclusion list.
- DeFi exposure: Around $136 million worth of tBTC was supplied to Aave's Ethereum Core market.
🟢 Is Bitcoin Actually at Risk?
There is an important distinction.
Threshold has stated that:
- tBTC remains fully backed.
- No unauthorized BTC transfers have been detected.
- No unauthorized minting has been detected.
- The security response is precautionary.
The situation is linked to a critical Linux kernel vulnerability, although Threshold reported no evidence that the vulnerability had been exploited against its tBTC nodes.
This is a security precaution, not a confirmed Bitcoin theft or bridge exploit.
⚠️ Why Should Crypto Investors Pay Attention?
There are three major risks to watch:
1. Liquidity Risk
If redemptions remain suspended, holders cannot directly redeem tBTC for native BTC through the normal process.
2. DeFi Lending Risk
Aave and Gauntlet are limiting exposure to protect lending markets and existing liquidity.
3. Market Confidence
Even when an asset is fully backed, restrictions on redemption can create uncertainty and potential price differences in secondary markets.
📊 My Market Analysis
This development highlights an important issue in crypto:
Having sufficient reserves does not automatically guarantee immediate liquidity.
Bitcoin-backed DeFi products depend on secure bridges, reliable redemption mechanisms and confidence in the underlying infrastructure.
If Threshold resolves the issue quickly, market confidence may recover.
However, a prolonged suspension could increase pressure on tBTC liquidity and other connected DeFi markets.
🔍 What Happens Next?
Keep watching these three developments:
1. Threshold's official announcement about reopening minting and redemptions.
2. Aave's decision on restoring its tBTC market.
3. tBTC's market price and liquidity compared with BTC.
💬 What Do You Think?
Is this simply a temporary security precaution, or does it expose a bigger weakness in Bitcoin-backed DeFi?
Would you trust a Bitcoin-backed token if direct redemptions were temporarily suspended?
Share your opinion below.
Follow for more Crypto News, DeFi Analysis, Bitcoin Updates and Emerging Market Opportunities.
$BTC
$SOL
$ETH
#Bitcoin #BTC #DeFi #Aave #Threshold #tBTC #CryptoSecurity #CryptoNews
1
32
·
--
Рост
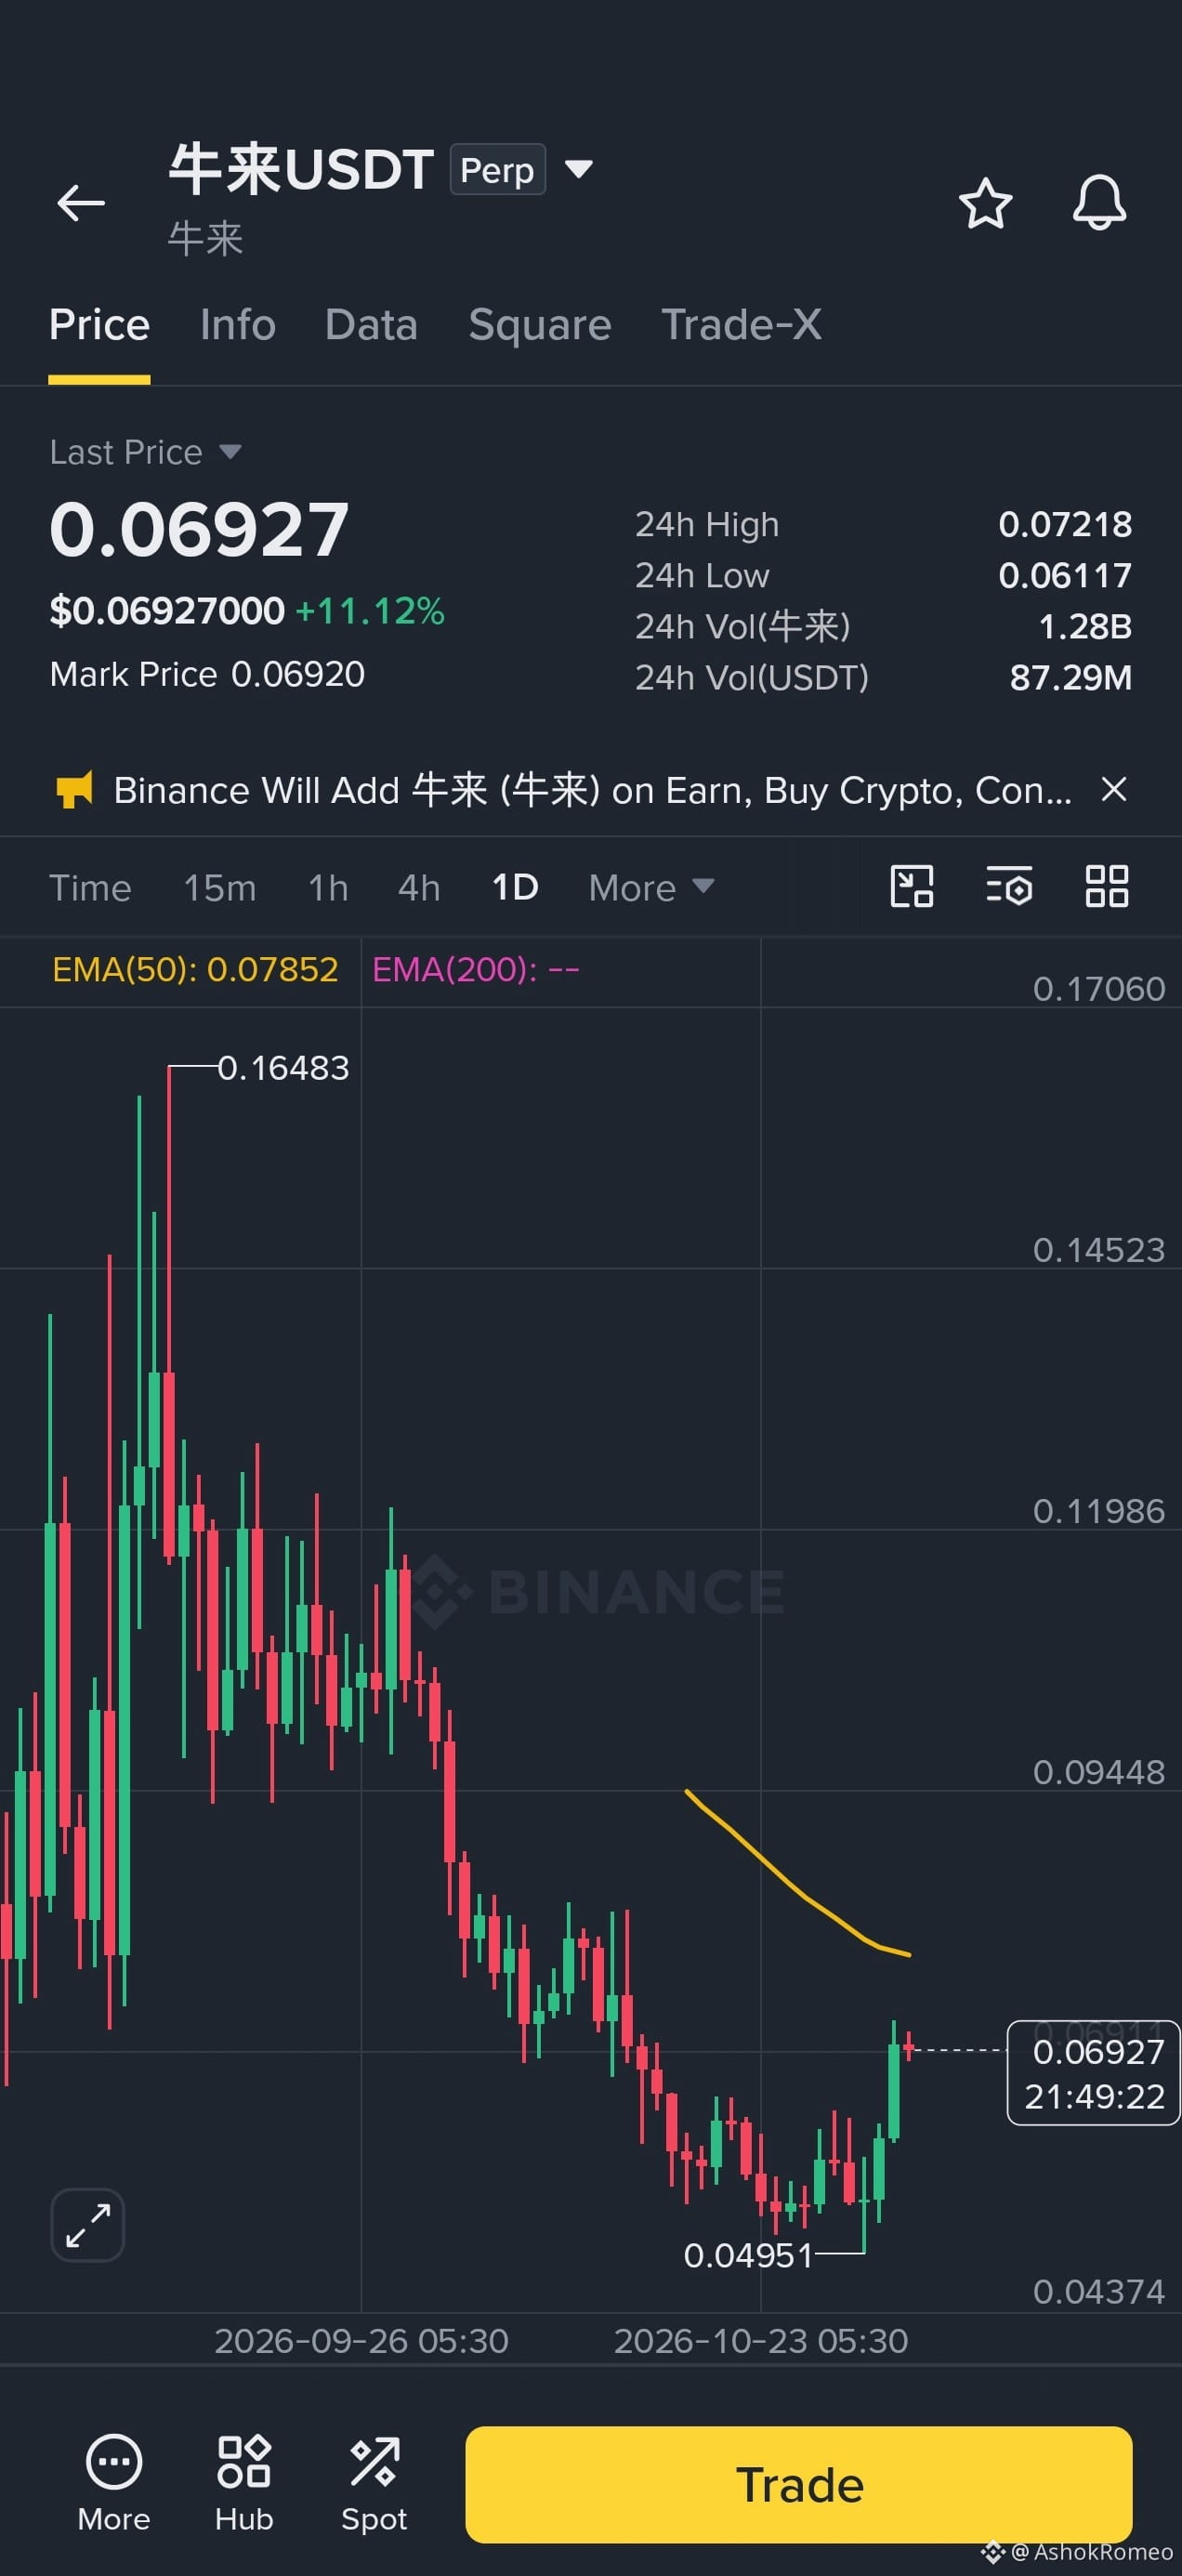
$牛来
big move we can accept
perfectly close in 1D
so stay focus ,
what you think so comment your prediction
{spot}(牛来USDT)
$牛来
big move we can accept
perfectly close in 1D
so stay focus ,
what you think so comment your prediction
big move we can accept
perfectly close in 1D
so stay focus ,
what you think so comment your prediction
1
538
·
--
Рост
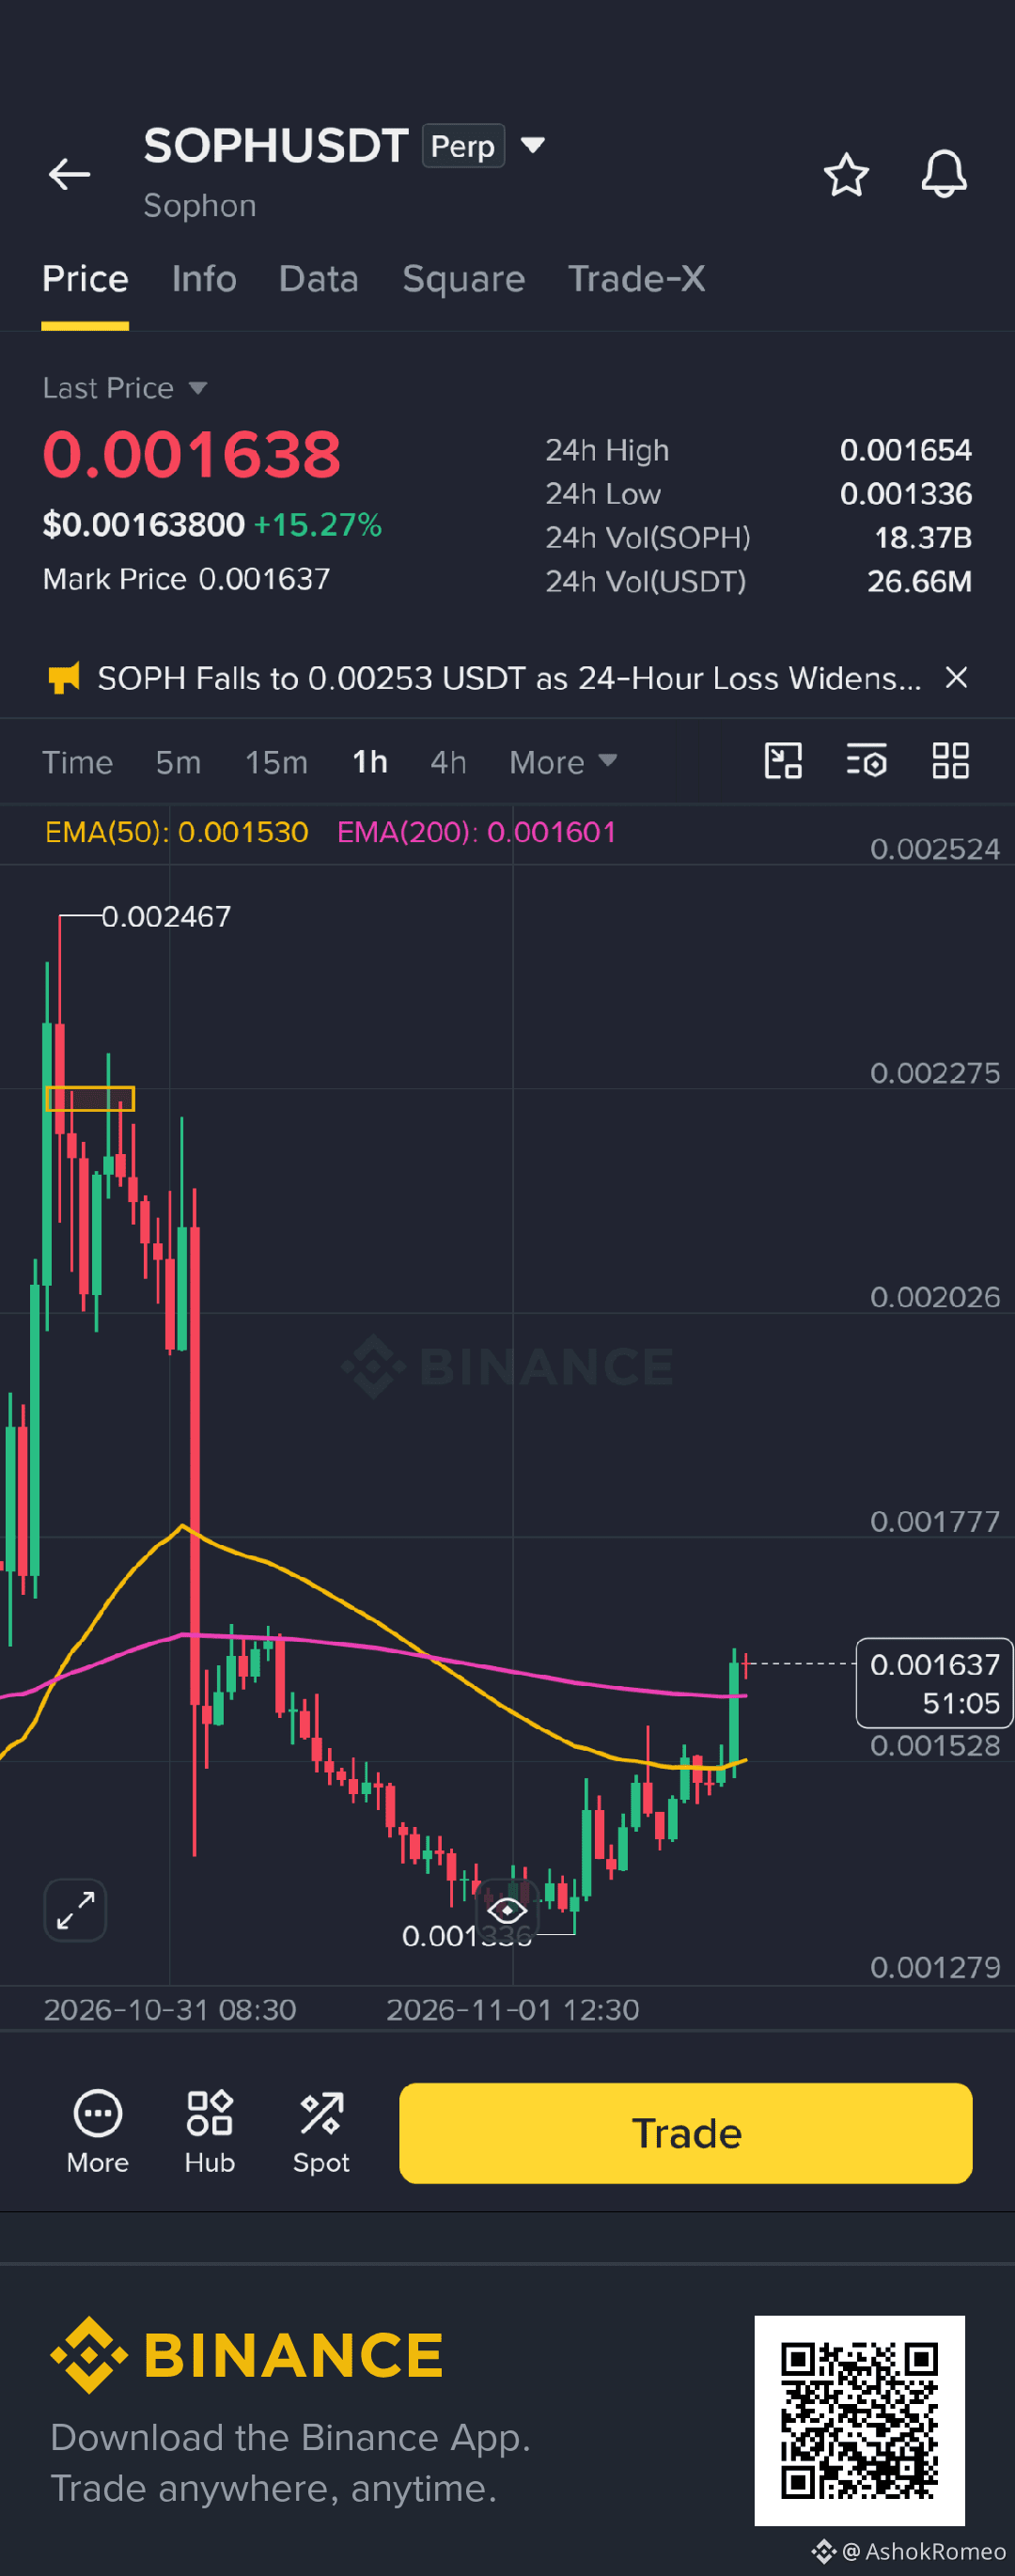
next big pump can be $SOPH
focus on it
big move can come
next big pump can be $SOPH
focus on it
big move can come
focus on it
big move can come
215
·
--
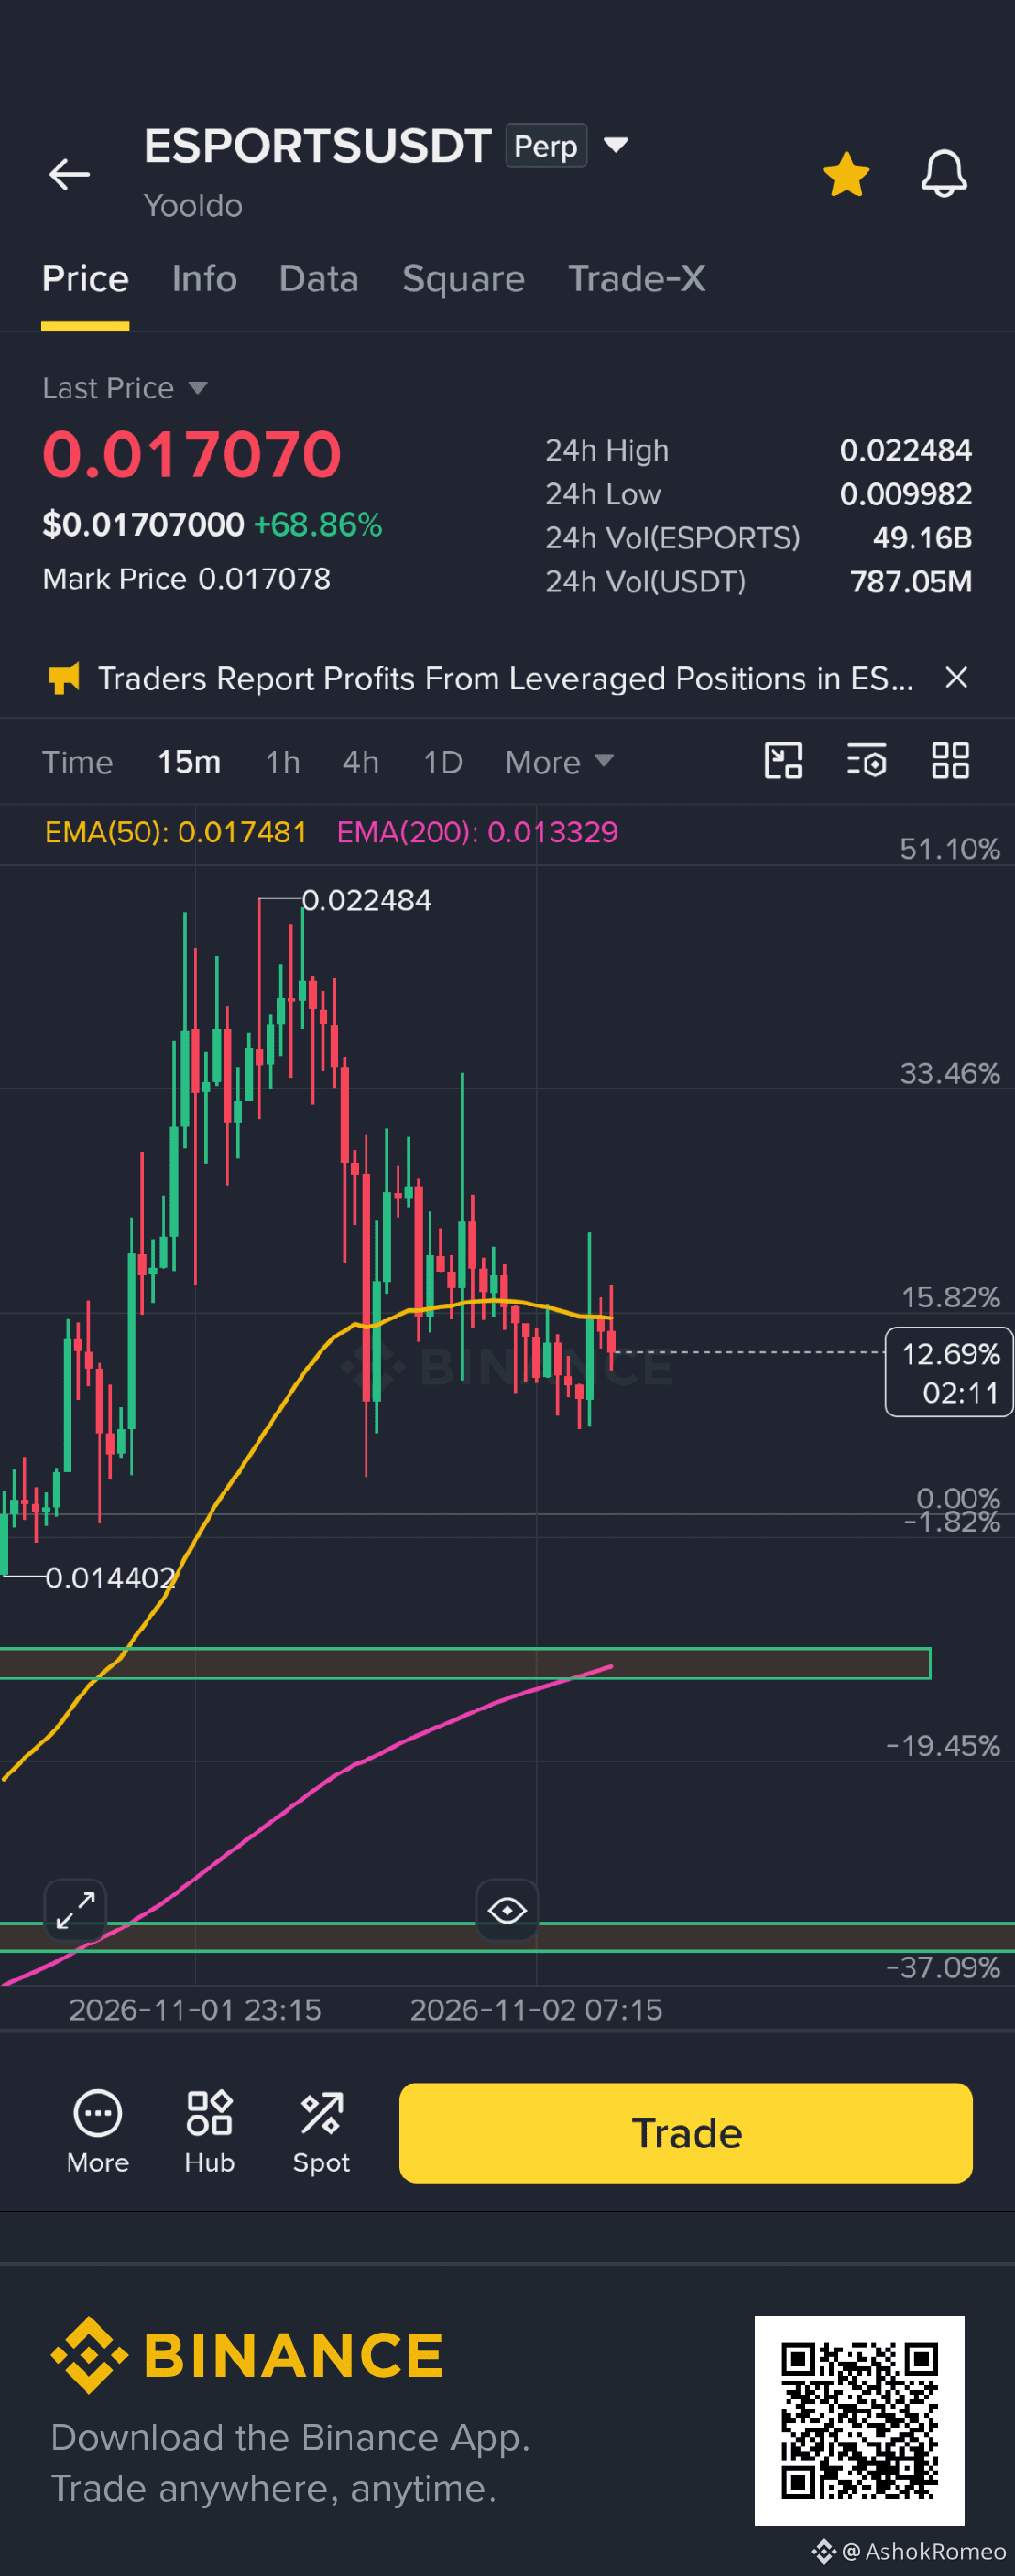
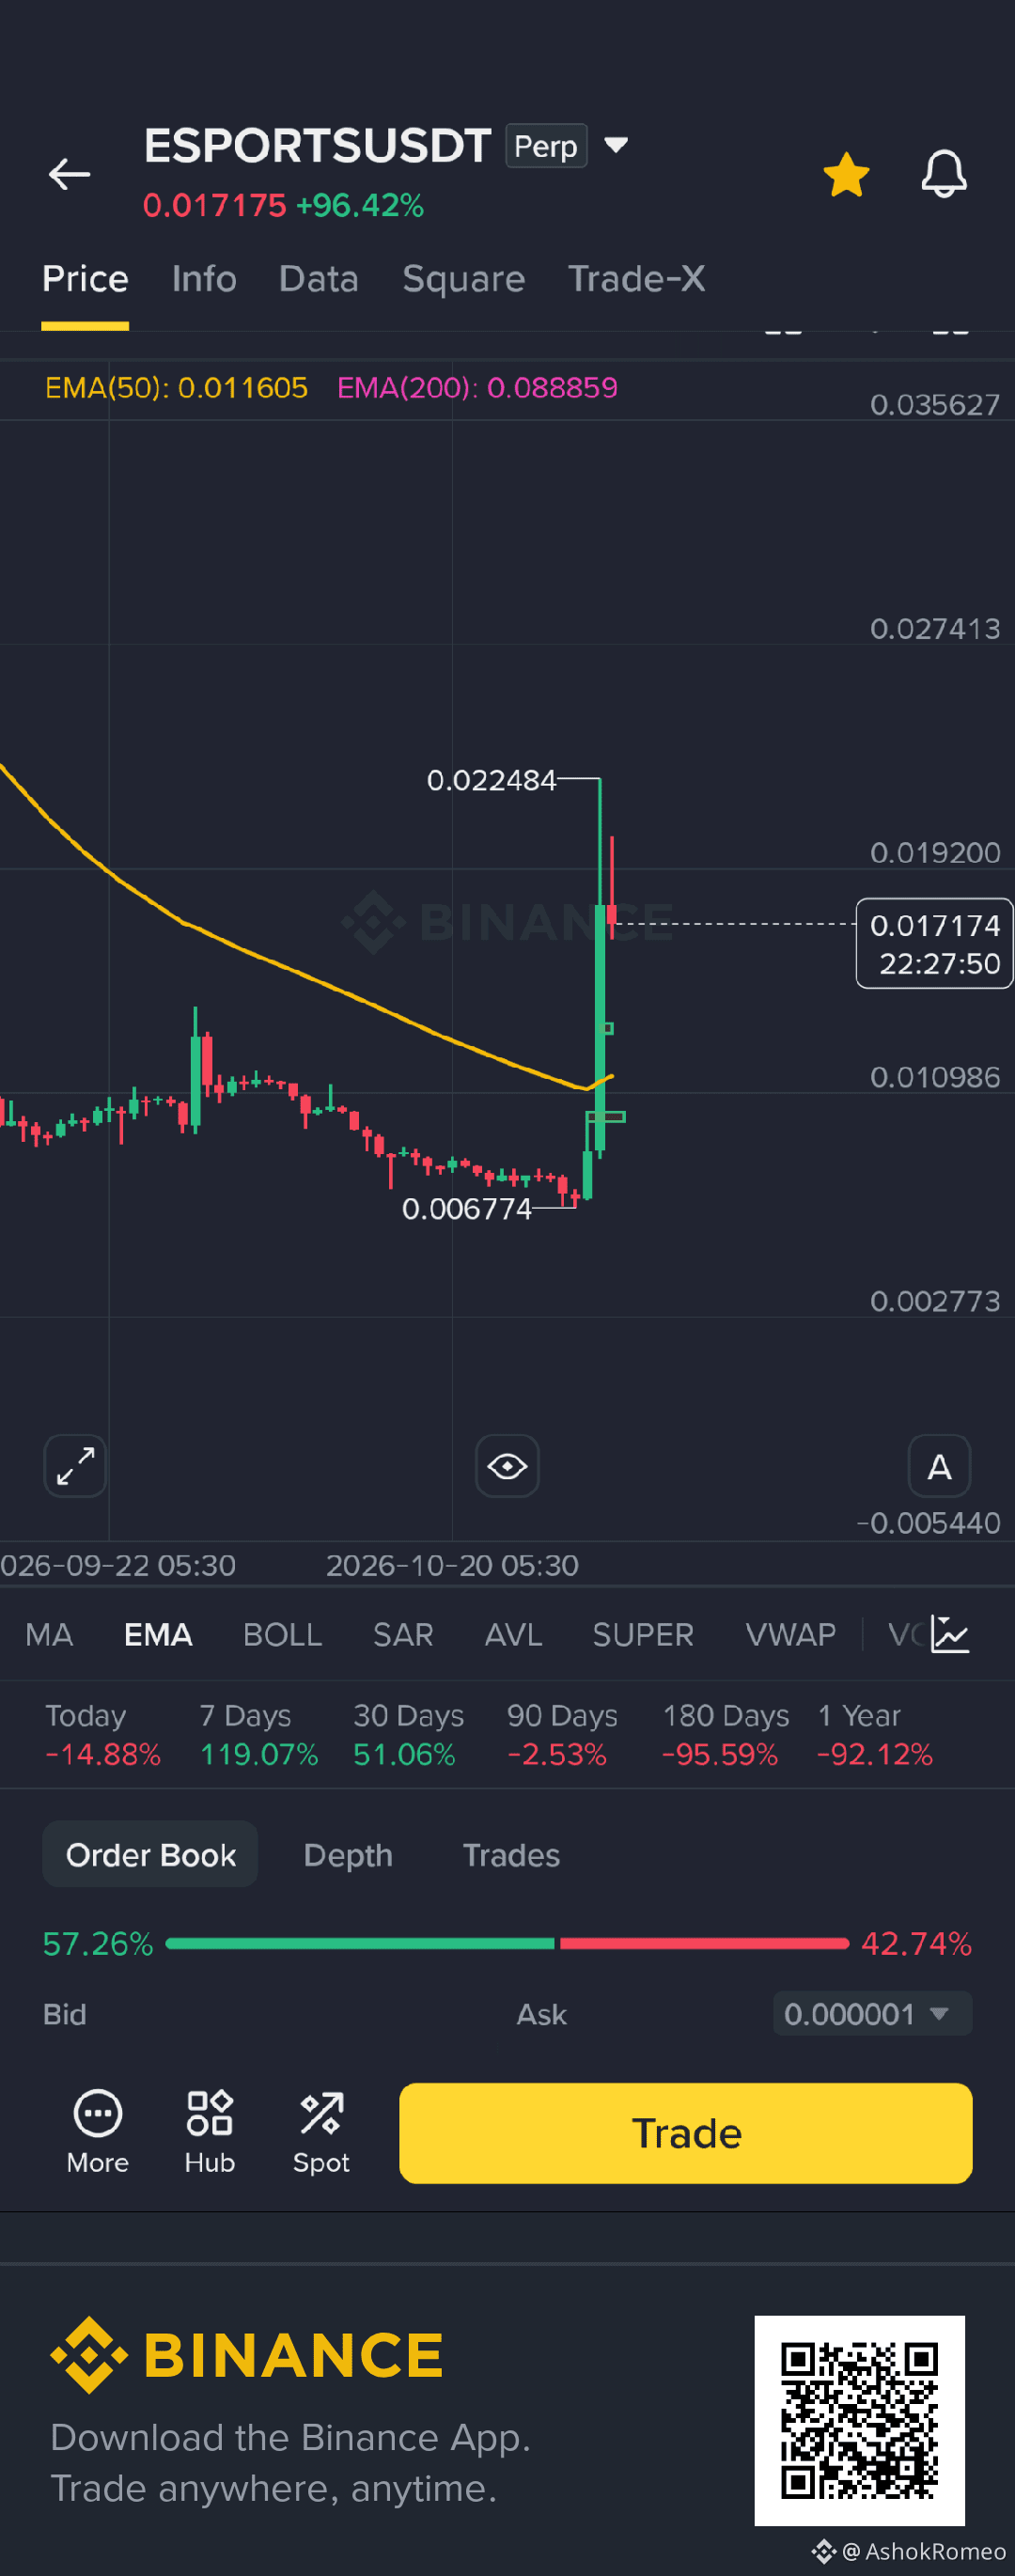
$ESPORTS
1D perfect clossing bullish move continues
what you think so comment your prediction
#BinanceToResumePhaseOneOfWithdrawals
#esports
$ESPORTS
1D perfect clossing bullish move continues
what you think so comment your prediction
#BinanceToResumePhaseOneOfWithdrawals
#esports
1D perfect clossing bullish move continues
what you think so comment your prediction
#BinanceToResumePhaseOneOfWithdrawals
#esports
393
·
--
Рост
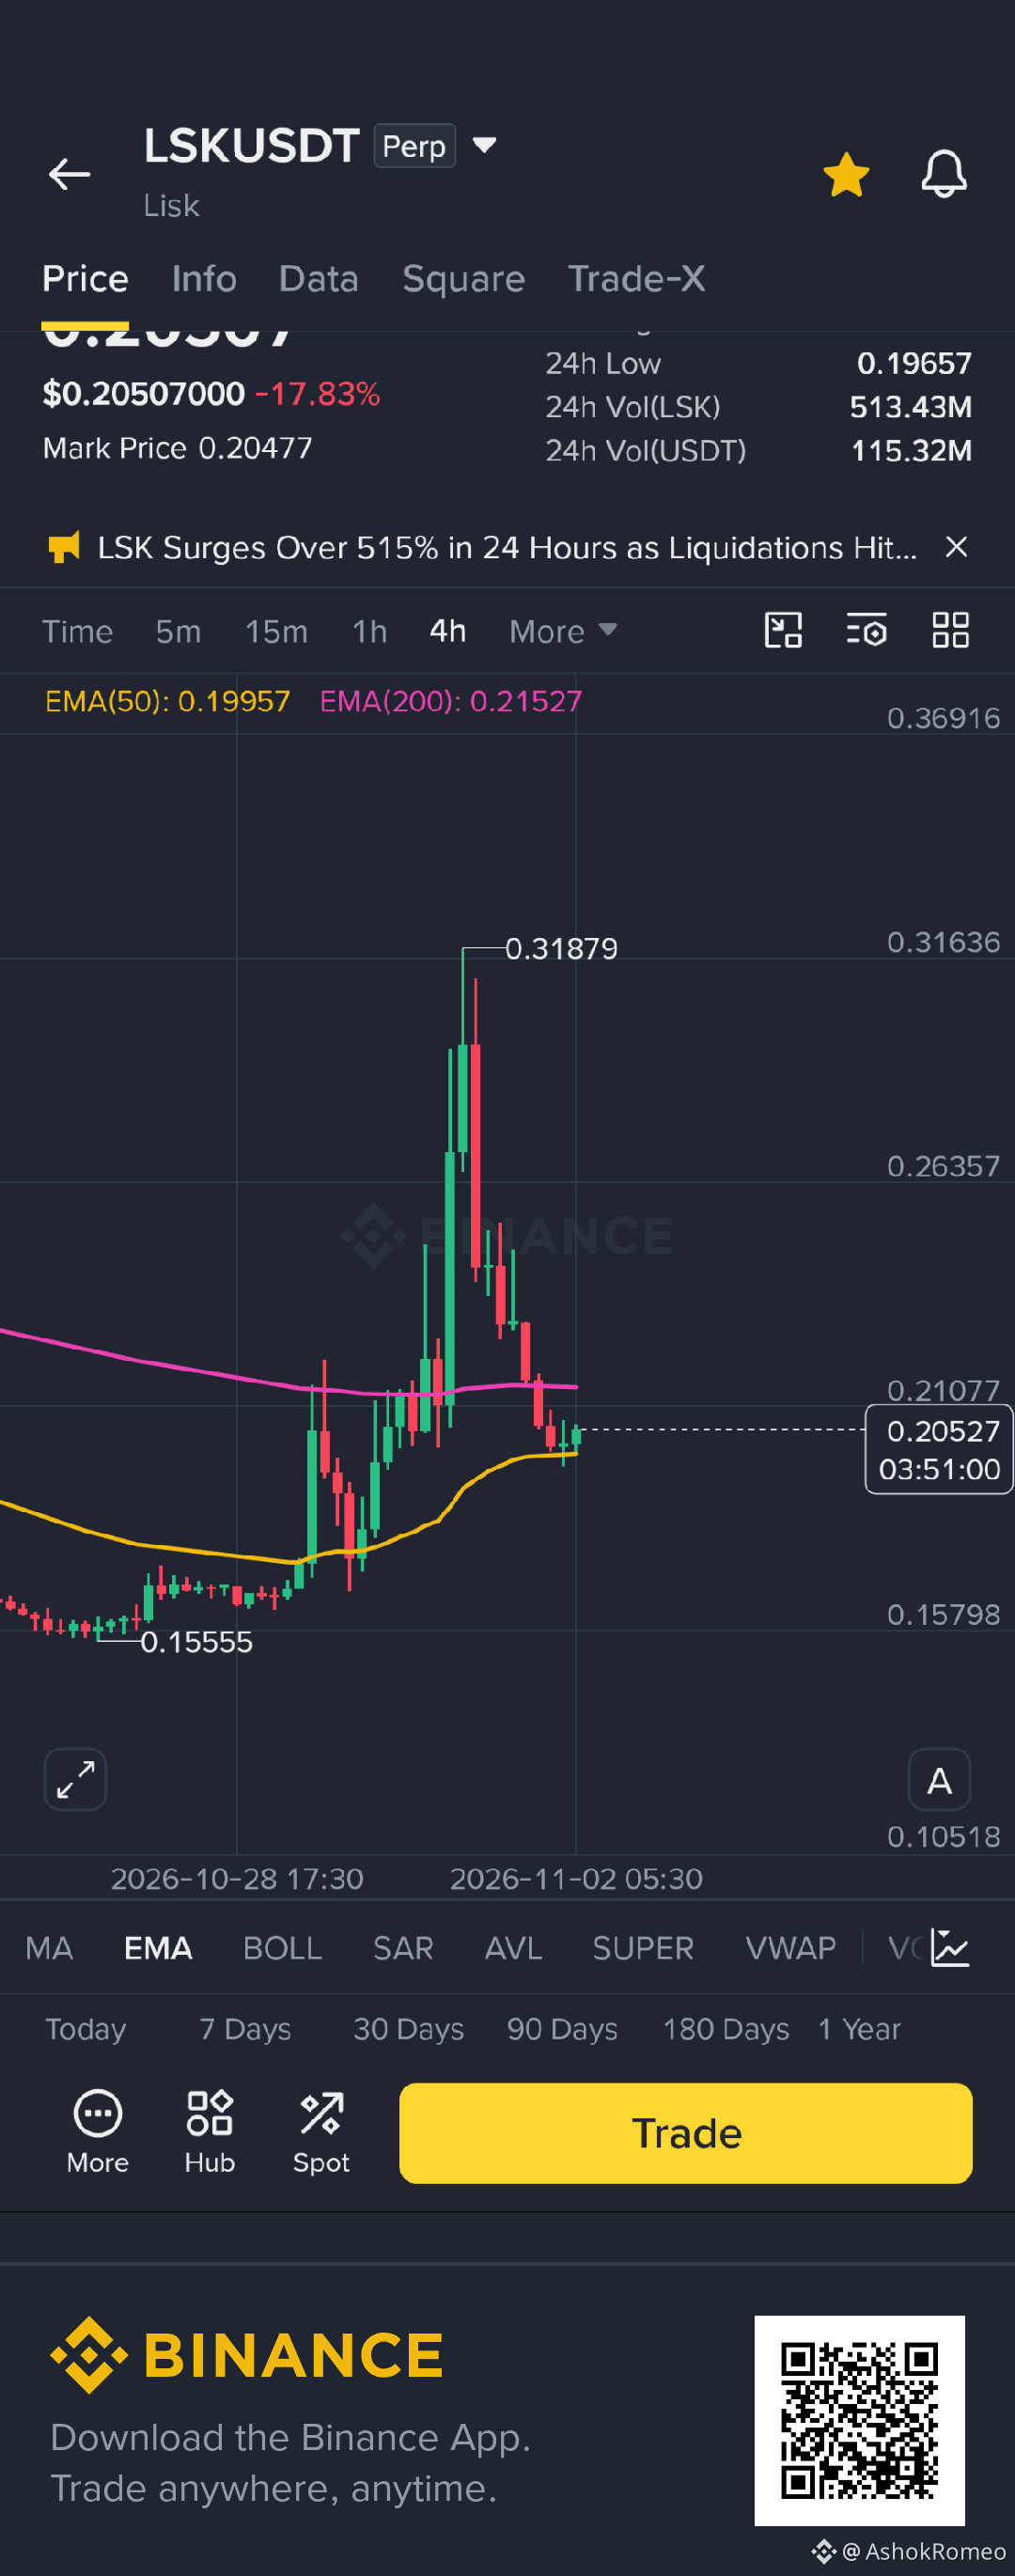
🚨 LSK Price Alert: Massive Pump, Sharp Rejection! Is Another Move Coming?
Lisk ($LSK) is showing extreme volatility, and the 4H chart is sending an important signal.
After a powerful rally, LSK reached a high of $0.31879 before facing strong selling pressure.
Now the real question is: Are buyers preparing for another breakout, or is the market entering a deeper correction?
📊 4H Technical Analysis
Current chart price: $0.20515
Key indicators:
- EMA 50: $0.19956
- EMA 200: $0.21527
- Recent swing high: $0.31879
- Recent low: $0.19657
🔍 Important Price Levels
🟢 Support Zone
- $0.1995 – EMA 50 support
- $0.1965 – Recent swing low
- $0.1800 – Potential downside level if support breaks
🔴 Resistance Zone
- $0.2107 – Immediate resistance
- $0.2152 – EMA 200 resistance
- $0.2300 – Next recovery level
- $0.2635 – Major upside resistance
🐂 Bullish Scenario
If LSK holds above $0.1965 and buyers reclaim the $0.2152 EMA 200 level with strong volume, a recovery toward $0.2300 and potentially $0.2635 could develop.
🐻 Bearish Scenario
If LSK loses $0.1965 with a strong 4H candle close below support, selling pressure could increase.
The next potential downside area to monitor is $0.1800.
🧠 My Market View
I am not chasing this pump.
After such an aggressive move, protecting capital is more important than FOMO buying.
I want to see:
1. Strong buying volume.
2. A confirmed support hold.
3. A 4H close above EMA 200.
4. A successful retest before considering bullish continuation.
The next major move will depend on whether buyers can reclaim control.
💬 What Do You Think?
Will LSK reclaim $0.215 and move toward $0.263?
Or will bears push the price below $0.196?
Share your analysis in the comments! 👇
#LSK #Lisk #CryptoAnalysis #BinanceSquare #Altcoins #TechnicalAnalysis #CryptoTrading #Bitcoin
⚠️ Disclaimer: This is technical analysis for educational purposes only, not financial advice. Futures trading carries significant risk. Always use proper risk management and DYOR.
$LSK
🚨 LSK Price Alert: Massive Pump, Sharp Rejection! Is Another Move Coming?
Lisk ($LSK ) is showing extreme volatility, and the 4H chart is sending an important signal.
After a powerful rally, LSK reached a high of $0.31879 before facing strong selling pressure.
Now the real question is: Are buyers preparing for another breakout, or is the market entering a deeper correction?
📊 4H Technical Analysis
Current chart price: $0.20515
Key indicators:
- EMA 50: $0.19956
- EMA 200: $0.21527
- Recent swing high: $0.31879
- Recent low: $0.19657
🔍 Important Price Levels
🟢 Support Zone
- $0.1995 – EMA 50 support
- $0.1965 – Recent swing low
- $0.1800 – Potential downside level if support breaks
🔴 Resistance Zone
- $0.2107 – Immediate resistance
- $0.2152 – EMA 200 resistance
- $0.2300 – Next recovery level
- $0.2635 – Major upside resistance
🐂 Bullish Scenario
If LSK holds above $0.1965 and buyers reclaim the $0.2152 EMA 200 level with strong volume, a recovery toward $0.2300 and potentially $0.2635 could develop.
🐻 Bearish Scenario
If LSK loses $0.1965 with a strong 4H candle close below support, selling pressure could increase.
The next potential downside area to monitor is $0.1800.
🧠 My Market View
I am not chasing this pump.
After such an aggressive move, protecting capital is more important than FOMO buying.
I want to see:
1. Strong buying volume.
2. A confirmed support hold.
3. A 4H close above EMA 200.
4. A successful retest before considering bullish continuation.
The next major move will depend on whether buyers can reclaim control.
💬 What Do You Think?
Will LSK reclaim $0.215 and move toward $0.263?
Or will bears push the price below $0.196?
Share your analysis in the comments! 👇
#LSK #Lisk #CryptoAnalysis #BinanceSquare #Altcoins #TechnicalAnalysis #CryptoTrading #Bitcoin
⚠️ Disclaimer: This is technical analysis for educational purposes only, not financial advice. Futures trading carries significant risk. Always use proper risk management and DYOR.
$LSK
Lisk ($LSK ) is showing extreme volatility, and the 4H chart is sending an important signal.
After a powerful rally, LSK reached a high of $0.31879 before facing strong selling pressure.
Now the real question is: Are buyers preparing for another breakout, or is the market entering a deeper correction?
📊 4H Technical Analysis
Current chart price: $0.20515
Key indicators:
- EMA 50: $0.19956
- EMA 200: $0.21527
- Recent swing high: $0.31879
- Recent low: $0.19657
🔍 Important Price Levels
🟢 Support Zone
- $0.1995 – EMA 50 support
- $0.1965 – Recent swing low
- $0.1800 – Potential downside level if support breaks
🔴 Resistance Zone
- $0.2107 – Immediate resistance
- $0.2152 – EMA 200 resistance
- $0.2300 – Next recovery level
- $0.2635 – Major upside resistance
🐂 Bullish Scenario
If LSK holds above $0.1965 and buyers reclaim the $0.2152 EMA 200 level with strong volume, a recovery toward $0.2300 and potentially $0.2635 could develop.
🐻 Bearish Scenario
If LSK loses $0.1965 with a strong 4H candle close below support, selling pressure could increase.
The next potential downside area to monitor is $0.1800.
🧠 My Market View
I am not chasing this pump.
After such an aggressive move, protecting capital is more important than FOMO buying.
I want to see:
1. Strong buying volume.
2. A confirmed support hold.
3. A 4H close above EMA 200.
4. A successful retest before considering bullish continuation.
The next major move will depend on whether buyers can reclaim control.
💬 What Do You Think?
Will LSK reclaim $0.215 and move toward $0.263?
Or will bears push the price below $0.196?
Share your analysis in the comments! 👇
#LSK #Lisk #CryptoAnalysis #BinanceSquare #Altcoins #TechnicalAnalysis #CryptoTrading #Bitcoin
⚠️ Disclaimer: This is technical analysis for educational purposes only, not financial advice. Futures trading carries significant risk. Always use proper risk management and DYOR.
$LSK
1
470
·
--
Статья
🚨 IDOLUSDT +45%: THE BIG BREAKOUT IS COMING? Bulls Are Testing a Major Resistance!🚨 IDOLUSDT +45%: THE BIG BREAKOUT IS COMING? Bulls Are Testing a Major Resistance!
🔥 IDOL is approaching a critical decision point!
MEET48 (IDOLUSDT) is showing impressive bullish momentum, with price climbing more than 45% in 24 hours.
But there is one important question:
Can bulls break the resistance, or are we about to see another rejection?
Let's analyze the 1H chart.
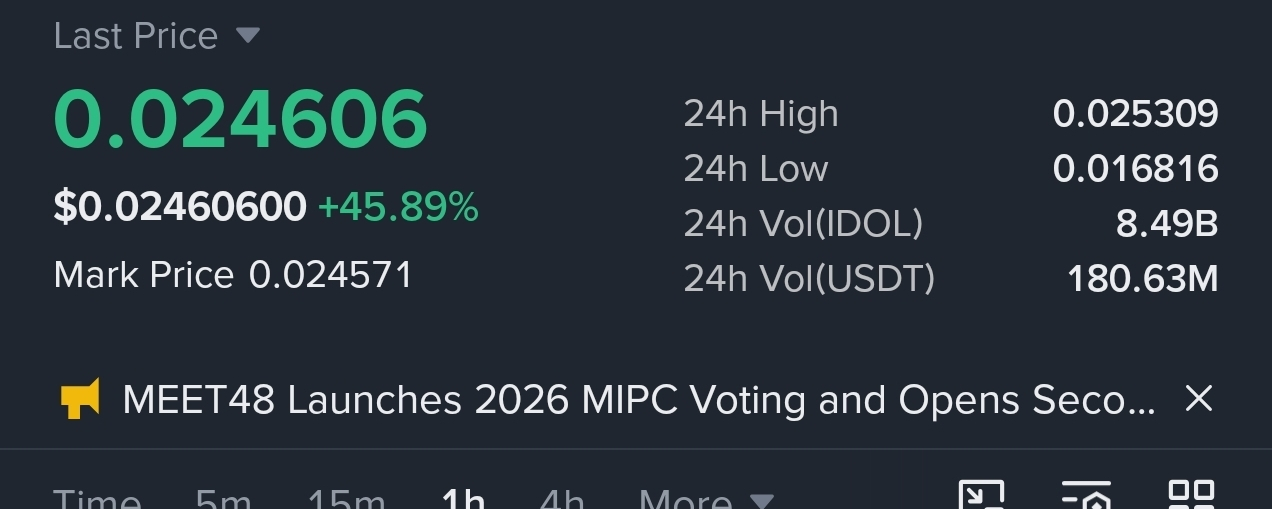
📊 MARKET DATA
- Current Price: $0.024676
- 24H Change: +45.56%
- 24H High: $0.025309
- 24H Low: $0.016816
- 24H Volume: 180.53M USDT
High volatility and strong trading activity are making IDOL an interesting altcoin to watch.
🟢 1. BULLISH EMA STRUCTURE
EMA 50: $0.020262
EMA 200: $0.014904
Price is trading above both moving averages.
EMA 50 is also above EMA 200, indicating a bullish structure on the 1H timeframe.
As long as price holds above the EMA 50 area, buyers may retain short-term control.
🔴 2. THE MOST IMPORTANT RESISTANCE
IDOL is approaching a major supply zone around:
$0.0247 – $0.0260
This is the key battle area for buyers and sellers.
A confirmed 1H candle close above this zone, supported by strong volume, could signal a potential breakout.
But a rejection here could trigger short-term profit booking.
🎯 3. KEY LEVELS TO WATCH
Resistance:
- $0.025309 – 24H High
- $0.0260 – Major resistance area
- $0.031411 – Previous swing high
Support:
- $0.0224 – Near-term support
- $0.0202 – EMA 50 area
- $0.0170–$0.0178 – Major demand zone
🚀 4. TWO POSSIBLE SCENARIOS
🟢 BULLISH SCENARIO:
If IDOL breaks above $0.0260 with strong volume and successfully retests the zone, the next major upside level to watch is $0.0292, followed by $0.031411.
🔴 BEARISH SCENARIO:
If price fails to break resistance and falls below $0.0224, a pullback toward $0.0202 becomes possible.
Losing the EMA 50 area could weaken the current bullish structure.
🧠 MY FINAL ANALYSIS
IDOL is showing strong bullish momentum, but price is now approaching an important resistance zone.
I am watching one thing closely:
Will buyers convert this resistance into support?
A breakout confirmation matters more than simply buying into a green candle.
Patience, volume confirmation and risk management are essential.
💬 YOUR TURN!
What do you think happens next?
🔥 BULLISH – IDOL breaks $0.0260 and targets $0.0314.
🐻 BEARISH – Resistance rejects price and a correction begins.
Drop your prediction below! 👇
#IDOL #MEET48 #IDOLUSDT #CryptoAnalysis #BinanceSquare #Altcoins #CryptoTrading #TechnicalAnalysis
⚠️ Disclaimer: This is educational technical analysis based on the displayed chart, not financial advice. Crypto futures are highly risky. Always manage your risk.
🚨 IDOLUSDT +45%: THE BIG BREAKOUT IS COMING? Bulls Are Testing a Major Resistance!
🚨 IDOLUSDT +45%: THE BIG BREAKOUT IS COMING? Bulls Are Testing a Major Resistance!
🔥 IDOL is approaching a critical decision point!
MEET48 (IDOLUSDT) is showing impressive bullish momentum, with price climbing more than 45% in 24 hours.
But there is one important question:
Can bulls break the resistance, or are we about to see another rejection?
Let's analyze the 1H chart.
📊 MARKET DATA
- Current Price: $0.024676
- 24H Change: +45.56%
- 24H High: $0.025309
- 24H Low: $0.016816
- 24H Volume: 180.53M USDT
High volatility and strong trading activity are making IDOL an interesting altcoin to watch.
🟢 1. BULLISH EMA STRUCTURE
EMA 50: $0.020262
EMA 200: $0.014904
Price is trading above both moving averages.
EMA 50 is also above EMA 200, indicating a bullish structure on the 1H timeframe.
As long as price holds above the EMA 50 area, buyers may retain short-term control.
🔴 2. THE MOST IMPORTANT RESISTANCE
IDOL is approaching a major supply zone around:
$0.0247 – $0.0260
This is the key battle area for buyers and sellers.
A confirmed 1H candle close above this zone, supported by strong volume, could signal a potential breakout.
But a rejection here could trigger short-term profit booking.
🎯 3. KEY LEVELS TO WATCH
Resistance:
- $0.025309 – 24H High
- $0.0260 – Major resistance area
- $0.031411 – Previous swing high
Support:
- $0.0224 – Near-term support
- $0.0202 – EMA 50 area
- $0.0170–$0.0178 – Major demand zone
🚀 4. TWO POSSIBLE SCENARIOS
🟢 BULLISH SCENARIO:
If IDOL breaks above $0.0260 with strong volume and successfully retests the zone, the next major upside level to watch is $0.0292, followed by $0.031411.
🔴 BEARISH SCENARIO:
If price fails to break resistance and falls below $0.0224, a pullback toward $0.0202 becomes possible.
Losing the EMA 50 area could weaken the current bullish structure.
🧠 MY FINAL ANALYSIS
IDOL is showing strong bullish momentum, but price is now approaching an important resistance zone.
I am watching one thing closely:
Will buyers convert this resistance into support?
A breakout confirmation matters more than simply buying into a green candle.
Patience, volume confirmation and risk management are essential.
💬 YOUR TURN!
What do you think happens next?
🔥 BULLISH – IDOL breaks $0.0260 and targets $0.0314.
🐻 BEARISH – Resistance rejects price and a correction begins.
Drop your prediction below! 👇
#IDOL #MEET48 #IDOLUSDT #CryptoAnalysis #BinanceSquare #Altcoins #CryptoTrading #TechnicalAnalysis
⚠️ Disclaimer: This is educational technical analysis based on the displayed chart, not financial advice. Crypto futures are highly risky. Always manage your risk.
🔥 IDOL is approaching a critical decision point!
MEET48 (IDOLUSDT) is showing impressive bullish momentum, with price climbing more than 45% in 24 hours.
But there is one important question:
Can bulls break the resistance, or are we about to see another rejection?
Let's analyze the 1H chart.
📊 MARKET DATA
- Current Price: $0.024676
- 24H Change: +45.56%
- 24H High: $0.025309
- 24H Low: $0.016816
- 24H Volume: 180.53M USDT
High volatility and strong trading activity are making IDOL an interesting altcoin to watch.
🟢 1. BULLISH EMA STRUCTURE
EMA 50: $0.020262
EMA 200: $0.014904
Price is trading above both moving averages.
EMA 50 is also above EMA 200, indicating a bullish structure on the 1H timeframe.
As long as price holds above the EMA 50 area, buyers may retain short-term control.
🔴 2. THE MOST IMPORTANT RESISTANCE
IDOL is approaching a major supply zone around:
$0.0247 – $0.0260
This is the key battle area for buyers and sellers.
A confirmed 1H candle close above this zone, supported by strong volume, could signal a potential breakout.
But a rejection here could trigger short-term profit booking.
🎯 3. KEY LEVELS TO WATCH
Resistance:
- $0.025309 – 24H High
- $0.0260 – Major resistance area
- $0.031411 – Previous swing high
Support:
- $0.0224 – Near-term support
- $0.0202 – EMA 50 area
- $0.0170–$0.0178 – Major demand zone
🚀 4. TWO POSSIBLE SCENARIOS
🟢 BULLISH SCENARIO:
If IDOL breaks above $0.0260 with strong volume and successfully retests the zone, the next major upside level to watch is $0.0292, followed by $0.031411.
🔴 BEARISH SCENARIO:
If price fails to break resistance and falls below $0.0224, a pullback toward $0.0202 becomes possible.
Losing the EMA 50 area could weaken the current bullish structure.
🧠 MY FINAL ANALYSIS
IDOL is showing strong bullish momentum, but price is now approaching an important resistance zone.
I am watching one thing closely:
Will buyers convert this resistance into support?
A breakout confirmation matters more than simply buying into a green candle.
Patience, volume confirmation and risk management are essential.
💬 YOUR TURN!
What do you think happens next?
🔥 BULLISH – IDOL breaks $0.0260 and targets $0.0314.
🐻 BEARISH – Resistance rejects price and a correction begins.
Drop your prediction below! 👇
#IDOL #MEET48 #IDOLUSDT #CryptoAnalysis #BinanceSquare #Altcoins #CryptoTrading #TechnicalAnalysis
⚠️ Disclaimer: This is educational technical analysis based on the displayed chart, not financial advice. Crypto futures are highly risky. Always manage your risk.
321
·
--
Статья
$ESPORTS UP 117%🚀 $ESPORTS UP 117% — Is Yooldo Preparing for Another Breakout or a Major Correction?
A massive rally has brought $ESPORTS into the spotlight. But is the bullish momentum strong enough to continue?
Let's break down the technical structure.
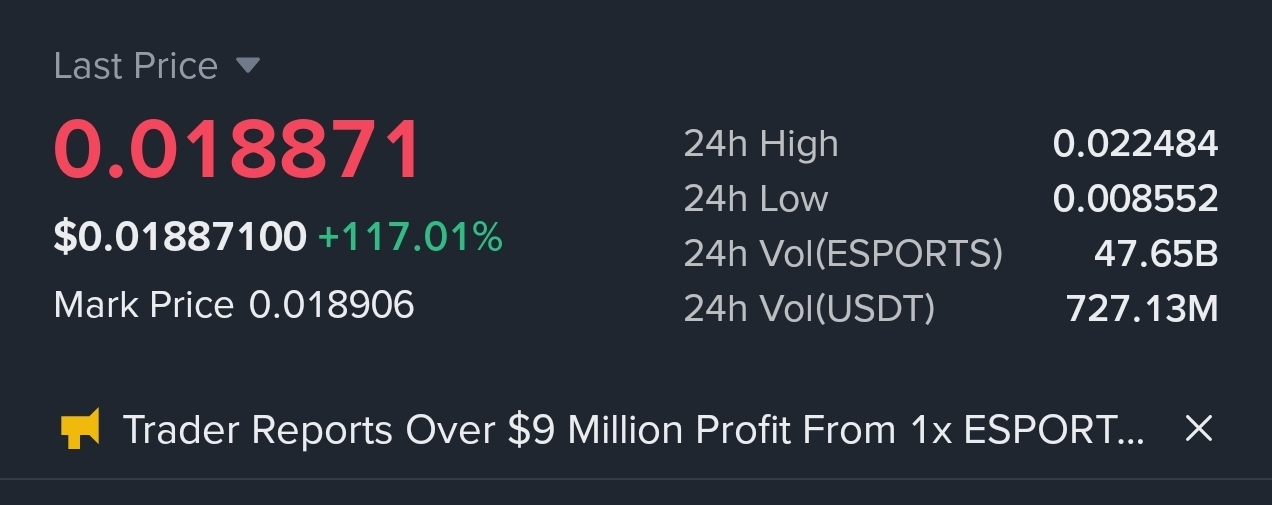
📊 CHART ANALYSIS — 15 MIN TIMEFRAME
According to the chart snapshot:
- Current price: 0.018871 USDT
- 24H change: +117.01%
- 24H high: 0.022484
- 24H low: 0.008552
- EMA 50: 0.017513
- EMA 200: 0.012397
🟢 1. Bullish Market Structure
ESPORTS has experienced a strong upward move, breaking above its previous consolidation zone.
The price is currently trading above both EMA 50 and EMA 200.
This indicates strong short-term momentum.
However, after such a sharp rally, volatility and profit-taking should not be ignored.
🔴 2. Important Resistance Zone
The immediate resistance to watch is:
0.0217 – 0.0225 USDT
The previous high near 0.022484 is an important level.
If buyers manage to push price above this zone and hold it with strong volume, another bullish move could develop.
A rejection from this zone could trigger further consolidation.
🟢 3. Important Support Levels
Here are the levels I am watching:
- 0.0175 — EMA 50 / immediate support area
- 0.0131 — Previous breakout and support zone
- 0.0124 — EMA 200
- 0.0090 — Lower historical support area
A sustained move below EMA 50 could weaken the immediate bullish structure.
📈 4. Two Possible Scenarios
BULLISH SCENARIO
If ESPORTS holds above 0.0175 and buyers regain momentum, a retest of 0.0217–0.0225 becomes possible.
A confirmed breakout above 0.0225 could open the door for further price discovery.
BEARISH SCENARIO
If price loses 0.0175 with strong selling pressure, a deeper correction toward 0.0131 could become possible.
Failure to hold that zone would make the structure weaker.
⚠️ 5. My Final View
ESPORTS is showing strong bullish momentum, but chasing a coin after a 117% rally can be risky.
I would rather wait for a confirmed breakout or a healthy support retest than enter emotionally.
Remember: High volume does not guarantee further upside.
The next important battle is between buyers near support and sellers near 0.0225.
👇 COMMUNITY QUESTION
What do you think happens next?
🟢 BULLISH — ESPORTS breaks above 0.0225
🔴 BEARISH — ESPORTS corrects toward 0.0131
Share your analysis in the comments!
#ESPORTS #YOOLDO #CryptoAnalysis #BinanceSquare #Altcoins #TechnicalAnalysis
Disclaimer: This is technical analysis based on a chart snapshot, not financial advice. Levels are indicative, not guaranteed. Cryptocurrency futures carry significant risk.
$ESPORTS UP 117%
🚀 $ESPORTS UP 117% — Is Yooldo Preparing for Another Breakout or a Major Correction?
A massive rally has brought $ESPORTS into the spotlight. But is the bullish momentum strong enough to continue?
Let's break down the technical structure.
📊 CHART ANALYSIS — 15 MIN TIMEFRAME
According to the chart snapshot:
- Current price: 0.018871 USDT
- 24H change: +117.01%
- 24H high: 0.022484
- 24H low: 0.008552
- EMA 50: 0.017513
- EMA 200: 0.012397
🟢 1. Bullish Market Structure
ESPORTS has experienced a strong upward move, breaking above its previous consolidation zone.
The price is currently trading above both EMA 50 and EMA 200.
This indicates strong short-term momentum.
However, after such a sharp rally, volatility and profit-taking should not be ignored.
🔴 2. Important Resistance Zone
The immediate resistance to watch is:
0.0217 – 0.0225 USDT
The previous high near 0.022484 is an important level.
If buyers manage to push price above this zone and hold it with strong volume, another bullish move could develop.
A rejection from this zone could trigger further consolidation.
🟢 3. Important Support Levels
Here are the levels I am watching:
- 0.0175 — EMA 50 / immediate support area
- 0.0131 — Previous breakout and support zone
- 0.0124 — EMA 200
- 0.0090 — Lower historical support area
A sustained move below EMA 50 could weaken the immediate bullish structure.
📈 4. Two Possible Scenarios
BULLISH SCENARIO
If ESPORTS holds above 0.0175 and buyers regain momentum, a retest of 0.0217–0.0225 becomes possible.
A confirmed breakout above 0.0225 could open the door for further price discovery.
BEARISH SCENARIO
If price loses 0.0175 with strong selling pressure, a deeper correction toward 0.0131 could become possible.
Failure to hold that zone would make the structure weaker.
⚠️ 5. My Final View
ESPORTS is showing strong bullish momentum, but chasing a coin after a 117% rally can be risky.
I would rather wait for a confirmed breakout or a healthy support retest than enter emotionally.
Remember: High volume does not guarantee further upside.
The next important battle is between buyers near support and sellers near 0.0225.
👇 COMMUNITY QUESTION
What do you think happens next?
🟢 BULLISH — ESPORTS breaks above 0.0225
🔴 BEARISH — ESPORTS corrects toward 0.0131
Share your analysis in the comments!
#ESPORTS #YOOLDO #CryptoAnalysis #BinanceSquare #Altcoins #TechnicalAnalysis
Disclaimer: This is technical analysis based on a chart snapshot, not financial advice. Levels are indicative, not guaranteed. Cryptocurrency futures carry significant risk.
A massive rally has brought $ESPORTS into the spotlight. But is the bullish momentum strong enough to continue?
Let's break down the technical structure.
📊 CHART ANALYSIS — 15 MIN TIMEFRAME
According to the chart snapshot:
- Current price: 0.018871 USDT
- 24H change: +117.01%
- 24H high: 0.022484
- 24H low: 0.008552
- EMA 50: 0.017513
- EMA 200: 0.012397
🟢 1. Bullish Market Structure
ESPORTS has experienced a strong upward move, breaking above its previous consolidation zone.
The price is currently trading above both EMA 50 and EMA 200.
This indicates strong short-term momentum.
However, after such a sharp rally, volatility and profit-taking should not be ignored.
🔴 2. Important Resistance Zone
The immediate resistance to watch is:
0.0217 – 0.0225 USDT
The previous high near 0.022484 is an important level.
If buyers manage to push price above this zone and hold it with strong volume, another bullish move could develop.
A rejection from this zone could trigger further consolidation.
🟢 3. Important Support Levels
Here are the levels I am watching:
- 0.0175 — EMA 50 / immediate support area
- 0.0131 — Previous breakout and support zone
- 0.0124 — EMA 200
- 0.0090 — Lower historical support area
A sustained move below EMA 50 could weaken the immediate bullish structure.
📈 4. Two Possible Scenarios
BULLISH SCENARIO
If ESPORTS holds above 0.0175 and buyers regain momentum, a retest of 0.0217–0.0225 becomes possible.
A confirmed breakout above 0.0225 could open the door for further price discovery.
BEARISH SCENARIO
If price loses 0.0175 with strong selling pressure, a deeper correction toward 0.0131 could become possible.
Failure to hold that zone would make the structure weaker.
⚠️ 5. My Final View
ESPORTS is showing strong bullish momentum, but chasing a coin after a 117% rally can be risky.
I would rather wait for a confirmed breakout or a healthy support retest than enter emotionally.
Remember: High volume does not guarantee further upside.
The next important battle is between buyers near support and sellers near 0.0225.
👇 COMMUNITY QUESTION
What do you think happens next?
🟢 BULLISH — ESPORTS breaks above 0.0225
🔴 BEARISH — ESPORTS corrects toward 0.0131
Share your analysis in the comments!
#ESPORTS #YOOLDO #CryptoAnalysis #BinanceSquare #Altcoins #TechnicalAnalysis
Disclaimer: This is technical analysis based on a chart snapshot, not financial advice. Levels are indicative, not guaranteed. Cryptocurrency futures carry significant risk.
439
·
--
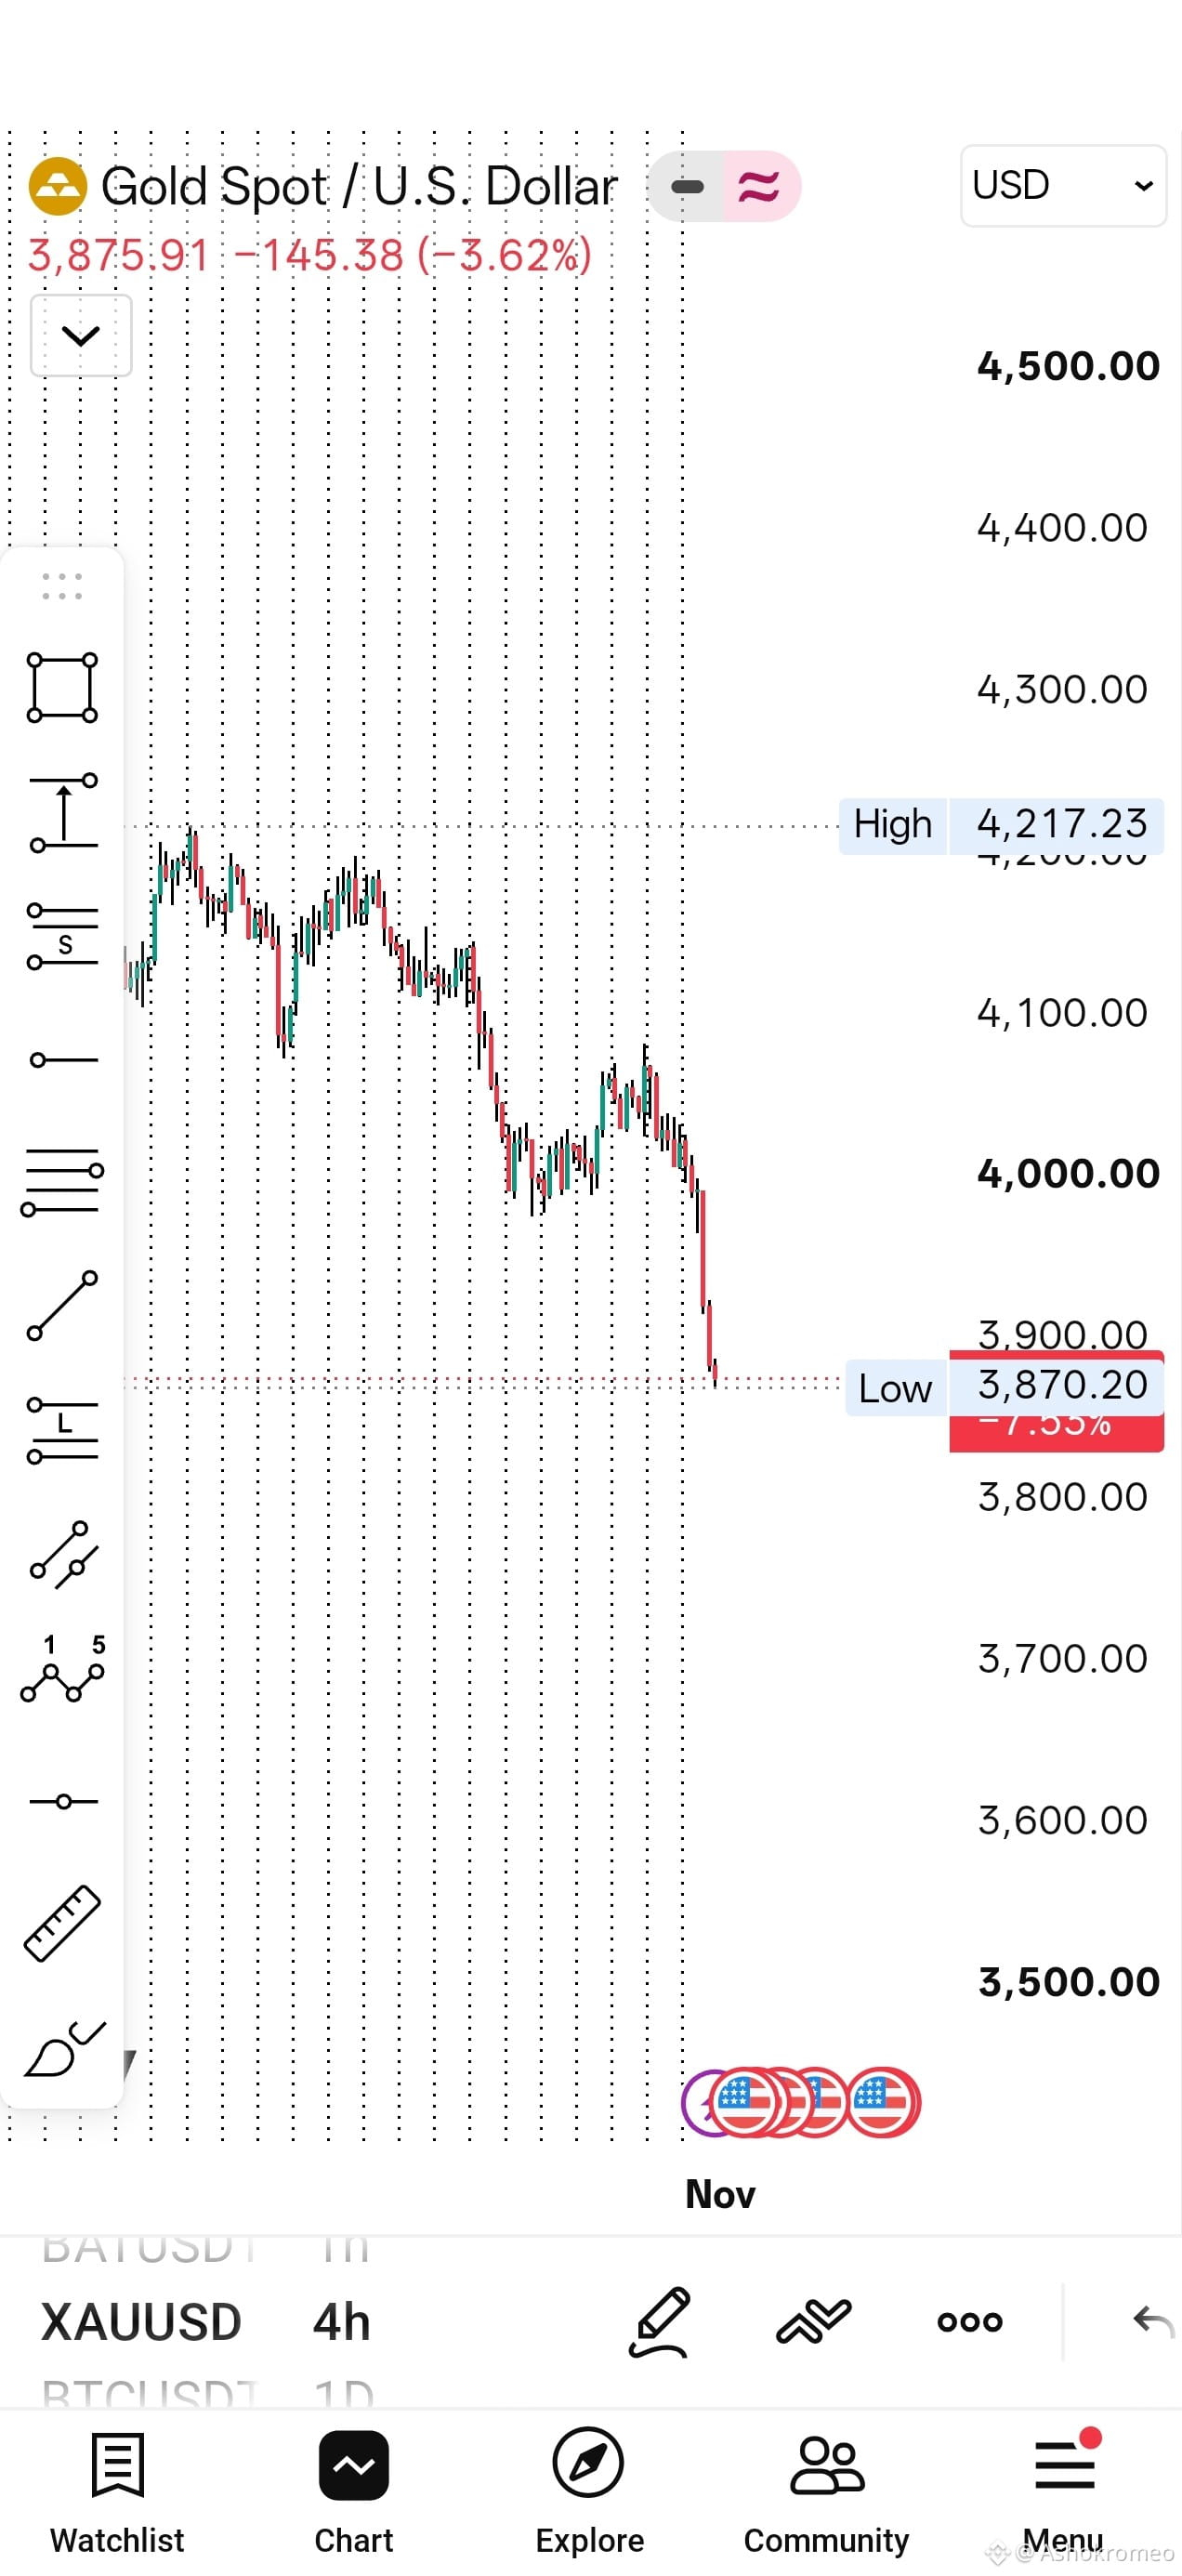
Gold Spot (XAU/USD) Market Flash: Sharp Pullback Tests Key Support at $3,870
Gold ($XAUUSD) has experienced a steep decline on the 4-hour timeframe, falling from recent highs above $4,217 down to test fresh local lows near $3,870. Currently trading at $3,875.91, the asset is down -3.62% (-$145.38) as aggressive selling pressure takes control heading into November.
Key Market Data
* Current Price: $3,875.91
* Session Change: -$145.38 (-3.62%)
* Recent Swing High: $4,217.23
* Local Low: $3,870.20
* Critical Psychological Level: $3,900.00
Technical Breakdown
* Breakdown Below $4,000: After consolidating between $4,000 and $4,100, gold failed to maintain higher support, triggering a high-momentum sell-off that sliced cleanly through the key $4,000 psychological threshold.
* Support Test at $3,870: The sharp drop halted directly at the $3,870.20 level. A reaction from buyers is visible here, but price remains pinned beneath the immediate overhead level at $3,900.00.
* Market Sentiment: Bears firmly control the short-to-medium structure following lower highs off the $4,217.23 peak. Until bulls can reclaim key levels above $3,900, the market remains in an oversold consolidation phase.
Levels to Watch
* Immediate Resistance ($3,900.00 – $4,000.00): Bulls must reclaim $3,900 to slow the downward trend, with $4,000 serving as primary resistance on any relief bounce.
* Crucial Support ($3,870.20): A decisive break below the $3,870.20 low would signal continuation toward lower liquidity zones around $3,800.00 – $3,700.00.
Disclaimer: This analysis is for informational purposes only and does not constitute financial advice. Always apply strict risk management and appropriate stop-loss limits when trading leveraged commodity pairs.
$XAUT
$BTC
$BNB
Gold Spot (XAU/USD) Market Flash: Sharp Pullback Tests Key Support at $3,870
Gold ($XAUUSD) has experienced a steep decline on the 4-hour timeframe, falling from recent highs above $4,217 down to test fresh local lows near $3,870. Currently trading at $3,875.91, the asset is down -3.62% (-$145.38) as aggressive selling pressure takes control heading into November.
Key Market Data
* Current Price: $3,875.91
* Session Change: -$145.38 (-3.62%)
* Recent Swing High: $4,217.23
* Local Low: $3,870.20
* Critical Psychological Level: $3,900.00
Technical Breakdown
* Breakdown Below $4,000: After consolidating between $4,000 and $4,100, gold failed to maintain higher support, triggering a high-momentum sell-off that sliced cleanly through the key $4,000 psychological threshold.
* Support Test at $3,870: The sharp drop halted directly at the $3,870.20 level. A reaction from buyers is visible here, but price remains pinned beneath the immediate overhead level at $3,900.00.
* Market Sentiment: Bears firmly control the short-to-medium structure following lower highs off the $4,217.23 peak. Until bulls can reclaim key levels above $3,900, the market remains in an oversold consolidation phase.
Levels to Watch
* Immediate Resistance ($3,900.00 – $4,000.00): Bulls must reclaim $3,900 to slow the downward trend, with $4,000 serving as primary resistance on any relief bounce.
* Crucial Support ($3,870.20): A decisive break below the $3,870.20 low would signal continuation toward lower liquidity zones around $3,800.00 – $3,700.00.
Disclaimer: This analysis is for informational purposes only and does not constitute financial advice. Always apply strict risk management and appropriate stop-loss limits when trading leveraged commodity pairs.
$XAUT
$BTC
$BNB
Gold ($XAUUSD) has experienced a steep decline on the 4-hour timeframe, falling from recent highs above $4,217 down to test fresh local lows near $3,870. Currently trading at $3,875.91, the asset is down -3.62% (-$145.38) as aggressive selling pressure takes control heading into November.
Key Market Data
* Current Price: $3,875.91
* Session Change: -$145.38 (-3.62%)
* Recent Swing High: $4,217.23
* Local Low: $3,870.20
* Critical Psychological Level: $3,900.00
Technical Breakdown
* Breakdown Below $4,000: After consolidating between $4,000 and $4,100, gold failed to maintain higher support, triggering a high-momentum sell-off that sliced cleanly through the key $4,000 psychological threshold.
* Support Test at $3,870: The sharp drop halted directly at the $3,870.20 level. A reaction from buyers is visible here, but price remains pinned beneath the immediate overhead level at $3,900.00.
* Market Sentiment: Bears firmly control the short-to-medium structure following lower highs off the $4,217.23 peak. Until bulls can reclaim key levels above $3,900, the market remains in an oversold consolidation phase.
Levels to Watch
* Immediate Resistance ($3,900.00 – $4,000.00): Bulls must reclaim $3,900 to slow the downward trend, with $4,000 serving as primary resistance on any relief bounce.
* Crucial Support ($3,870.20): A decisive break below the $3,870.20 low would signal continuation toward lower liquidity zones around $3,800.00 – $3,700.00.
Disclaimer: This analysis is for informational purposes only and does not constitute financial advice. Always apply strict risk management and appropriate stop-loss limits when trading leveraged commodity pairs.
$XAUT
$BTC
$BNB
282
·
--
Рост
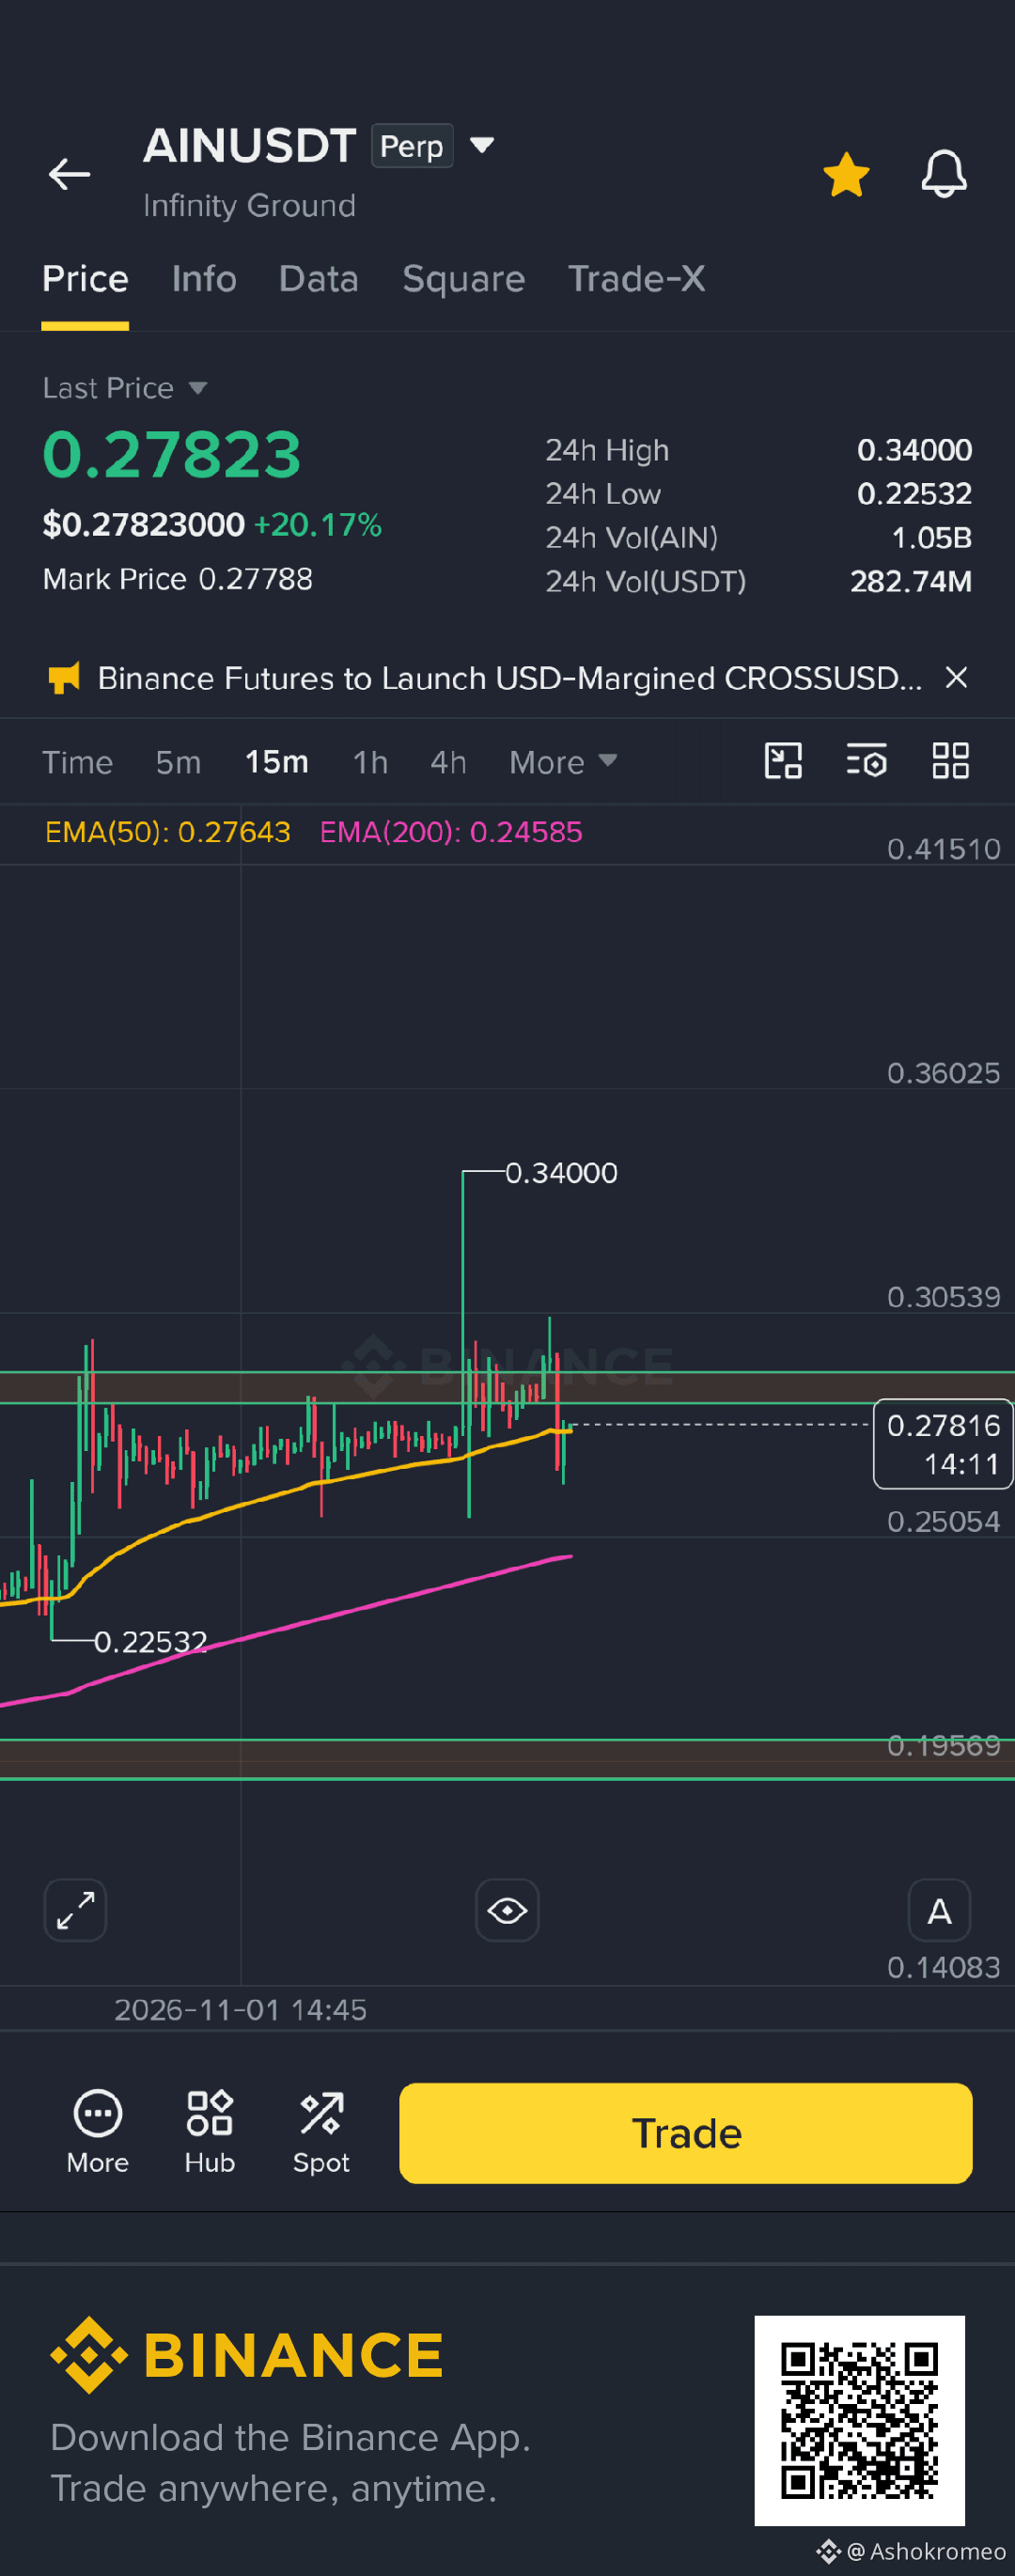
🚨 $AIN at Critical Decision Zone — Breakout or Bull Trap?
$AIN is testing a major HTF level after sweeping liquidity below . Here is the exact invalidation and where the smart money is positioned:
📊 The Technical Structure:
• Timeframe: [5M / 15 M]
• Trend/Pattern: [Ascending Channel / Range Equilibrium / Double Bottom]
• Key Support / Demand
• Major Resistance / Supply
• EMA 50/200 Market is moving up
so it's clear market is bullish
🎯 Two Scenarios on My Watchlist:
1️⃣ Bullish Continuation:
• Trigger: 15M candle close above Resistance
• Target 1: 0.31
• Target 2: 0.35
• Invalidation: Close below 0.25
2️⃣ Rejection & Sweep:
• If rejected from resistance area , looking for a liquidity re-test 200 EMA
⚠️ Risk Note:
[Insert key macro catalyst or token unlock date]. Always manage position size—never chase green candles.
👇 Poll / Discussion:
Are you longing this breakout or waiting for a dip back Support.Let’s hear your target below!
#CryptoTrading #TechnicalAnalysis #Write2Earn $AIN #AIN
🚨 $AIN at Critical Decision Zone — Breakout or Bull Trap?
$AIN is testing a major HTF level after sweeping liquidity below . Here is the exact invalidation and where the smart money is positioned:
📊 The Technical Structure:
• Timeframe: [5M / 15 M]
• Trend/Pattern: [Ascending Channel / Range Equilibrium / Double Bottom]
• Key Support / Demand
• Major Resistance / Supply
• EMA 50/200 Market is moving up
so it's clear market is bullish
🎯 Two Scenarios on My Watchlist:
1️⃣ Bullish Continuation:
• Trigger: 15M candle close above Resistance
• Target 1: 0.31
• Target 2: 0.35
• Invalidation: Close below 0.25
2️⃣ Rejection & Sweep:
• If rejected from resistance area , looking for a liquidity re-test 200 EMA
⚠️ Risk Note:
[Insert key macro catalyst or token unlock date]. Always manage position size—never chase green candles.
👇 Poll / Discussion:
Are you longing this breakout or waiting for a dip back Support.Let’s hear your target below!
#CryptoTrading #TechnicalAnalysis #Write2Earn $AIN #AIN
$AIN is testing a major HTF level after sweeping liquidity below . Here is the exact invalidation and where the smart money is positioned:
📊 The Technical Structure:
• Timeframe: [5M / 15 M]
• Trend/Pattern: [Ascending Channel / Range Equilibrium / Double Bottom]
• Key Support / Demand
• Major Resistance / Supply
• EMA 50/200 Market is moving up
so it's clear market is bullish
🎯 Two Scenarios on My Watchlist:
1️⃣ Bullish Continuation:
• Trigger: 15M candle close above Resistance
• Target 1: 0.31
• Target 2: 0.35
• Invalidation: Close below 0.25
2️⃣ Rejection & Sweep:
• If rejected from resistance area , looking for a liquidity re-test 200 EMA
⚠️ Risk Note:
[Insert key macro catalyst or token unlock date]. Always manage position size—never chase green candles.
👇 Poll / Discussion:
Are you longing this breakout or waiting for a dip back Support.Let’s hear your target below!
#CryptoTrading #TechnicalAnalysis #Write2Earn $AIN #AIN
378
·
--
Рост
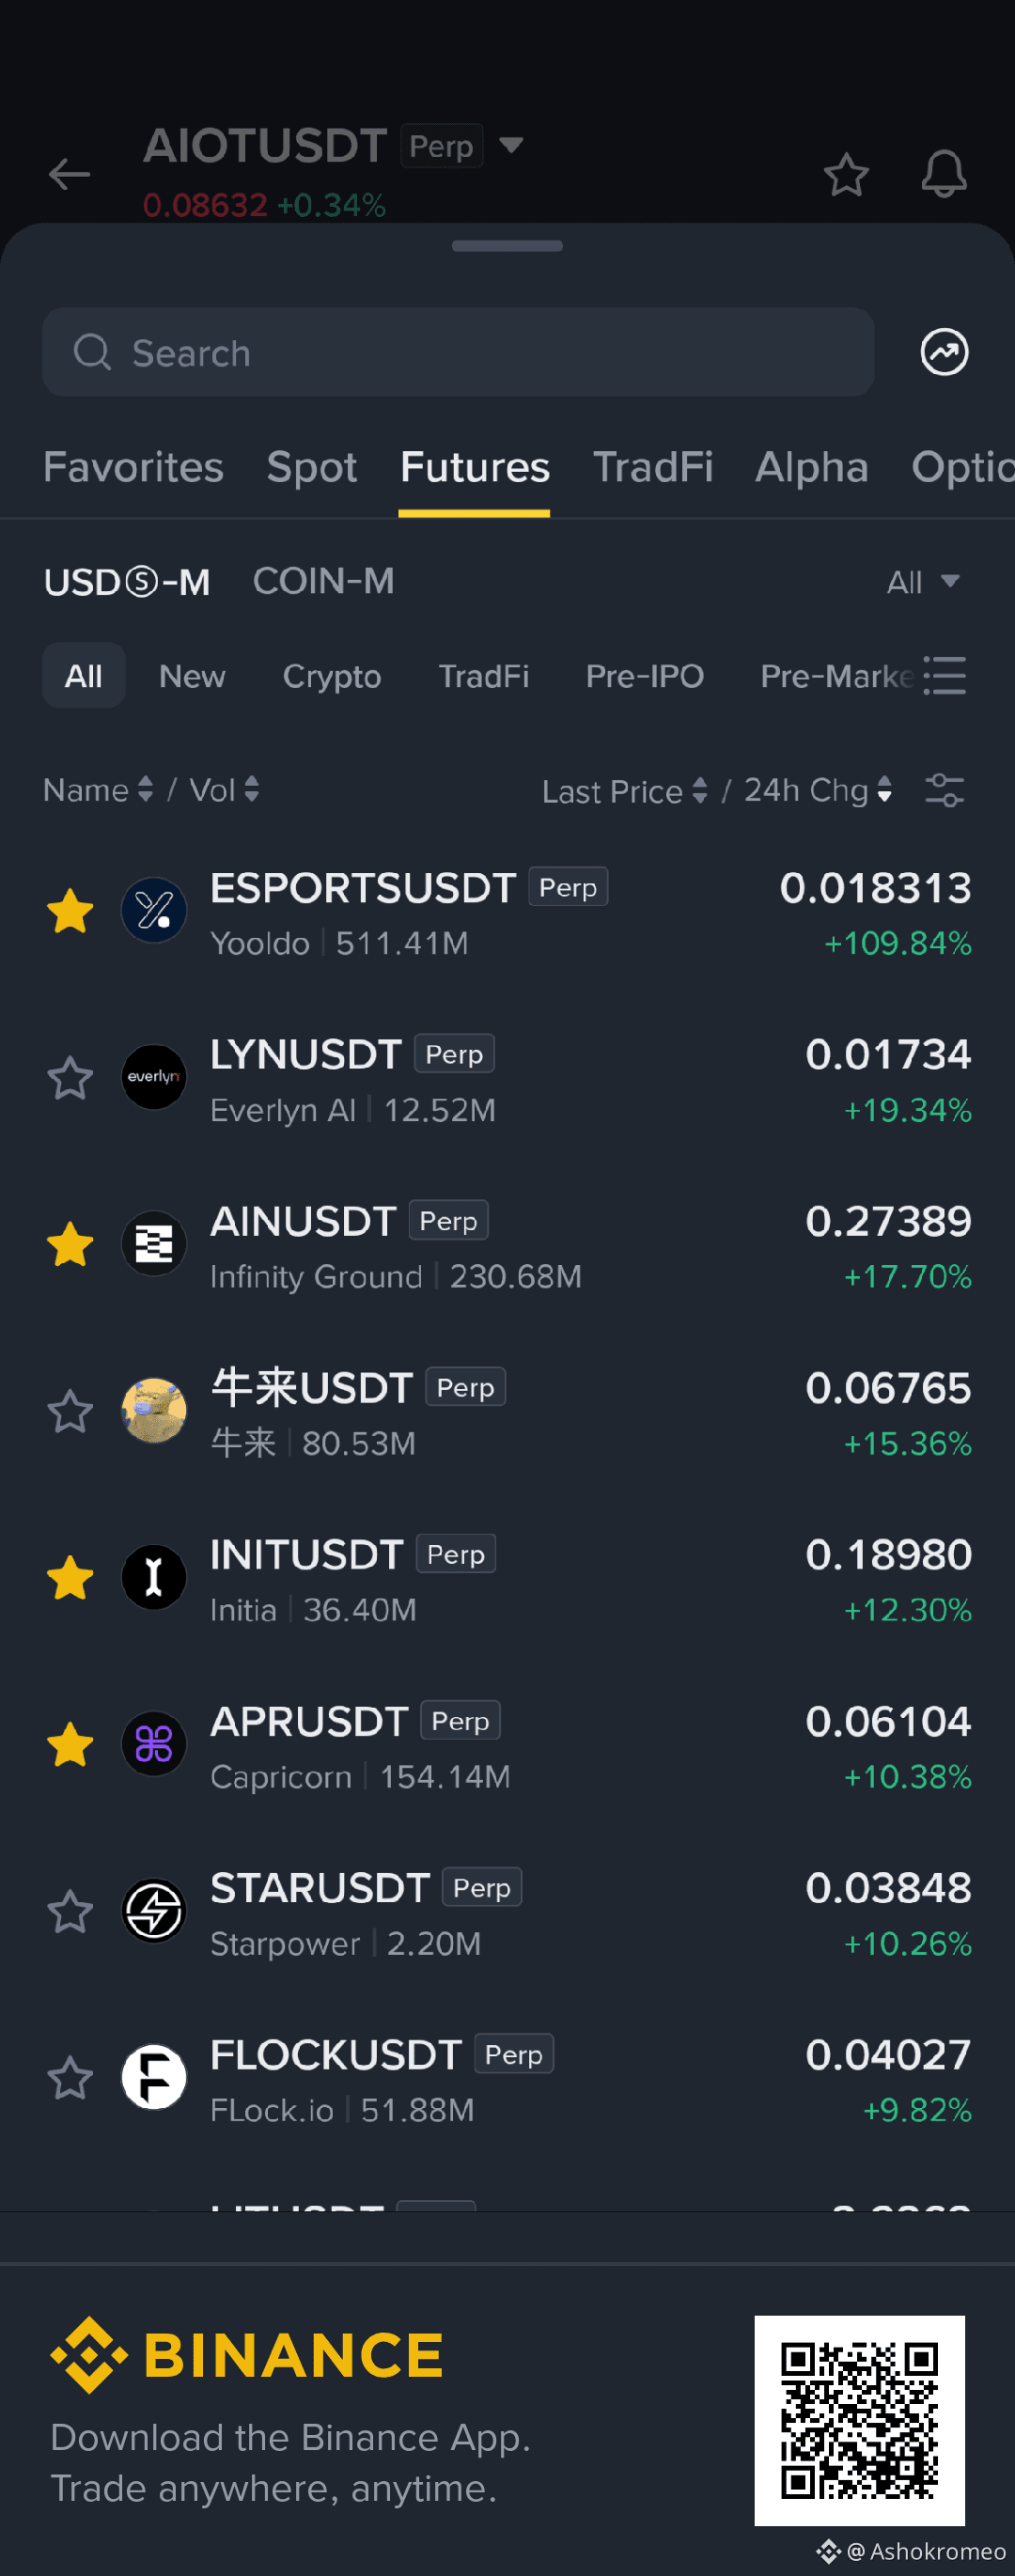
omg #ESPOPTSUSDT pump 109%
rest all 19-20 %
more liquidity in #ESPOPTSUSDT
be careful liquidity mean liquidation
trade with small amount 🤏
$ESPORTS
omg #ESPOPTSUSDT pump 109%
rest all 19-20 %
more liquidity in #ESPOPTSUSDT
be careful liquidity mean liquidation
trade with small amount 🤏
$ESPORTS
rest all 19-20 %
more liquidity in #ESPOPTSUSDT
be careful liquidity mean liquidation
trade with small amount 🤏
$ESPORTS
380
·
--
Рост
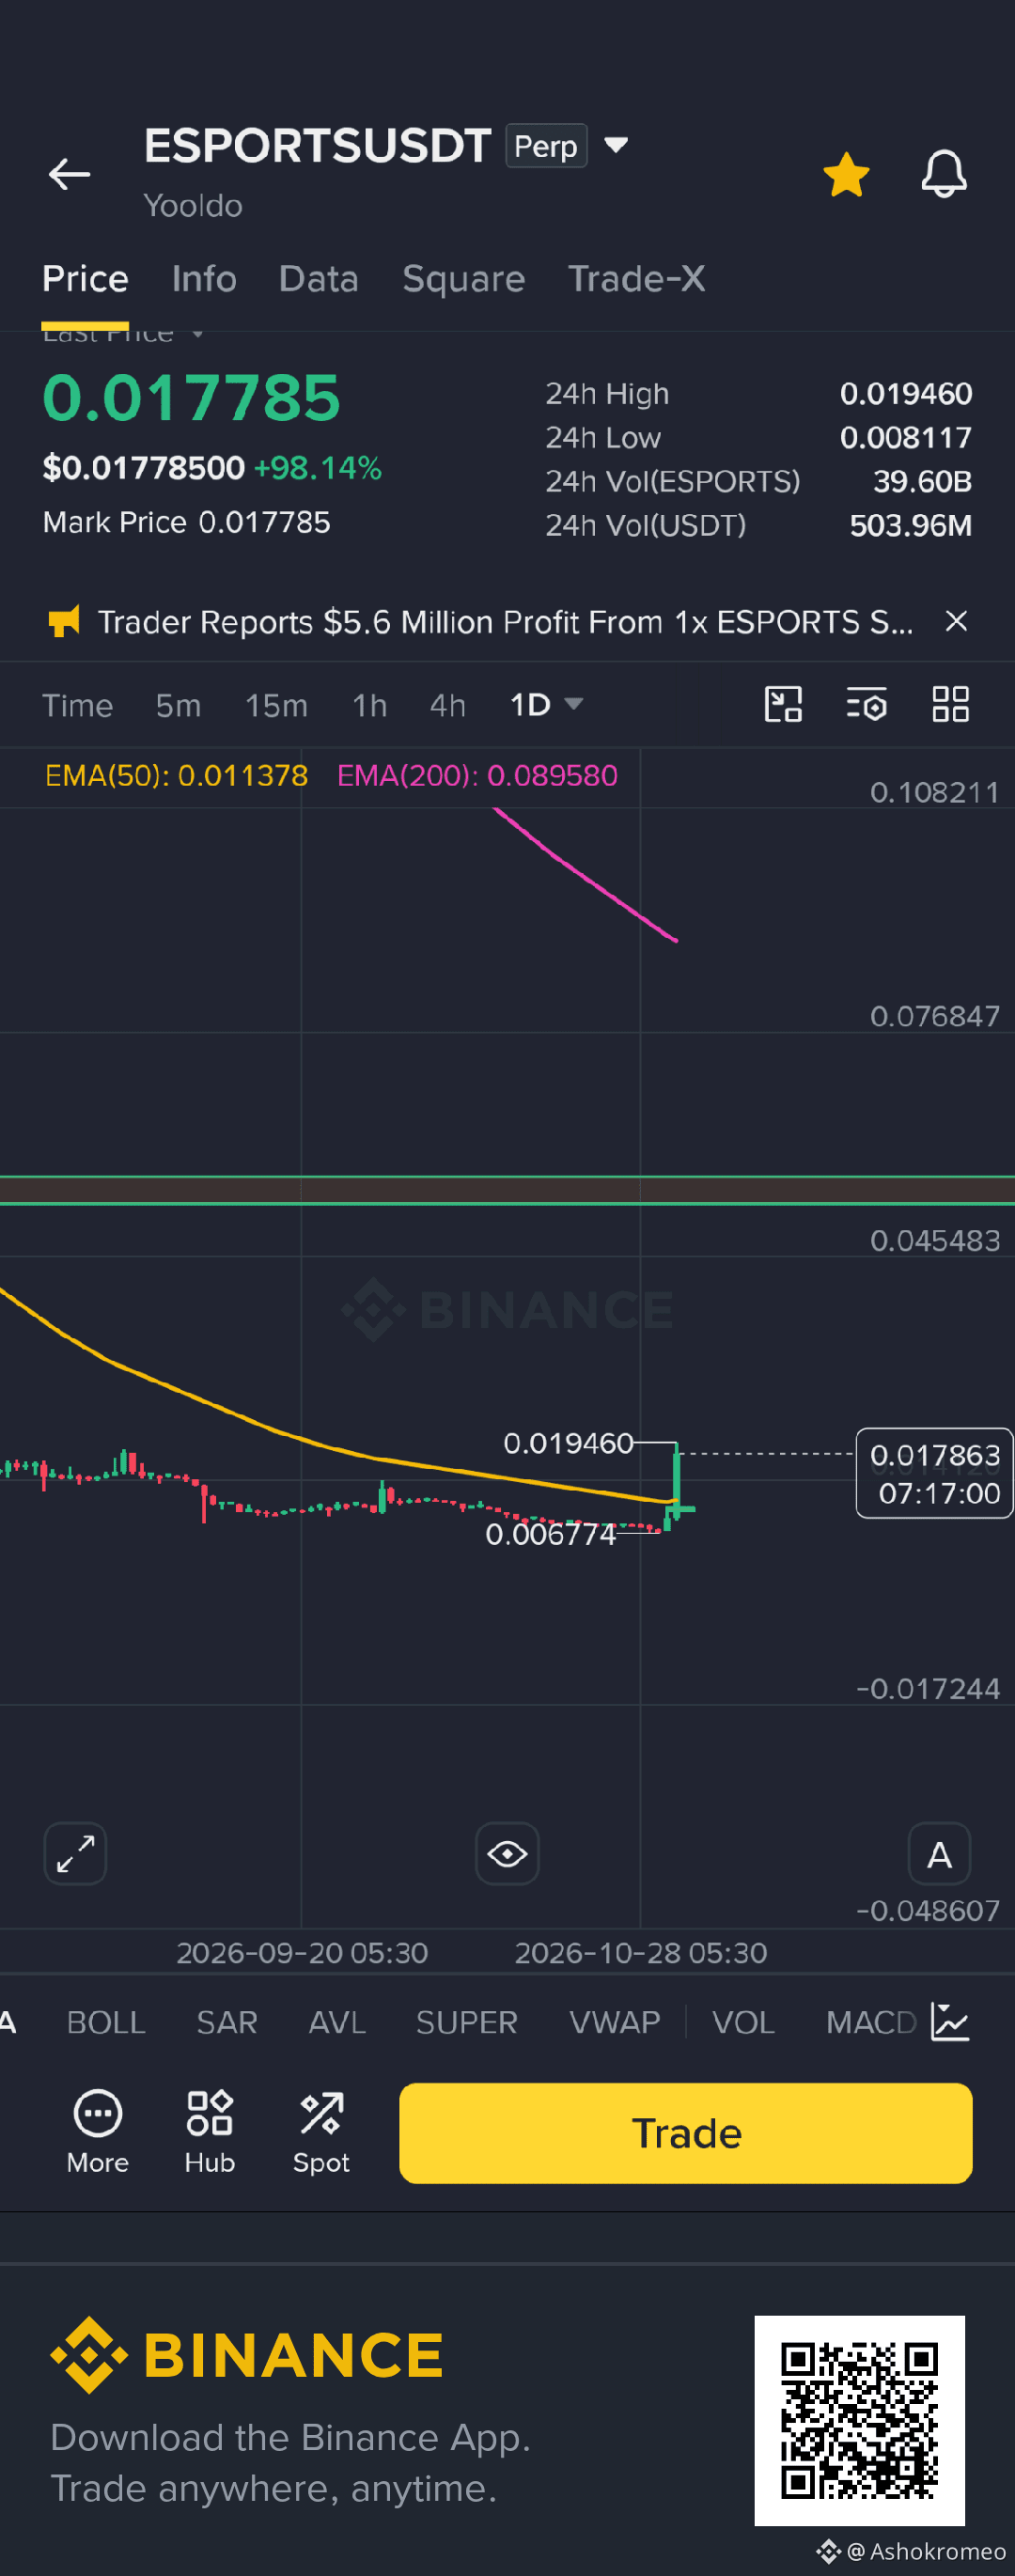
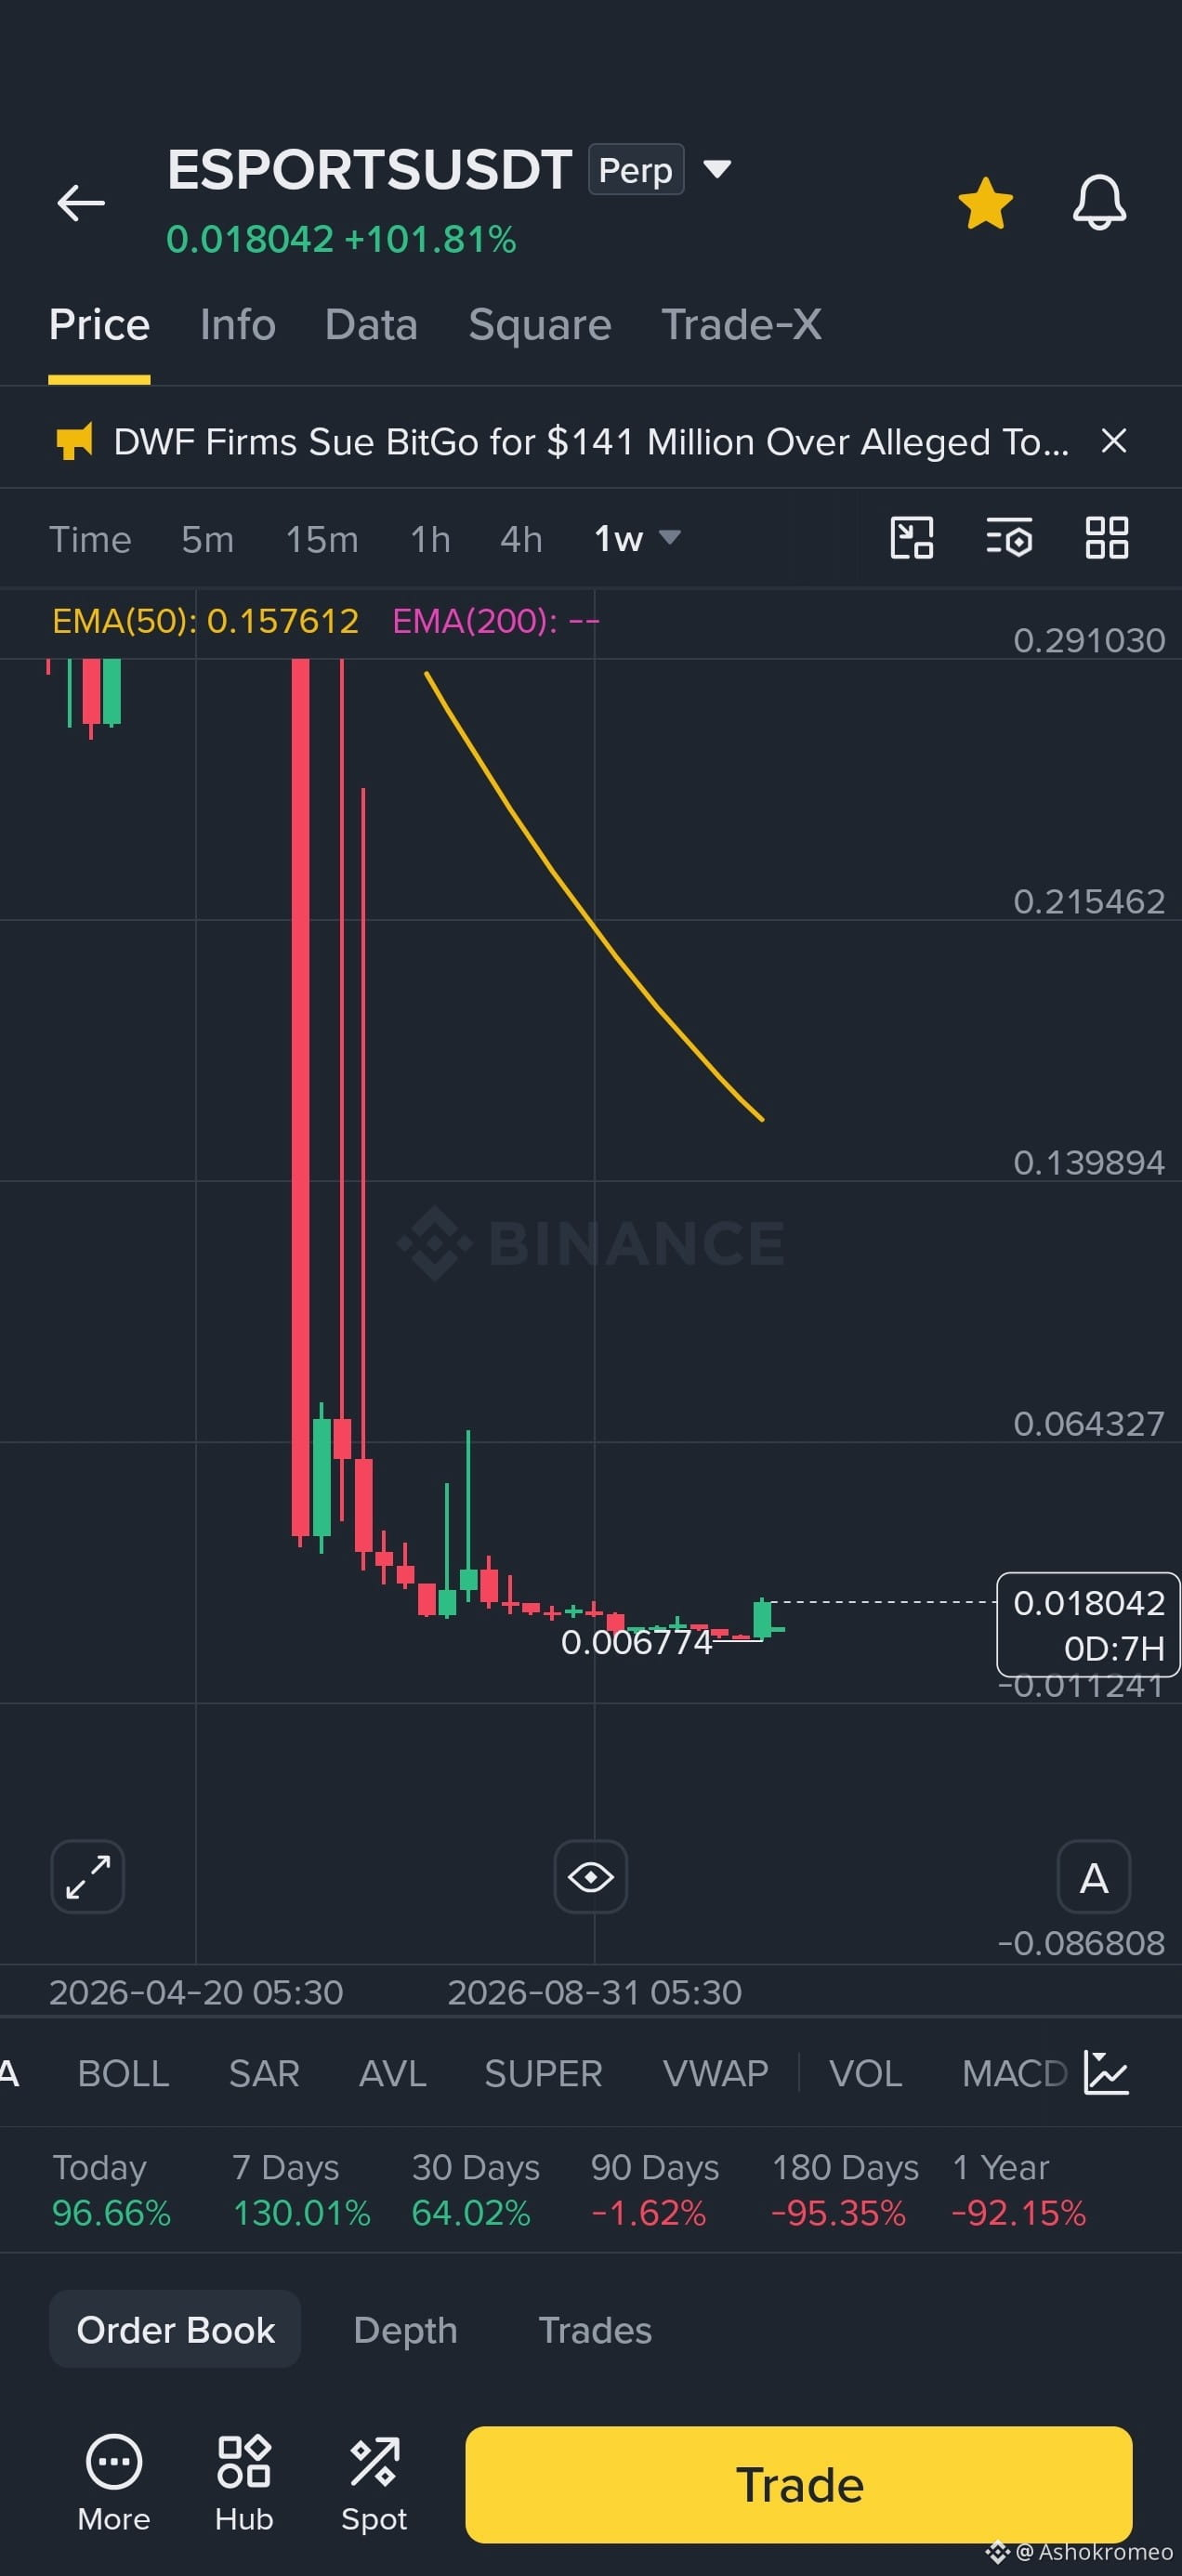
#ESPOPTSUSDT next resistance is to high level so time to moon according to 1D time frame
weekly looks good
what you think so comment your suggestion
$ESPORTS
$BTC
$ETH
#ESPOPTSUSDT next resistance is to high level so time to moon according to 1D time frame
weekly looks good
what you think so comment your suggestion
$ESPORTS
$BTC
$ETH
weekly looks good
what you think so comment your suggestion
$ESPORTS
$BTC
$ETH
338
·
--
Падение
349
·
--
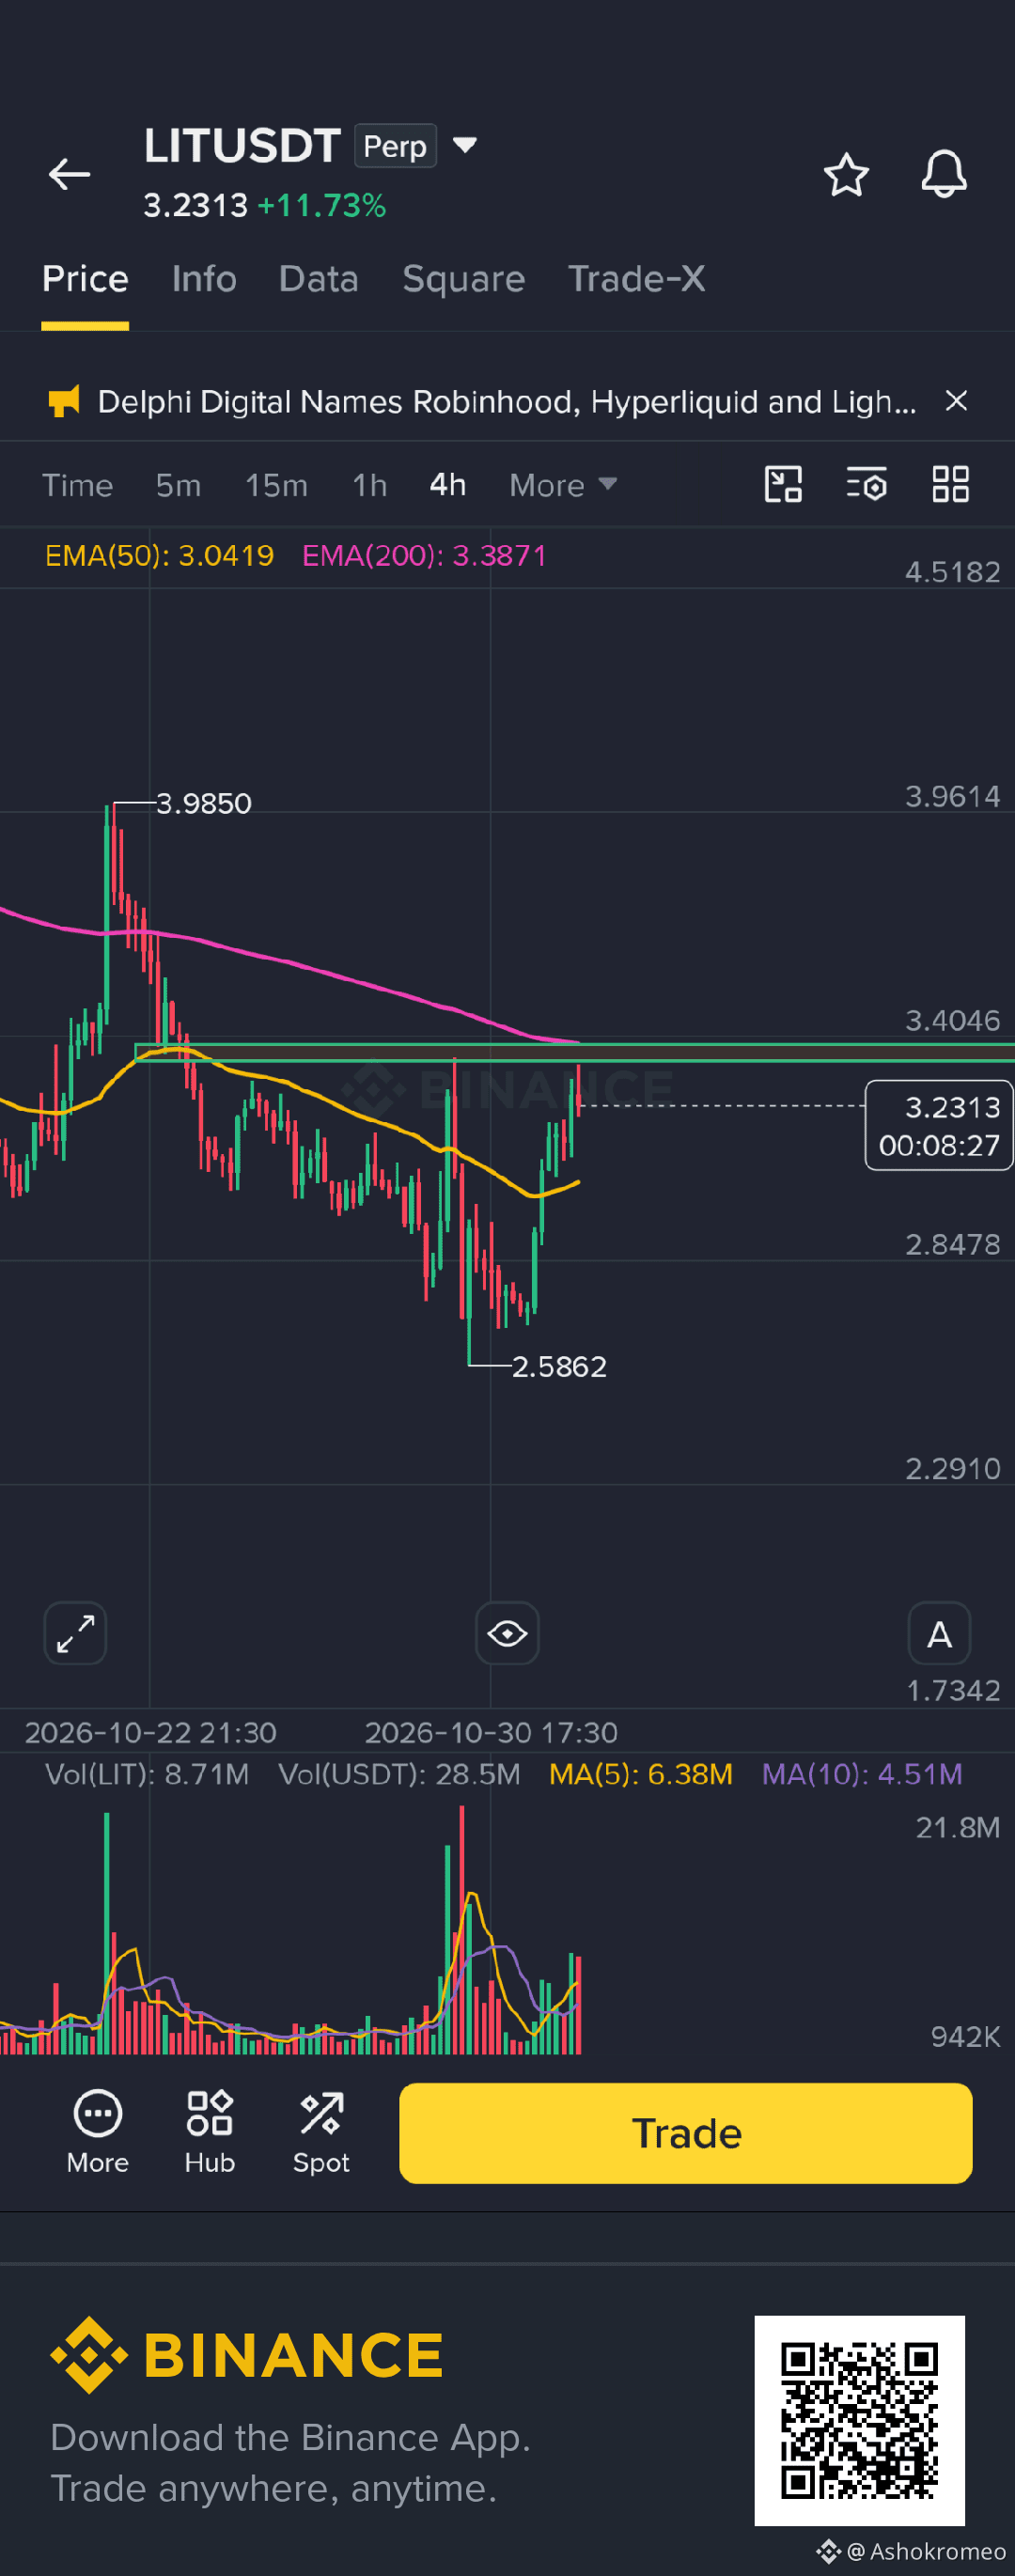
Падение
$LIT
resistance touch 2 time short time bearish
so take position on it right time
try to maintain risk reward according to you
$LIT
resistance touch 2 time short time bearish
so take position on it right time
try to maintain risk reward according to you
resistance touch 2 time short time bearish
so take position on it right time
try to maintain risk reward according to you
58
Войдите, чтобы посмотреть больше материала
Присоединяйтесь к пользователям криптовалют по всему миру на Binance Square
⚡️ Получайте новейшую и полезную информацию о криптоактивах.
💬 Нам доверяет крупнейшая в мире криптобиржа.
👍 Получите достоверные аналитические данные от верифицированных создателей контента.
Эл. почта/номер телефона
В тренде
BinanceProcesses$4.65BWithdrawals
Просмотров: 51,823
212 обсуждают
Binance Processes $4.65 Billion in Withdrawals After Reopening, Net Outflow of $3.64 Billion Equals 2.1% of Its $171 Billion in Assets
Binance News
·Лайков: 55
·Просмотров: 18.6k
WithdrawalsBack: 15 networks live
Просмотров: 11,350
166 обсуждают
EthereumSurpasses$2300
Просмотров: 259
34 обсуждают