
Anh_ba_Cong - COLE
20.4k Публикации

Anh_ba_Cong - COLE
Отправить жалобу
Заблокировать пользователя
I'm COLE (also known as Anh Ba Cong in Vietnam).
EA Expert with 4 years in Funds.
30K followers on YT and Binance.
Mastering automated trading together!

Владелец BNB
Трейдер с частыми сделками
8.8 г
248 подписок(и/а)
22.2K+ подписчиков(а)
30.1K+ понравилось
Посты
Все
Цитирования
Видео
Активно
ETHEREUM DEVELOPERS URGE PAUSE ON GLAMSTERDAM UPGRADE OVER SMART CONTRACT SECURITY RISKS
Ethereum ecosystem developers are calling on core protocol teams to halt the planned deployment of the Glamsterdam network upgrade, warning that scheduled gas accounting adjustments within EIP-8037 could break immutable smart contracts and leave user assets permanently stranded.
The collective pushback includes prominent community figures, such as the founder of Curve Finance and a board member of the Ethereum Foundation, while notable ecosystem advocates who previously supported rapid mainnet activation have officially withdrawn their endorsements. The primary technical concern centers on EIP-8037's repricing of state creation and access costs. Under the proposed schedule, deployed smart contracts relying on fixed gas limits or hardcoded gas thresholds risk running out of computational resources during subcalls, leading to state reverts that cannot be patched due to the inherent immutability of the underlying smart contracts.
This controversy follows earlier development friction in October 2026, when core contributors postponed the scheduled Glamsterdam trial on the Hoodi testnet after independent security researchers flagged systemic contract interaction risks. The core developer consortium now faces sustained community pressure to publish exhaustive empirical data and compatibility assessments before setting any formal activation schedule on the mainnet, preserving transactional stability across the ETH ecosystem.
DYOR. $ETH
{future}(ETHUSDT)
ETHEREUM DEVELOPERS URGE PAUSE ON GLAMSTERDAM UPGRADE OVER SMART CONTRACT SECURITY RISKS
Ethereum ecosystem developers are calling on core protocol teams to halt the planned deployment of the Glamsterdam network upgrade, warning that scheduled gas accounting adjustments within EIP-8037 could break immutable smart contracts and leave user assets permanently stranded.
The collective pushback includes prominent community figures, such as the founder of Curve Finance and a board member of the Ethereum Foundation, while notable ecosystem advocates who previously supported rapid mainnet activation have officially withdrawn their endorsements. The primary technical concern centers on EIP-8037's repricing of state creation and access costs. Under the proposed schedule, deployed smart contracts relying on fixed gas limits or hardcoded gas thresholds risk running out of computational resources during subcalls, leading to state reverts that cannot be patched due to the inherent immutability of the underlying smart contracts.
This controversy follows earlier development friction in October 2026, when core contributors postponed the scheduled Glamsterdam trial on the Hoodi testnet after independent security researchers flagged systemic contract interaction risks. The core developer consortium now faces sustained community pressure to publish exhaustive empirical data and compatibility assessments before setting any formal activation schedule on the mainnet, preserving transactional stability across the ETH ecosystem.
DYOR. $ETH
Ethereum ecosystem developers are calling on core protocol teams to halt the planned deployment of the Glamsterdam network upgrade, warning that scheduled gas accounting adjustments within EIP-8037 could break immutable smart contracts and leave user assets permanently stranded.
The collective pushback includes prominent community figures, such as the founder of Curve Finance and a board member of the Ethereum Foundation, while notable ecosystem advocates who previously supported rapid mainnet activation have officially withdrawn their endorsements. The primary technical concern centers on EIP-8037's repricing of state creation and access costs. Under the proposed schedule, deployed smart contracts relying on fixed gas limits or hardcoded gas thresholds risk running out of computational resources during subcalls, leading to state reverts that cannot be patched due to the inherent immutability of the underlying smart contracts.
This controversy follows earlier development friction in October 2026, when core contributors postponed the scheduled Glamsterdam trial on the Hoodi testnet after independent security researchers flagged systemic contract interaction risks. The core developer consortium now faces sustained community pressure to publish exhaustive empirical data and compatibility assessments before setting any formal activation schedule on the mainnet, preserving transactional stability across the ETH ecosystem.
DYOR. $ETH

149
·
--
Рост
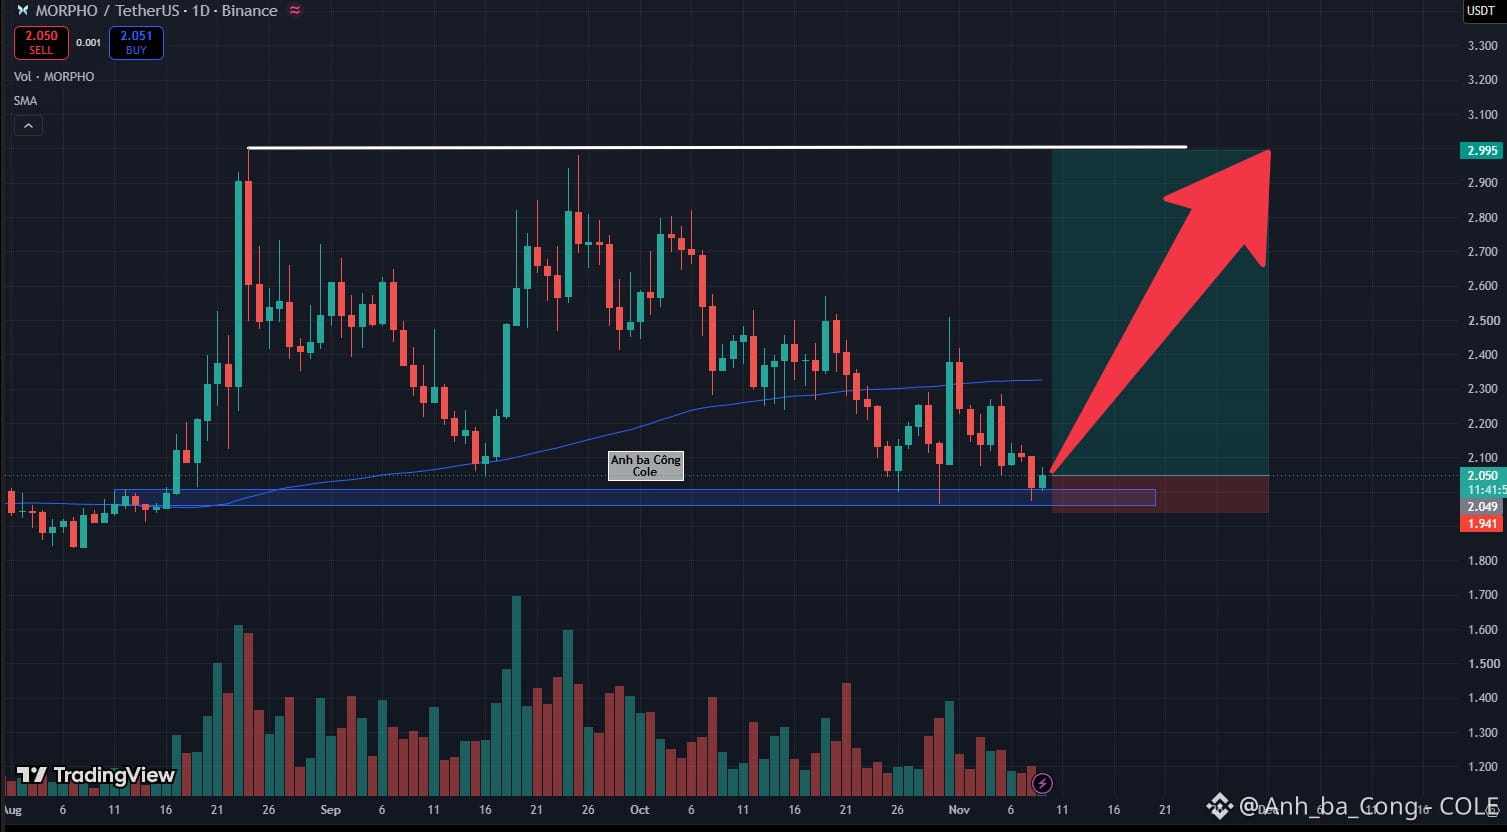
Classic Macro Range Retest: MORPHO Defends 2 USD Support Shelf, Are We Primed for an Explosive Surge to 3 USD?
Traders executing disciplined range-trading strategies definitely need to examine MORPHO on the 1D timeframe right now! Filtering out transient noise across major exchanges, price action has been carving out an immaculate horizontal consolidation rectangle for more than three months.
Let's break down the technical tape:
Range High: A stubborn horizontal ceiling halting aggressive expansion attempts near 2.995 – 3.00 USD.
Range Low: The vital round-number accumulation zone at 2.00 – 2.05 USD (highlighted blue box), anchoring major markup legs since August.
Following a steady pullback from 2.60 USD beneath the dynamic moving average, price landed squarely on the range floor near 2.049 USD and printed an immediate lower rejection wick!
What is the tape telling us? Examining the volume profile reveals that selling volume has evaporated to multi-week lows! Bears are visibly exhausted after this extended downward drift, while institutional bids are stepping in to absorb floating supply along historical value territory. In professional technical execution, entering at the baseline of a multi-month range provides unparalleled risk asymmetry. With the 2.0 USD floor firmly protected, the path of least resistance points toward a full rotational expansion back toward the range ceiling!
Actionable execution blueprint:
Position: Range-rotation Long entry around 2.02 – 2.06 USD.
Target (TP): Horizontal range ceiling at 2.995 USD (over 46% upside potential).
Protective Stop-Loss (SL): 1.941 USD (safely positioned below the range base and 2.0 USD level).
Risk-to-Reward Ratio: Highly asymmetric, risking roughly 0.11 points to capture nearly 0.95 points of upside expansion!
What is your take on MORPHO's range floor defense? Will the 2 USD baseline launch an expansive rally toward 3 USD, or do you anticipate further consolidation first? Share your perspective in the comments below!
DYOR $MORPHO
{future}(MORPHOUSDT)
Classic Macro Range Retest: MORPHO Defends 2 USD Support Shelf, Are We Primed for an Explosive Surge to 3 USD?
Traders executing disciplined range-trading strategies definitely need to examine MORPHO on the 1D timeframe right now! Filtering out transient noise across major exchanges, price action has been carving out an immaculate horizontal consolidation rectangle for more than three months.
Let's break down the technical tape:
Range High: A stubborn horizontal ceiling halting aggressive expansion attempts near 2.995 – 3.00 USD.
Range Low: The vital round-number accumulation zone at 2.00 – 2.05 USD (highlighted blue box), anchoring major markup legs since August.
Following a steady pullback from 2.60 USD beneath the dynamic moving average, price landed squarely on the range floor near 2.049 USD and printed an immediate lower rejection wick!
What is the tape telling us? Examining the volume profile reveals that selling volume has evaporated to multi-week lows! Bears are visibly exhausted after this extended downward drift, while institutional bids are stepping in to absorb floating supply along historical value territory. In professional technical execution, entering at the baseline of a multi-month range provides unparalleled risk asymmetry. With the 2.0 USD floor firmly protected, the path of least resistance points toward a full rotational expansion back toward the range ceiling!
Actionable execution blueprint:
Position: Range-rotation Long entry around 2.02 – 2.06 USD.
Target (TP): Horizontal range ceiling at 2.995 USD (over 46% upside potential).
Protective Stop-Loss (SL): 1.941 USD (safely positioned below the range base and 2.0 USD level).
Risk-to-Reward Ratio: Highly asymmetric, risking roughly 0.11 points to capture nearly 0.95 points of upside expansion!
What is your take on MORPHO's range floor defense? Will the 2 USD baseline launch an expansive rally toward 3 USD, or do you anticipate further consolidation first? Share your perspective in the comments below!
DYOR $MORPHO
Traders executing disciplined range-trading strategies definitely need to examine MORPHO on the 1D timeframe right now! Filtering out transient noise across major exchanges, price action has been carving out an immaculate horizontal consolidation rectangle for more than three months.
Let's break down the technical tape:
Range High: A stubborn horizontal ceiling halting aggressive expansion attempts near 2.995 – 3.00 USD.
Range Low: The vital round-number accumulation zone at 2.00 – 2.05 USD (highlighted blue box), anchoring major markup legs since August.
Following a steady pullback from 2.60 USD beneath the dynamic moving average, price landed squarely on the range floor near 2.049 USD and printed an immediate lower rejection wick!
What is the tape telling us? Examining the volume profile reveals that selling volume has evaporated to multi-week lows! Bears are visibly exhausted after this extended downward drift, while institutional bids are stepping in to absorb floating supply along historical value territory. In professional technical execution, entering at the baseline of a multi-month range provides unparalleled risk asymmetry. With the 2.0 USD floor firmly protected, the path of least resistance points toward a full rotational expansion back toward the range ceiling!
Actionable execution blueprint:
Position: Range-rotation Long entry around 2.02 – 2.06 USD.
Target (TP): Horizontal range ceiling at 2.995 USD (over 46% upside potential).
Protective Stop-Loss (SL): 1.941 USD (safely positioned below the range base and 2.0 USD level).
Risk-to-Reward Ratio: Highly asymmetric, risking roughly 0.11 points to capture nearly 0.95 points of upside expansion!
What is your take on MORPHO's range floor defense? Will the 2 USD baseline launch an expansive rally toward 3 USD, or do you anticipate further consolidation first? Share your perspective in the comments below!
DYOR $MORPHO
83
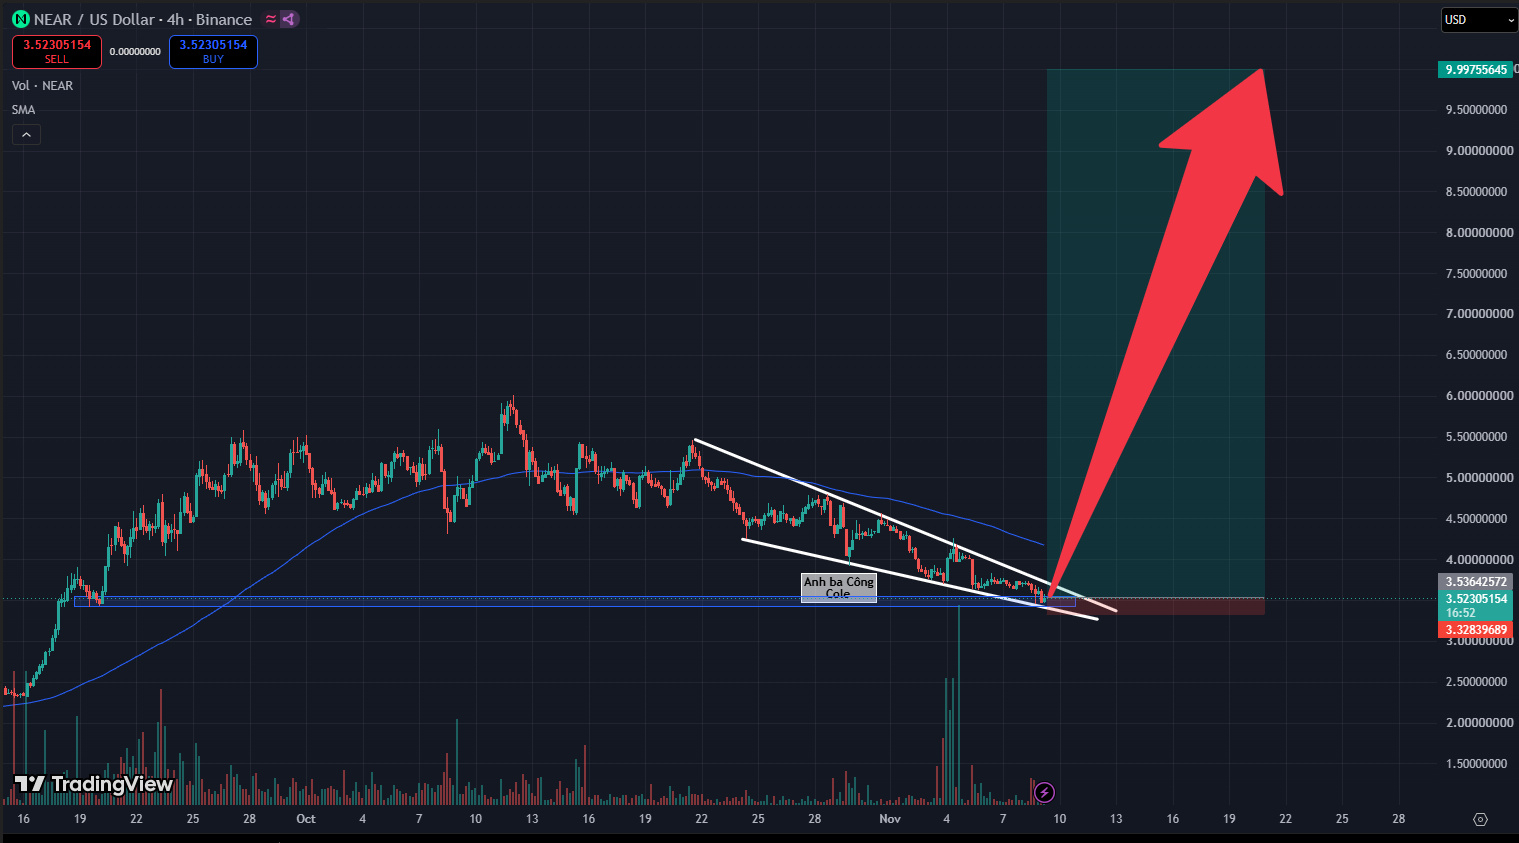
Coiled Spring at Pattern Apex: NEAR Reaches Final Stage of 4H Wedge, Are We Ready for a Liftoff to 10 USD?
Traders hunting for high-conviction reversal setups with ultra-tight invalidation levels need to look at NEAR on the 4H timeframe right now! Following weeks of relentless selling pressure from the 5.50 USD peak that thoroughly washed out retail sentiment, market structure is signaling a textbook demand reaction.
Let's dissect the market mechanics:
Since October 22nd, NEAR has traded inside a strictly disciplined falling wedge with steadily converging diagonal boundaries.
Price action has arrived at the pattern's apex—the exact zone where technical volatility squeezes to its absolute limit before unleashing explosive expansion!
Most crucially: This terminal test converges squarely with the heavy horizontal demand floor around 3.50 – 3.53 USD (blue base), the very foundation that ignited September's massive markup.
What is the tape telling us? Look closely at the volume indicators below: selling volume has completely evaporated to multi-week lows! The active 4H candle hovering near 3.523 USD continues to flash lower absorption shadows, proving active bids are defending the floor. When a tightening wedge reaches its conclusion over macro support, sellers face utter exhaustion. This is prime institutional accumulation territory. A single impulse above the descending diagonal ceiling is all it takes to trigger an aggressive short squeeze!
Actionable execution setup:
Position: Trend-reversal Long entry around 3.50 – 3.53 USD.
Take-Profit Target (TP): Macro psychological round-number target at 9.997 USD (over 180% upside potential).
Protective Stop-Loss (SL): 3.328 USD (positioned safely beneath the horizontal base).
Risk-to-Reward Ratio: Highly asymmetric, risking roughly 0.2 points to capture an expansive 6.4+ point markup!
What is your take on this major support shelf for NEAR? Will 3.5 USD launch an explosive rally toward 10 USD, or do you anticipate one last fakeout? Share your perspective in the comments below!
DYOR $NEAR
{future}(NEARUSDT)
Coiled Spring at Pattern Apex: NEAR Reaches Final Stage of 4H Wedge, Are We Ready for a Liftoff to 10 USD?
Traders hunting for high-conviction reversal setups with ultra-tight invalidation levels need to look at NEAR on the 4H timeframe right now! Following weeks of relentless selling pressure from the 5.50 USD peak that thoroughly washed out retail sentiment, market structure is signaling a textbook demand reaction.
Let's dissect the market mechanics:
Since October 22nd, NEAR has traded inside a strictly disciplined falling wedge with steadily converging diagonal boundaries.
Price action has arrived at the pattern's apex—the exact zone where technical volatility squeezes to its absolute limit before unleashing explosive expansion!
Most crucially: This terminal test converges squarely with the heavy horizontal demand floor around 3.50 – 3.53 USD (blue base), the very foundation that ignited September's massive markup.
What is the tape telling us? Look closely at the volume indicators below: selling volume has completely evaporated to multi-week lows! The active 4H candle hovering near 3.523 USD continues to flash lower absorption shadows, proving active bids are defending the floor. When a tightening wedge reaches its conclusion over macro support, sellers face utter exhaustion. This is prime institutional accumulation territory. A single impulse above the descending diagonal ceiling is all it takes to trigger an aggressive short squeeze!
Actionable execution setup:
Position: Trend-reversal Long entry around 3.50 – 3.53 USD.
Take-Profit Target (TP): Macro psychological round-number target at 9.997 USD (over 180% upside potential).
Protective Stop-Loss (SL): 3.328 USD (positioned safely beneath the horizontal base).
Risk-to-Reward Ratio: Highly asymmetric, risking roughly 0.2 points to capture an expansive 6.4+ point markup!
What is your take on this major support shelf for NEAR? Will 3.5 USD launch an explosive rally toward 10 USD, or do you anticipate one last fakeout? Share your perspective in the comments below!
DYOR $NEAR
Traders hunting for high-conviction reversal setups with ultra-tight invalidation levels need to look at NEAR on the 4H timeframe right now! Following weeks of relentless selling pressure from the 5.50 USD peak that thoroughly washed out retail sentiment, market structure is signaling a textbook demand reaction.
Let's dissect the market mechanics:
Since October 22nd, NEAR has traded inside a strictly disciplined falling wedge with steadily converging diagonal boundaries.
Price action has arrived at the pattern's apex—the exact zone where technical volatility squeezes to its absolute limit before unleashing explosive expansion!
Most crucially: This terminal test converges squarely with the heavy horizontal demand floor around 3.50 – 3.53 USD (blue base), the very foundation that ignited September's massive markup.
What is the tape telling us? Look closely at the volume indicators below: selling volume has completely evaporated to multi-week lows! The active 4H candle hovering near 3.523 USD continues to flash lower absorption shadows, proving active bids are defending the floor. When a tightening wedge reaches its conclusion over macro support, sellers face utter exhaustion. This is prime institutional accumulation territory. A single impulse above the descending diagonal ceiling is all it takes to trigger an aggressive short squeeze!
Actionable execution setup:
Position: Trend-reversal Long entry around 3.50 – 3.53 USD.
Take-Profit Target (TP): Macro psychological round-number target at 9.997 USD (over 180% upside potential).
Protective Stop-Loss (SL): 3.328 USD (positioned safely beneath the horizontal base).
Risk-to-Reward Ratio: Highly asymmetric, risking roughly 0.2 points to capture an expansive 6.4+ point markup!
What is your take on this major support shelf for NEAR? Will 3.5 USD launch an explosive rally toward 10 USD, or do you anticipate one last fakeout? Share your perspective in the comments below!
DYOR $NEAR
217
ZCASH DEVELOPERS PROPOSE REDUCING TARGET BLOCK INTERVAL TO 20 SECONDS POST-NU7 UPGRADE
Days following the successful mainnet activation of the NU7 network upgrade, Zcash developers ValarDragon and Evan Forbes have formally submitted a draft Zcash Improvement Proposal (ZIP) to the community forum, recommending a further reduction of the network's target block interval from 25 seconds down to 20 seconds.
The proposal is slated for inclusion in the forthcoming community sentiment polling cycle and consideration for deployment within the upcoming NU7.1 protocol release. The primary objective of the proposed parameter adjustment is to reduce latency for initial transaction confirmations, directly enhancing the execution speed of point-of-sale settlements, exchange balance deposits, and cross-chain decentralized swaps.
The developers clarified that more frequent block production will not alter the established Zcash programmatic emission schedule, nor will it expand the network's aggregate daily shielded transaction throughput. This initiative follows Friday’s mainnet deployment of NU7, which reduced target block intervals from 75 seconds to 25 seconds while integrating the Network Sustainability Mechanism to recycle transaction fees into future mining reward distributions and preserving the hard supply ceiling of 21 million ZEC.
DYOR. $ZEC #Colecolen
{future}(ZECUSDT)
ZCASH DEVELOPERS PROPOSE REDUCING TARGET BLOCK INTERVAL TO 20 SECONDS POST-NU7 UPGRADE
Days following the successful mainnet activation of the NU7 network upgrade, Zcash developers ValarDragon and Evan Forbes have formally submitted a draft Zcash Improvement Proposal (ZIP) to the community forum, recommending a further reduction of the network's target block interval from 25 seconds down to 20 seconds.
The proposal is slated for inclusion in the forthcoming community sentiment polling cycle and consideration for deployment within the upcoming NU7.1 protocol release. The primary objective of the proposed parameter adjustment is to reduce latency for initial transaction confirmations, directly enhancing the execution speed of point-of-sale settlements, exchange balance deposits, and cross-chain decentralized swaps.
The developers clarified that more frequent block production will not alter the established Zcash programmatic emission schedule, nor will it expand the network's aggregate daily shielded transaction throughput. This initiative follows Friday’s mainnet deployment of NU7, which reduced target block intervals from 75 seconds to 25 seconds while integrating the Network Sustainability Mechanism to recycle transaction fees into future mining reward distributions and preserving the hard supply ceiling of 21 million ZEC.
DYOR. $ZEC #Colecolen
Days following the successful mainnet activation of the NU7 network upgrade, Zcash developers ValarDragon and Evan Forbes have formally submitted a draft Zcash Improvement Proposal (ZIP) to the community forum, recommending a further reduction of the network's target block interval from 25 seconds down to 20 seconds.
The proposal is slated for inclusion in the forthcoming community sentiment polling cycle and consideration for deployment within the upcoming NU7.1 protocol release. The primary objective of the proposed parameter adjustment is to reduce latency for initial transaction confirmations, directly enhancing the execution speed of point-of-sale settlements, exchange balance deposits, and cross-chain decentralized swaps.
The developers clarified that more frequent block production will not alter the established Zcash programmatic emission schedule, nor will it expand the network's aggregate daily shielded transaction throughput. This initiative follows Friday’s mainnet deployment of NU7, which reduced target block intervals from 75 seconds to 25 seconds while integrating the Network Sustainability Mechanism to recycle transaction fees into future mining reward distributions and preserving the hard supply ceiling of 21 million ZEC.
DYOR. $ZEC #Colecolen

434
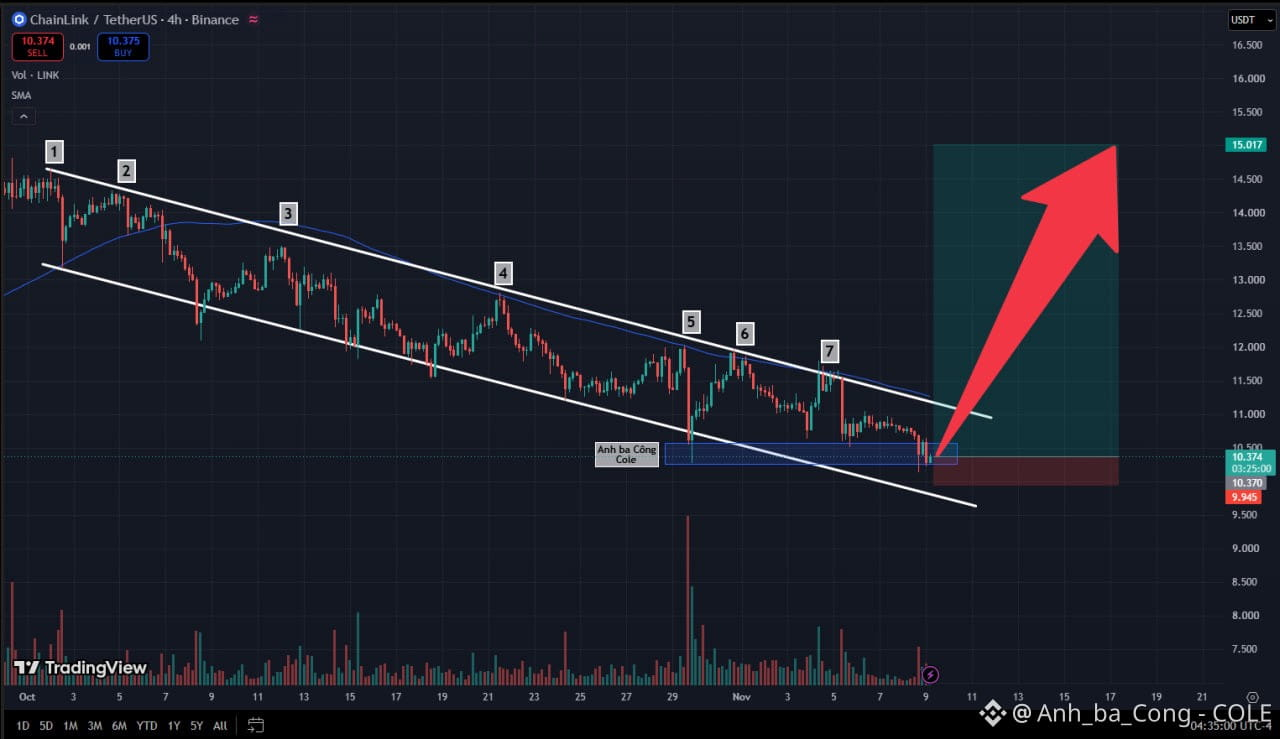
LINK Compresses 7 Swings Inside 4H Descending Channel: 10 USD Benchmark Primes Breakout Long Toward 15 USD?
ChainLink (LINK) on the 4-hour (4H) timeframe is displaying an extraordinarily rare technical formation, adhering strictly to a parallel descending channel for over a month. The occurrence of seven distinct test swings within a single declining structure represents an exceptional liquidity compression event, signaling that volatility is coiling tightly before unleashing an expansive breakout move.
LINK's underlying technical resilience stands out against broader market headwinds. While Bitcoin has registered repeated sharp drawdowns across recent sessions, LINK has preserved an orderly structure, refusing to break below key support zones. Price action is presently retesting the major psychological benchmark around 10.00 – 10.37 USD, aligning closely with the channel floor. Examining recent 4-hour candles near 10.374 USD, repeated lower absorption wicks inside the highlighted accumulation box verify that responsive institutional buyers are quietly accumulating inventory. Once this prolonged compression reaches its apex, an upside breakout is positioned to unlock substantial directional momentum.
Defending this psychological foundation unlocks an asymmetric trend-reversal Long opportunity boasting an outstanding risk-to-reward ratio. The primary expansion target points directly toward the macro resistance high at 15.017 USD. Downside exposure is strictly managed by placing a disciplined protective stop-loss cleanly beneath the channel floor at 9.945 USD for capital preservation.
DYOR $LINK
{future}(LINKUSDT)
LINK Compresses 7 Swings Inside 4H Descending Channel: 10 USD Benchmark Primes Breakout Long Toward 15 USD?
ChainLink (LINK) on the 4-hour (4H) timeframe is displaying an extraordinarily rare technical formation, adhering strictly to a parallel descending channel for over a month. The occurrence of seven distinct test swings within a single declining structure represents an exceptional liquidity compression event, signaling that volatility is coiling tightly before unleashing an expansive breakout move.
LINK's underlying technical resilience stands out against broader market headwinds. While Bitcoin has registered repeated sharp drawdowns across recent sessions, LINK has preserved an orderly structure, refusing to break below key support zones. Price action is presently retesting the major psychological benchmark around 10.00 – 10.37 USD, aligning closely with the channel floor. Examining recent 4-hour candles near 10.374 USD, repeated lower absorption wicks inside the highlighted accumulation box verify that responsive institutional buyers are quietly accumulating inventory. Once this prolonged compression reaches its apex, an upside breakout is positioned to unlock substantial directional momentum.
Defending this psychological foundation unlocks an asymmetric trend-reversal Long opportunity boasting an outstanding risk-to-reward ratio. The primary expansion target points directly toward the macro resistance high at 15.017 USD. Downside exposure is strictly managed by placing a disciplined protective stop-loss cleanly beneath the channel floor at 9.945 USD for capital preservation.
DYOR $LINK
ChainLink (LINK) on the 4-hour (4H) timeframe is displaying an extraordinarily rare technical formation, adhering strictly to a parallel descending channel for over a month. The occurrence of seven distinct test swings within a single declining structure represents an exceptional liquidity compression event, signaling that volatility is coiling tightly before unleashing an expansive breakout move.
LINK's underlying technical resilience stands out against broader market headwinds. While Bitcoin has registered repeated sharp drawdowns across recent sessions, LINK has preserved an orderly structure, refusing to break below key support zones. Price action is presently retesting the major psychological benchmark around 10.00 – 10.37 USD, aligning closely with the channel floor. Examining recent 4-hour candles near 10.374 USD, repeated lower absorption wicks inside the highlighted accumulation box verify that responsive institutional buyers are quietly accumulating inventory. Once this prolonged compression reaches its apex, an upside breakout is positioned to unlock substantial directional momentum.
Defending this psychological foundation unlocks an asymmetric trend-reversal Long opportunity boasting an outstanding risk-to-reward ratio. The primary expansion target points directly toward the macro resistance high at 15.017 USD. Downside exposure is strictly managed by placing a disciplined protective stop-loss cleanly beneath the channel floor at 9.945 USD for capital preservation.
DYOR $LINK
215

·
--
Падение
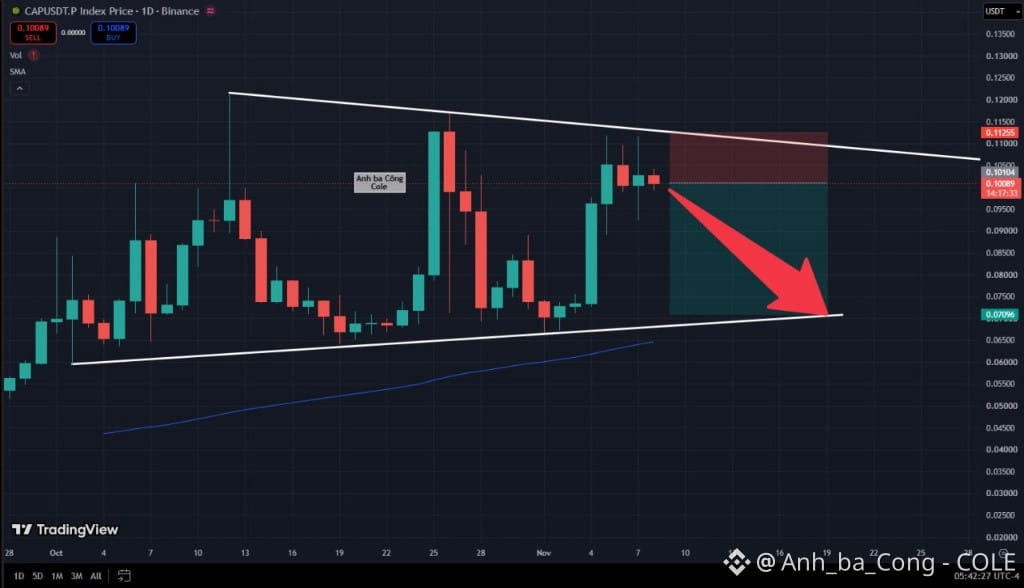
CAP Compresses Inside Daily Triangle: Overhead Ceiling Rejection Triggers Textbook Short Toward 0.070 USD?
CAP on the daily (1D) timeframe continues to adhere strictly to a textbook consolidation squeeze within a symmetrical triangle established since early October. Following an impulsive advance from the lower ascending boundary that reached 0.110 USD, bullish momentum collided directly with rigid overhead supply along the descending white resistance trendline.
Observing active daily candle behavior around 0.10089 USD, buyers have visibly lost control as consecutive small-bodied candles printed prominent upper rejection shadows. The developing red candle confirms that high-level distribution has completely overwhelmed chasing demand. Although the dynamic moving average baseline below continues its upward slope to underpin the broader macro trend, intermediate price action remains heavily restricted beneath diagonal resistance. Buying volume has contracted sharply toward multi-session lows, proving that institutional capital is unwilling to absorb supply to force an upside breakout.
This textbook pattern rejection unlocks an asymmetric trend-following Short opportunity featuring an outstanding risk-to-reward ratio. The primary downside expansion objective points directly toward the lower ascending trendline baseline at 0.07096 USD. Downside exposure is strictly managed by placing a disciplined protective stop-loss cleanly above the diagonal resistance ceiling at 0.11255 USD for capital preservation.
DYOR $CAP
{future}(CAPUSDT)
CAP Compresses Inside Daily Triangle: Overhead Ceiling Rejection Triggers Textbook Short Toward 0.070 USD?
CAP on the daily (1D) timeframe continues to adhere strictly to a textbook consolidation squeeze within a symmetrical triangle established since early October. Following an impulsive advance from the lower ascending boundary that reached 0.110 USD, bullish momentum collided directly with rigid overhead supply along the descending white resistance trendline.
Observing active daily candle behavior around 0.10089 USD, buyers have visibly lost control as consecutive small-bodied candles printed prominent upper rejection shadows. The developing red candle confirms that high-level distribution has completely overwhelmed chasing demand. Although the dynamic moving average baseline below continues its upward slope to underpin the broader macro trend, intermediate price action remains heavily restricted beneath diagonal resistance. Buying volume has contracted sharply toward multi-session lows, proving that institutional capital is unwilling to absorb supply to force an upside breakout.
This textbook pattern rejection unlocks an asymmetric trend-following Short opportunity featuring an outstanding risk-to-reward ratio. The primary downside expansion objective points directly toward the lower ascending trendline baseline at 0.07096 USD. Downside exposure is strictly managed by placing a disciplined protective stop-loss cleanly above the diagonal resistance ceiling at 0.11255 USD for capital preservation.
DYOR $CAP
CAP on the daily (1D) timeframe continues to adhere strictly to a textbook consolidation squeeze within a symmetrical triangle established since early October. Following an impulsive advance from the lower ascending boundary that reached 0.110 USD, bullish momentum collided directly with rigid overhead supply along the descending white resistance trendline.
Observing active daily candle behavior around 0.10089 USD, buyers have visibly lost control as consecutive small-bodied candles printed prominent upper rejection shadows. The developing red candle confirms that high-level distribution has completely overwhelmed chasing demand. Although the dynamic moving average baseline below continues its upward slope to underpin the broader macro trend, intermediate price action remains heavily restricted beneath diagonal resistance. Buying volume has contracted sharply toward multi-session lows, proving that institutional capital is unwilling to absorb supply to force an upside breakout.
This textbook pattern rejection unlocks an asymmetric trend-following Short opportunity featuring an outstanding risk-to-reward ratio. The primary downside expansion objective points directly toward the lower ascending trendline baseline at 0.07096 USD. Downside exposure is strictly managed by placing a disciplined protective stop-loss cleanly above the diagonal resistance ceiling at 0.11255 USD for capital preservation.
DYOR $CAP
711
·
--
Падение
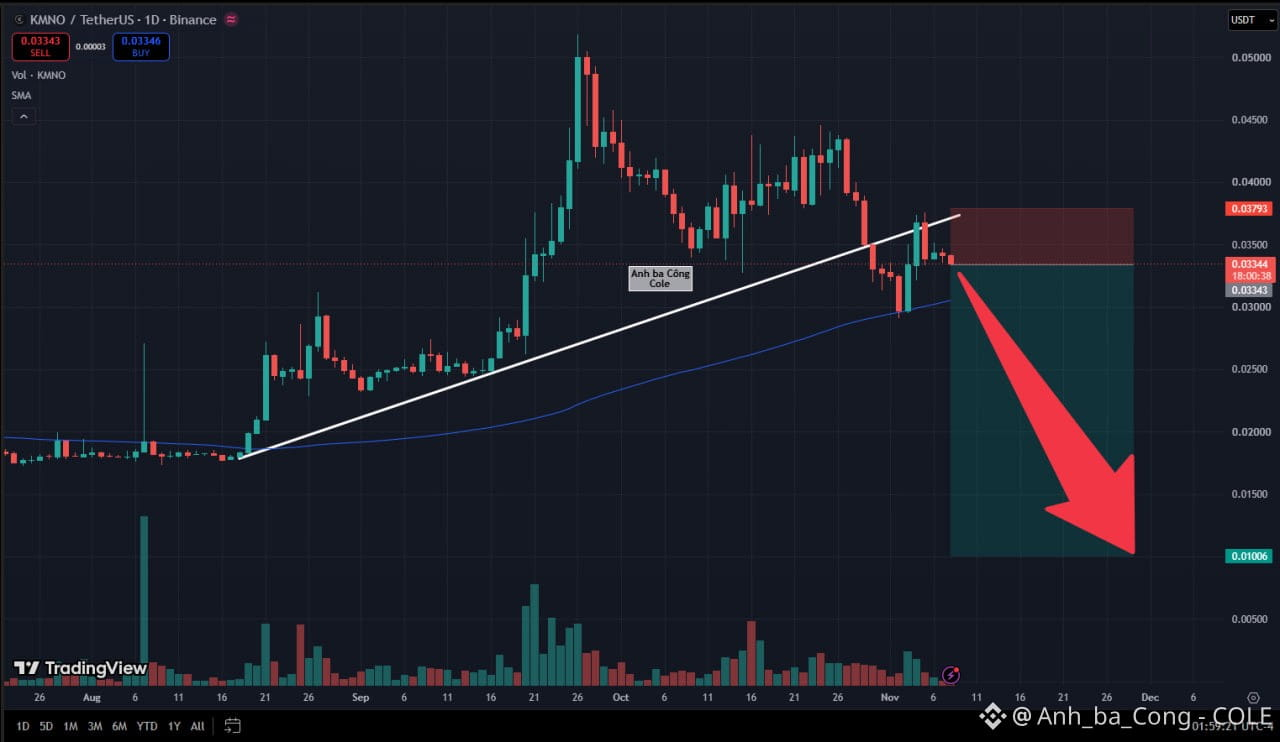
KMNO Validates 1D Ascending Trendline Breakdown: Successful Underside Retest Triggers Short Toward 0.010 USD?
Kamino (KMNO) on the daily (1D) timeframe has confirmed a pivotal bearish trend reversal by officially breaking below the upward-sloping white support trendline maintained since mid-August. The decisive failure of this multi-month structural backbone marks the formal exhaustion of the intermediate bullish cycle, transferring overarching market control directly into the hands of aggressive sellers.
Following an impulsive flush below the trendline baseline, price action delivered a textbook technical relief retest directly toward the underside of the newly fractured boundary. The preceding daily candle tagged the diagonal barrier with precision and was instantly rejected, printing a prominent upper wick. The active daily candle hovering near 0.03344 USD is printing an expanding red body, conclusively verifying that the retest has failed. Upward trading volume across this pullback has contracted substantially toward multi-week lows, proving that purchasing power lacks institutional sponsorship. Former primary dynamic support has cleanly transitioned into a formidable overhead supply shelf.
This confirmed structural rejection unlocks an asymmetric trend-continuation Short opportunity featuring an outstanding risk-to-reward ratio. The primary downside expansion objective points directly toward the macro psychological round-number support base at 0.01006 USD. Downside exposure is strictly managed by placing a disciplined protective stop-loss cleanly above the retest high at 0.03793 USD for capital preservation.
DYOR $KMNO
{future}(KMNOUSDT)
KMNO Validates 1D Ascending Trendline Breakdown: Successful Underside Retest Triggers Short Toward 0.010 USD?
Kamino (KMNO) on the daily (1D) timeframe has confirmed a pivotal bearish trend reversal by officially breaking below the upward-sloping white support trendline maintained since mid-August. The decisive failure of this multi-month structural backbone marks the formal exhaustion of the intermediate bullish cycle, transferring overarching market control directly into the hands of aggressive sellers.
Following an impulsive flush below the trendline baseline, price action delivered a textbook technical relief retest directly toward the underside of the newly fractured boundary. The preceding daily candle tagged the diagonal barrier with precision and was instantly rejected, printing a prominent upper wick. The active daily candle hovering near 0.03344 USD is printing an expanding red body, conclusively verifying that the retest has failed. Upward trading volume across this pullback has contracted substantially toward multi-week lows, proving that purchasing power lacks institutional sponsorship. Former primary dynamic support has cleanly transitioned into a formidable overhead supply shelf.
This confirmed structural rejection unlocks an asymmetric trend-continuation Short opportunity featuring an outstanding risk-to-reward ratio. The primary downside expansion objective points directly toward the macro psychological round-number support base at 0.01006 USD. Downside exposure is strictly managed by placing a disciplined protective stop-loss cleanly above the retest high at 0.03793 USD for capital preservation.
DYOR $KMNO
Kamino (KMNO) on the daily (1D) timeframe has confirmed a pivotal bearish trend reversal by officially breaking below the upward-sloping white support trendline maintained since mid-August. The decisive failure of this multi-month structural backbone marks the formal exhaustion of the intermediate bullish cycle, transferring overarching market control directly into the hands of aggressive sellers.
Following an impulsive flush below the trendline baseline, price action delivered a textbook technical relief retest directly toward the underside of the newly fractured boundary. The preceding daily candle tagged the diagonal barrier with precision and was instantly rejected, printing a prominent upper wick. The active daily candle hovering near 0.03344 USD is printing an expanding red body, conclusively verifying that the retest has failed. Upward trading volume across this pullback has contracted substantially toward multi-week lows, proving that purchasing power lacks institutional sponsorship. Former primary dynamic support has cleanly transitioned into a formidable overhead supply shelf.
This confirmed structural rejection unlocks an asymmetric trend-continuation Short opportunity featuring an outstanding risk-to-reward ratio. The primary downside expansion objective points directly toward the macro psychological round-number support base at 0.01006 USD. Downside exposure is strictly managed by placing a disciplined protective stop-loss cleanly above the retest high at 0.03793 USD for capital preservation.
DYOR $KMNO
263
·
--
Падение
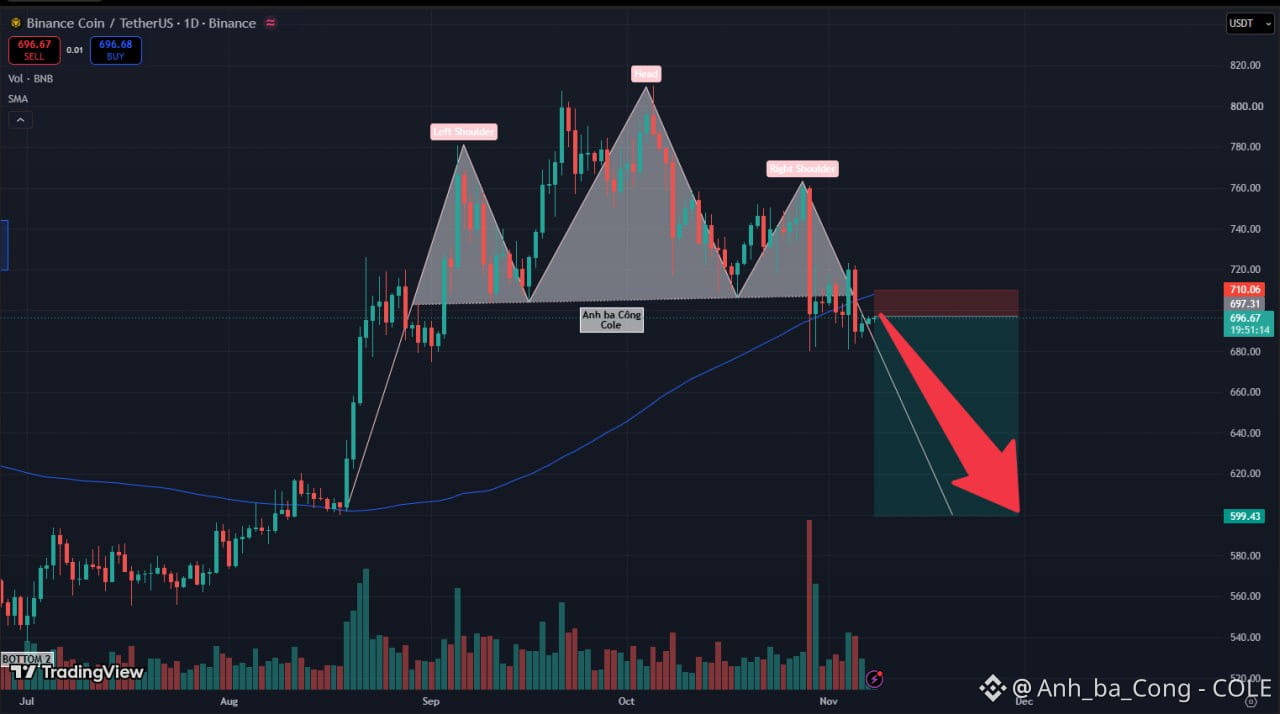
BNB Completes Daily Head and Shoulders: Loss of Neckline Triggers Trend-Reversal Short Toward 600 USD?
BNB on the daily (1D) timeframe has verified a major bearish trend reversal by officially completing a textbook Head and Shoulders distribution structure developed since early September. The decisive breakdown beneath the horizontal neckline near 710 USD terminates the broader markup phase, transferring overarching market control directly into the hands of aggressive sellers.
Current price action around 696.67 USD highlights persistent overhead supply. Following a heavy red expansion candle that sliced through market structure and breached the dynamic blue MA100 moving average, the tape produced three consecutive small-bodied green candles. This shallow corrective crawl visibly lacks institutional buying participation, as trading volume has dried up to multi-session lows. The inability of these three compressed candles to push price back above the broken neckline confirms that responsive buyer demand is thoroughly exhausted. Former horizontal support has cleanly transitioned into a formidable resistance ceiling, priming the asset for an extended downward impulse.
This confirmed structural breakdown unlocks an asymmetric trend-continuation Short opportunity featuring an outstanding risk-to-reward ratio. The primary downside objective points directly toward the macro psychological round-number support base at 599.43 USD. Downside exposure is strictly managed by placing a disciplined protective stop-loss cleanly above the neckline resistance at 710.06 USD for capital preservation.
DYOR $BNB
{future}(BNBUSDT)
BNB Completes Daily Head and Shoulders: Loss of Neckline Triggers Trend-Reversal Short Toward 600 USD?
BNB on the daily (1D) timeframe has verified a major bearish trend reversal by officially completing a textbook Head and Shoulders distribution structure developed since early September. The decisive breakdown beneath the horizontal neckline near 710 USD terminates the broader markup phase, transferring overarching market control directly into the hands of aggressive sellers.
Current price action around 696.67 USD highlights persistent overhead supply. Following a heavy red expansion candle that sliced through market structure and breached the dynamic blue MA100 moving average, the tape produced three consecutive small-bodied green candles. This shallow corrective crawl visibly lacks institutional buying participation, as trading volume has dried up to multi-session lows. The inability of these three compressed candles to push price back above the broken neckline confirms that responsive buyer demand is thoroughly exhausted. Former horizontal support has cleanly transitioned into a formidable resistance ceiling, priming the asset for an extended downward impulse.
This confirmed structural breakdown unlocks an asymmetric trend-continuation Short opportunity featuring an outstanding risk-to-reward ratio. The primary downside objective points directly toward the macro psychological round-number support base at 599.43 USD. Downside exposure is strictly managed by placing a disciplined protective stop-loss cleanly above the neckline resistance at 710.06 USD for capital preservation.
DYOR $BNB
BNB on the daily (1D) timeframe has verified a major bearish trend reversal by officially completing a textbook Head and Shoulders distribution structure developed since early September. The decisive breakdown beneath the horizontal neckline near 710 USD terminates the broader markup phase, transferring overarching market control directly into the hands of aggressive sellers.
Current price action around 696.67 USD highlights persistent overhead supply. Following a heavy red expansion candle that sliced through market structure and breached the dynamic blue MA100 moving average, the tape produced three consecutive small-bodied green candles. This shallow corrective crawl visibly lacks institutional buying participation, as trading volume has dried up to multi-session lows. The inability of these three compressed candles to push price back above the broken neckline confirms that responsive buyer demand is thoroughly exhausted. Former horizontal support has cleanly transitioned into a formidable resistance ceiling, priming the asset for an extended downward impulse.
This confirmed structural breakdown unlocks an asymmetric trend-continuation Short opportunity featuring an outstanding risk-to-reward ratio. The primary downside objective points directly toward the macro psychological round-number support base at 599.43 USD. Downside exposure is strictly managed by placing a disciplined protective stop-loss cleanly above the neckline resistance at 710.06 USD for capital preservation.
DYOR $BNB
236
·
--
Рост
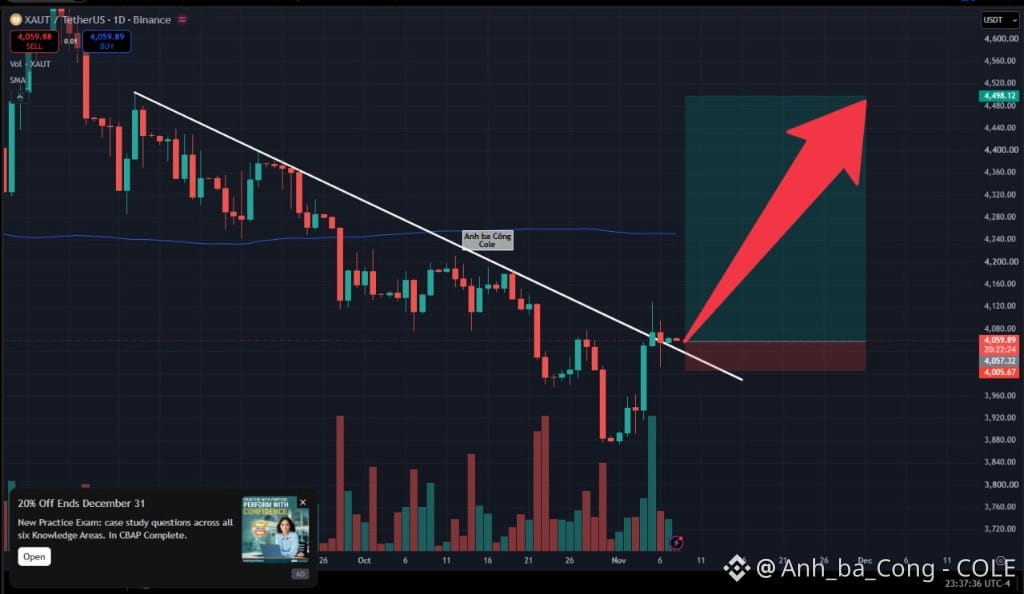
XAUT Validates Bear Trap Below 4,000 USD and Breaks 1D Trendline: Long Setup Aiming for 4,500 USD Expansion?
Tether Gold (XAUT) on the daily (1D) timeframe has triggered a decisive structural trend reversal after executing a textbook fakeout below the major 4,000 USD psychological benchmark. The preceding liquidity flush down to 3,880 USD cleanly purged panic sellers, paving the way for aggressive accumulation to propel price action vertically back into market structure.
This commanding impulse not only reclaimed critical horizontal territory but also conclusively pierced the descending white diagonal trendline maintained since September. The active daily candle hovering near 4,059.89 USD is cleanly stabilizing directly above this breached resistance shelf. Fundamentally, this breakout aligned with emerging U.S. political developments that do not favor President Trump, igniting durable safe-haven institutional demand for gold-backed assets. Daily buying volume expanded dramatically, confirming decisive smart-money participation. This structural shift from distribution to accumulation indicates that the newly initiated markup phase possesses lasting momentum.
This confirmed diagonal breakout unlocks an asymmetric trend-reversal Long opportunity boasting an outstanding risk-to-reward ratio. The primary upside target points directly toward the macro resistance high at 4,498.12 USD (approaching the 4,500 USD zone). Downside exposure is strictly managed by placing a disciplined protective stop-loss cleanly beneath the trendline at 4,005.67 USD for capital preservation.
DYOR $XAUT $XAU $PAXG
{future}(PAXGUSDT)
{future}(XAUUSDT)
{future}(XAUTUSDT)
XAUT Validates Bear Trap Below 4,000 USD and Breaks 1D Trendline: Long Setup Aiming for 4,500 USD Expansion?
Tether Gold (XAUT) on the daily (1D) timeframe has triggered a decisive structural trend reversal after executing a textbook fakeout below the major 4,000 USD psychological benchmark. The preceding liquidity flush down to 3,880 USD cleanly purged panic sellers, paving the way for aggressive accumulation to propel price action vertically back into market structure.
This commanding impulse not only reclaimed critical horizontal territory but also conclusively pierced the descending white diagonal trendline maintained since September. The active daily candle hovering near 4,059.89 USD is cleanly stabilizing directly above this breached resistance shelf. Fundamentally, this breakout aligned with emerging U.S. political developments that do not favor President Trump, igniting durable safe-haven institutional demand for gold-backed assets. Daily buying volume expanded dramatically, confirming decisive smart-money participation. This structural shift from distribution to accumulation indicates that the newly initiated markup phase possesses lasting momentum.
This confirmed diagonal breakout unlocks an asymmetric trend-reversal Long opportunity boasting an outstanding risk-to-reward ratio. The primary upside target points directly toward the macro resistance high at 4,498.12 USD (approaching the 4,500 USD zone). Downside exposure is strictly managed by placing a disciplined protective stop-loss cleanly beneath the trendline at 4,005.67 USD for capital preservation.
DYOR $XAUT $XAU $PAXG
Tether Gold (XAUT) on the daily (1D) timeframe has triggered a decisive structural trend reversal after executing a textbook fakeout below the major 4,000 USD psychological benchmark. The preceding liquidity flush down to 3,880 USD cleanly purged panic sellers, paving the way for aggressive accumulation to propel price action vertically back into market structure.
This commanding impulse not only reclaimed critical horizontal territory but also conclusively pierced the descending white diagonal trendline maintained since September. The active daily candle hovering near 4,059.89 USD is cleanly stabilizing directly above this breached resistance shelf. Fundamentally, this breakout aligned with emerging U.S. political developments that do not favor President Trump, igniting durable safe-haven institutional demand for gold-backed assets. Daily buying volume expanded dramatically, confirming decisive smart-money participation. This structural shift from distribution to accumulation indicates that the newly initiated markup phase possesses lasting momentum.
This confirmed diagonal breakout unlocks an asymmetric trend-reversal Long opportunity boasting an outstanding risk-to-reward ratio. The primary upside target points directly toward the macro resistance high at 4,498.12 USD (approaching the 4,500 USD zone). Downside exposure is strictly managed by placing a disciplined protective stop-loss cleanly beneath the trendline at 4,005.67 USD for capital preservation.
DYOR $XAUT $XAU $PAXG
438
·
--
Падение
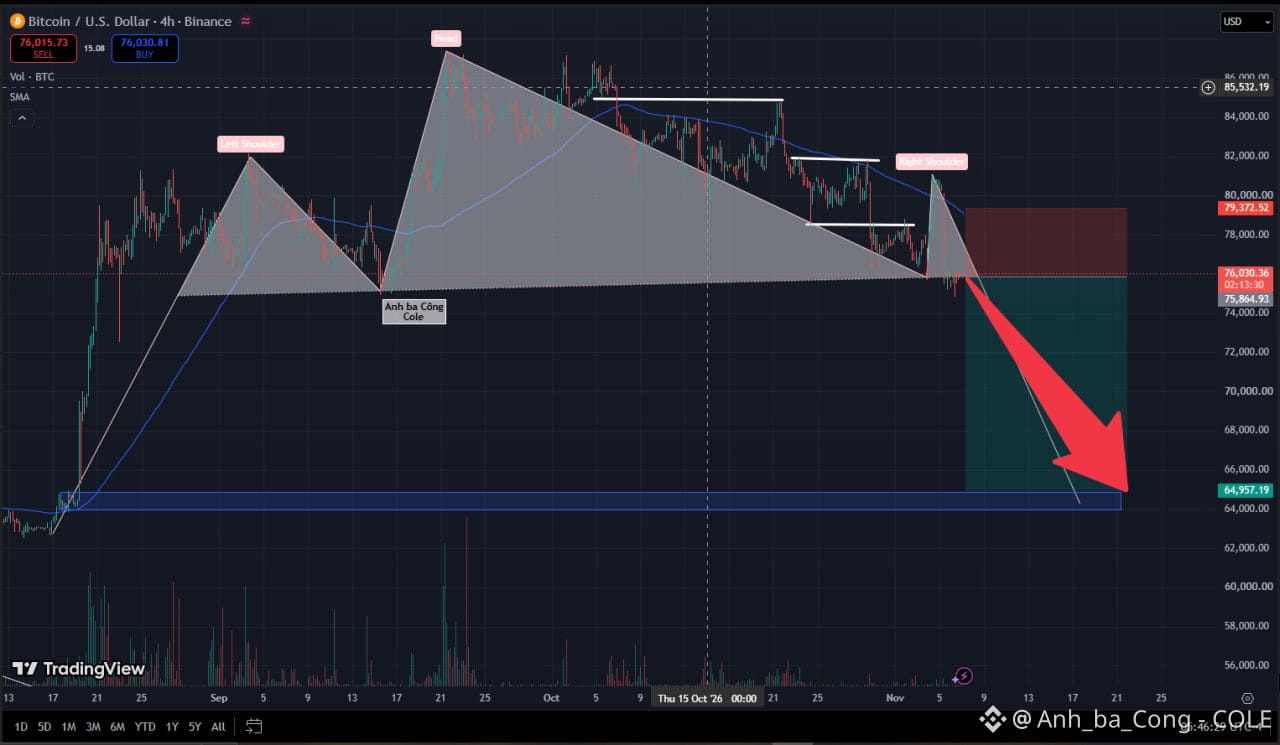
BTC Validates 4H Head and Shoulders: Breakdown of Neckline Triggers Major Short Toward 65,000 USD?
Bitcoin (BTC) on the 4-hour (4H) timeframe has triggered a decisive bearish structural reversal by officially completing a macro Head and Shoulders distribution pattern forged since late August. Following persistent institutional distribution around the 85,532 USD head and right-shoulder exhaustion near 81,000 USD, heavy selling pressure has decisively broken below the descending white neckline.
The sharp breakdown beneath the 76,000 USD threshold marks a fundamental shift, handing complete structural control over to aggressive sellers. Observing 4-hour candle behavior near 75,864 – 76,030 USD, price action remains heavily suppressed beneath the downward-sloping dynamic blue MA100 baseline. Expanding red bodies accompanied by upper rejection shadows demonstrate that responsive buying power is entirely inadequate against formidable overhead supply. Upward trading volume has dried up to multi-session lows, confirming that institutional sponsorship is absent from the bid side. Former multi-month dynamic support has cleanly transitioned into a rigid resistance ceiling, priming the asset for an extended downward impulse.
This confirmed macro structural breakdown unlocks an asymmetric trend-continuation Short opportunity featuring an outstanding risk-to-reward ratio. The primary downside objective points directly toward the macro psychological round-number support base at 64,957 USD. Downside exposure is strictly managed by placing a disciplined protective stop-loss cleanly above the MA100 resistance at 79,372 USD for capital preservation.
DYOR $BTC #bitcoin
{future}(BTCUSDT)
BTC Validates 4H Head and Shoulders: Breakdown of Neckline Triggers Major Short Toward 65,000 USD?
Bitcoin (BTC) on the 4-hour (4H) timeframe has triggered a decisive bearish structural reversal by officially completing a macro Head and Shoulders distribution pattern forged since late August. Following persistent institutional distribution around the 85,532 USD head and right-shoulder exhaustion near 81,000 USD, heavy selling pressure has decisively broken below the descending white neckline.
The sharp breakdown beneath the 76,000 USD threshold marks a fundamental shift, handing complete structural control over to aggressive sellers. Observing 4-hour candle behavior near 75,864 – 76,030 USD, price action remains heavily suppressed beneath the downward-sloping dynamic blue MA100 baseline. Expanding red bodies accompanied by upper rejection shadows demonstrate that responsive buying power is entirely inadequate against formidable overhead supply. Upward trading volume has dried up to multi-session lows, confirming that institutional sponsorship is absent from the bid side. Former multi-month dynamic support has cleanly transitioned into a rigid resistance ceiling, priming the asset for an extended downward impulse.
This confirmed macro structural breakdown unlocks an asymmetric trend-continuation Short opportunity featuring an outstanding risk-to-reward ratio. The primary downside objective points directly toward the macro psychological round-number support base at 64,957 USD. Downside exposure is strictly managed by placing a disciplined protective stop-loss cleanly above the MA100 resistance at 79,372 USD for capital preservation.
DYOR $BTC #bitcoin
Bitcoin (BTC) on the 4-hour (4H) timeframe has triggered a decisive bearish structural reversal by officially completing a macro Head and Shoulders distribution pattern forged since late August. Following persistent institutional distribution around the 85,532 USD head and right-shoulder exhaustion near 81,000 USD, heavy selling pressure has decisively broken below the descending white neckline.
The sharp breakdown beneath the 76,000 USD threshold marks a fundamental shift, handing complete structural control over to aggressive sellers. Observing 4-hour candle behavior near 75,864 – 76,030 USD, price action remains heavily suppressed beneath the downward-sloping dynamic blue MA100 baseline. Expanding red bodies accompanied by upper rejection shadows demonstrate that responsive buying power is entirely inadequate against formidable overhead supply. Upward trading volume has dried up to multi-session lows, confirming that institutional sponsorship is absent from the bid side. Former multi-month dynamic support has cleanly transitioned into a rigid resistance ceiling, priming the asset for an extended downward impulse.
This confirmed macro structural breakdown unlocks an asymmetric trend-continuation Short opportunity featuring an outstanding risk-to-reward ratio. The primary downside objective points directly toward the macro psychological round-number support base at 64,957 USD. Downside exposure is strictly managed by placing a disciplined protective stop-loss cleanly above the MA100 resistance at 79,372 USD for capital preservation.
DYOR $BTC #bitcoin
192
·
--
Падение
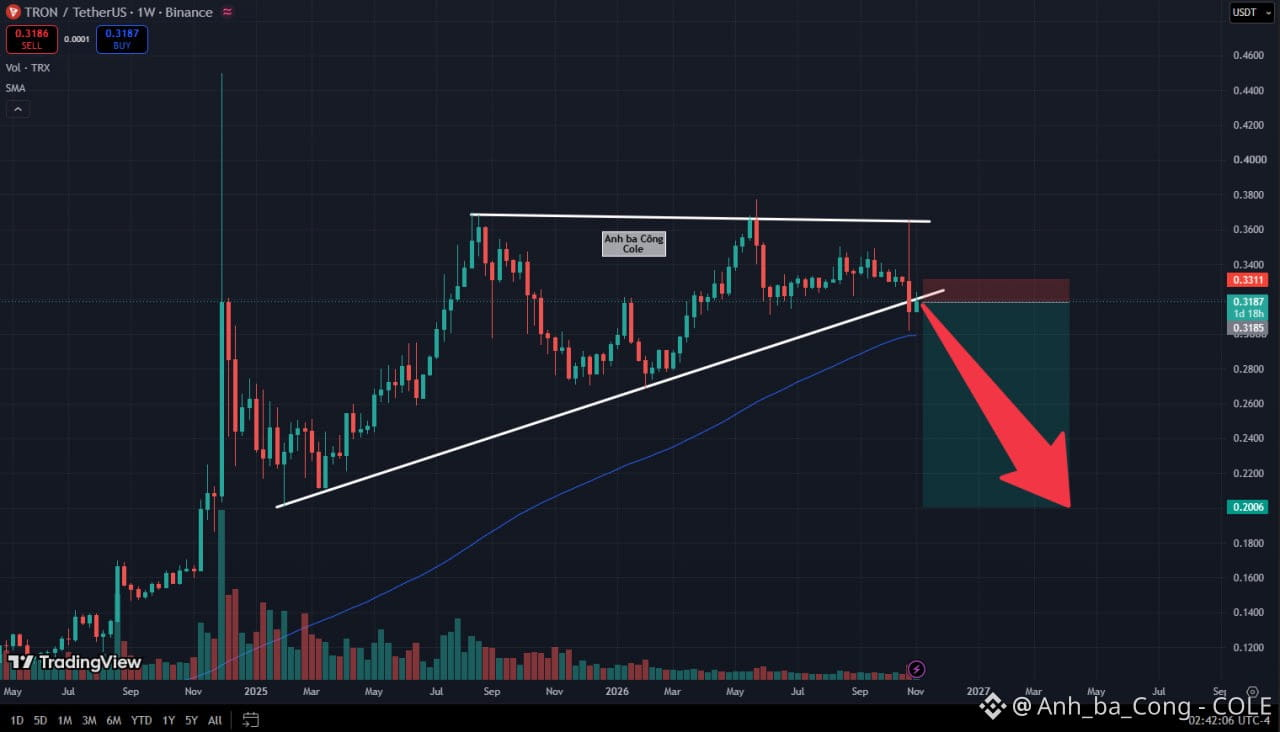
TRX Rejection Wick at Upper Ceiling Slices Triangle Floor on 1W: Double Trap Sparks Short Toward 0.20 USD?
TRON (TRX) on the weekly (1W) timeframe has verified a major macro structural reversal after executing an aggressive double-trap technical sequence. The explosive expansion attempt targeting the horizontal resistance ceiling near 0.365 USD was decisively extinguished, leaving behind a severe rejection wick that swept high-level market liquidity.
This overwhelming wave of distribution did not merely stall at resistance; it drove price action straight down through the ascending white baseline of the macro triangle established since early 2025. Examining the active weekly candle hovering near 0.3187 USD, relief retest efforts remain visibly fragile, firmly capped beneath the underside of the newly fractured trendline. Trading volume on this bounce has thoroughly evaporated, confirming that institutional sponsorship has exited the bid side. The multi-year dynamic support line that anchored the market for nearly two years has now officially flipped into a rigid overhead supply shelf.
This confirmed multi-timeframe structural failure unlocks an asymmetric trend-continuation Short opportunity featuring an outstanding risk-to-reward ratio. The primary downside expansion objective points directly toward the pattern's macro origination base at 0.2006 USD. Downside exposure is strictly managed by placing a disciplined protective stop-loss cleanly above resistance at 0.3311 USD for capital preservation.
DYOR $TRX
{future}(TRXUSDT)
TRX Rejection Wick at Upper Ceiling Slices Triangle Floor on 1W: Double Trap Sparks Short Toward 0.20 USD?
TRON (TRX) on the weekly (1W) timeframe has verified a major macro structural reversal after executing an aggressive double-trap technical sequence. The explosive expansion attempt targeting the horizontal resistance ceiling near 0.365 USD was decisively extinguished, leaving behind a severe rejection wick that swept high-level market liquidity.
This overwhelming wave of distribution did not merely stall at resistance; it drove price action straight down through the ascending white baseline of the macro triangle established since early 2025. Examining the active weekly candle hovering near 0.3187 USD, relief retest efforts remain visibly fragile, firmly capped beneath the underside of the newly fractured trendline. Trading volume on this bounce has thoroughly evaporated, confirming that institutional sponsorship has exited the bid side. The multi-year dynamic support line that anchored the market for nearly two years has now officially flipped into a rigid overhead supply shelf.
This confirmed multi-timeframe structural failure unlocks an asymmetric trend-continuation Short opportunity featuring an outstanding risk-to-reward ratio. The primary downside expansion objective points directly toward the pattern's macro origination base at 0.2006 USD. Downside exposure is strictly managed by placing a disciplined protective stop-loss cleanly above resistance at 0.3311 USD for capital preservation.
DYOR $TRX
TRON (TRX) on the weekly (1W) timeframe has verified a major macro structural reversal after executing an aggressive double-trap technical sequence. The explosive expansion attempt targeting the horizontal resistance ceiling near 0.365 USD was decisively extinguished, leaving behind a severe rejection wick that swept high-level market liquidity.
This overwhelming wave of distribution did not merely stall at resistance; it drove price action straight down through the ascending white baseline of the macro triangle established since early 2025. Examining the active weekly candle hovering near 0.3187 USD, relief retest efforts remain visibly fragile, firmly capped beneath the underside of the newly fractured trendline. Trading volume on this bounce has thoroughly evaporated, confirming that institutional sponsorship has exited the bid side. The multi-year dynamic support line that anchored the market for nearly two years has now officially flipped into a rigid overhead supply shelf.
This confirmed multi-timeframe structural failure unlocks an asymmetric trend-continuation Short opportunity featuring an outstanding risk-to-reward ratio. The primary downside expansion objective points directly toward the pattern's macro origination base at 0.2006 USD. Downside exposure is strictly managed by placing a disciplined protective stop-loss cleanly above resistance at 0.3311 USD for capital preservation.
DYOR $TRX
192
·
--
Падение
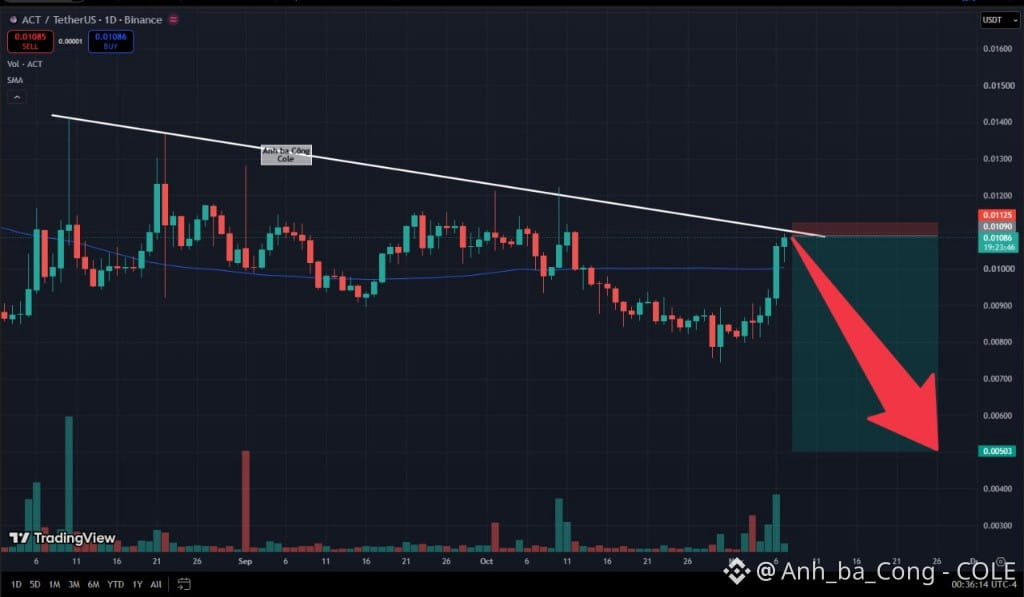
ACT Tags Descending Trendline on 1D: Overhead Rejection Wick Sparks High-Reward Short Toward 0.0050 USD?
ACT on the daily (1D) timeframe continues to preserve a disciplined macro downward trajectory beneath the overhead descending white trendline originating from the 0.0145 USD swing high. Following an aggressive relief expansion that drove price action from the 0.0078 USD liquidity floor, the market has completed a decisive structural test along the underside of this primary diagonal ceiling.
The sudden push toward the 0.0109 USD threshold functions essentially as a technical retest confronting a heavy wall of overhead supply. Examining the active daily candle hovering near 0.01086 USD, bullish expansion has visibly stalled, printing an upper rejection shadow that reveals responsive selling. Trading volume following the initial pump has begun to flatten, confirming that institutional sponsorship is unwilling to chase higher valuations. The multi-month sequence of lower highs established since August remains completely undisturbed, granting sellers dominant structural positioning to enforce another downward impulse.
This price rejection against major diagonal resistance unlocks an asymmetric trend-continuation Short opportunity featuring an outstanding risk-to-reward ratio. The primary downside objective points directly toward the macro demand floor at 0.00501 USD. Downside exposure is strictly managed by placing a disciplined protective stop-loss cleanly above the diagonal resistance shelf at 0.01125 USD for capital preservation.
DYOR $ACT
{future}(ACTUSDT)
ACT Tags Descending Trendline on 1D: Overhead Rejection Wick Sparks High-Reward Short Toward 0.0050 USD?
ACT on the daily (1D) timeframe continues to preserve a disciplined macro downward trajectory beneath the overhead descending white trendline originating from the 0.0145 USD swing high. Following an aggressive relief expansion that drove price action from the 0.0078 USD liquidity floor, the market has completed a decisive structural test along the underside of this primary diagonal ceiling.
The sudden push toward the 0.0109 USD threshold functions essentially as a technical retest confronting a heavy wall of overhead supply. Examining the active daily candle hovering near 0.01086 USD, bullish expansion has visibly stalled, printing an upper rejection shadow that reveals responsive selling. Trading volume following the initial pump has begun to flatten, confirming that institutional sponsorship is unwilling to chase higher valuations. The multi-month sequence of lower highs established since August remains completely undisturbed, granting sellers dominant structural positioning to enforce another downward impulse.
This price rejection against major diagonal resistance unlocks an asymmetric trend-continuation Short opportunity featuring an outstanding risk-to-reward ratio. The primary downside objective points directly toward the macro demand floor at 0.00501 USD. Downside exposure is strictly managed by placing a disciplined protective stop-loss cleanly above the diagonal resistance shelf at 0.01125 USD for capital preservation.
DYOR $ACT
ACT on the daily (1D) timeframe continues to preserve a disciplined macro downward trajectory beneath the overhead descending white trendline originating from the 0.0145 USD swing high. Following an aggressive relief expansion that drove price action from the 0.0078 USD liquidity floor, the market has completed a decisive structural test along the underside of this primary diagonal ceiling.
The sudden push toward the 0.0109 USD threshold functions essentially as a technical retest confronting a heavy wall of overhead supply. Examining the active daily candle hovering near 0.01086 USD, bullish expansion has visibly stalled, printing an upper rejection shadow that reveals responsive selling. Trading volume following the initial pump has begun to flatten, confirming that institutional sponsorship is unwilling to chase higher valuations. The multi-month sequence of lower highs established since August remains completely undisturbed, granting sellers dominant structural positioning to enforce another downward impulse.
This price rejection against major diagonal resistance unlocks an asymmetric trend-continuation Short opportunity featuring an outstanding risk-to-reward ratio. The primary downside objective points directly toward the macro demand floor at 0.00501 USD. Downside exposure is strictly managed by placing a disciplined protective stop-loss cleanly above the diagonal resistance shelf at 0.01125 USD for capital preservation.
DYOR $ACT
363
#BinancePick
Tham gia ngay để kiếm giải thưởng của bạn
#BinancePick
Tham gia ngay để kiếm giải thưởng của bạn
Tham gia ngay để kiếm giải thưởng của bạn

157
Somewhere, this photo has reached over 1 million views.
$MEME
{future}(MEMEUSDT)
Somewhere, this photo has reached over 1 million views.
$MEME
$MEME

1.4k
·
--
Падение
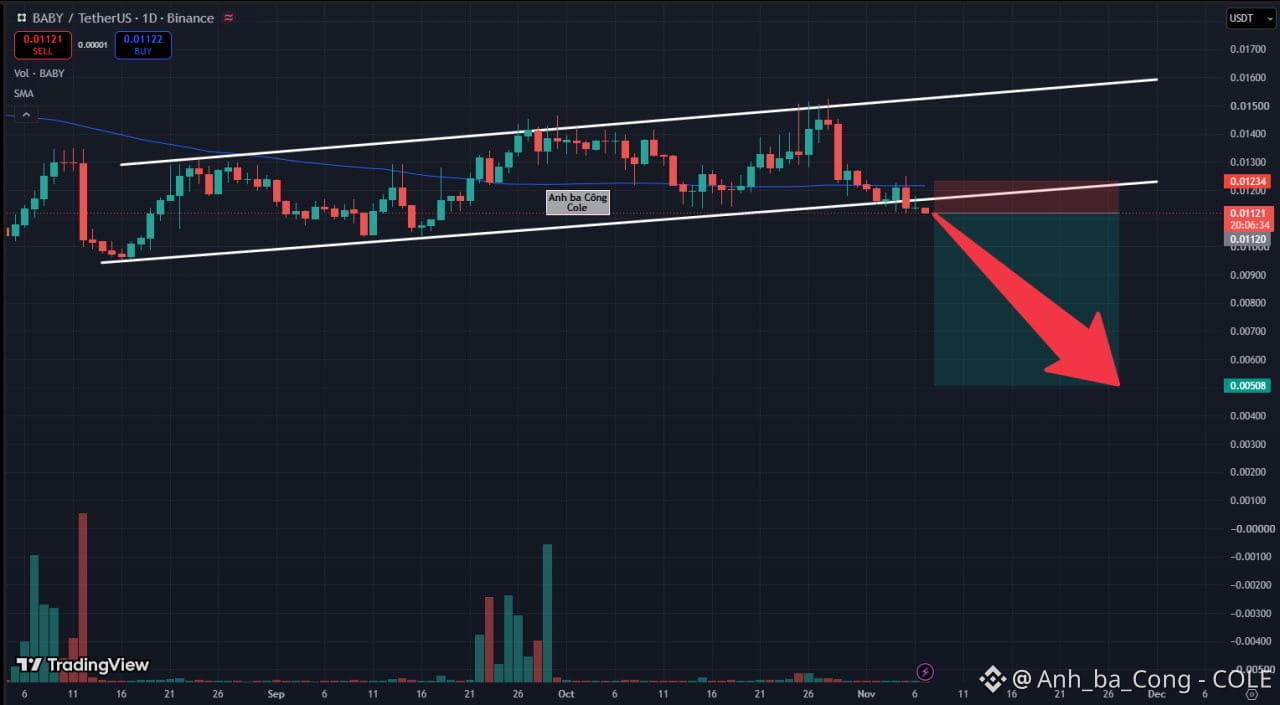
BABY Slices Below Ascending Channel Floor on 1D: Structural Breakdown Triggers Short Setup Toward 0.0050 USD?
BABY on the daily (1D) timeframe has triggered a decisive bearish structural failure by officially breaking below the lower upward-sloping white trendline maintained since mid-August. This decisive breakdown officially invalidates the intermediate ascending channel structure, handing overarching market command directly over to aggressive sellers.
Following an extended struggle to defend the 0.0120 USD dynamic shelf, the active daily candle has pushed decisively through the channel boundary. Observing current daily price action around 0.01121 USD, an expanding red body demonstrates accelerating downside momentum. Price action is concurrently pinned cleanly beneath the dynamic blue MA100 moving average baseline, confirming that structural trend sponsorship has fully deteriorated. Trading volume on the bid side has evaporated to multi-week lows, proving that institutional capital is not stepping in to defend the channel floor. Former multi-month dynamic support has now cleanly transitioned into a formidable overhead resistance ceiling.
This macro trendline breakdown presents an asymmetric trend-continuation Short opportunity featuring an outstanding risk-to-reward ratio. The primary downside expansion objective points directly toward the macro psychological round-number support base at 0.00508 USD. Capital exposure is strictly managed by placing a disciplined protective stop-loss cleanly above the broken channel baseline at 0.01234 USD for disciplined risk management.
DYOR $BABY
{future}(BABYUSDT)
BABY Slices Below Ascending Channel Floor on 1D: Structural Breakdown Triggers Short Setup Toward 0.0050 USD?
BABY on the daily (1D) timeframe has triggered a decisive bearish structural failure by officially breaking below the lower upward-sloping white trendline maintained since mid-August. This decisive breakdown officially invalidates the intermediate ascending channel structure, handing overarching market command directly over to aggressive sellers.
Following an extended struggle to defend the 0.0120 USD dynamic shelf, the active daily candle has pushed decisively through the channel boundary. Observing current daily price action around 0.01121 USD, an expanding red body demonstrates accelerating downside momentum. Price action is concurrently pinned cleanly beneath the dynamic blue MA100 moving average baseline, confirming that structural trend sponsorship has fully deteriorated. Trading volume on the bid side has evaporated to multi-week lows, proving that institutional capital is not stepping in to defend the channel floor. Former multi-month dynamic support has now cleanly transitioned into a formidable overhead resistance ceiling.
This macro trendline breakdown presents an asymmetric trend-continuation Short opportunity featuring an outstanding risk-to-reward ratio. The primary downside expansion objective points directly toward the macro psychological round-number support base at 0.00508 USD. Capital exposure is strictly managed by placing a disciplined protective stop-loss cleanly above the broken channel baseline at 0.01234 USD for disciplined risk management.
DYOR $BABY
BABY on the daily (1D) timeframe has triggered a decisive bearish structural failure by officially breaking below the lower upward-sloping white trendline maintained since mid-August. This decisive breakdown officially invalidates the intermediate ascending channel structure, handing overarching market command directly over to aggressive sellers.
Following an extended struggle to defend the 0.0120 USD dynamic shelf, the active daily candle has pushed decisively through the channel boundary. Observing current daily price action around 0.01121 USD, an expanding red body demonstrates accelerating downside momentum. Price action is concurrently pinned cleanly beneath the dynamic blue MA100 moving average baseline, confirming that structural trend sponsorship has fully deteriorated. Trading volume on the bid side has evaporated to multi-week lows, proving that institutional capital is not stepping in to defend the channel floor. Former multi-month dynamic support has now cleanly transitioned into a formidable overhead resistance ceiling.
This macro trendline breakdown presents an asymmetric trend-continuation Short opportunity featuring an outstanding risk-to-reward ratio. The primary downside expansion objective points directly toward the macro psychological round-number support base at 0.00508 USD. Capital exposure is strictly managed by placing a disciplined protective stop-loss cleanly above the broken channel baseline at 0.01234 USD for disciplined risk management.
DYOR $BABY
2
536
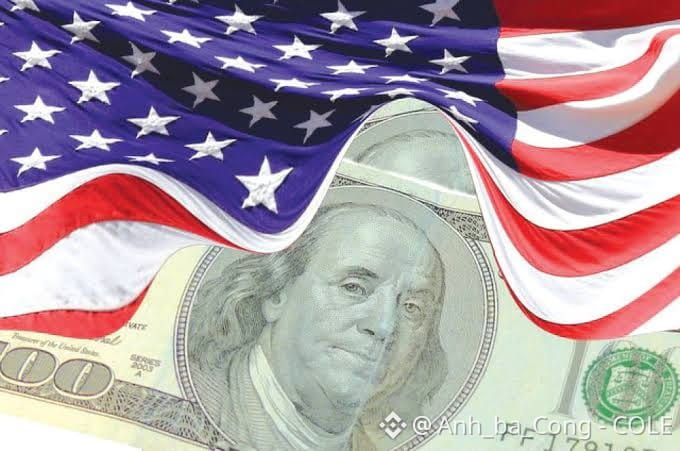
US MIDTERM ELECTION RESULTS: BROAD FINANCIAL ASSET EXPANSION AS DEMOCRATS SECURE CONGRESSIONAL MAJORITY
Preliminary vote counts in the United States midterm elections indicate that the Democratic Party has secured control of both the House of Representatives and the Senate. The projected outcome triggered broad-based upward momentum across global capital markets, lifting equities, precious metals, and digital assets, while crude oil retreated to 93.81 USD per barrel alongside declining benchmark sovereign bond yields.
The immediate market stabilization reflects the establishment of a divided government structure, with a Democrat-controlled Congress operating alongside the administration of President Donald Trump, who officially accepted the electoral results. This configuration establishes legislative gridlock, significantly mitigating the likelihood of abrupt, unilateral policy disruptions. Overriding a presidential veto requires a strict two-thirds supermajority across both legislative chambers, establishing high statutory barriers for contentious economic proposals lacking bipartisan consensus.
From an oversight perspective, Senator Elizabeth Warren and Representative Maxine Waters are positioned to assume leadership of the Senate Banking Committee and the House Financial Services Committee, respectively. While congressional panels may initiate administrative inquiries into projects such as World Liberty Financial and AI development pacing, digital assets remain anchored to institutional liquidity rails via spot ETFs and institutional market makers. Anticipated legislative pressure to temper import tariffs and resolve international geopolitical tensions is expected to ease baseline inflation metrics and soften policy rate expectations.
DYOR. $BTC $ETH
{future}(ETHUSDT)
{future}(BTCUSDT)
US MIDTERM ELECTION RESULTS: BROAD FINANCIAL ASSET EXPANSION AS DEMOCRATS SECURE CONGRESSIONAL MAJORITY
Preliminary vote counts in the United States midterm elections indicate that the Democratic Party has secured control of both the House of Representatives and the Senate. The projected outcome triggered broad-based upward momentum across global capital markets, lifting equities, precious metals, and digital assets, while crude oil retreated to 93.81 USD per barrel alongside declining benchmark sovereign bond yields.
The immediate market stabilization reflects the establishment of a divided government structure, with a Democrat-controlled Congress operating alongside the administration of President Donald Trump, who officially accepted the electoral results. This configuration establishes legislative gridlock, significantly mitigating the likelihood of abrupt, unilateral policy disruptions. Overriding a presidential veto requires a strict two-thirds supermajority across both legislative chambers, establishing high statutory barriers for contentious economic proposals lacking bipartisan consensus.
From an oversight perspective, Senator Elizabeth Warren and Representative Maxine Waters are positioned to assume leadership of the Senate Banking Committee and the House Financial Services Committee, respectively. While congressional panels may initiate administrative inquiries into projects such as World Liberty Financial and AI development pacing, digital assets remain anchored to institutional liquidity rails via spot ETFs and institutional market makers. Anticipated legislative pressure to temper import tariffs and resolve international geopolitical tensions is expected to ease baseline inflation metrics and soften policy rate expectations.
DYOR. $BTC $ETH
Preliminary vote counts in the United States midterm elections indicate that the Democratic Party has secured control of both the House of Representatives and the Senate. The projected outcome triggered broad-based upward momentum across global capital markets, lifting equities, precious metals, and digital assets, while crude oil retreated to 93.81 USD per barrel alongside declining benchmark sovereign bond yields.
The immediate market stabilization reflects the establishment of a divided government structure, with a Democrat-controlled Congress operating alongside the administration of President Donald Trump, who officially accepted the electoral results. This configuration establishes legislative gridlock, significantly mitigating the likelihood of abrupt, unilateral policy disruptions. Overriding a presidential veto requires a strict two-thirds supermajority across both legislative chambers, establishing high statutory barriers for contentious economic proposals lacking bipartisan consensus.
From an oversight perspective, Senator Elizabeth Warren and Representative Maxine Waters are positioned to assume leadership of the Senate Banking Committee and the House Financial Services Committee, respectively. While congressional panels may initiate administrative inquiries into projects such as World Liberty Financial and AI development pacing, digital assets remain anchored to institutional liquidity rails via spot ETFs and institutional market makers. Anticipated legislative pressure to temper import tariffs and resolve international geopolitical tensions is expected to ease baseline inflation metrics and soften policy rate expectations.
DYOR. $BTC $ETH
2.3k
·
--
Падение
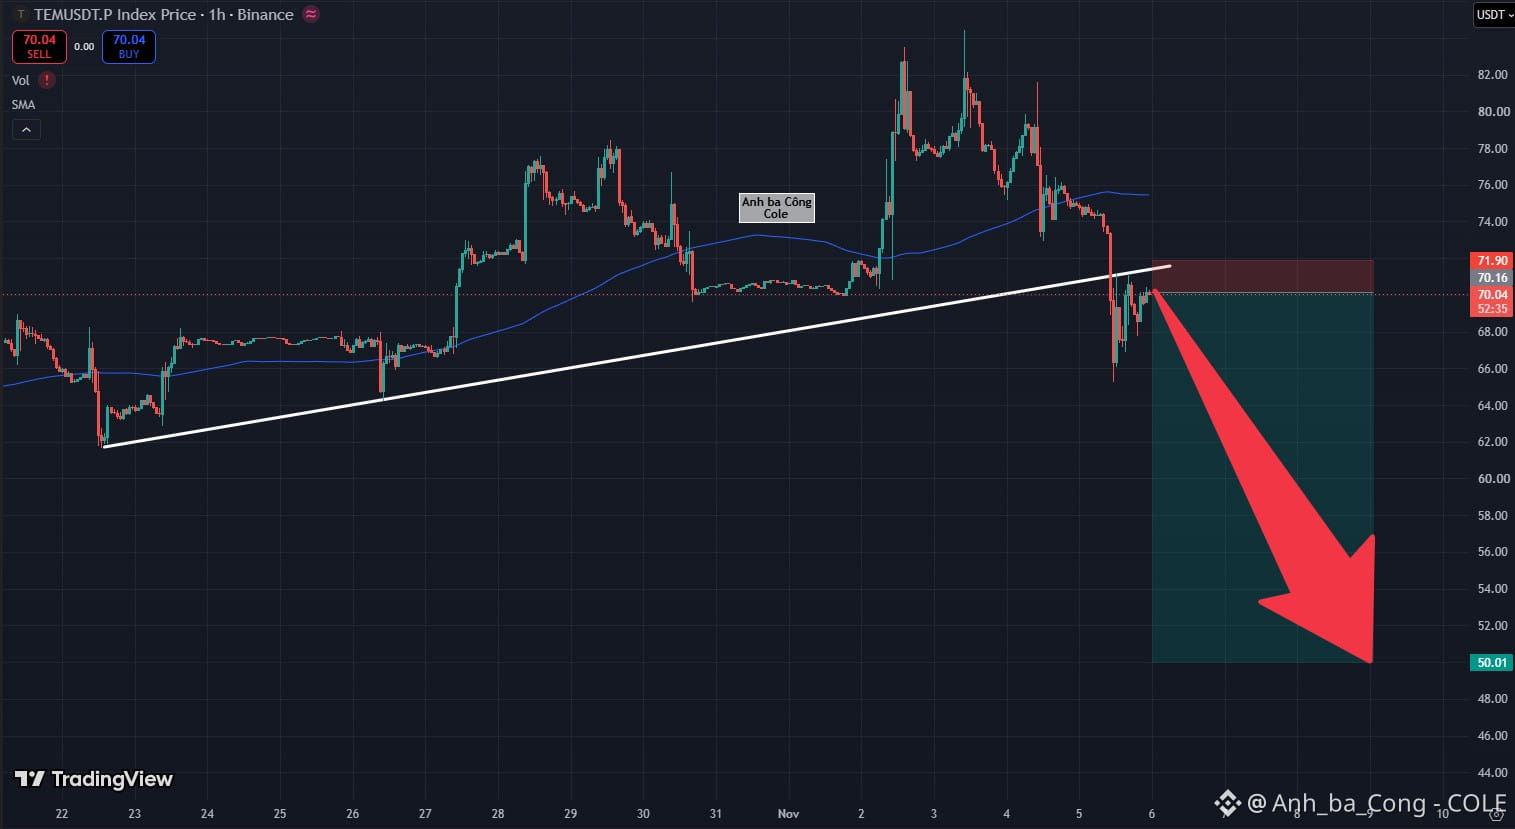
TEM Slices Ascending Trendline on 1H: Underside Retest Triggers Trend-Reversal Short Toward 50.0 USD?
TEM on the 1-hour (1H) timeframe has confirmed a pivotal bearish trend reversal by officially breaking beneath the upward-sloping white support trendline maintained from the 62.0 USD swing low. The decisive failure of this ascending dynamic baseline terminates the short-term markup structure, shifting overarching market control directly into the hands of active sellers.
Following an aggressive flush toward the 65.0 USD zone, price action delivered a shallow technical relief crawl directly toward the underside of the broken trendline near 70.04 USD. Observing 1-hour candle behavior, upward progress stalled immediately upon contact, printing compressed bodies alongside prominent upper rejection shadows. Price action concurrently remains suppressed beneath the downward-sloping dynamic moving average baseline near 74.5 – 75.0 USD, establishing a formidable dual-resistance ceiling. Crucially, buying volume on this recovery has completely dried up, confirming that institutional sponsorship is absent from the bid side. Former dynamic support has cleanly transitioned into rigid overhead supply.
This exhausted retest unlocks an asymmetric trend-continuation Short opportunity featuring an outstanding risk-to-reward ratio. The primary downside objective points directly toward the macro psychological round-number support base at 50.01 USD. Downside exposure is strictly managed by placing a disciplined protective stop-loss cleanly above resistance at 71.90 USD for capital preservation.
DYOR $TEM
{future}(TEMUSDT)
TEM Slices Ascending Trendline on 1H: Underside Retest Triggers Trend-Reversal Short Toward 50.0 USD?
TEM on the 1-hour (1H) timeframe has confirmed a pivotal bearish trend reversal by officially breaking beneath the upward-sloping white support trendline maintained from the 62.0 USD swing low. The decisive failure of this ascending dynamic baseline terminates the short-term markup structure, shifting overarching market control directly into the hands of active sellers.
Following an aggressive flush toward the 65.0 USD zone, price action delivered a shallow technical relief crawl directly toward the underside of the broken trendline near 70.04 USD. Observing 1-hour candle behavior, upward progress stalled immediately upon contact, printing compressed bodies alongside prominent upper rejection shadows. Price action concurrently remains suppressed beneath the downward-sloping dynamic moving average baseline near 74.5 – 75.0 USD, establishing a formidable dual-resistance ceiling. Crucially, buying volume on this recovery has completely dried up, confirming that institutional sponsorship is absent from the bid side. Former dynamic support has cleanly transitioned into rigid overhead supply.
This exhausted retest unlocks an asymmetric trend-continuation Short opportunity featuring an outstanding risk-to-reward ratio. The primary downside objective points directly toward the macro psychological round-number support base at 50.01 USD. Downside exposure is strictly managed by placing a disciplined protective stop-loss cleanly above resistance at 71.90 USD for capital preservation.
DYOR $TEM
TEM on the 1-hour (1H) timeframe has confirmed a pivotal bearish trend reversal by officially breaking beneath the upward-sloping white support trendline maintained from the 62.0 USD swing low. The decisive failure of this ascending dynamic baseline terminates the short-term markup structure, shifting overarching market control directly into the hands of active sellers.
Following an aggressive flush toward the 65.0 USD zone, price action delivered a shallow technical relief crawl directly toward the underside of the broken trendline near 70.04 USD. Observing 1-hour candle behavior, upward progress stalled immediately upon contact, printing compressed bodies alongside prominent upper rejection shadows. Price action concurrently remains suppressed beneath the downward-sloping dynamic moving average baseline near 74.5 – 75.0 USD, establishing a formidable dual-resistance ceiling. Crucially, buying volume on this recovery has completely dried up, confirming that institutional sponsorship is absent from the bid side. Former dynamic support has cleanly transitioned into rigid overhead supply.
This exhausted retest unlocks an asymmetric trend-continuation Short opportunity featuring an outstanding risk-to-reward ratio. The primary downside objective points directly toward the macro psychological round-number support base at 50.01 USD. Downside exposure is strictly managed by placing a disciplined protective stop-loss cleanly above resistance at 71.90 USD for capital preservation.
DYOR $TEM
1
211
·
--
Рост
LIT Breaks Out of 1D Descending Trendline: Awaiting MA100 Confirmation to Trigger Long Toward 10.0 USD?
LIT on the daily (1D) timeframe has delivered a pivotal technical development by officially nudging above the descending white trendline that capped its corrective structure since late September. This diagonal breakout initially dismantles the multi-week downward trajectory, clearing a viable pathway toward an intermediate bullish recovery cycle.
However, executing an immediate Long entry requires verified confirmation as price action remains directly beneath the dynamic blue MA100 baseline near 3.51 USD. Observing active daily candle behavior around 3.4359 USD, buyers are consolidating constructive support directly atop the newly breached diagonal trendline. Compact candle bodies accompanied by steady lower absorption wicks indicate that low-level distribution pressure is thoroughly exhausted. Exercising professional discipline by waiting for a decisive daily candle close fully above the dynamic MA100 effectively eliminates the threat of a bull trap, verifying that institutional capital has absorbed remaining overhead supply.
Once the breakout above the MA100 is confirmed, an asymmetric trend-reversal Long opportunity opens with an exceptional risk-to-reward profile. The primary upside expansion target points straight toward the macro psychological round-number objective at 10.0090 USD. Downside exposure is strictly managed by placing a disciplined protective stop-loss cleanly beneath the broken trendline at 2.9210 USD for capital preservation.
DYOR $LIT
{future}(LITUSDT)
LIT Breaks Out of 1D Descending Trendline: Awaiting MA100 Confirmation to Trigger Long Toward 10.0 USD?
LIT on the daily (1D) timeframe has delivered a pivotal technical development by officially nudging above the descending white trendline that capped its corrective structure since late September. This diagonal breakout initially dismantles the multi-week downward trajectory, clearing a viable pathway toward an intermediate bullish recovery cycle.
However, executing an immediate Long entry requires verified confirmation as price action remains directly beneath the dynamic blue MA100 baseline near 3.51 USD. Observing active daily candle behavior around 3.4359 USD, buyers are consolidating constructive support directly atop the newly breached diagonal trendline. Compact candle bodies accompanied by steady lower absorption wicks indicate that low-level distribution pressure is thoroughly exhausted. Exercising professional discipline by waiting for a decisive daily candle close fully above the dynamic MA100 effectively eliminates the threat of a bull trap, verifying that institutional capital has absorbed remaining overhead supply.
Once the breakout above the MA100 is confirmed, an asymmetric trend-reversal Long opportunity opens with an exceptional risk-to-reward profile. The primary upside expansion target points straight toward the macro psychological round-number objective at 10.0090 USD. Downside exposure is strictly managed by placing a disciplined protective stop-loss cleanly beneath the broken trendline at 2.9210 USD for capital preservation.
DYOR $LIT
LIT on the daily (1D) timeframe has delivered a pivotal technical development by officially nudging above the descending white trendline that capped its corrective structure since late September. This diagonal breakout initially dismantles the multi-week downward trajectory, clearing a viable pathway toward an intermediate bullish recovery cycle.
However, executing an immediate Long entry requires verified confirmation as price action remains directly beneath the dynamic blue MA100 baseline near 3.51 USD. Observing active daily candle behavior around 3.4359 USD, buyers are consolidating constructive support directly atop the newly breached diagonal trendline. Compact candle bodies accompanied by steady lower absorption wicks indicate that low-level distribution pressure is thoroughly exhausted. Exercising professional discipline by waiting for a decisive daily candle close fully above the dynamic MA100 effectively eliminates the threat of a bull trap, verifying that institutional capital has absorbed remaining overhead supply.
Once the breakout above the MA100 is confirmed, an asymmetric trend-reversal Long opportunity opens with an exceptional risk-to-reward profile. The primary upside expansion target points straight toward the macro psychological round-number objective at 10.0090 USD. Downside exposure is strictly managed by placing a disciplined protective stop-loss cleanly beneath the broken trendline at 2.9210 USD for capital preservation.
DYOR $LIT
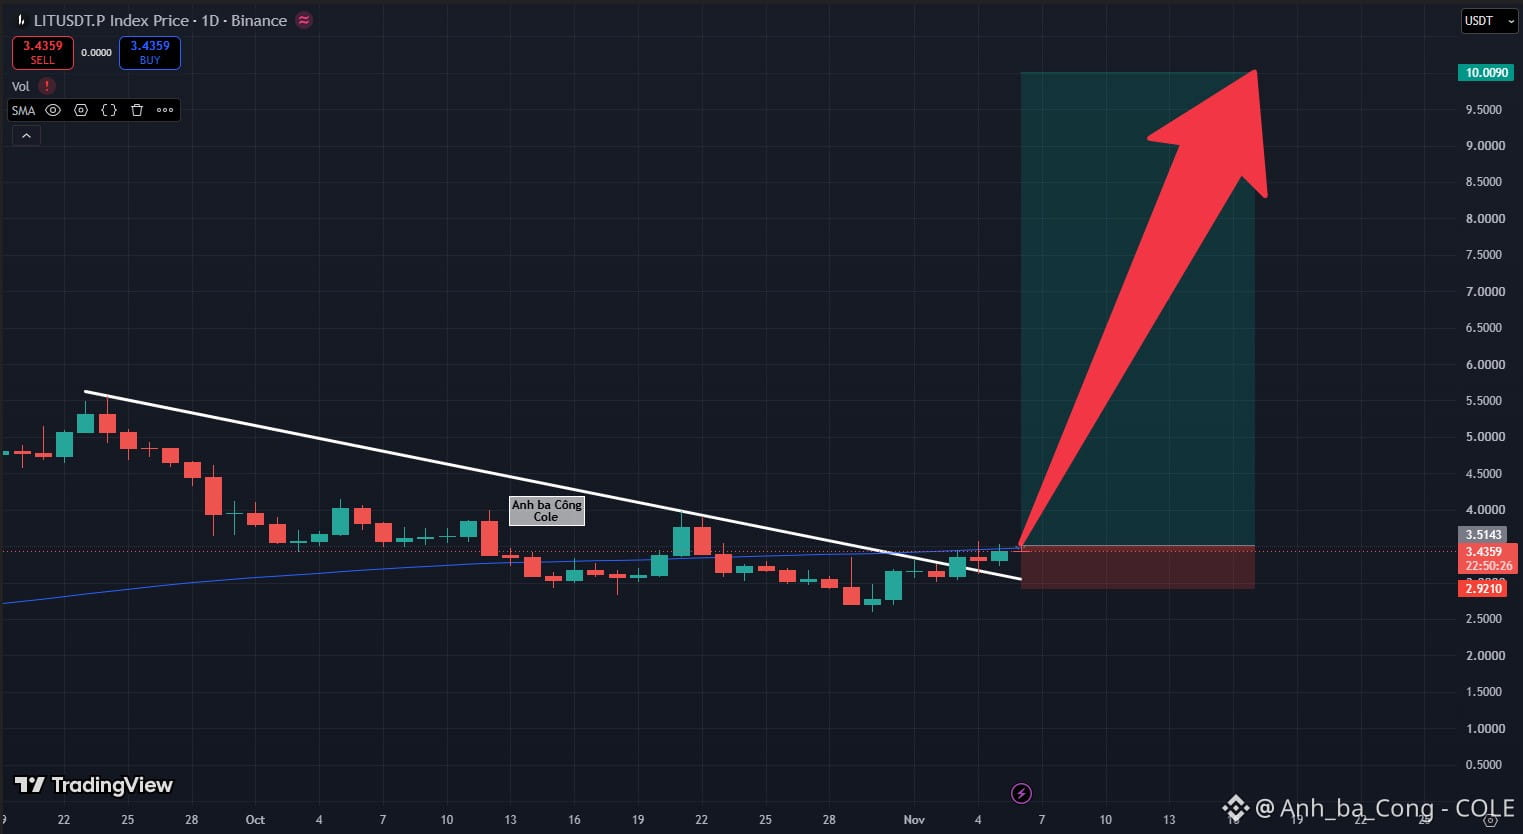
1
420
·
--
Падение
MORPHO Slices Below Ascending Trendline on 1D: Breakdown Beneath MA100 Unlocks Short Toward 1.0 USD Floor?
MORPHO on the daily (1D) timeframe has triggered a decisive macro structural breakdown by officially breaching the upward-sloping white trendline maintained since early this year. The decisive failure of this multi-month structural backbone marks the formal exhaustion of the primary bullish cycle, shifting overarching market control directly into the hands of institutional sellers.
Following persistent distribution around the 2.90 – 3.00 USD peak, aggressive sell pressure forced price action to close conclusively beneath the dynamic MA100 moving average shelf. The active daily candle hovering near 2.089 USD is executing a shallow relief retest along the underside of the broken trendline. Tight candle clustering and subtle upper shadows indicate that buying momentum is completely depleted. Retest trading volume has evaporated to session lows, confirming that responsive accumulation is entirely absent from the tape. Former primary dynamic support that anchored price for months has now flipped into a rigid overhead resistance shelf.
This confirmed structural breakdown unlocks an asymmetric trend-continuation Short opportunity featuring an outstanding risk-to-reward ratio. The primary downside objective points directly toward the macro psychological round-number support base at 1.007 USD. Downside exposure is strictly managed by placing a disciplined protective stop-loss cleanly above the MA100 resistance at 2.344 USD for capital preservation.
DYOR $MORPHO
{future}(MORPHOUSDT)
MORPHO Slices Below Ascending Trendline on 1D: Breakdown Beneath MA100 Unlocks Short Toward 1.0 USD Floor?
MORPHO on the daily (1D) timeframe has triggered a decisive macro structural breakdown by officially breaching the upward-sloping white trendline maintained since early this year. The decisive failure of this multi-month structural backbone marks the formal exhaustion of the primary bullish cycle, shifting overarching market control directly into the hands of institutional sellers.
Following persistent distribution around the 2.90 – 3.00 USD peak, aggressive sell pressure forced price action to close conclusively beneath the dynamic MA100 moving average shelf. The active daily candle hovering near 2.089 USD is executing a shallow relief retest along the underside of the broken trendline. Tight candle clustering and subtle upper shadows indicate that buying momentum is completely depleted. Retest trading volume has evaporated to session lows, confirming that responsive accumulation is entirely absent from the tape. Former primary dynamic support that anchored price for months has now flipped into a rigid overhead resistance shelf.
This confirmed structural breakdown unlocks an asymmetric trend-continuation Short opportunity featuring an outstanding risk-to-reward ratio. The primary downside objective points directly toward the macro psychological round-number support base at 1.007 USD. Downside exposure is strictly managed by placing a disciplined protective stop-loss cleanly above the MA100 resistance at 2.344 USD for capital preservation.
DYOR $MORPHO
MORPHO on the daily (1D) timeframe has triggered a decisive macro structural breakdown by officially breaching the upward-sloping white trendline maintained since early this year. The decisive failure of this multi-month structural backbone marks the formal exhaustion of the primary bullish cycle, shifting overarching market control directly into the hands of institutional sellers.
Following persistent distribution around the 2.90 – 3.00 USD peak, aggressive sell pressure forced price action to close conclusively beneath the dynamic MA100 moving average shelf. The active daily candle hovering near 2.089 USD is executing a shallow relief retest along the underside of the broken trendline. Tight candle clustering and subtle upper shadows indicate that buying momentum is completely depleted. Retest trading volume has evaporated to session lows, confirming that responsive accumulation is entirely absent from the tape. Former primary dynamic support that anchored price for months has now flipped into a rigid overhead resistance shelf.
This confirmed structural breakdown unlocks an asymmetric trend-continuation Short opportunity featuring an outstanding risk-to-reward ratio. The primary downside objective points directly toward the macro psychological round-number support base at 1.007 USD. Downside exposure is strictly managed by placing a disciplined protective stop-loss cleanly above the MA100 resistance at 2.344 USD for capital preservation.
DYOR $MORPHO
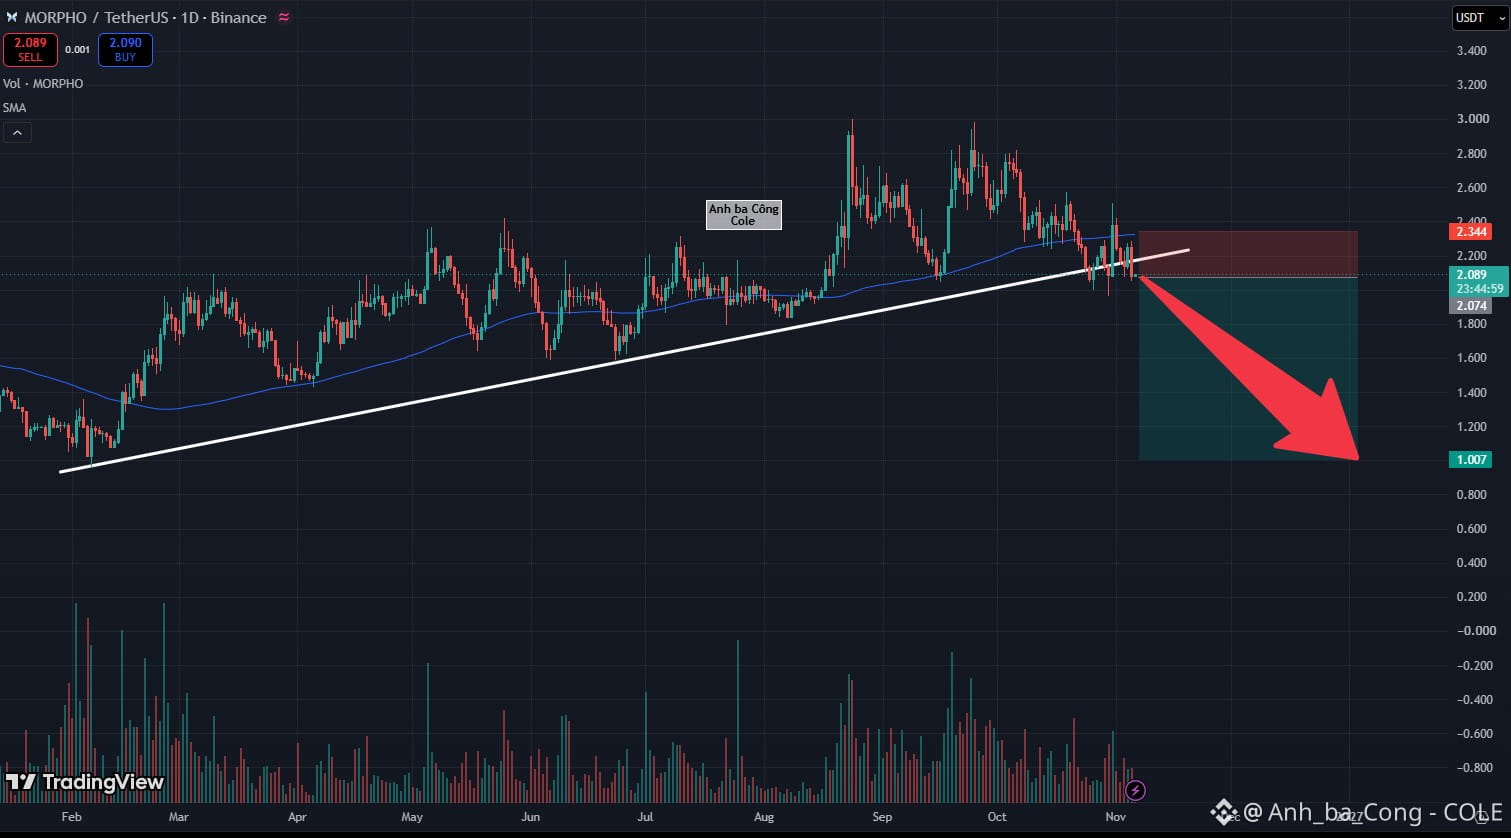
261
Войдите, чтобы посмотреть больше материала
Присоединяйтесь к пользователям криптовалют по всему миру на Binance Square
⚡️ Получайте новейшую и полезную информацию о криптоактивах.
💬 Нам доверяет крупнейшая в мире криптобиржа.
👍 Получите достоверные аналитические данные от верифицированных создателей контента.
Эл. почта/номер телефона
В тренде
NvidiaInvestigatesAfterHuang’sAffairApology
Просмотров: 86,214
957 обсуждают
Nvidia Board Opens Probe Into Whether Huang Was Target of Foreign Intelligence Effort
Binance News
·Лайков: 12
·Просмотров: 41.7k
BitcoinFiveWeeklyLosses
Просмотров: 106,879
1,430 обсуждают
AIChipSlumpNasdaq
Просмотров: 54,095
878 обсуждают