

CryptoTraders.com
466 Публикации

CryptoTraders.com
Отправить жалобу
Заблокировать пользователя
Home of Top Analysts, Elite Trade Alerts, Cutting-Edge Algorithms, and Powerful Scanners — all built to give you the edge in any market. Join & Activate your 14-day free trial now to see the results yourself!
0 подписок(и/а)
4 подписчиков(а)
5 понравилось
Посты
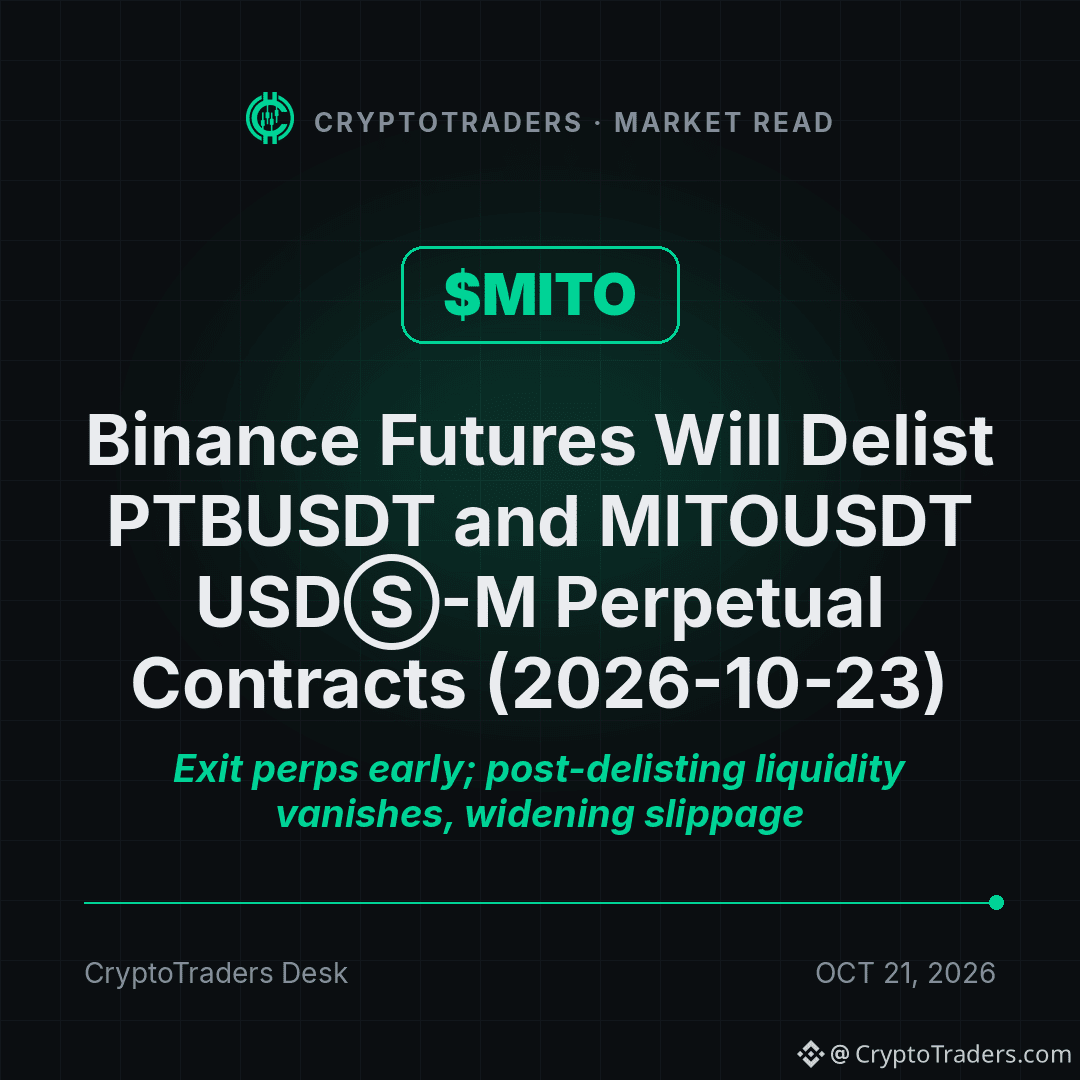
Binance sets an October 2026 delisting date for the MITOUSDT perpetual, and $MITO is down 15.1% on the day 📉 Highlights: ▪ Binance Futures will delist the PTBUSDT and MITOUSDT USDⓈ-M perpetual contracts on October 23, 2026. ▪ The announcement covers both contracts in a single notice. ▪ The announcement page could not be fetched, so settlement and further timing details remain unverified. ▪ MITO is trading at 0.01109, down 15.1% over 24 hours. My Take 🔴 Losing a Binance perpetual removes a liquid hedging and leverage venue, and the notice lands while price is already weak. 🟡 The impact read is near-term: perpetual liquidity and position adjustments ahead of removal, with spot impact likely limited unless these contracts carry a meaningful share of trading activity. 🟡 With the announcement page unfetchable, the settlement mechanics stay unconfirmed. Does a perp delisting change your view on a token, or is it just venue housekeeping? I write reads like this most days in the group, and my bio shows how to find it. #Altcoin Season# #Macro Insights#
Binance sets an October 2026 delisting date for the MITOUSDT perpetual, and $MITO is down 15.1% on the day 📉 Highlights: ▪ Binance Futures will delist the PTBUSDT and MITOUSDT USDⓈ-M perpetual contracts on October 23, 2026. ▪ The announcement covers both contracts in a single notice. ▪ The announcement page could not be fetched, so settlement and further timing details remain unverified. ▪ MITO is trading at 0.01109, down 15.1% over 24 hours. My Take 🔴 Losing a Binance perpetual removes a liquid hedging and leverage venue, and the notice lands while price is already weak. 🟡 The impact read is near-term: perpetual liquidity and position adjustments ahead of removal, with spot impact likely limited unless these contracts carry a meaningful share of trading activity. 🟡 With the announcement page unfetchable, the settlement mechanics stay unconfirmed. Does a perp delisting change your view on a token, or is it just venue housekeeping? I write reads like this most days in the group, and my bio shows how to find it. #Altcoin Season# #Macro Insights#
2
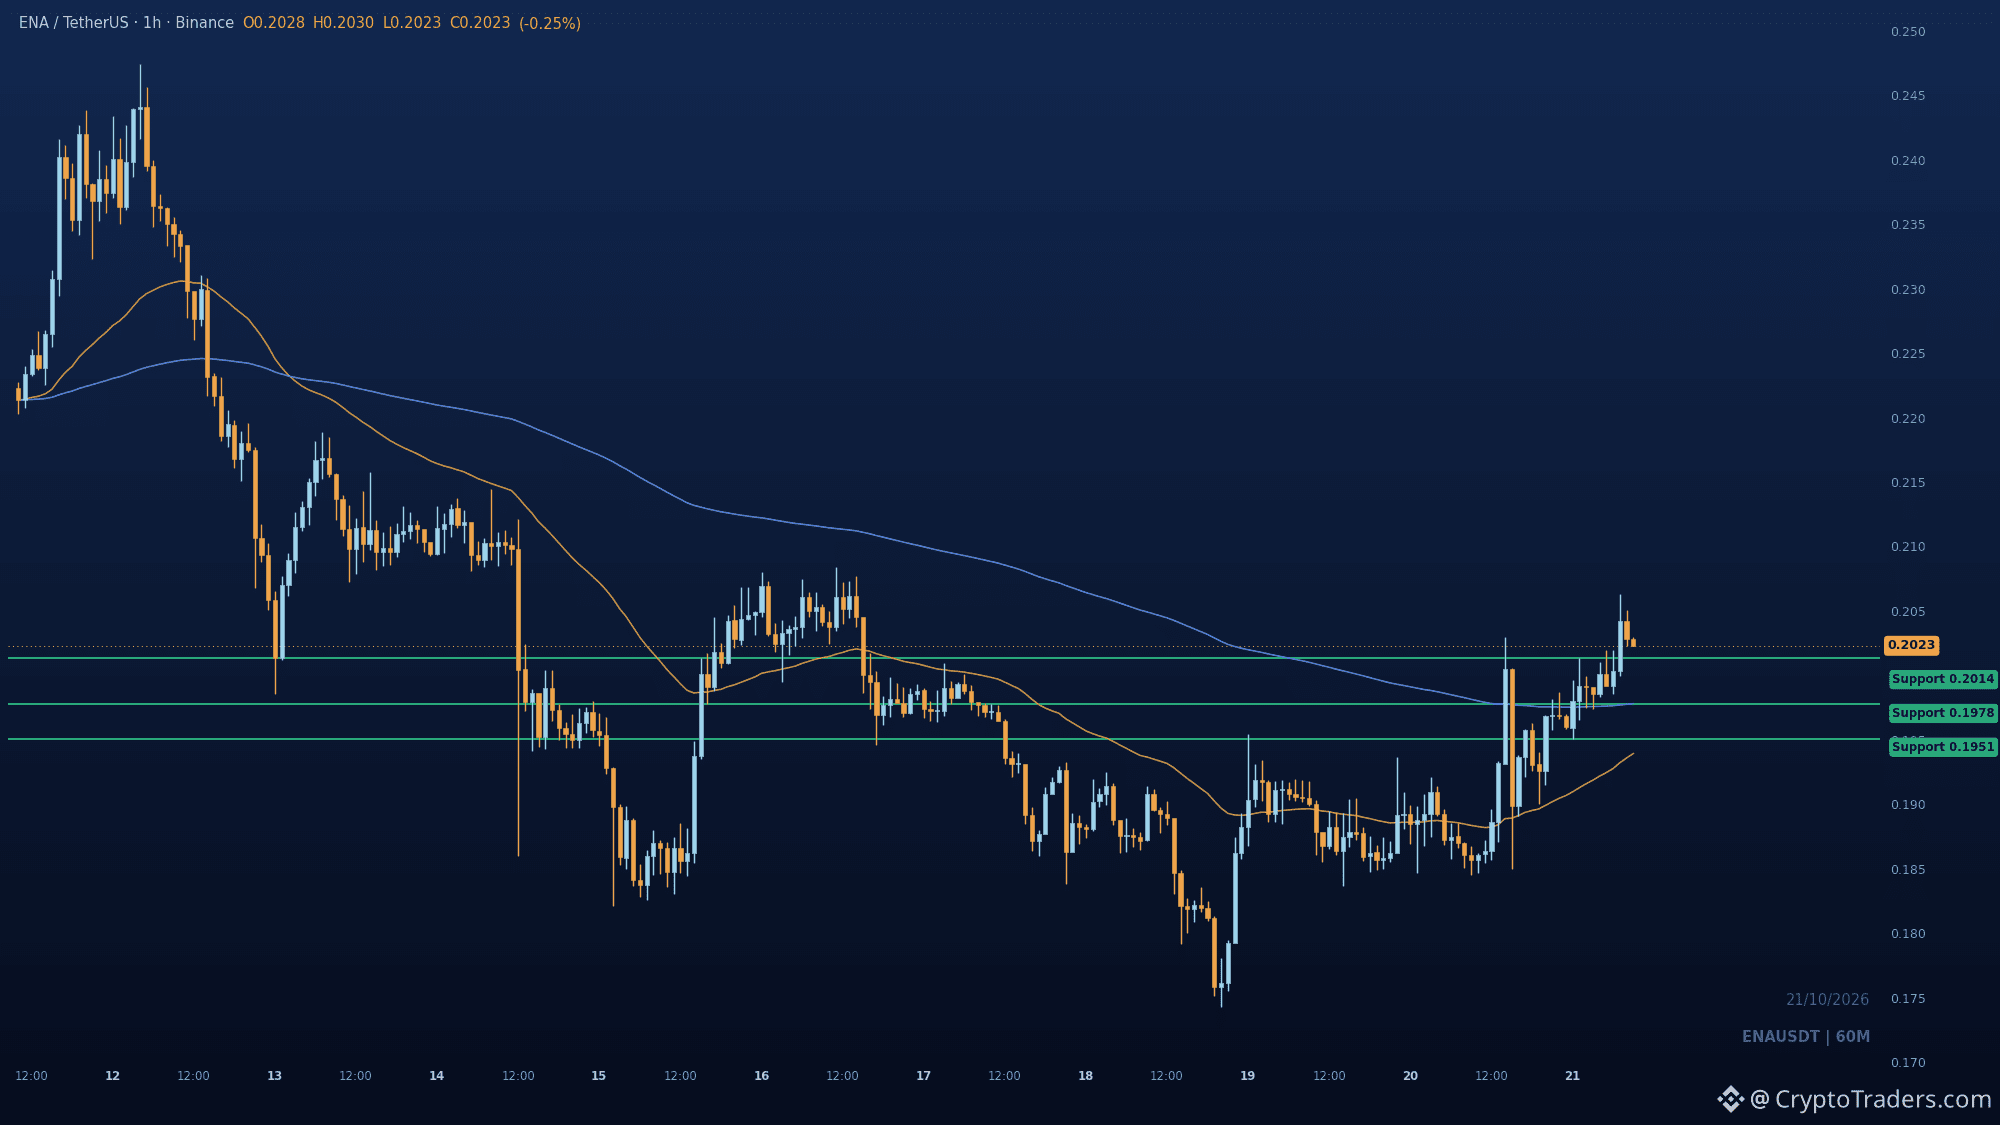
The crowd is treating this $ENA pop as a dead-cat bounce, but the 1h chart already printed a bullish break of structure above 0.20136. Price is still in range discount, so the move has room before it gets crowded. Both EMAs are reclaimed. The 200 EMA at 0.1978 is the pullback reference if 0.20136 gives way. Below that, 0.19509 is where the bullish read falls apart. How many hours do you give this before the retest of 0.20136? Charts like this get walked through with the group every morning. #Altcoin Season#
The crowd is treating this $ENA pop as a dead-cat bounce, but the 1h chart already printed a bullish break of structure above 0.20136. Price is still in range discount, so the move has room before it gets crowded. Both EMAs are reclaimed. The 200 EMA at 0.1978 is the pullback reference if 0.20136 gives way. Below that, 0.19509 is where the bullish read falls apart. How many hours do you give this before the retest of 0.20136? Charts like this get walked through with the group every morning. #Altcoin Season#
25
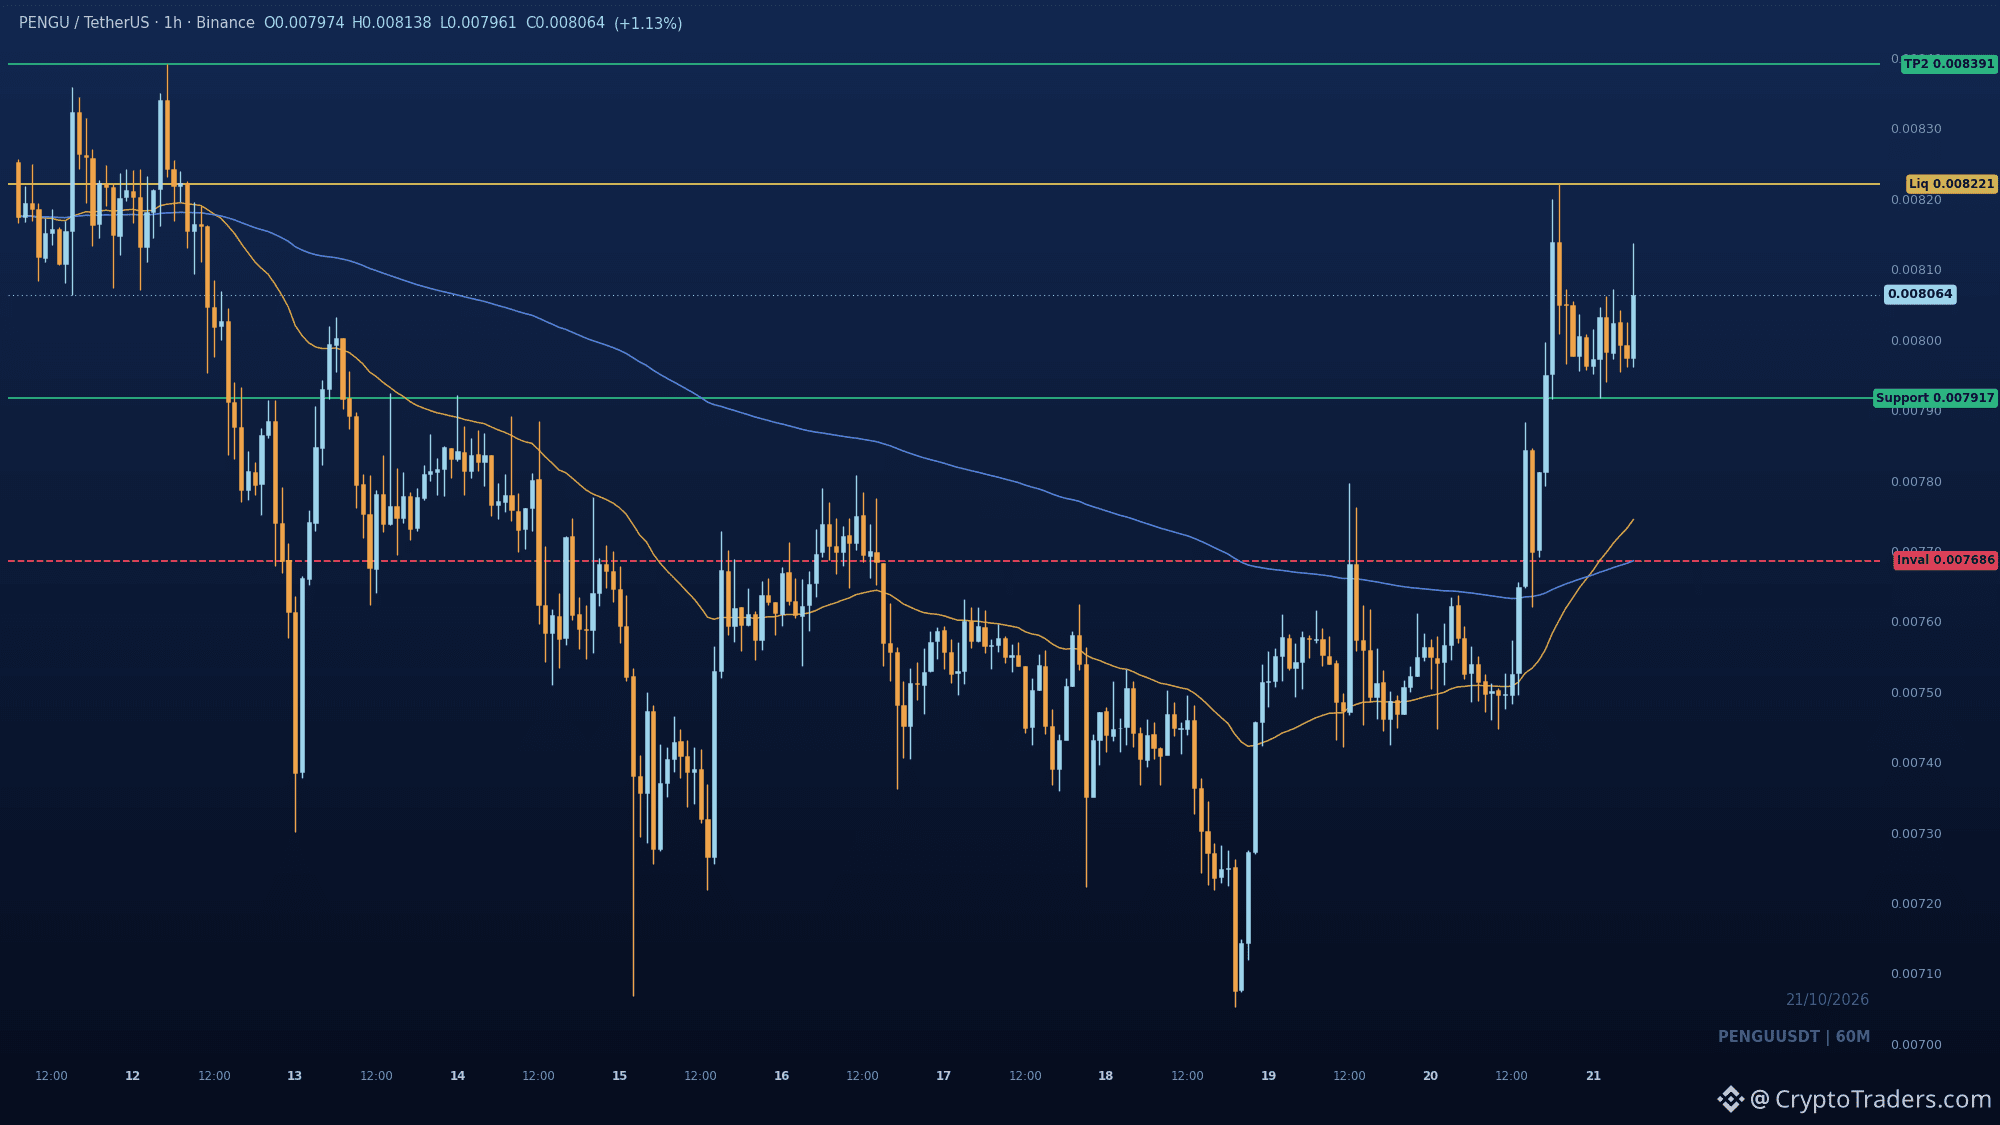
$PENGU is stuck between the 0.007917 pullback shelf and the 0.008221 buy-side pool, and whichever side pays first sets the next leg. The 1h chart flipped from downtrend to a bullish CHoCH/BOS after sweeping the range lows, and both EMAs sit reclaimed under price. That 0.007917 swing low is the tell: if bids show up there, the market is still paying up for dips and 0.008221 then 0.008391 come into play. If that shelf fails, the buyers who paid the breakout stop paying, and 0.00768614 is where the shift gets confirmed. Are you watching the retest or the breakout retry? More reads like this land daily in the group, bio has the way in. #Altcoin Season#
$PENGU is stuck between the 0.007917 pullback shelf and the 0.008221 buy-side pool, and whichever side pays first sets the next leg. The 1h chart flipped from downtrend to a bullish CHoCH/BOS after sweeping the range lows, and both EMAs sit reclaimed under price. That 0.007917 swing low is the tell: if bids show up there, the market is still paying up for dips and 0.008221 then 0.008391 come into play. If that shelf fails, the buyers who paid the breakout stop paying, and 0.00768614 is where the shift gets confirmed. Are you watching the retest or the breakout retry? More reads like this land daily in the group, bio has the way in. #Altcoin Season#
29
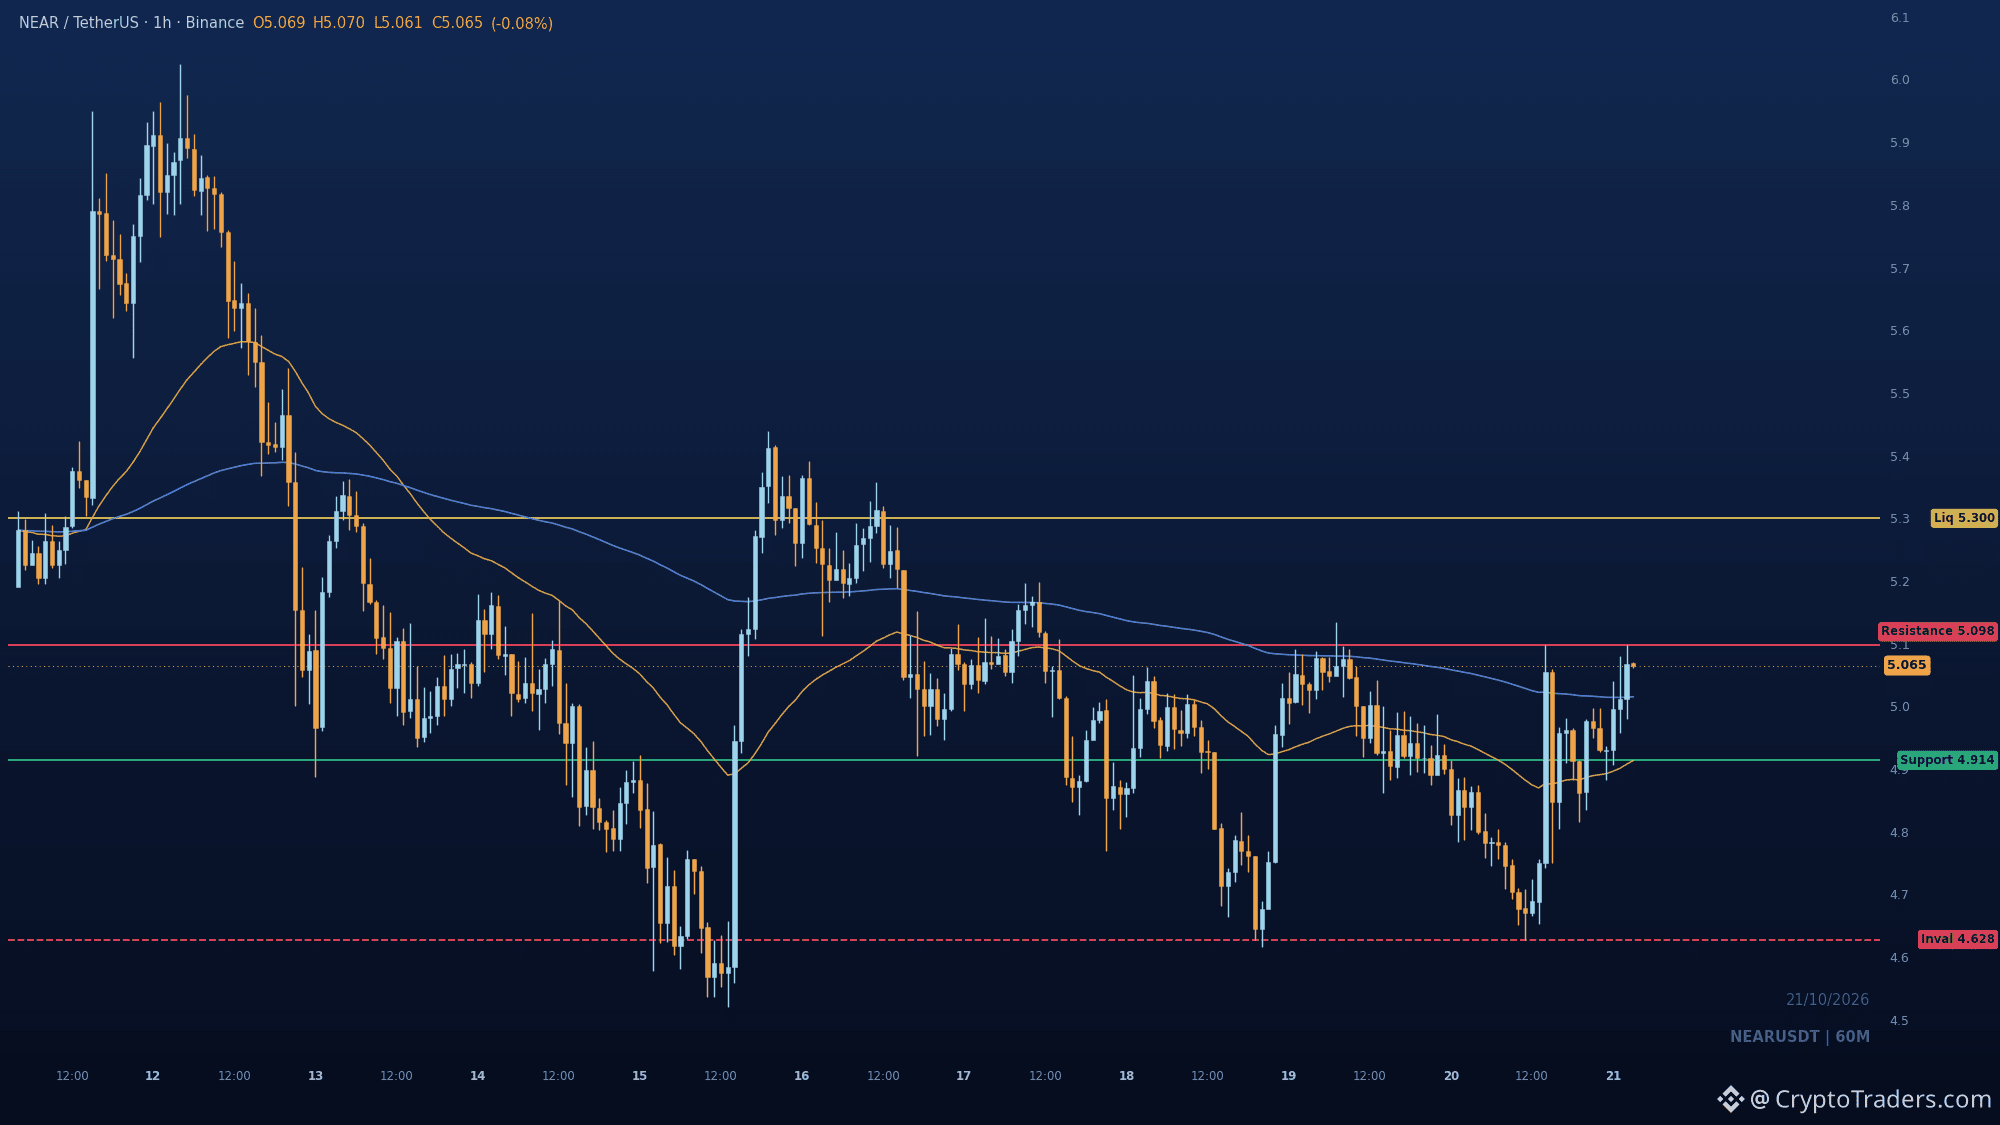
5.098 is the number that matters on $NEAR right now. Price swept 4.63, reclaimed both EMAs, and has climbed into the range discount at 5.07. That swing high is the gate: a hold above it puts 5.3 in view, the prior rebound highs. Losing the 4.914 fast EMA turns this into another rotation, with 4.628 as the line that breaks the bounce. Where do you think NEAR tops out if 5.098 gives way? More reads like this land daily in the group, bio has the details. #Altcoin Season#
5.098 is the number that matters on $NEAR right now. Price swept 4.63, reclaimed both EMAs, and has climbed into the range discount at 5.07. That swing high is the gate: a hold above it puts 5.3 in view, the prior rebound highs. Losing the 4.914 fast EMA turns this into another rotation, with 4.628 as the line that breaks the bounce. Where do you think NEAR tops out if 5.098 gives way? More reads like this land daily in the group, bio has the details. #Altcoin Season#
41
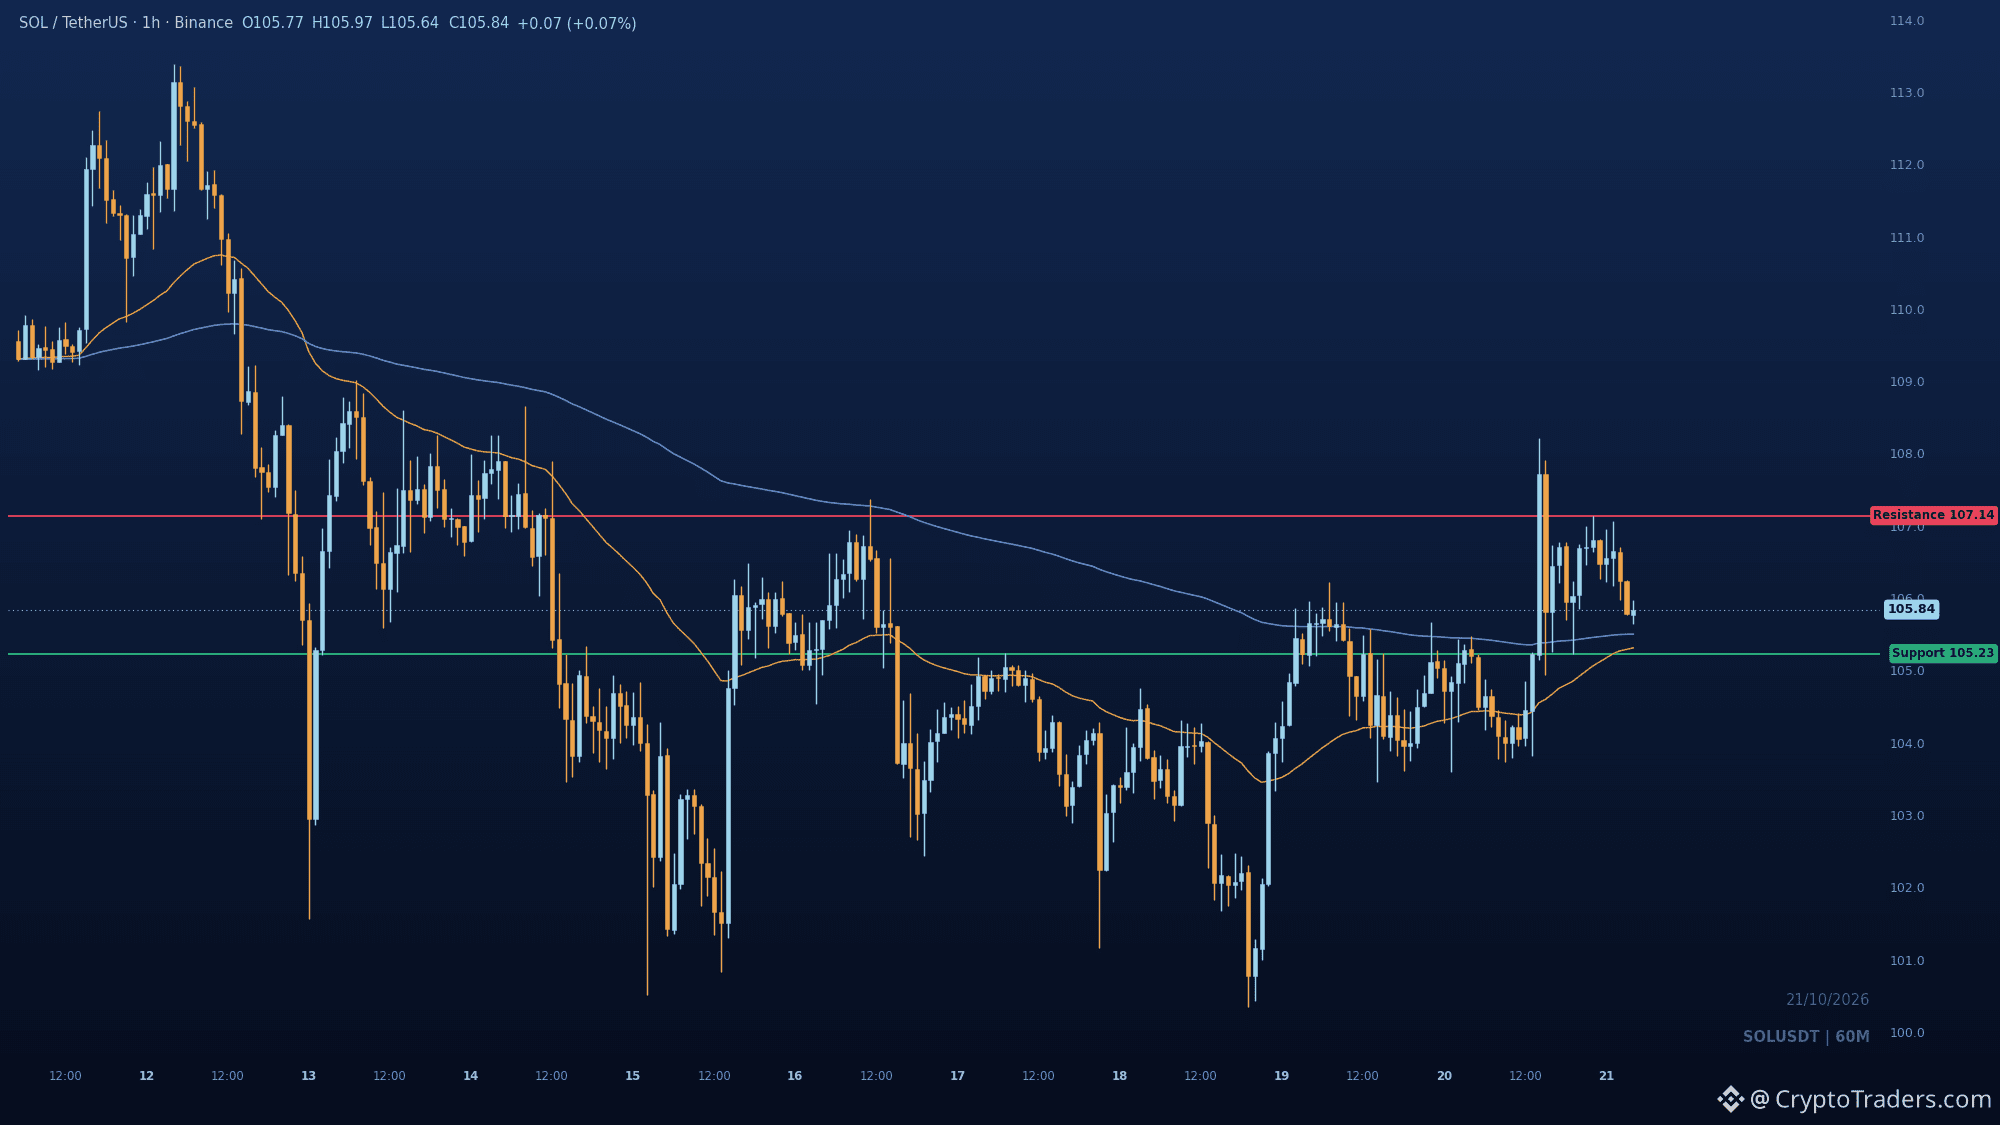
$SOL is trading near 105.91, up 0.7% on the day, and the level matters more than the size of the move. Price has clawed back from the lows but still sits in the discount half of the range, with the hourly chart deciding between continuation and a fade. Attention is coming from two directions. ETF flow and institutional chatter topped crypto Twitter mentions over the last 24 hours at 26, with funding and leverage close behind, so positioning is doing as much work as spot right now. On the fundamental side, Loan went live on Solana with Pyth, adding WIF, PUMP and SOL pools. Bitcoin stayed quiet: Glassnode's Q4 levels held and the 87K to 87.8K band still reads as near-term consolidation. The chart: the hourly read is neutral. Sellers drove the last leg down, buyers reclaimed ground off the lows and pushed into the recent swing high, and price has pulled back toward the moving averages. The zone that matters is 105.23, the swing low where bids have a reason to reappear. Above it, 107.14 is the swing high and the obvious upside liquidity. Timing matters as much as the numbers. A hold above 105.23 sets up a retest of 107.14, and given how the rebound was built, that looks like a session or two of work rather than an intraday spike. Lose 105.23 and the short-term bullish shift is invalidated, handing the tape back to the broader bearish structure. What to watch: whether 105.23 holds on an hourly close, whether 107.14 gets accepted or just wicked, and whether ETF flow prints keep the institutional bid in the conversation. Do you see SOL tagging 107.14 before it revisits the lows? More charts and reads like this land in the group every day, and my bio has the way in. #Altcoin Season# #Macro Insights#
$SOL is trading near 105.91, up 0.7% on the day, and the level matters more than the size of the move. Price has clawed back from the lows but still sits in the discount half of the range, with the hourly chart deciding between continuation and a fade. Attention is coming from two directions. ETF flow and institutional chatter topped crypto Twitter mentions over the last 24 hours at 26, with funding and leverage close behind, so positioning is doing as much work as spot right now. On the fundamental side, Loan went live on Solana with Pyth, adding WIF, PUMP and SOL pools. Bitcoin stayed quiet: Glassnode's Q4 levels held and the 87K to 87.8K band still reads as near-term consolidation. The chart: the hourly read is neutral. Sellers drove the last leg down, buyers reclaimed ground off the lows and pushed into the recent swing high, and price has pulled back toward the moving averages. The zone that matters is 105.23, the swing low where bids have a reason to reappear. Above it, 107.14 is the swing high and the obvious upside liquidity. Timing matters as much as the numbers. A hold above 105.23 sets up a retest of 107.14, and given how the rebound was built, that looks like a session or two of work rather than an intraday spike. Lose 105.23 and the short-term bullish shift is invalidated, handing the tape back to the broader bearish structure. What to watch: whether 105.23 holds on an hourly close, whether 107.14 gets accepted or just wicked, and whether ETF flow prints keep the institutional bid in the conversation. Do you see SOL tagging 107.14 before it revisits the lows? More charts and reads like this land in the group every day, and my bio has the way in. #Altcoin Season# #Macro Insights#
57
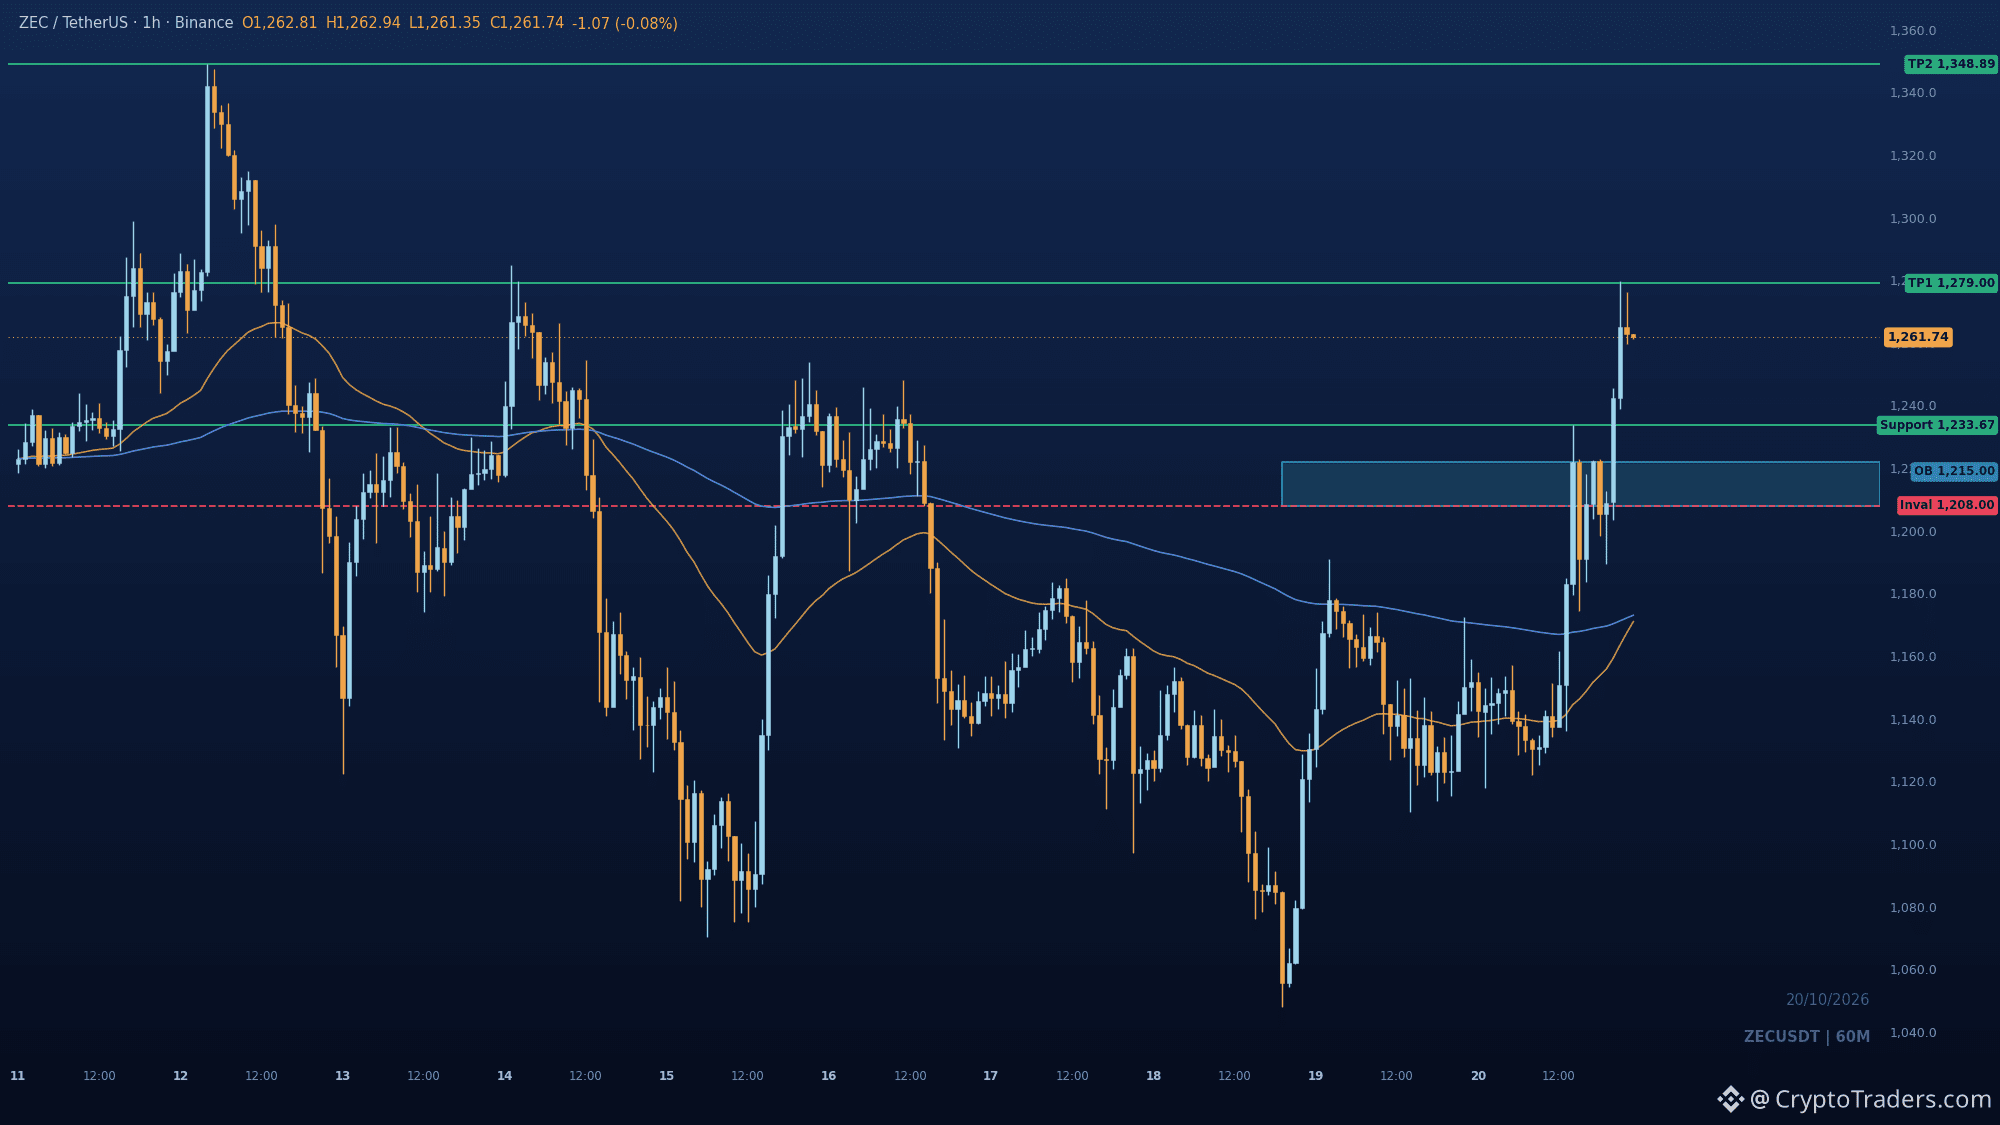
Can $ZEC hold 1233.67 now that it is support instead of resistance? BOS through 1233.67 came with real momentum after the sweep near 1048, and price is still trading in the premium of the range. The pullback zone is 1233.67, with the bullish order block sitting at 1208 to 1222 behind it. Defense of that base keeps 1279 in play, then the prior high at 1348.89. Losing 1208 flips the read: sellers take over the paying, and the breakout becomes a trap. Are you watching the retest or waiting for 1279 to print first? More reads like this land daily in the group, bio has the way in. #Altcoin Season#
Can $ZEC hold 1233.67 now that it is support instead of resistance? BOS through 1233.67 came with real momentum after the sweep near 1048, and price is still trading in the premium of the range. The pullback zone is 1233.67, with the bullish order block sitting at 1208 to 1222 behind it. Defense of that base keeps 1279 in play, then the prior high at 1348.89. Losing 1208 flips the read: sellers take over the paying, and the breakout becomes a trap. Are you watching the retest or waiting for 1279 to print first? More reads like this land daily in the group, bio has the way in. #Altcoin Season#
55
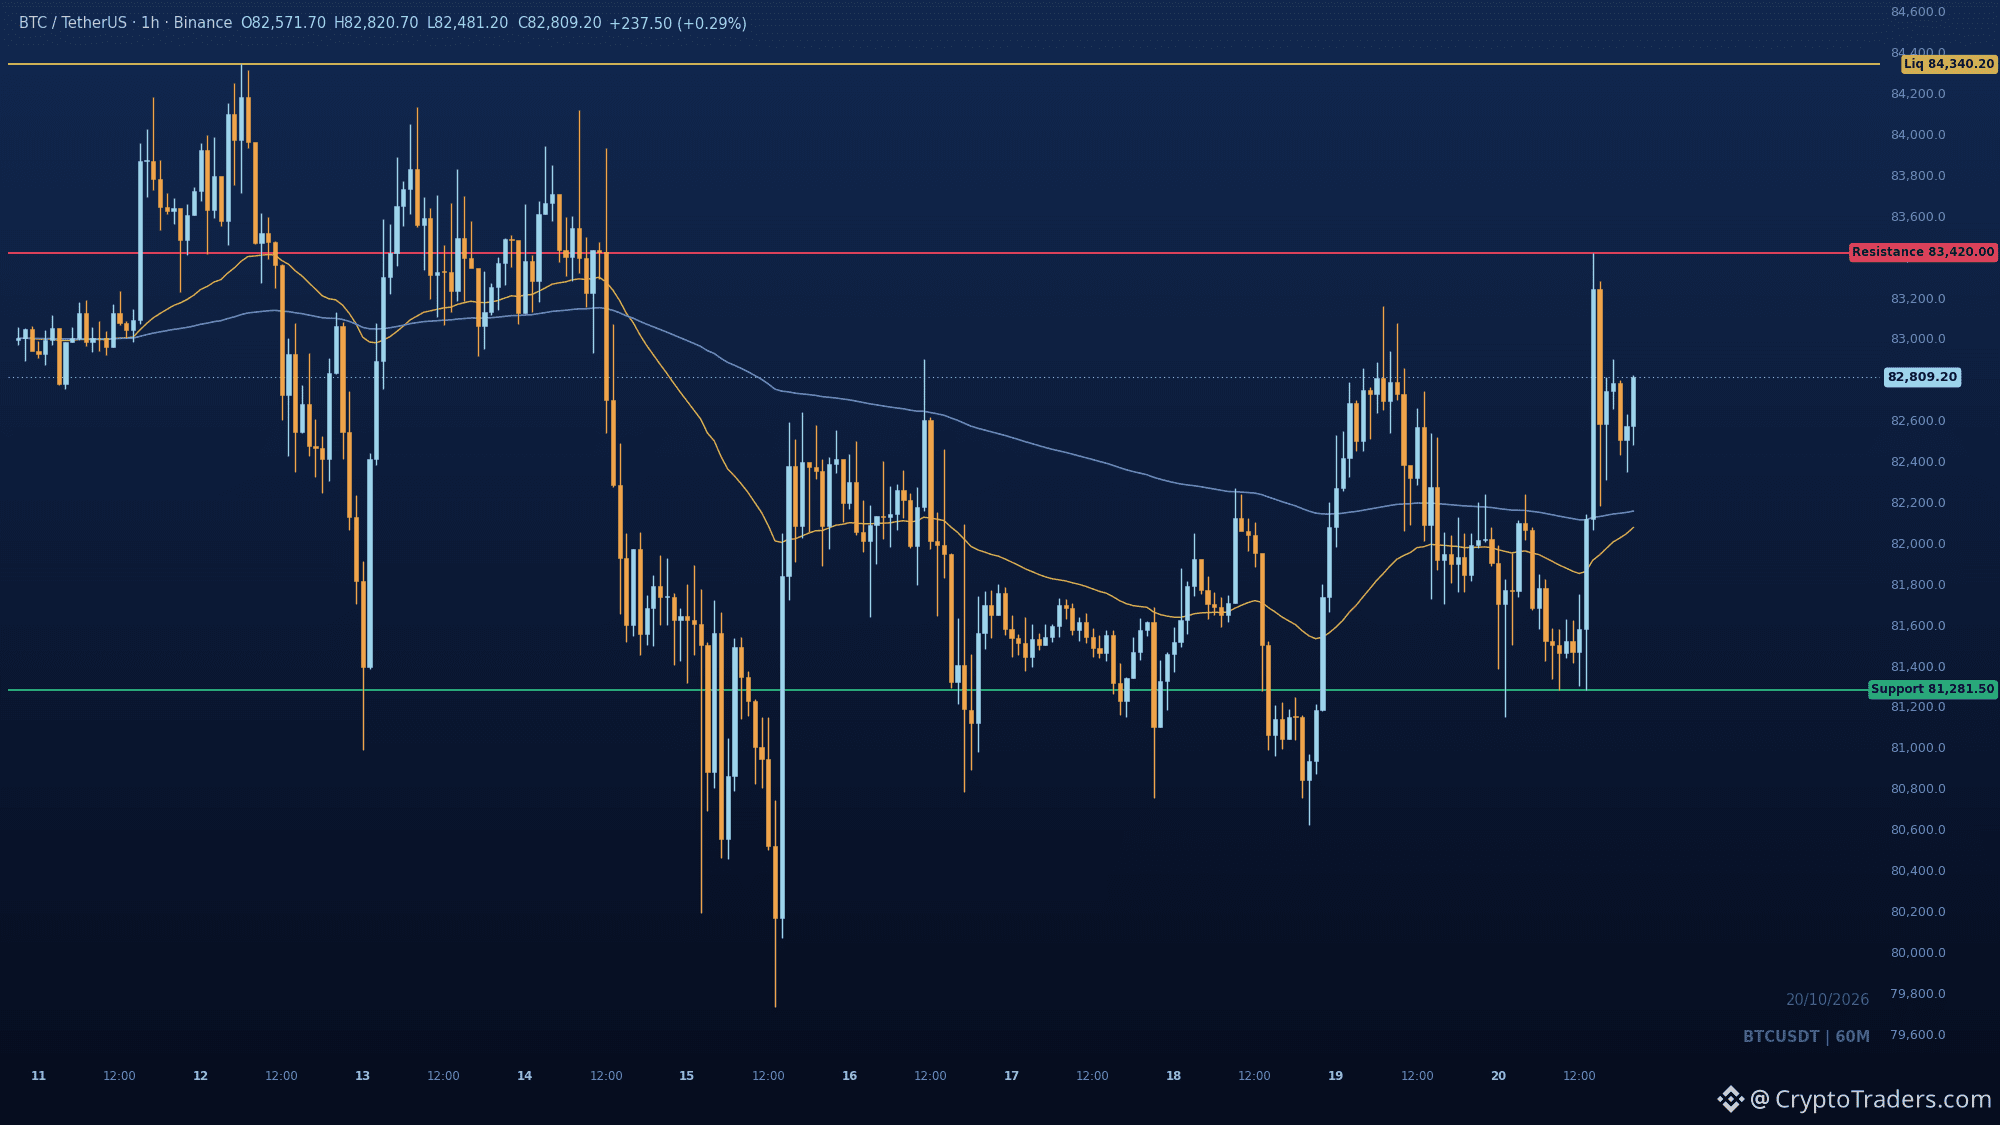
Strategy is quietly rotating capital away from $BTC buys and into its own preferred shares 📉 1⃣ Buyback over accumulation: Strategy spent 193.1 million repurchasing STRC preferred shares during October 12-18 while buying just 267 BTC for 22.1 million. Funding cost and liability management are now absorbing more capital than fresh accumulation. 2⃣ ETF flows split: U.S. spot Bitcoin ETFs pulled 526.7 million of net inflows on October 19, led by BlackRock's IBIT, yet cumulative flows from October 5-19 still sit at negative 380.6 million. One strong session does not reverse a two-week drain, and creations are not always fresh spot buying. 3⃣ Price holds anyway: BTC sits at 82,847, up 0.9 percent on the day, even as the largest corporate holder slows purchases and ETF flows stay net negative over the fortnight. The demand story is softer than the headline inflow suggests, and the price is not yet pricing that in. Which signal matters more here, the single-day ETF print or the two-week cumulative drain? More reads like this land daily in the community, and my bio shows the way in. #BTC Price Analysis# #Bitcoin Price Prediction: What is Bitcoins next move?# #Macro Insights#
Strategy is quietly rotating capital away from $BTC buys and into its own preferred shares 📉 1⃣ Buyback over accumulation: Strategy spent 193.1 million repurchasing STRC preferred shares during October 12-18 while buying just 267 BTC for 22.1 million. Funding cost and liability management are now absorbing more capital than fresh accumulation. 2⃣ ETF flows split: U.S. spot Bitcoin ETFs pulled 526.7 million of net inflows on October 19, led by BlackRock's IBIT, yet cumulative flows from October 5-19 still sit at negative 380.6 million. One strong session does not reverse a two-week drain, and creations are not always fresh spot buying. 3⃣ Price holds anyway: BTC sits at 82,847, up 0.9 percent on the day, even as the largest corporate holder slows purchases and ETF flows stay net negative over the fortnight. The demand story is softer than the headline inflow suggests, and the price is not yet pricing that in. Which signal matters more here, the single-day ETF print or the two-week cumulative drain? More reads like this land daily in the community, and my bio shows the way in. #BTC Price Analysis# #Bitcoin Price Prediction: What is Bitcoins next move?# #Macro Insights#
5
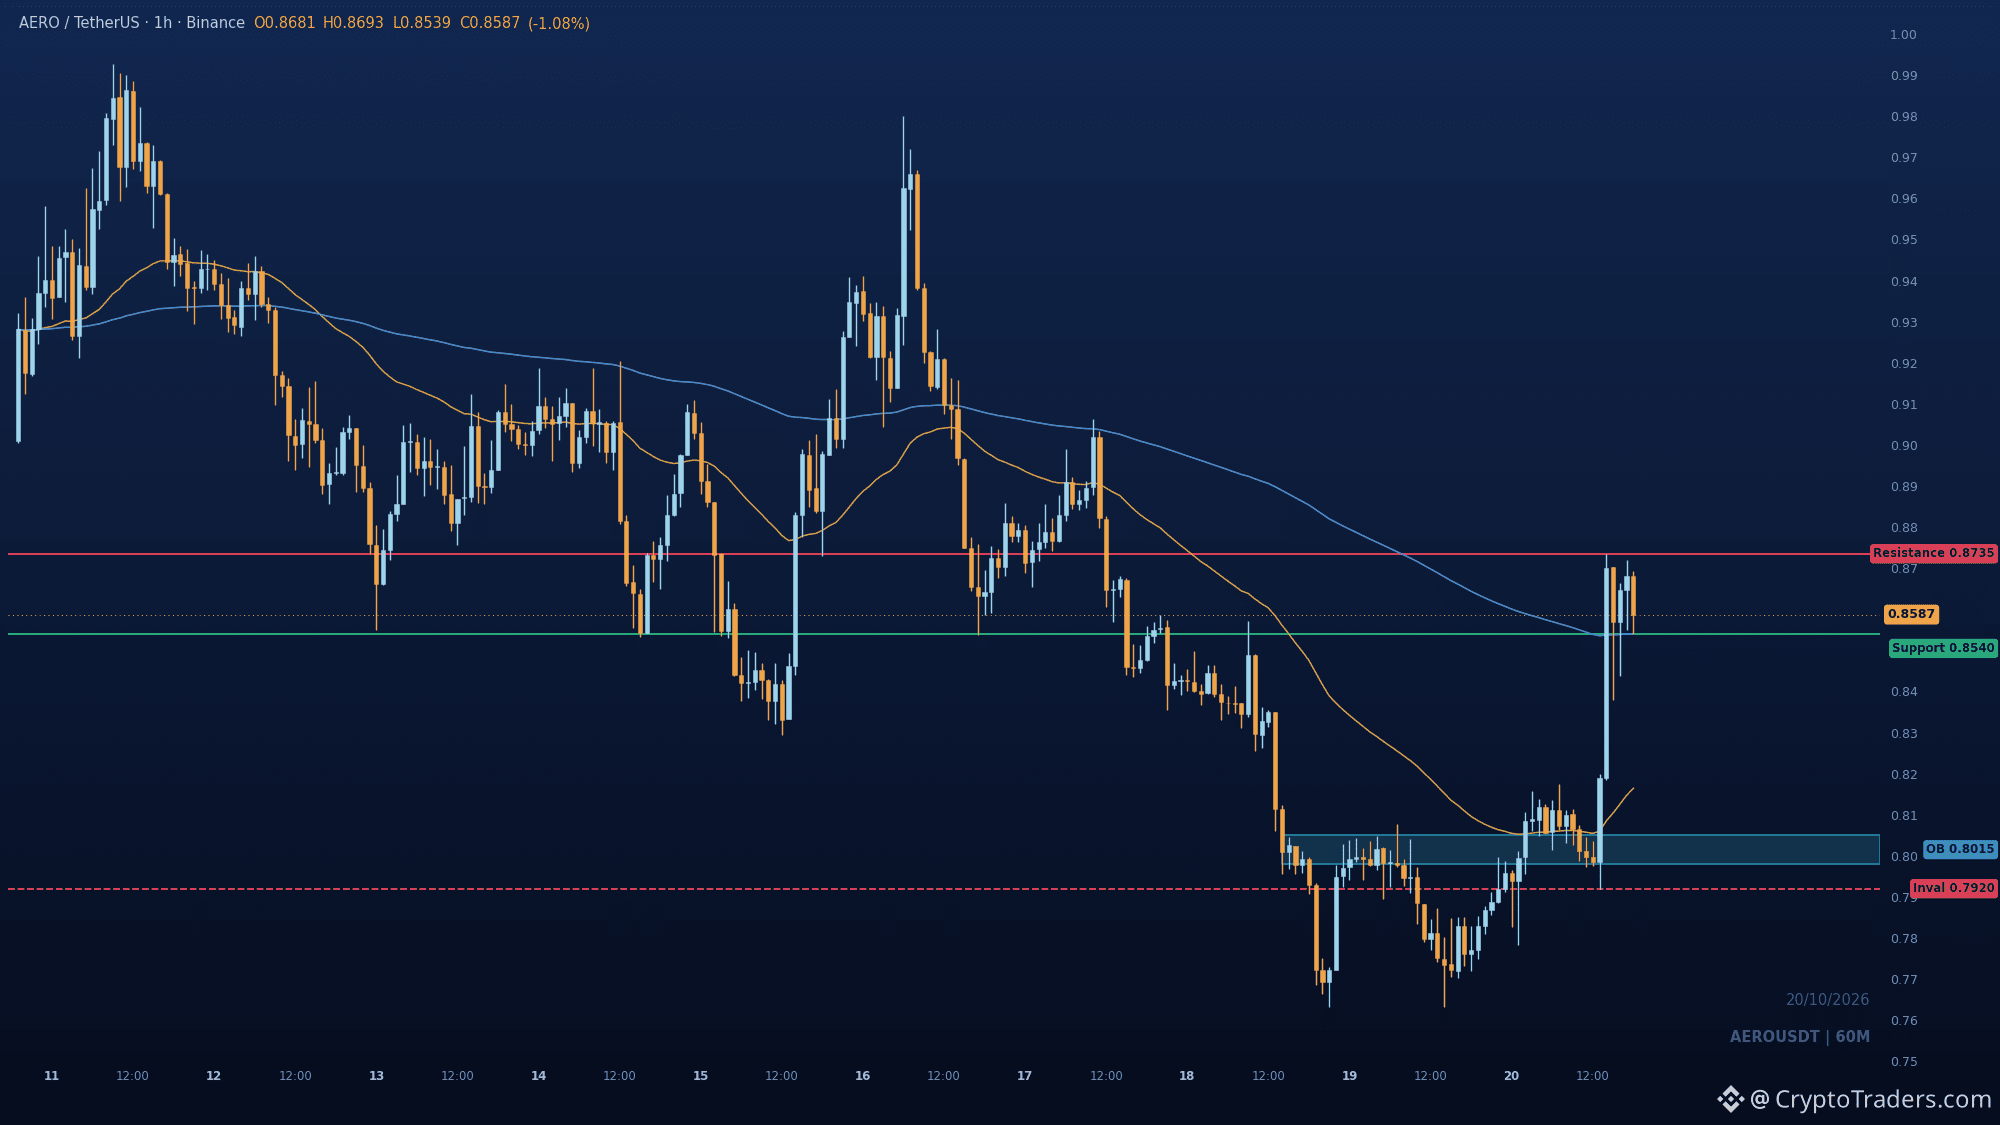
$AERO is caught between the 0.8735 swing high and the 0.854 slow EMA, and the market has to choose which one gives first. That 0.8735 level already rejected price once this window, so a second test is the real tell. After the sweep at 0.7633, buyers rallied back above the fast EMA and stalled just under that high. A pullback into 0.854 to 0.816 that holds would set up the retest; losing 0.792 breaks the bullish CHoCH. Which side of 0.8735 do you think gives first? More reads like this land daily in the group, details in my bio. #Altcoin Season#
$AERO is caught between the 0.8735 swing high and the 0.854 slow EMA, and the market has to choose which one gives first. That 0.8735 level already rejected price once this window, so a second test is the real tell. After the sweep at 0.7633, buyers rallied back above the fast EMA and stalled just under that high. A pullback into 0.854 to 0.816 that holds would set up the retest; losing 0.792 breaks the bullish CHoCH. Which side of 0.8735 do you think gives first? More reads like this land daily in the group, details in my bio. #Altcoin Season#
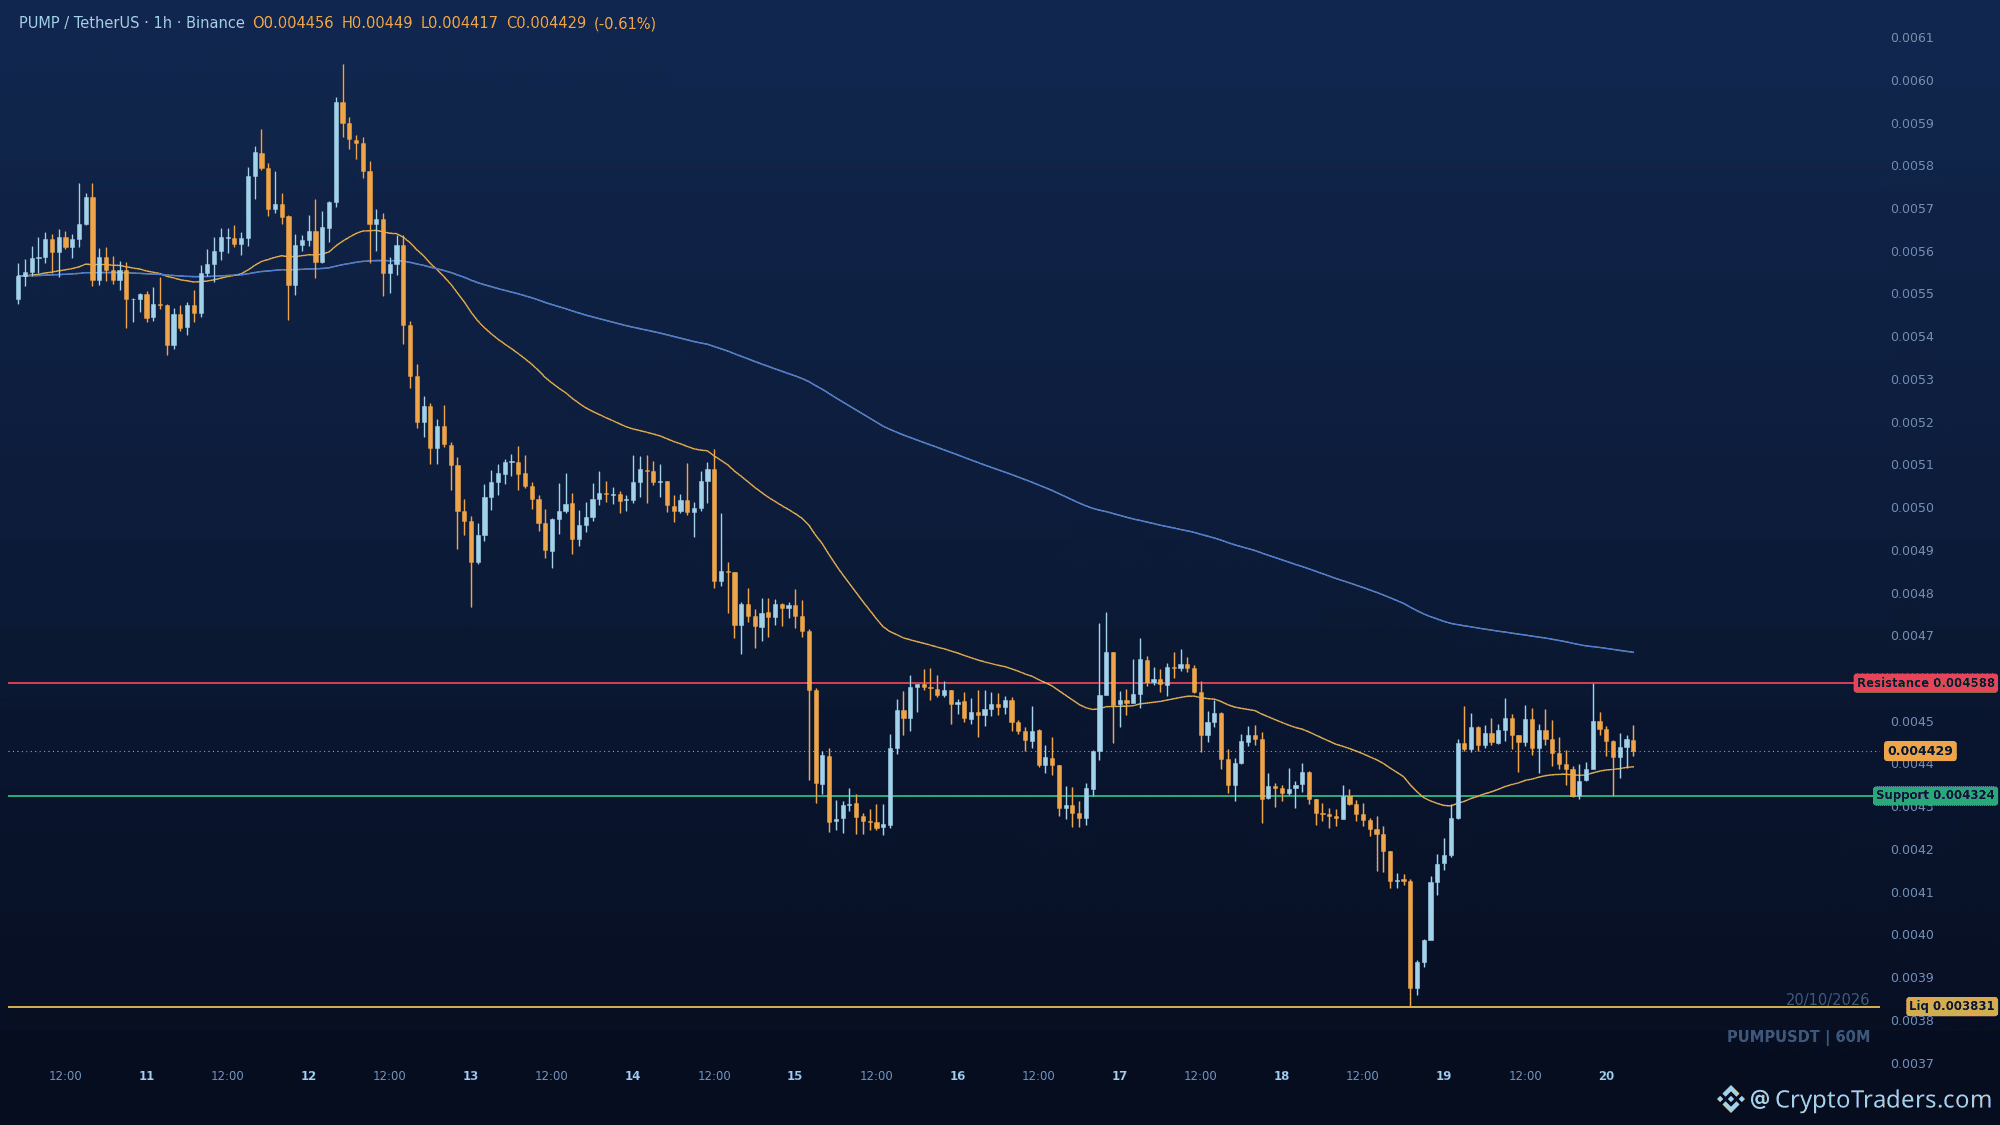
$PUMP swept its range low and bounced, yet the high from just a few hours ago still stands untouched, which is the anomaly here. The 1h chart keeps printing lower highs, price sits below the 200 EMA, and this rebound stalled well short of 0.004588. That 0.004588 swing high is the line. Reclaim it and the lower-high sequence finally breaks; get rejected there and sellers likely aim back at 0.004324. Lose 0.004324 and the swept low at 0.003831 comes back into play as the next sell-side pool. How long do you give this bounce before it fades? More setups like this land daily in the group, bio has the way in. #Altcoin Season#
$PUMP swept its range low and bounced, yet the high from just a few hours ago still stands untouched, which is the anomaly here. The 1h chart keeps printing lower highs, price sits below the 200 EMA, and this rebound stalled well short of 0.004588. That 0.004588 swing high is the line. Reclaim it and the lower-high sequence finally breaks; get rejected there and sellers likely aim back at 0.004324. Lose 0.004324 and the swept low at 0.003831 comes back into play as the next sell-side pool. How long do you give this bounce before it fades? More setups like this land daily in the group, bio has the way in. #Altcoin Season#
29
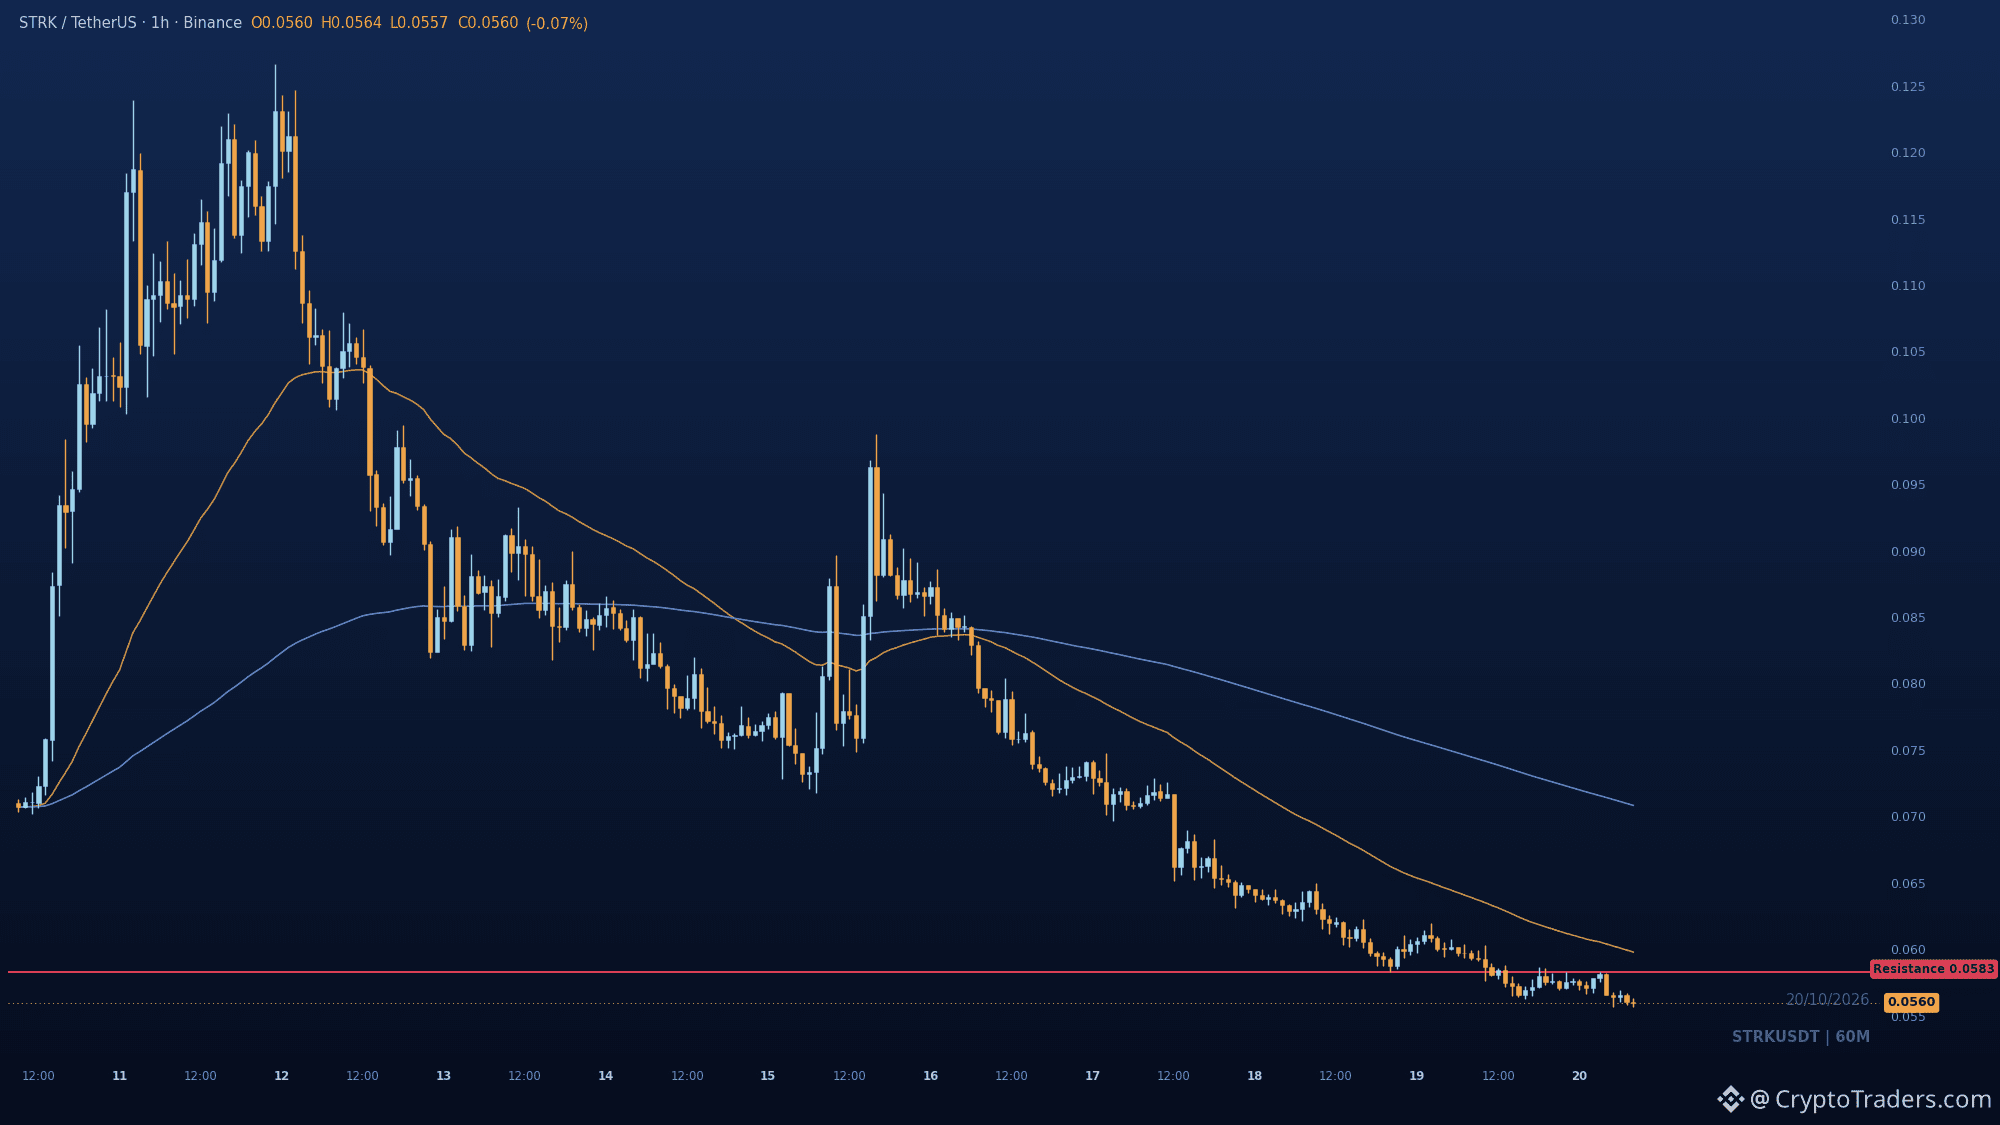
$STRK sits at a standoff between the 0.05568 window low and the 0.0583 swing high, and the market has to pick a side. Every bounce this session has stalled under both EMAs, printing another lower high. Losing 0.05568 puts price in discovery with no shelf beneath it, which is where holders feel the most pain. Reclaiming 0.0583 is the only thing that voids the bearish read. Anyone still long here, what is your line in the sand? We break down setups like this with the community each morning, details in the profile. #Altcoin Season#
$STRK sits at a standoff between the 0.05568 window low and the 0.0583 swing high, and the market has to pick a side. Every bounce this session has stalled under both EMAs, printing another lower high. Losing 0.05568 puts price in discovery with no shelf beneath it, which is where holders feel the most pain. Reclaiming 0.0583 is the only thing that voids the bearish read. Anyone still long here, what is your line in the sand? We break down setups like this with the community each morning, details in the profile. #Altcoin Season#
25
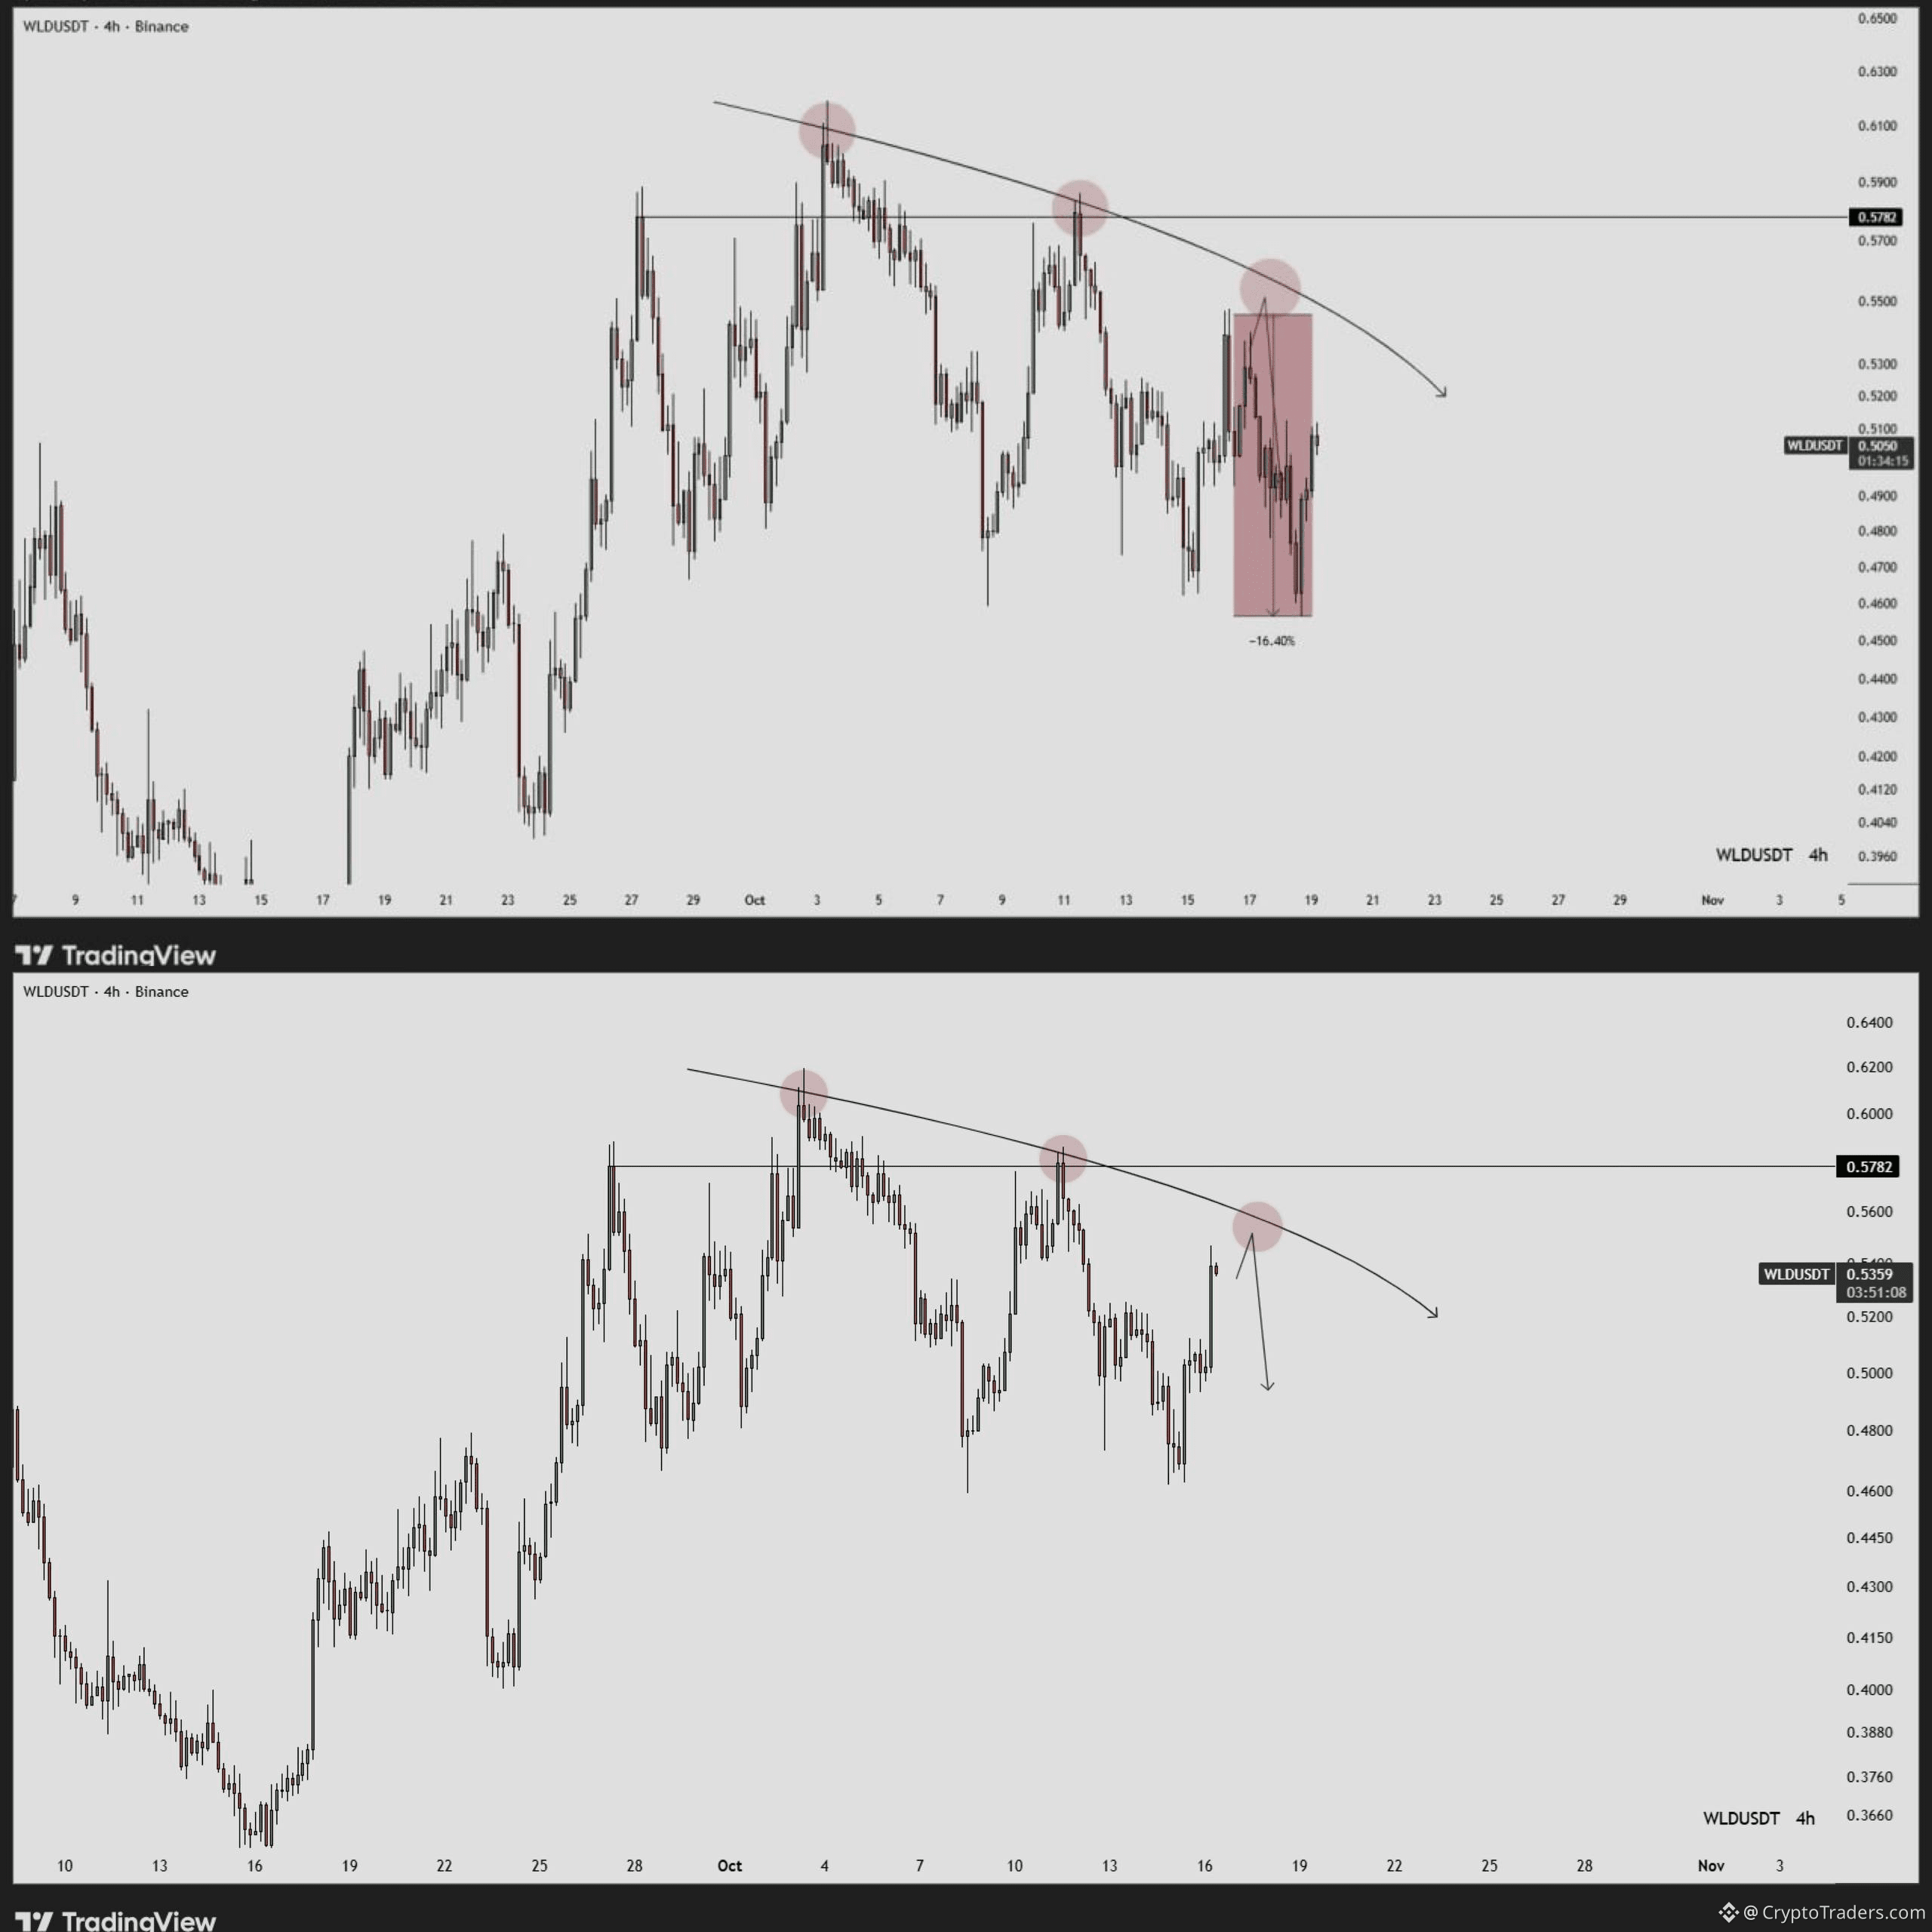
$WLD either clears the descending trendline and the 0.5782 shelf, or it rolls over from here the way the chart projected and the 16.4% dump plays out again. The 4H still sits under that trendline, so sellers hold the higher ground until price closes above it. 0.5782 is the line in the sand: a clean reclaim flips the structure, a rejection there keeps the lower path open. Until then the +9.5% bounce is a retest inside a bearish frame, not a trend change. Invalidation for the bearish read is a decisive close above 0.5782. Do you think this bounce has legs past 0.5782, or is it another rejection setup? More charts like this land daily in the group, bio has the way in. #Altcoin Season#
$WLD either clears the descending trendline and the 0.5782 shelf, or it rolls over from here the way the chart projected and the 16.4% dump plays out again. The 4H still sits under that trendline, so sellers hold the higher ground until price closes above it. 0.5782 is the line in the sand: a clean reclaim flips the structure, a rejection there keeps the lower path open. Until then the +9.5% bounce is a retest inside a bearish frame, not a trend change. Invalidation for the bearish read is a decisive close above 0.5782. Do you think this bounce has legs past 0.5782, or is it another rejection setup? More charts like this land daily in the group, bio has the way in. #Altcoin Season#
41
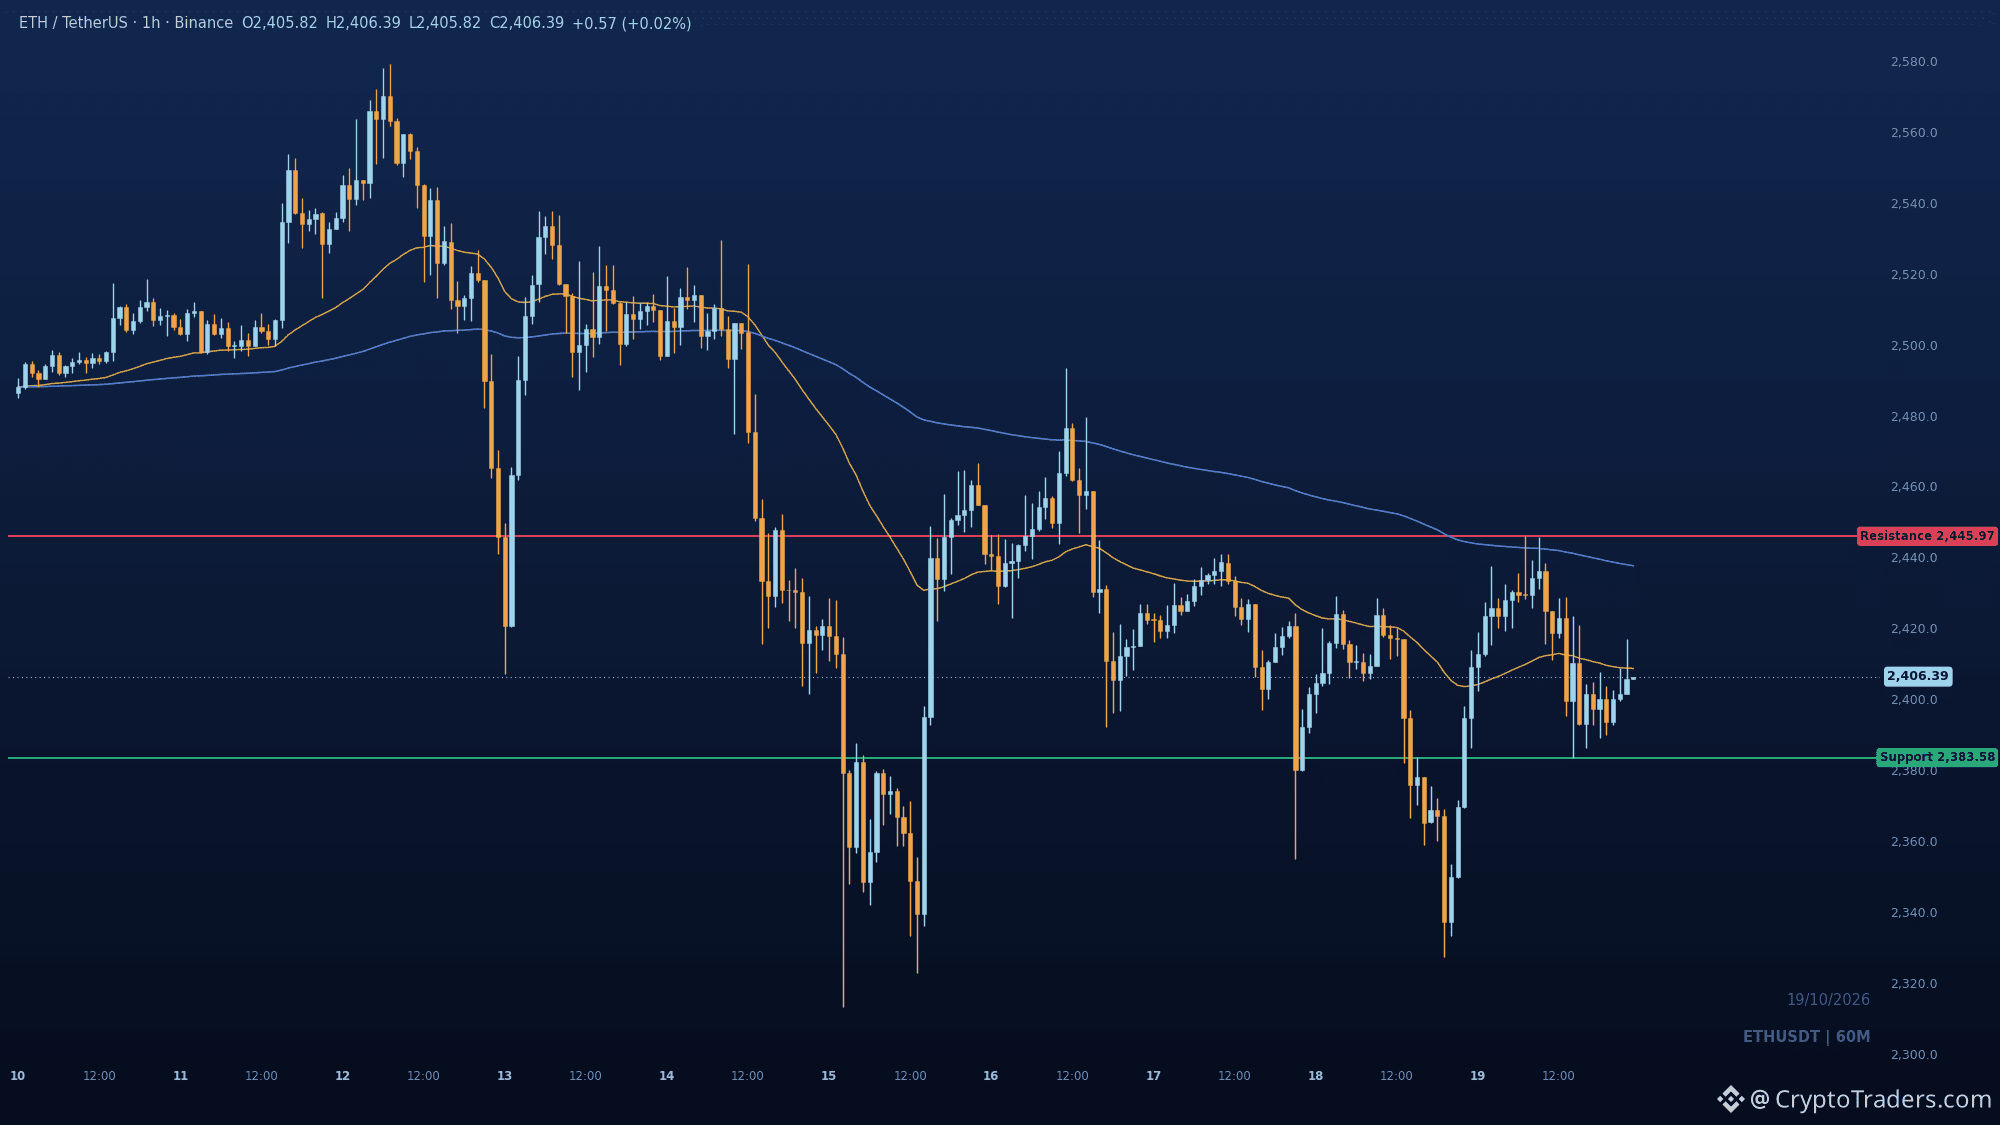
$ETH is pinned between the 2408.70 fast EMA it just tagged and the 2383.58 swing low buyers keep defending, and that standoff resolves soon. The bounce off 2383.58 was real but price still trades under both EMAs and in discount. Sellers have a clean spot to work with at 2408.70; a rejection there sends it back at the swing low. Reclaiming 2445.97 is what flips this from a dead-cat bounce into something with legs. Where do you think ETH closes the day, above 2445 or back under 2383? More chart reads like this land daily in the group, bio has the way in. #Altcoin Season#
$ETH is pinned between the 2408.70 fast EMA it just tagged and the 2383.58 swing low buyers keep defending, and that standoff resolves soon. The bounce off 2383.58 was real but price still trades under both EMAs and in discount. Sellers have a clean spot to work with at 2408.70; a rejection there sends it back at the swing low. Reclaiming 2445.97 is what flips this from a dead-cat bounce into something with legs. Where do you think ETH closes the day, above 2445 or back under 2383? More chart reads like this land daily in the group, bio has the way in. #Altcoin Season#
64
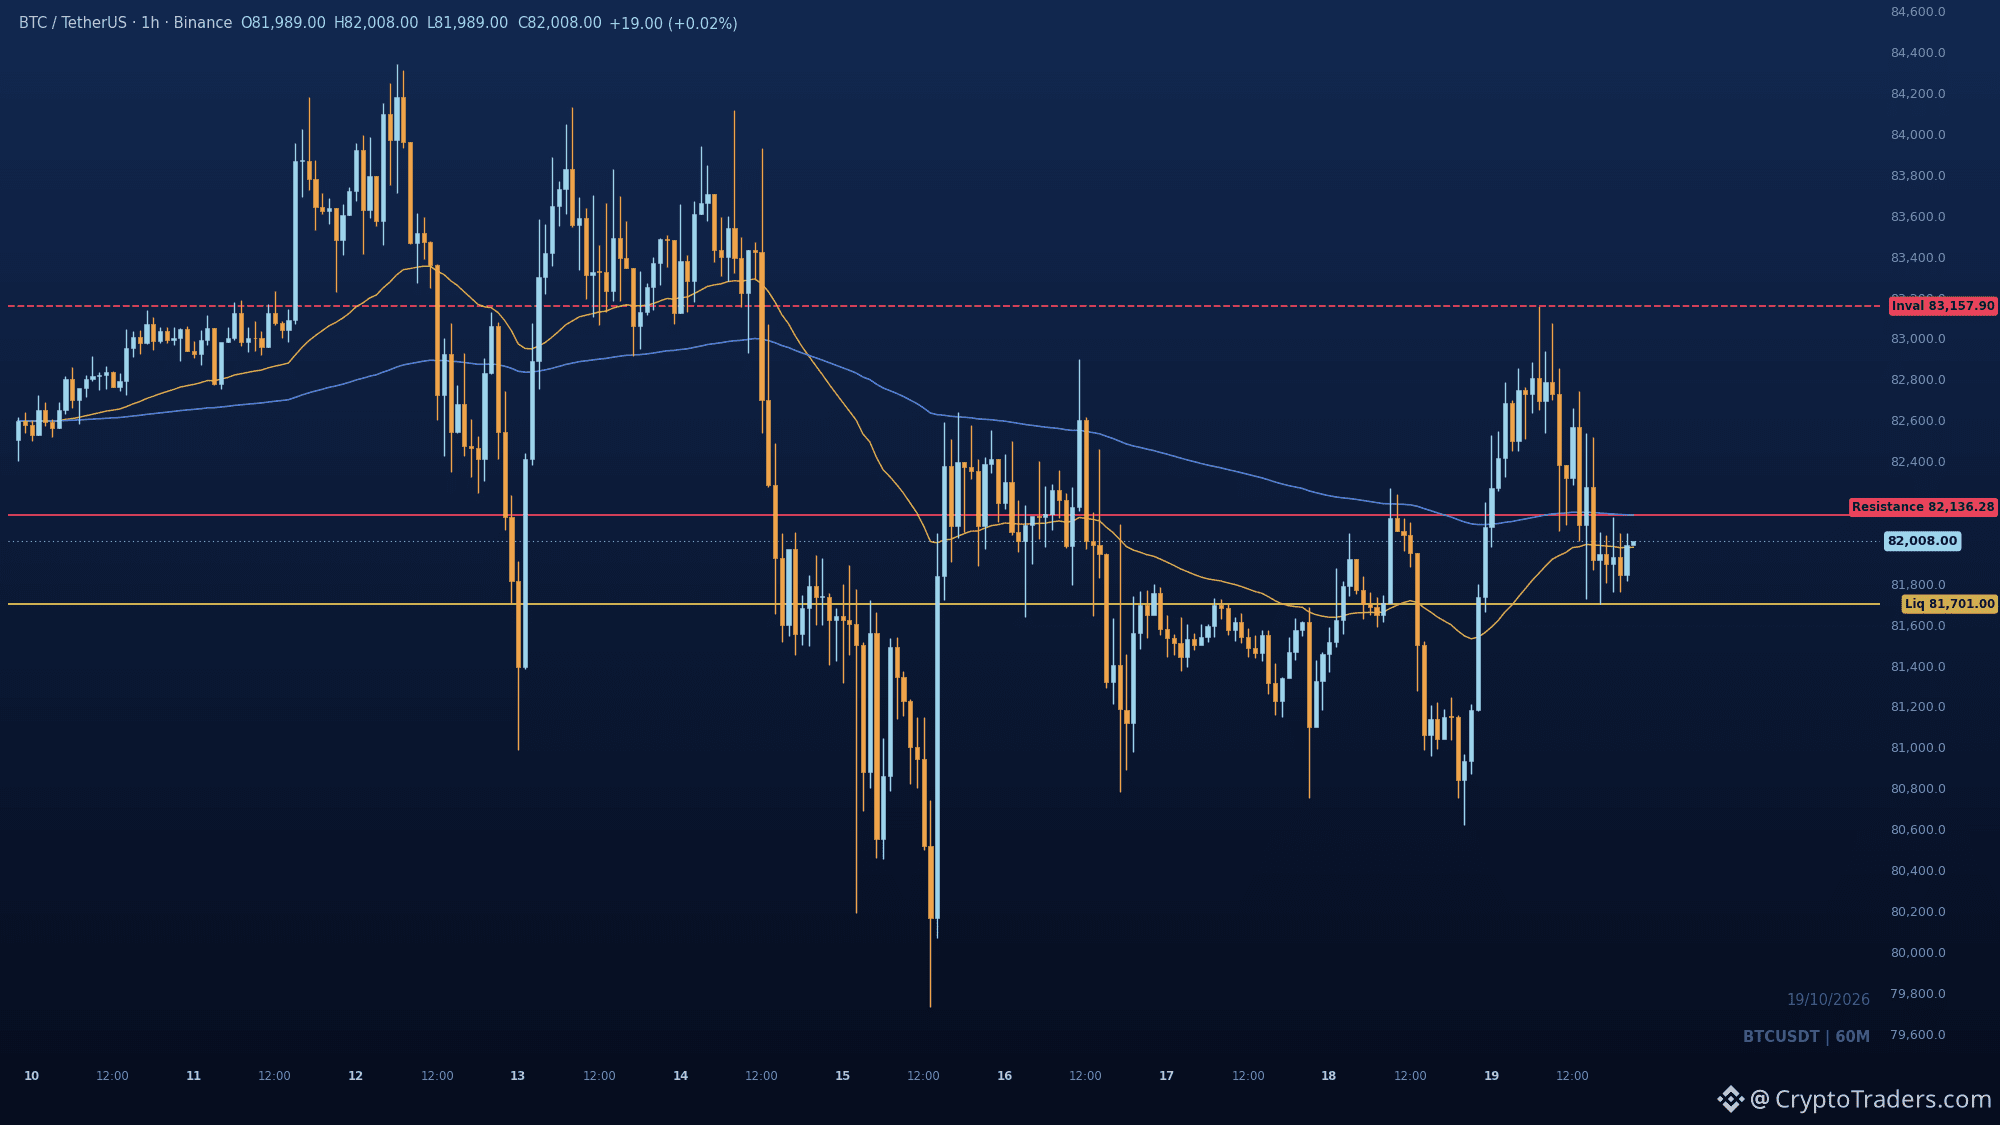
Bitcoin ETFs lost 614.7 million while $BTC still added 1.4 percent, and that gap tells the real story 📊 1⃣ **Flows favor BTC over ETH** US spot Ether ETFs bled 924.5 million from October 1 to 16, more than wiping out their 825.3 million September intake, with redemptions in 11 of 12 sessions. Bitcoin funds shed 614.7 million yet kept most of September's 2.65 billion, so institutional demand is cooling unevenly and BTC is holding the stronger hand. 2⃣ **Custody risk moves to hardware** A Ledger Nano X bought from a German retailer was reportedly found with an implant that can read and transmit recovery words during setup, and the genuine-device check may not catch it. That is a supply-chain problem for self-custody confidence, not a price story yet. 3⃣ **Liquidity gaps hide in staking pools** Papertrade paid out 2.12 million to stakers, but house funds after open profits sat at 4.22 million against a 4.91 million LP balance. No shortfall is reported, though payouts could queue if winning traders pull more USDC than is on hand. Price resilience is real, but the flow split and custody headlines say conviction is narrower than the green candle suggests. Which matters more for the next leg, ETF flows or self-custody trust? A fuller chart set like this lands in the group every day, and my bio shows the way. #BTC Price Analysis# #Bitcoin Price Prediction: What is Bitcoins next move?# #Macro Insights#
Bitcoin ETFs lost 614.7 million while $BTC still added 1.4 percent, and that gap tells the real story 📊 1⃣ **Flows favor BTC over ETH** US spot Ether ETFs bled 924.5 million from October 1 to 16, more than wiping out their 825.3 million September intake, with redemptions in 11 of 12 sessions. Bitcoin funds shed 614.7 million yet kept most of September's 2.65 billion, so institutional demand is cooling unevenly and BTC is holding the stronger hand. 2⃣ **Custody risk moves to hardware** A Ledger Nano X bought from a German retailer was reportedly found with an implant that can read and transmit recovery words during setup, and the genuine-device check may not catch it. That is a supply-chain problem for self-custody confidence, not a price story yet. 3⃣ **Liquidity gaps hide in staking pools** Papertrade paid out 2.12 million to stakers, but house funds after open profits sat at 4.22 million against a 4.91 million LP balance. No shortfall is reported, though payouts could queue if winning traders pull more USDC than is on hand. Price resilience is real, but the flow split and custody headlines say conviction is narrower than the green candle suggests. Which matters more for the next leg, ETF flows or self-custody trust? A fuller chart set like this lands in the group every day, and my bio shows the way. #BTC Price Analysis# #Bitcoin Price Prediction: What is Bitcoins next move?# #Macro Insights#
74
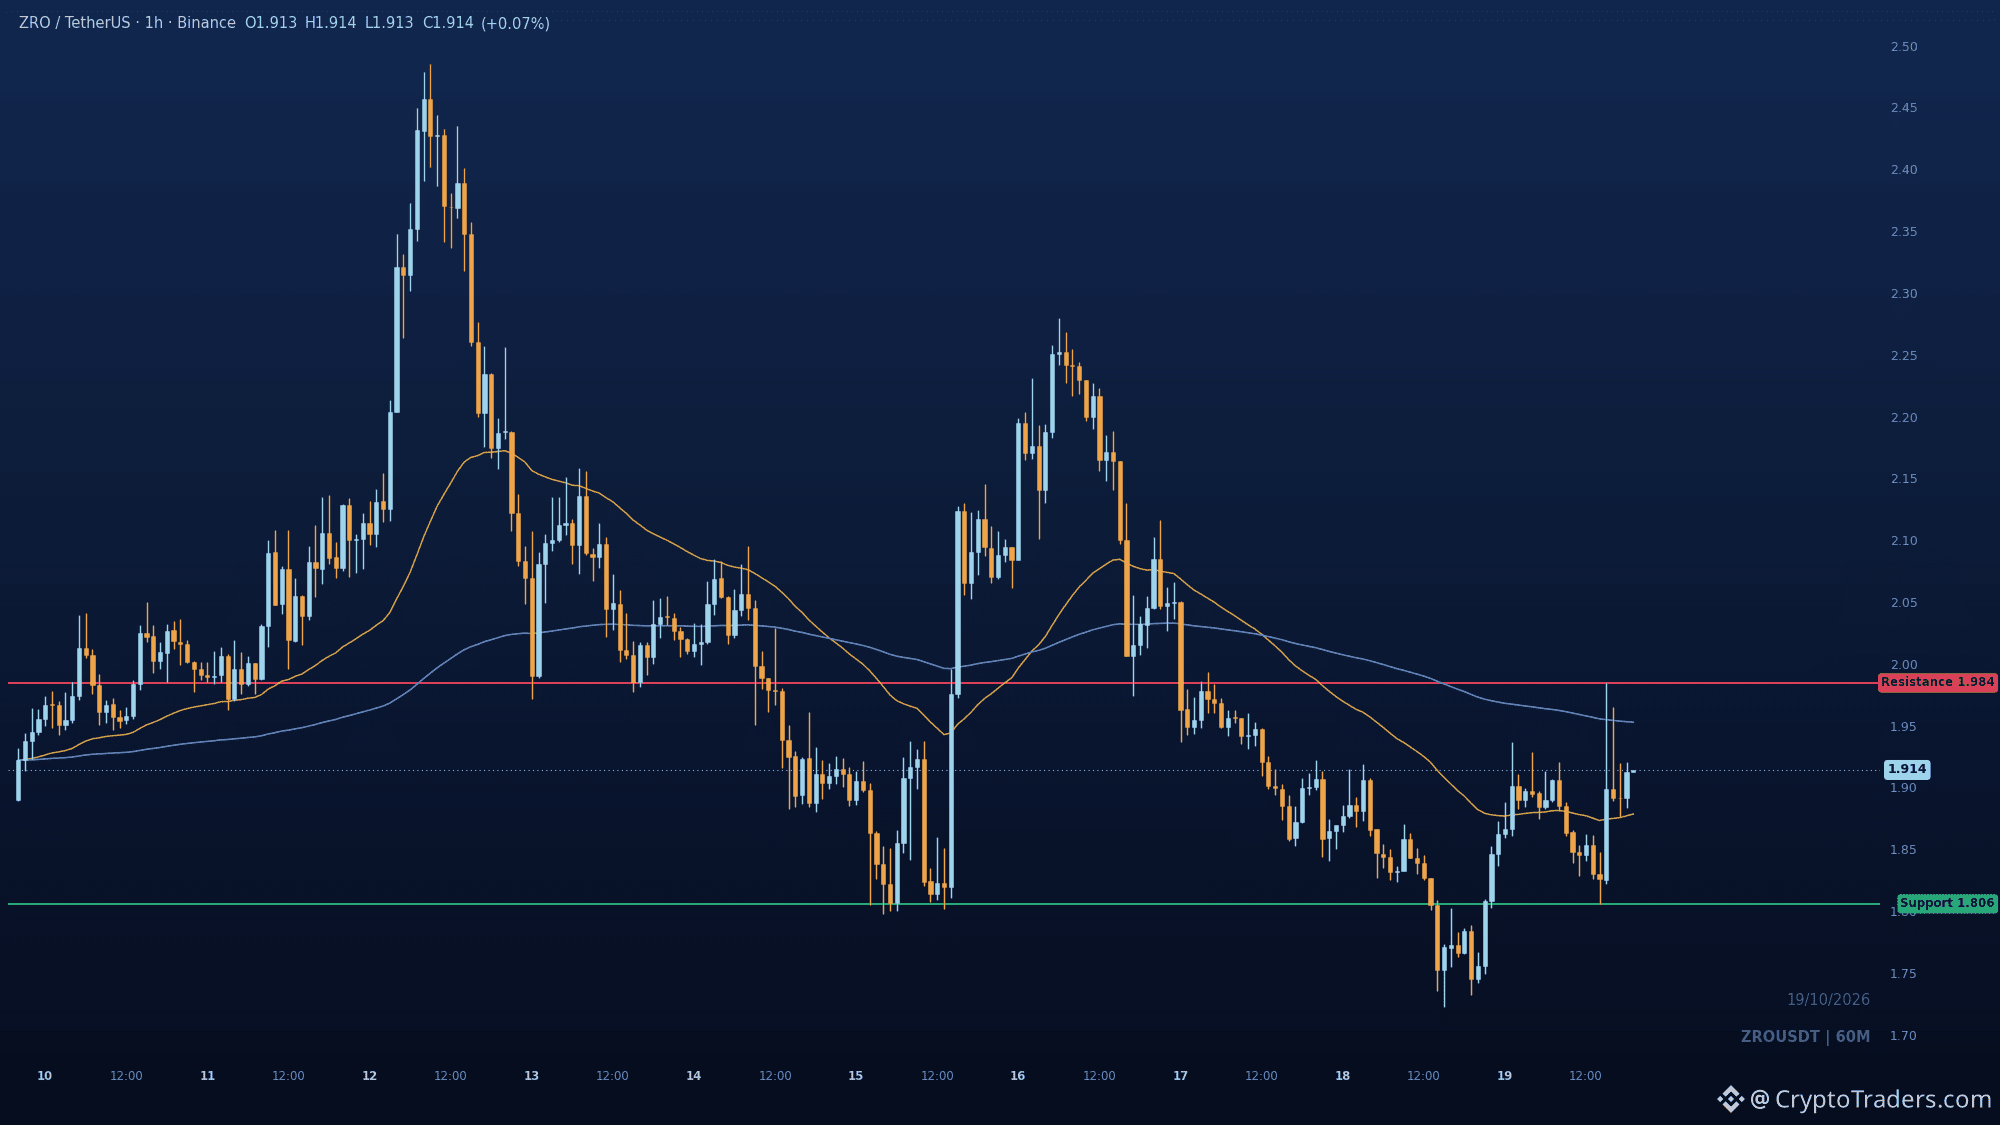
$ZRO swept lows at 1.74, reclaimed short-term structure, and is now up 7.2% on the day, but the rebound is pressed right into overhead supply. The 1h shows a bullish CHoCH off the discount, with the broader trend still bearish and price in the lower half of the range. Key support sits at 1.8058, the recent swing low. Holding above it keeps the bounce alive. Upside target is 1.9845, the recent swing high where buy-side liquidity rests. Rejection there favors renewed downside. Which comes first for you, a push into 1.9845 or a slide back under 1.8058? More reads like this land daily in the group, link in bio. #Altcoin Season#
$ZRO swept lows at 1.74, reclaimed short-term structure, and is now up 7.2% on the day, but the rebound is pressed right into overhead supply. The 1h shows a bullish CHoCH off the discount, with the broader trend still bearish and price in the lower half of the range. Key support sits at 1.8058, the recent swing low. Holding above it keeps the bounce alive. Upside target is 1.9845, the recent swing high where buy-side liquidity rests. Rejection there favors renewed downside. Which comes first for you, a push into 1.9845 or a slide back under 1.8058? More reads like this land daily in the group, link in bio. #Altcoin Season#
29
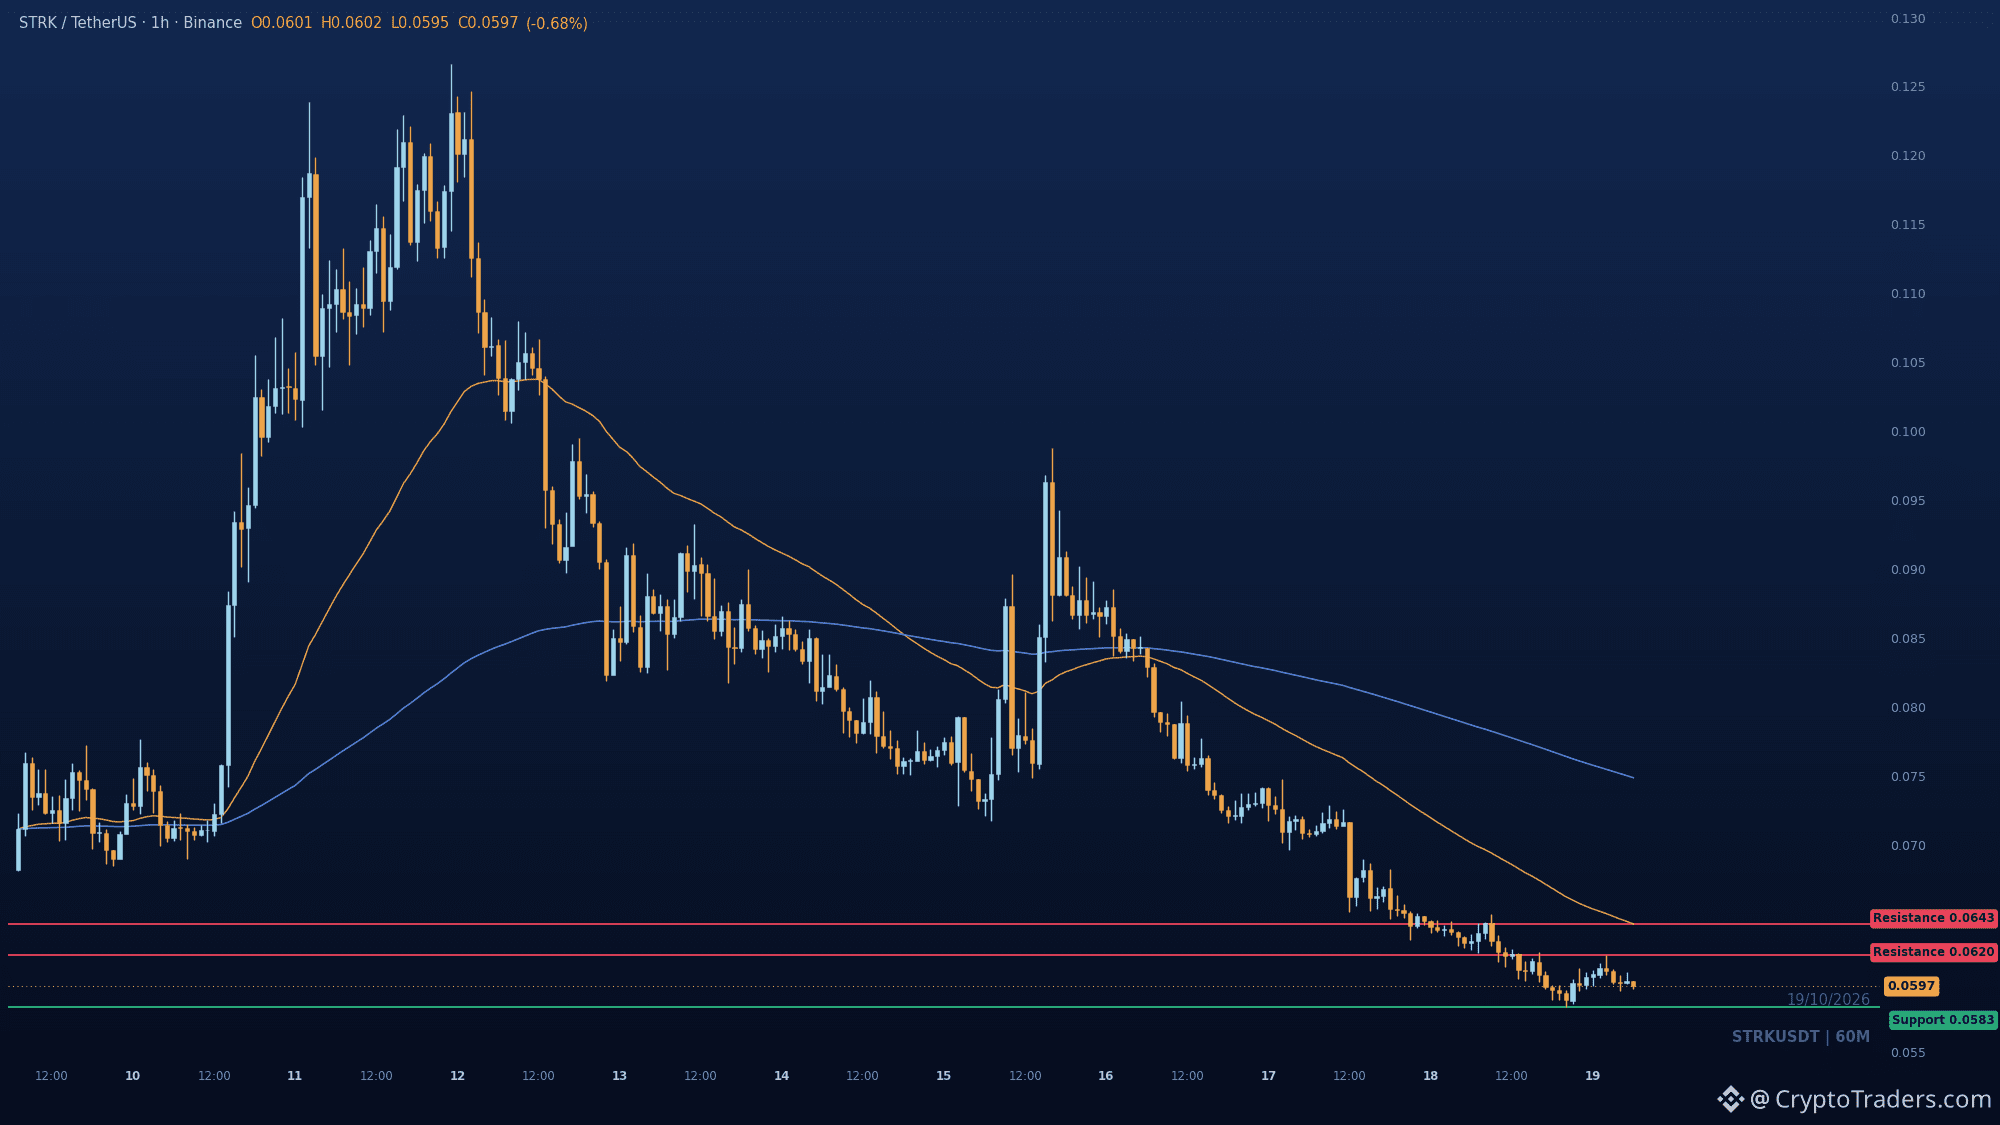
$STRK broke down to 0.05827 and is sitting right on it, down 5.3% on the day. The 1h structure keeps printing lower lows, and price is still pinned under both EMAs, so the range is trading in discount. A bounce here likely runs into 0.06199 first, with 0.06426671 as the real line in the sand. If 0.05827 fails on the next hourly close, there is little underneath to catch it. How long do you give the 0.05827 shelf before it cracks? More reads like this land daily in the group, bio has the way in. #Altcoin Season#
$STRK broke down to 0.05827 and is sitting right on it, down 5.3% on the day. The 1h structure keeps printing lower lows, and price is still pinned under both EMAs, so the range is trading in discount. A bounce here likely runs into 0.06199 first, with 0.06426671 as the real line in the sand. If 0.05827 fails on the next hourly close, there is little underneath to catch it. How long do you give the 0.05827 shelf before it cracks? More reads like this land daily in the group, bio has the way in. #Altcoin Season#
43
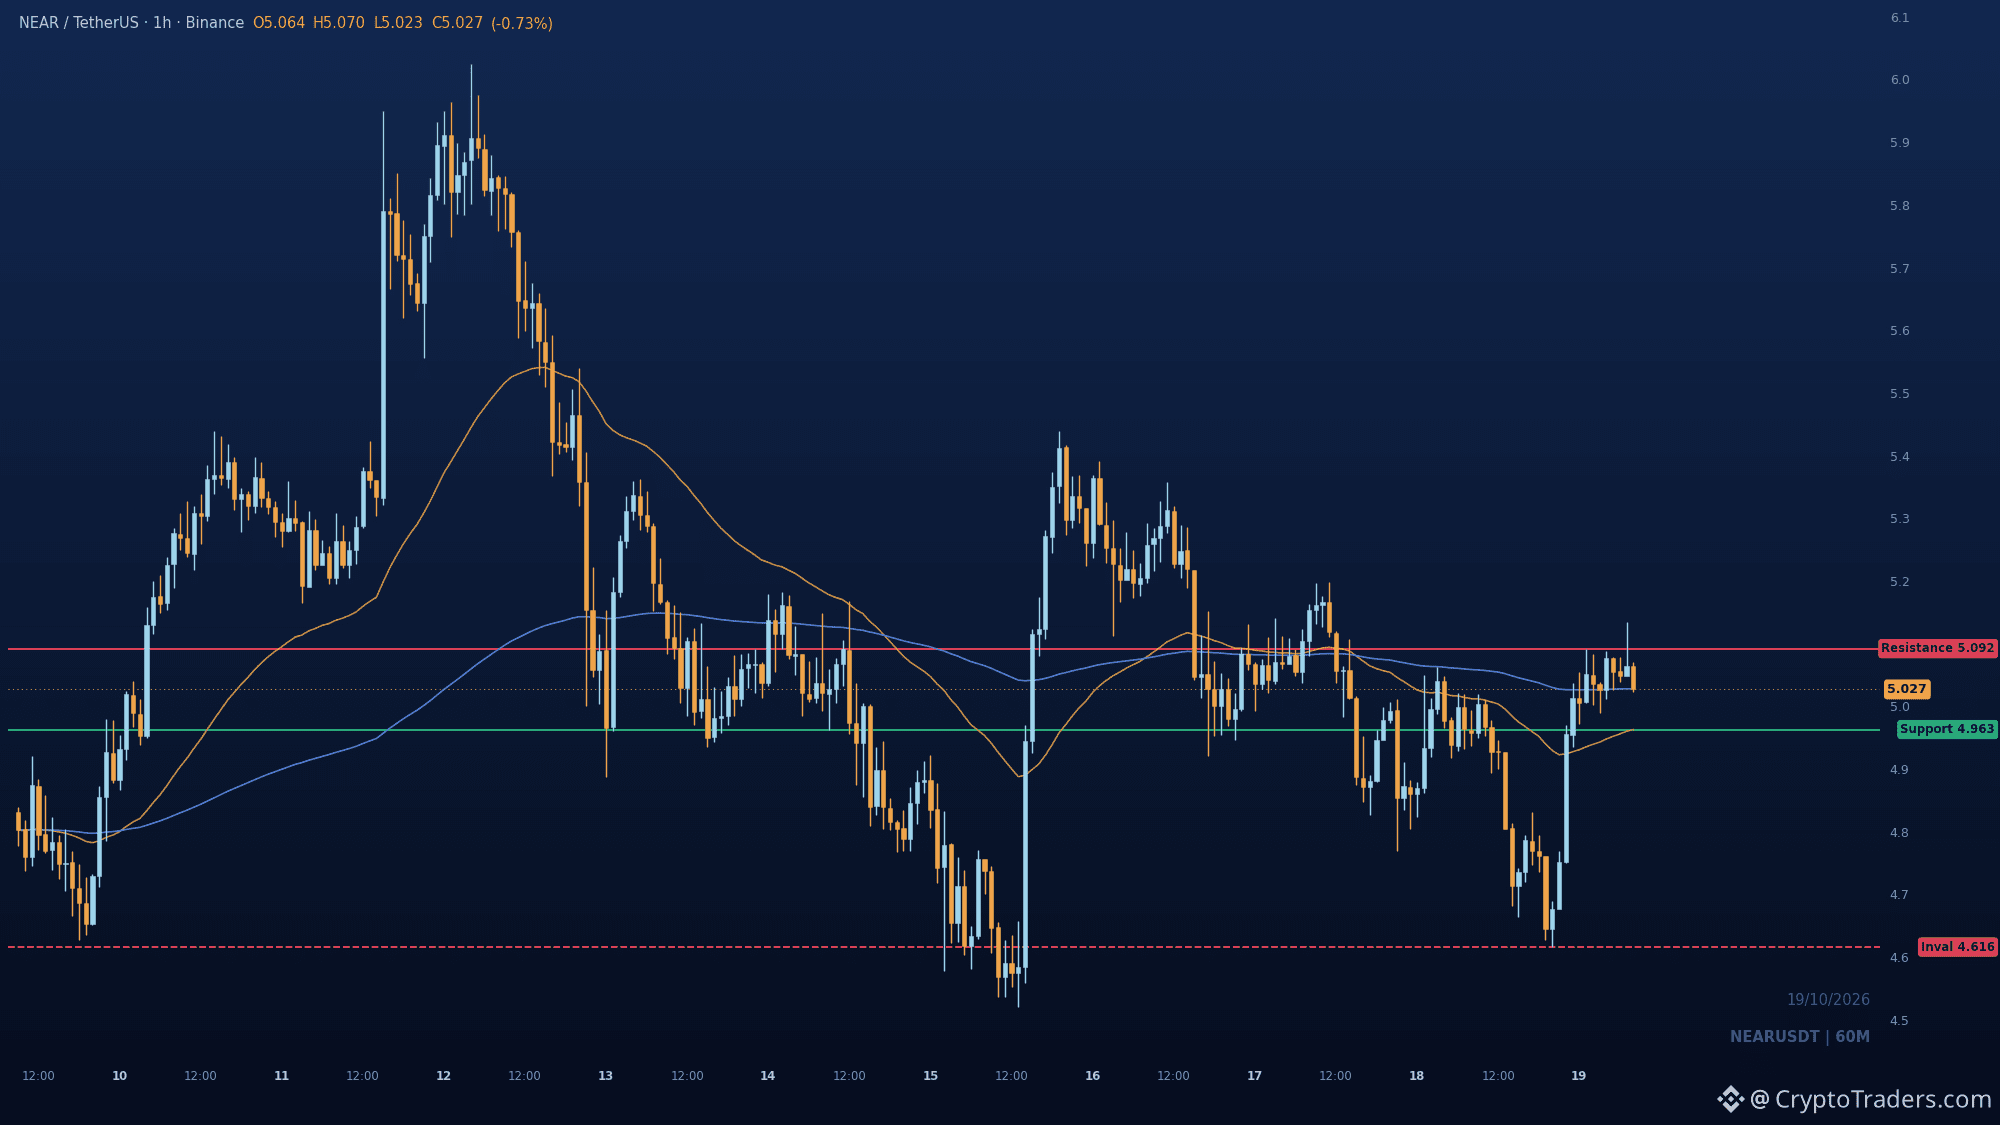
5.092. That is the number $NEAR has to clear, and it has been knocking on it for the past few hours. The 1h chart shows a sell-side sweep into 4.616, then a sharp reclaim of the fast EMA at 4.963. Price is consolidating in discount right under the 5.092 swing high, where the buy-side liquidity sits. Hold 4.963 and the retest of 5.092 looks like the next few candles. Lose it, and 4.616 comes back into view. How long do you give this consolidation before it picks a direction? Fresh reads like this land in the community every morning, so swing by the profile for more. #Altcoin Season#
5.092. That is the number $NEAR has to clear, and it has been knocking on it for the past few hours. The 1h chart shows a sell-side sweep into 4.616, then a sharp reclaim of the fast EMA at 4.963. Price is consolidating in discount right under the 5.092 swing high, where the buy-side liquidity sits. Hold 4.963 and the retest of 5.092 looks like the next few candles. Lose it, and 4.616 comes back into view. How long do you give this consolidation before it picks a direction? Fresh reads like this land in the community every morning, so swing by the profile for more. #Altcoin Season#
50
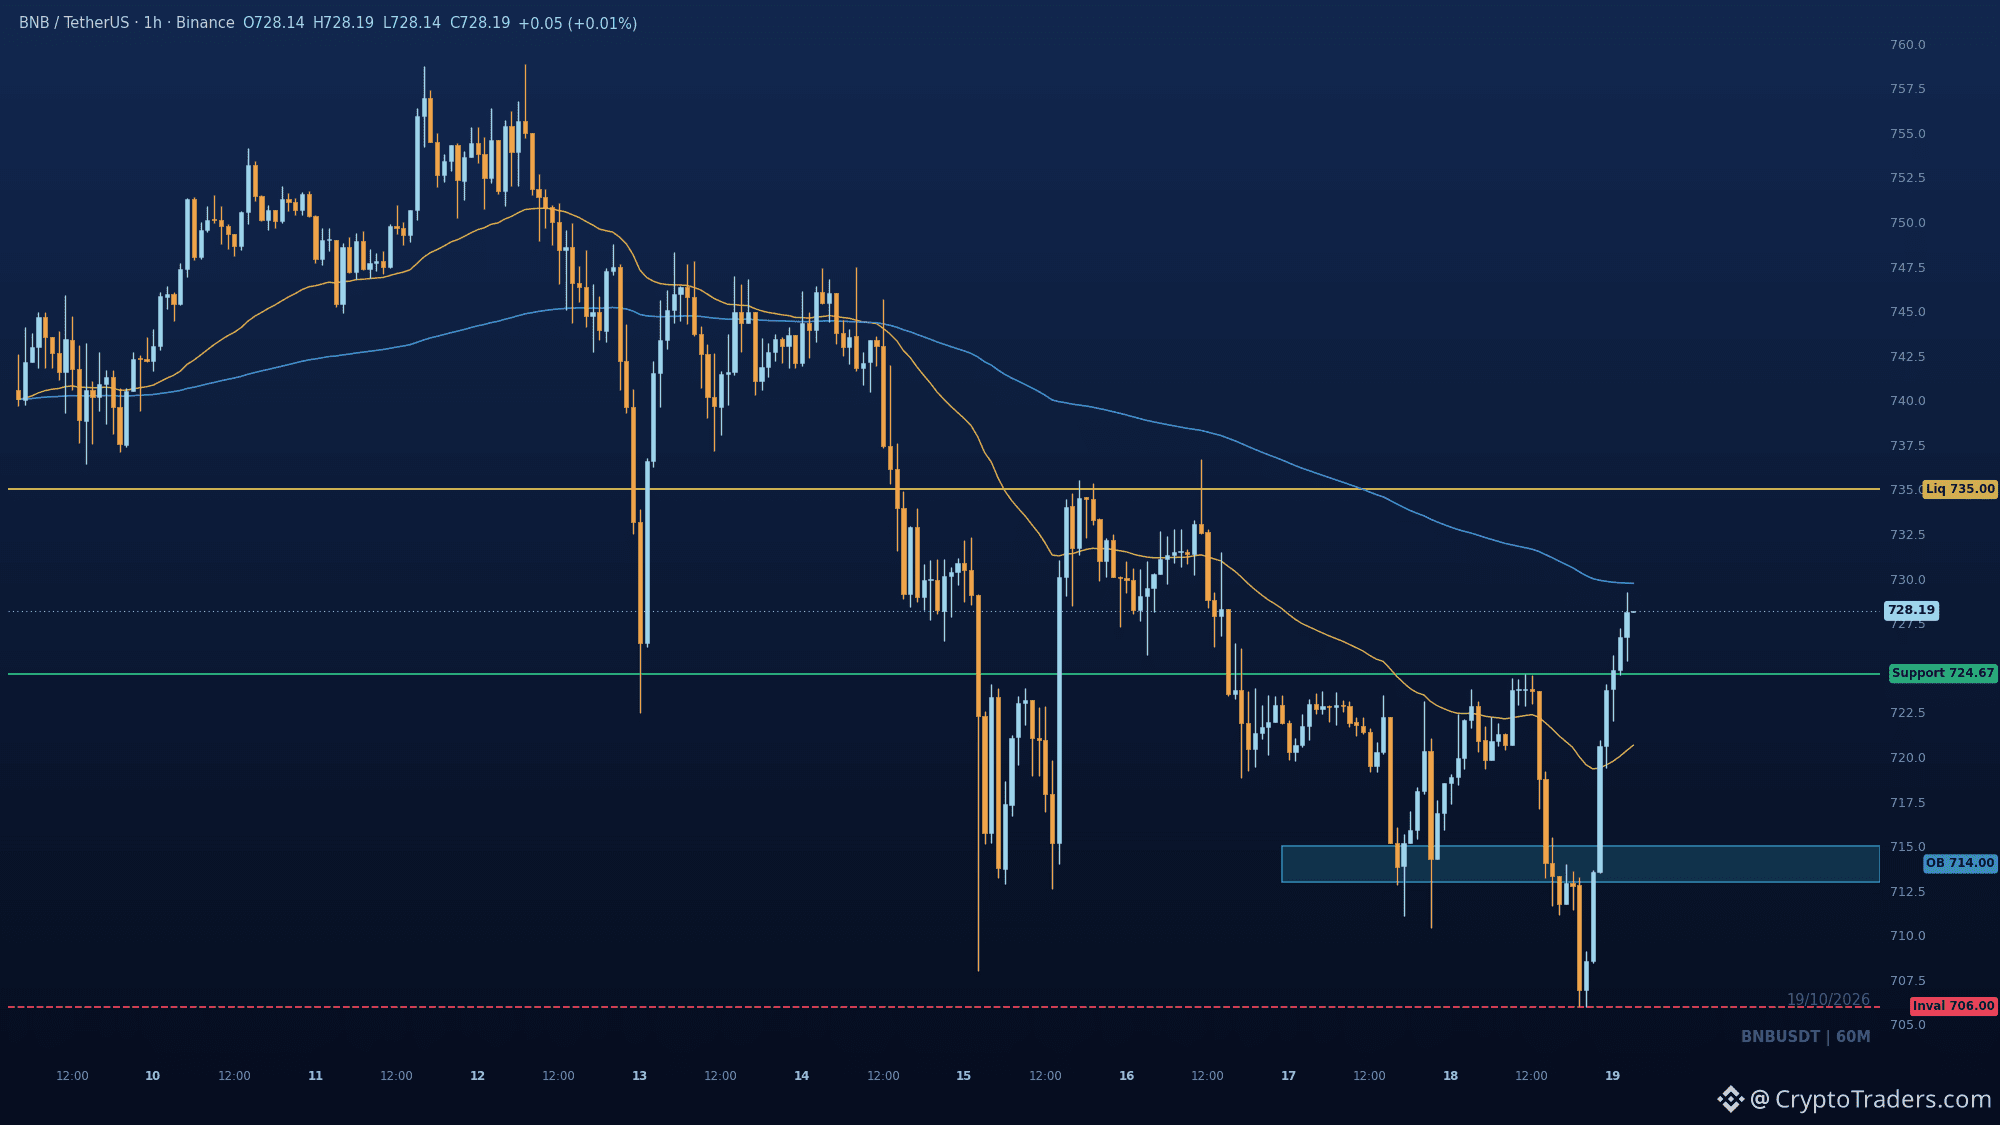
BNB holds the 724.67 reclaim while a Cysic exploit dents BSC sentiment $BNB is trading near 727.75, up 0.8 percent on the day, and the one-hour chart is doing more than the headline number suggests. The sweep of 706.00 has been reversed and the prior swing high at 724.67 reclaimed, a bullish change of character on that timeframe. The backdrop is mixed. On-chain trackers flagged an unauthorized mint of 10 million CYS on BNB Smart Chain on October 17, and Cysic suspended its cross-chain bridge in response. About 2.8 million CYS stayed at the recipient address after it was blacklisted, the dollar impact is still under review, and the project says mainnet and user-held assets were unaffected. That damage is contained, but it weighs on BNB Chain infrastructure sentiment rather than on BNB itself. The tailwind is attention: BNB on Vietnam national TV next to BTC and ETH is the sort of coverage that pulls retail eyes in. The chart: price sits in the discount half of the dealing range after sweeping that 706.00 low. The 724.67 reclaimed swing high is the level that matters, and just beneath it a tight order block at 713 to 715 marks the base that launched the rebound. I expect the 724.67 retest to be defended, then a push into 735.00 where the prior rebound high holds buy-side liquidity. Losing 724.67 weakens the shift and a close back under 706.00 voids it. What to watch: whether 724.67 holds on a retest, whether the 713 to 715 base gets tapped without breaking lower, and any movement of the remaining 2.8 million CYS from the blacklisted address. Which comes first, the 724.67 retest or the run at the 735.00 liquidity? I post chart reads like this daily in the group, so the bio is where to find them. #Altcoin Season# #Macro Insights#
BNB holds the 724.67 reclaim while a Cysic exploit dents BSC sentiment $BNB is trading near 727.75, up 0.8 percent on the day, and the one-hour chart is doing more than the headline number suggests. The sweep of 706.00 has been reversed and the prior swing high at 724.67 reclaimed, a bullish change of character on that timeframe. The backdrop is mixed. On-chain trackers flagged an unauthorized mint of 10 million CYS on BNB Smart Chain on October 17, and Cysic suspended its cross-chain bridge in response. About 2.8 million CYS stayed at the recipient address after it was blacklisted, the dollar impact is still under review, and the project says mainnet and user-held assets were unaffected. That damage is contained, but it weighs on BNB Chain infrastructure sentiment rather than on BNB itself. The tailwind is attention: BNB on Vietnam national TV next to BTC and ETH is the sort of coverage that pulls retail eyes in. The chart: price sits in the discount half of the dealing range after sweeping that 706.00 low. The 724.67 reclaimed swing high is the level that matters, and just beneath it a tight order block at 713 to 715 marks the base that launched the rebound. I expect the 724.67 retest to be defended, then a push into 735.00 where the prior rebound high holds buy-side liquidity. Losing 724.67 weakens the shift and a close back under 706.00 voids it. What to watch: whether 724.67 holds on a retest, whether the 713 to 715 base gets tapped without breaking lower, and any movement of the remaining 2.8 million CYS from the blacklisted address. Which comes first, the 724.67 retest or the run at the 735.00 liquidity? I post chart reads like this daily in the group, so the bio is where to find them. #Altcoin Season# #Macro Insights#
72
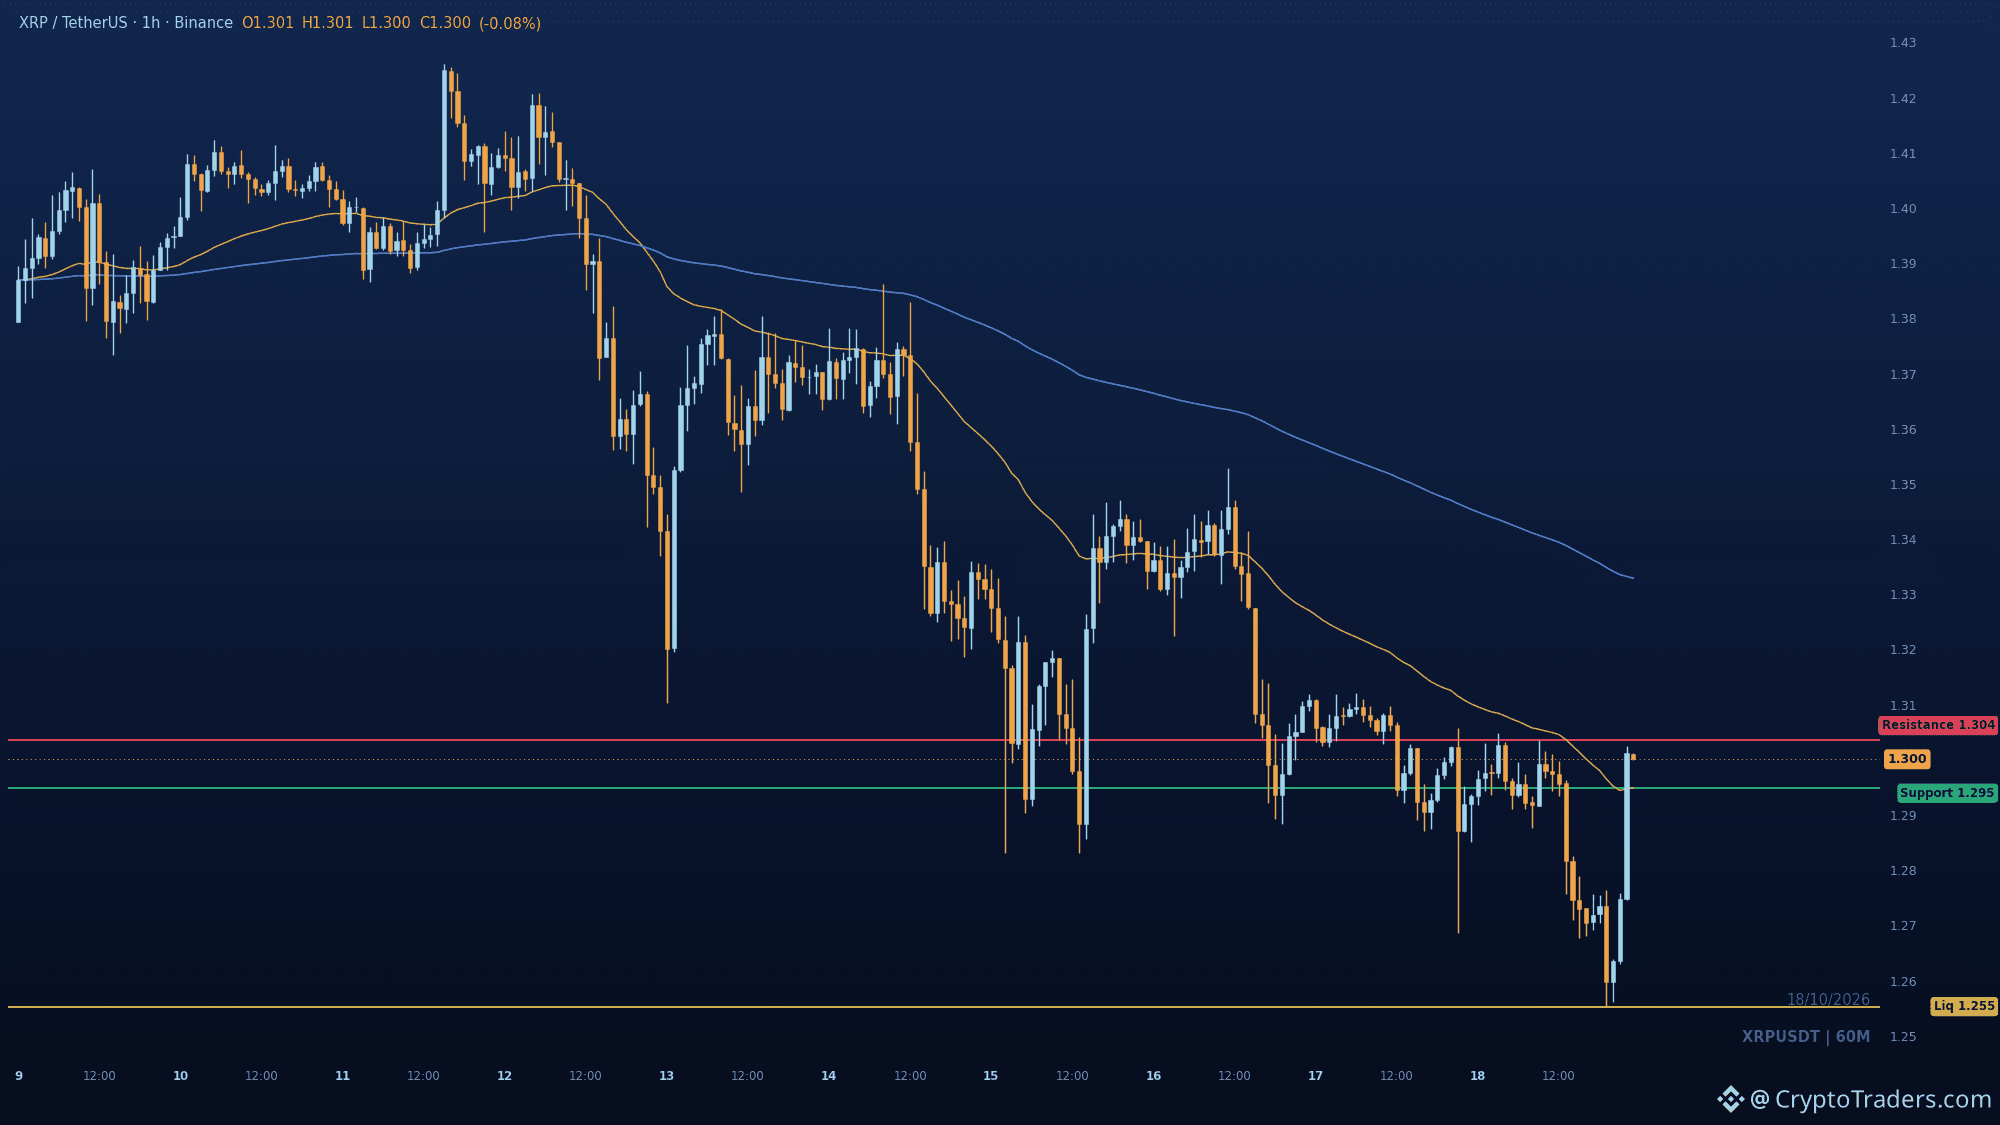
Either $XRP holds 1.2949 and grinds back toward 1.3036, or that shelf gives way and 1.2553 comes back into play. The rebound off the swept low is real, but the falling 200 EMA still hangs over price and the range stays in discount. 1.2949 is the fast EMA, so watch how the first pullback into it behaves. A close above 1.3036 would undercut the bearish continuation read and put the recent swing high back in focus. Failure to defend 1.2949 keeps 1.2553 as the structural target below. Which side of 1.2949 do you think gets tested first? More reads like this land daily in the group, and my bio has the way in. #Altcoin Season#
Either $XRP holds 1.2949 and grinds back toward 1.3036, or that shelf gives way and 1.2553 comes back into play. The rebound off the swept low is real, but the falling 200 EMA still hangs over price and the range stays in discount. 1.2949 is the fast EMA, so watch how the first pullback into it behaves. A close above 1.3036 would undercut the bearish continuation read and put the recent swing high back in focus. Failure to defend 1.2949 keeps 1.2553 as the structural target below. Which side of 1.2949 do you think gets tested first? More reads like this land daily in the group, and my bio has the way in. #Altcoin Season#
Either $XRP holds 1.2949 and grinds back toward 1.3036, or that shelf gives way and 1.2553 comes back into play. The rebound off the swept low is real, but the falling 200 EMA still hangs over price and the range stays in discount. 1.2949 is the fast EMA, so watch how the first pullback into it behaves. A close above 1.3036 would undercut the bearish continuation read and put the recent swing high back in focus. Failure to defend 1.2949 keeps 1.2553 as the structural target below. Which side of 1.2949 do you think gets tested first? More reads like this land daily in the group, and my bio has the way in. #Altcoin Season#
Either $XRP holds 1.2949 and grinds back toward 1.3036, or that shelf gives way and 1.2553 comes back into play. The rebound off the swept low is real, but the falling 200 EMA still hangs over price and the range stays in discount. 1.2949 is the fast EMA, so watch how the first pullback into it behaves. A close above 1.3036 would undercut the bearish continuation read and put the recent swing high back in focus. Failure to defend 1.2949 keeps 1.2553 as the structural target below. Which side of 1.2949 do you think gets tested first? More reads like this land daily in the group, and my bio has the way in. #Altcoin Season#
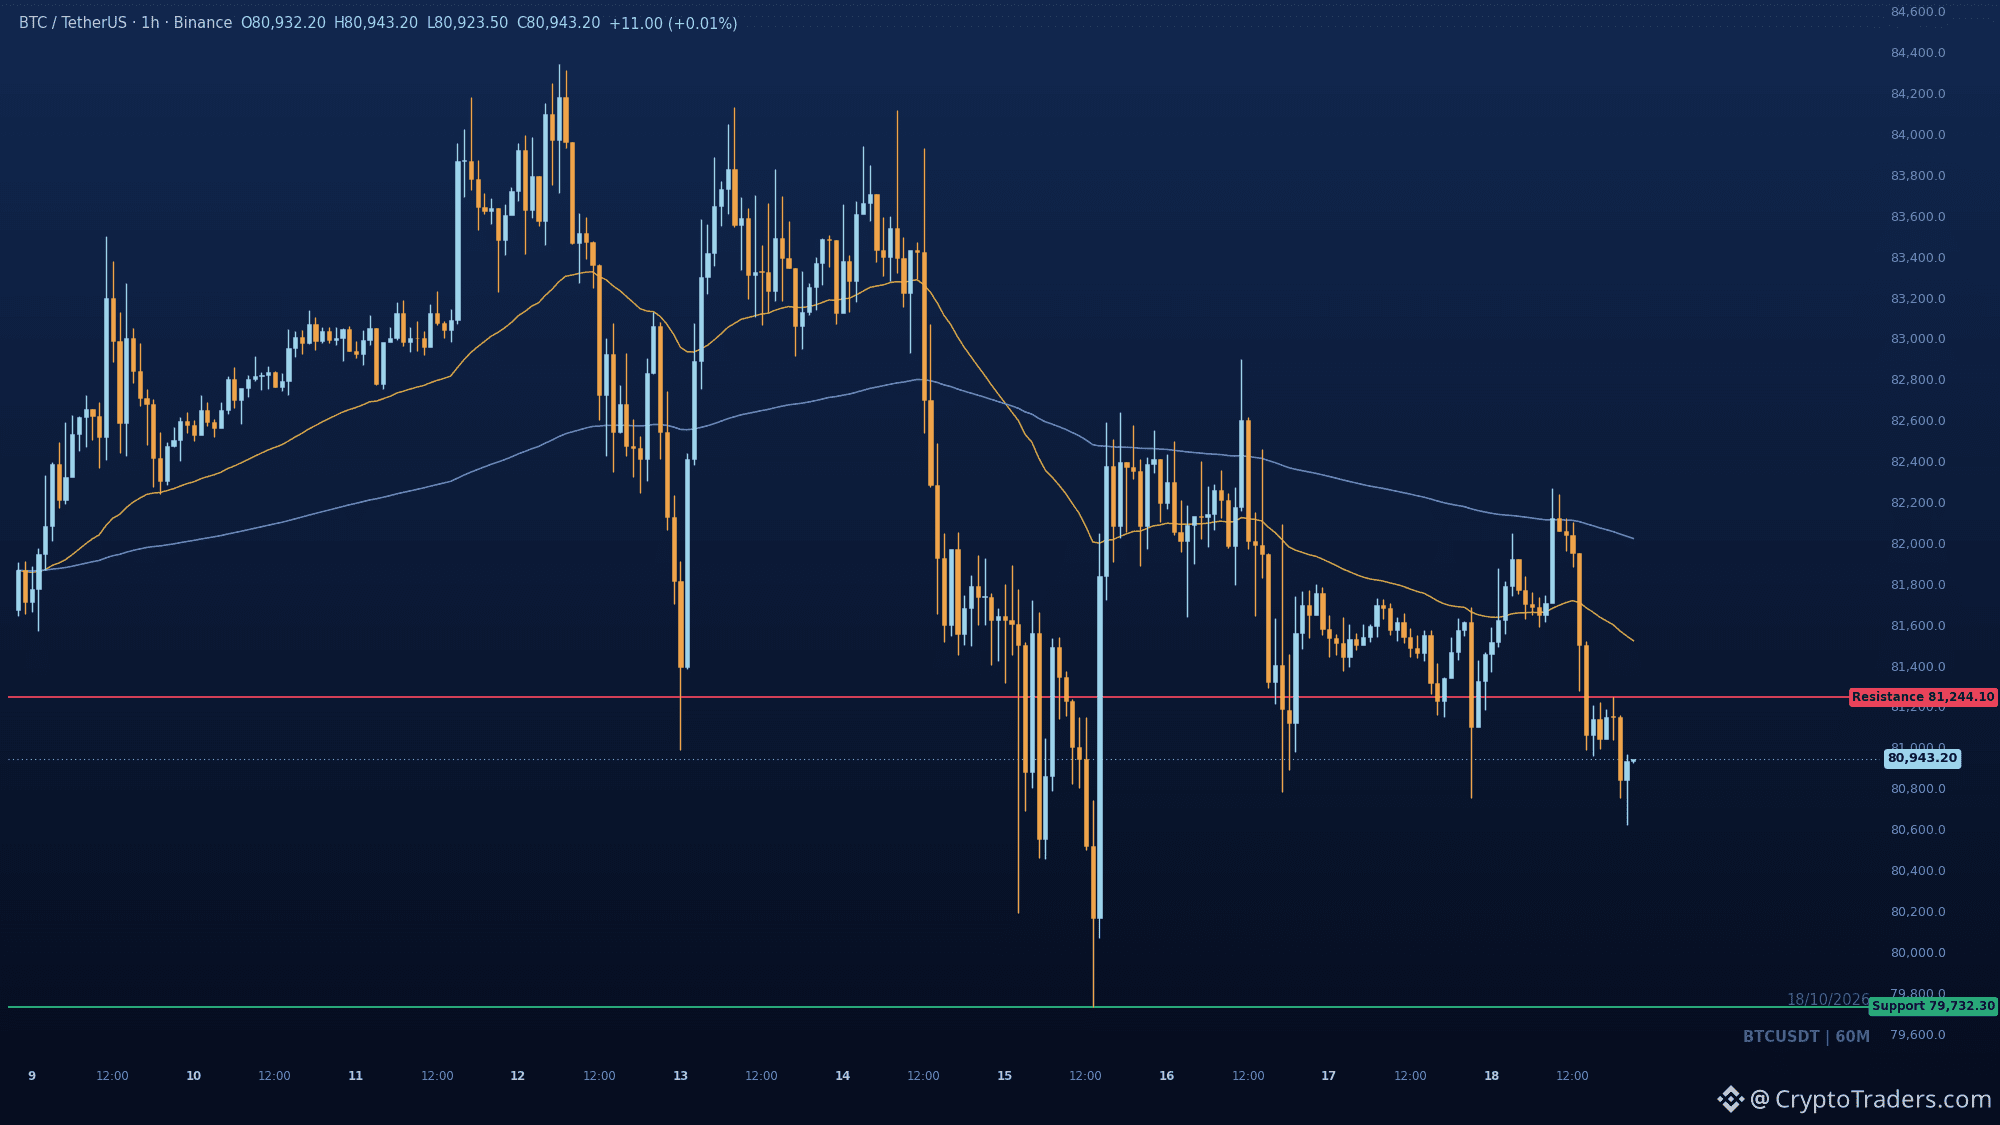
Hardware wallet trust takes a hit while $BTC ETFs keep most of their September haul 🔐 1⃣ Supply-chain scare: A Ledger Nano X bought from a German retailer was reportedly found with an implant that can read and transmit recovery words during setup. Ledger's genuine-device check may not catch this kind of modification, and phishing pages are already imitating Ledger update flows to harvest seeds. 2⃣ ETH demand cracks: U.S. spot Ether ETFs bled 924.5 million from October 1 to 16, more than erasing September's 825.3 million of inflows, with redemptions in 11 of 12 sessions. Bitcoin ETFs lost 614.7 million but kept most of September's 2.65 billion intake. 3⃣ Leverage churn: Jupiter's unaudited Yolo beta reports over 1 billion in leveraged opens and closes in under 24 hours across SOL, BTC and ETH. That is gross turnover, not capital, and payouts come from a single house pool. Custody risk and ETF divergence are pulling in opposite directions, and the tape is leaning cautious at 80,967. Which matters more to you right now: self-custody safety or institutional flow? More breakdowns like this land daily in the group, and my bio shows the way in. #BTC Price Analysis# #Bitcoin Price Prediction: What is Bitcoins next move?# #Macro Insights#
Hardware wallet trust takes a hit while $BTC ETFs keep most of their September haul 🔐 1⃣ Supply-chain scare: A Ledger Nano X bought from a German retailer was reportedly found with an implant that can read and transmit recovery words during setup. Ledger's genuine-device check may not catch this kind of modification, and phishing pages are already imitating Ledger update flows to harvest seeds. 2⃣ ETH demand cracks: U.S. spot Ether ETFs bled 924.5 million from October 1 to 16, more than erasing September's 825.3 million of inflows, with redemptions in 11 of 12 sessions. Bitcoin ETFs lost 614.7 million but kept most of September's 2.65 billion intake. 3⃣ Leverage churn: Jupiter's unaudited Yolo beta reports over 1 billion in leveraged opens and closes in under 24 hours across SOL, BTC and ETH. That is gross turnover, not capital, and payouts come from a single house pool. Custody risk and ETF divergence are pulling in opposite directions, and the tape is leaning cautious at 80,967. Which matters more to you right now: self-custody safety or institutional flow? More breakdowns like this land daily in the group, and my bio shows the way in. #BTC Price Analysis# #Bitcoin Price Prediction: What is Bitcoins next move?# #Macro Insights#
Войдите, чтобы посмотреть больше материала
Присоединяйтесь к пользователям криптовалют по всему миру на Binance Square
⚡️ Получайте новейшую и полезную информацию о криптоактивах.
💬 Нам доверяет крупнейшая в мире криптобиржа.
👍 Получите достоверные аналитические данные от верифицированных создателей контента.
Эл. почта/номер телефона
В тренде
BinancePick
Просмотров: 3M
151,594 обсуждают
Join #EarningsSeason: Predict Earnings on Binance Pick, Share Your Take on Binance Square!
Binance Square Official
·Лайков: 408
·Просмотров: 342.3k
EarningsSeason
Просмотров: 5.2M
25,772 обсуждают
AnthropicTTMRevenueGrewAbout1200%
Просмотров: 18,112
331 обсуждают