

Alpha Desk Research
3 Публикации

Alpha Desk Research
Отправить жалобу
Заблокировать пользователя
4 подписок(и/а)
0 подписчиков(а)
0 понравилось
Посты
Статья
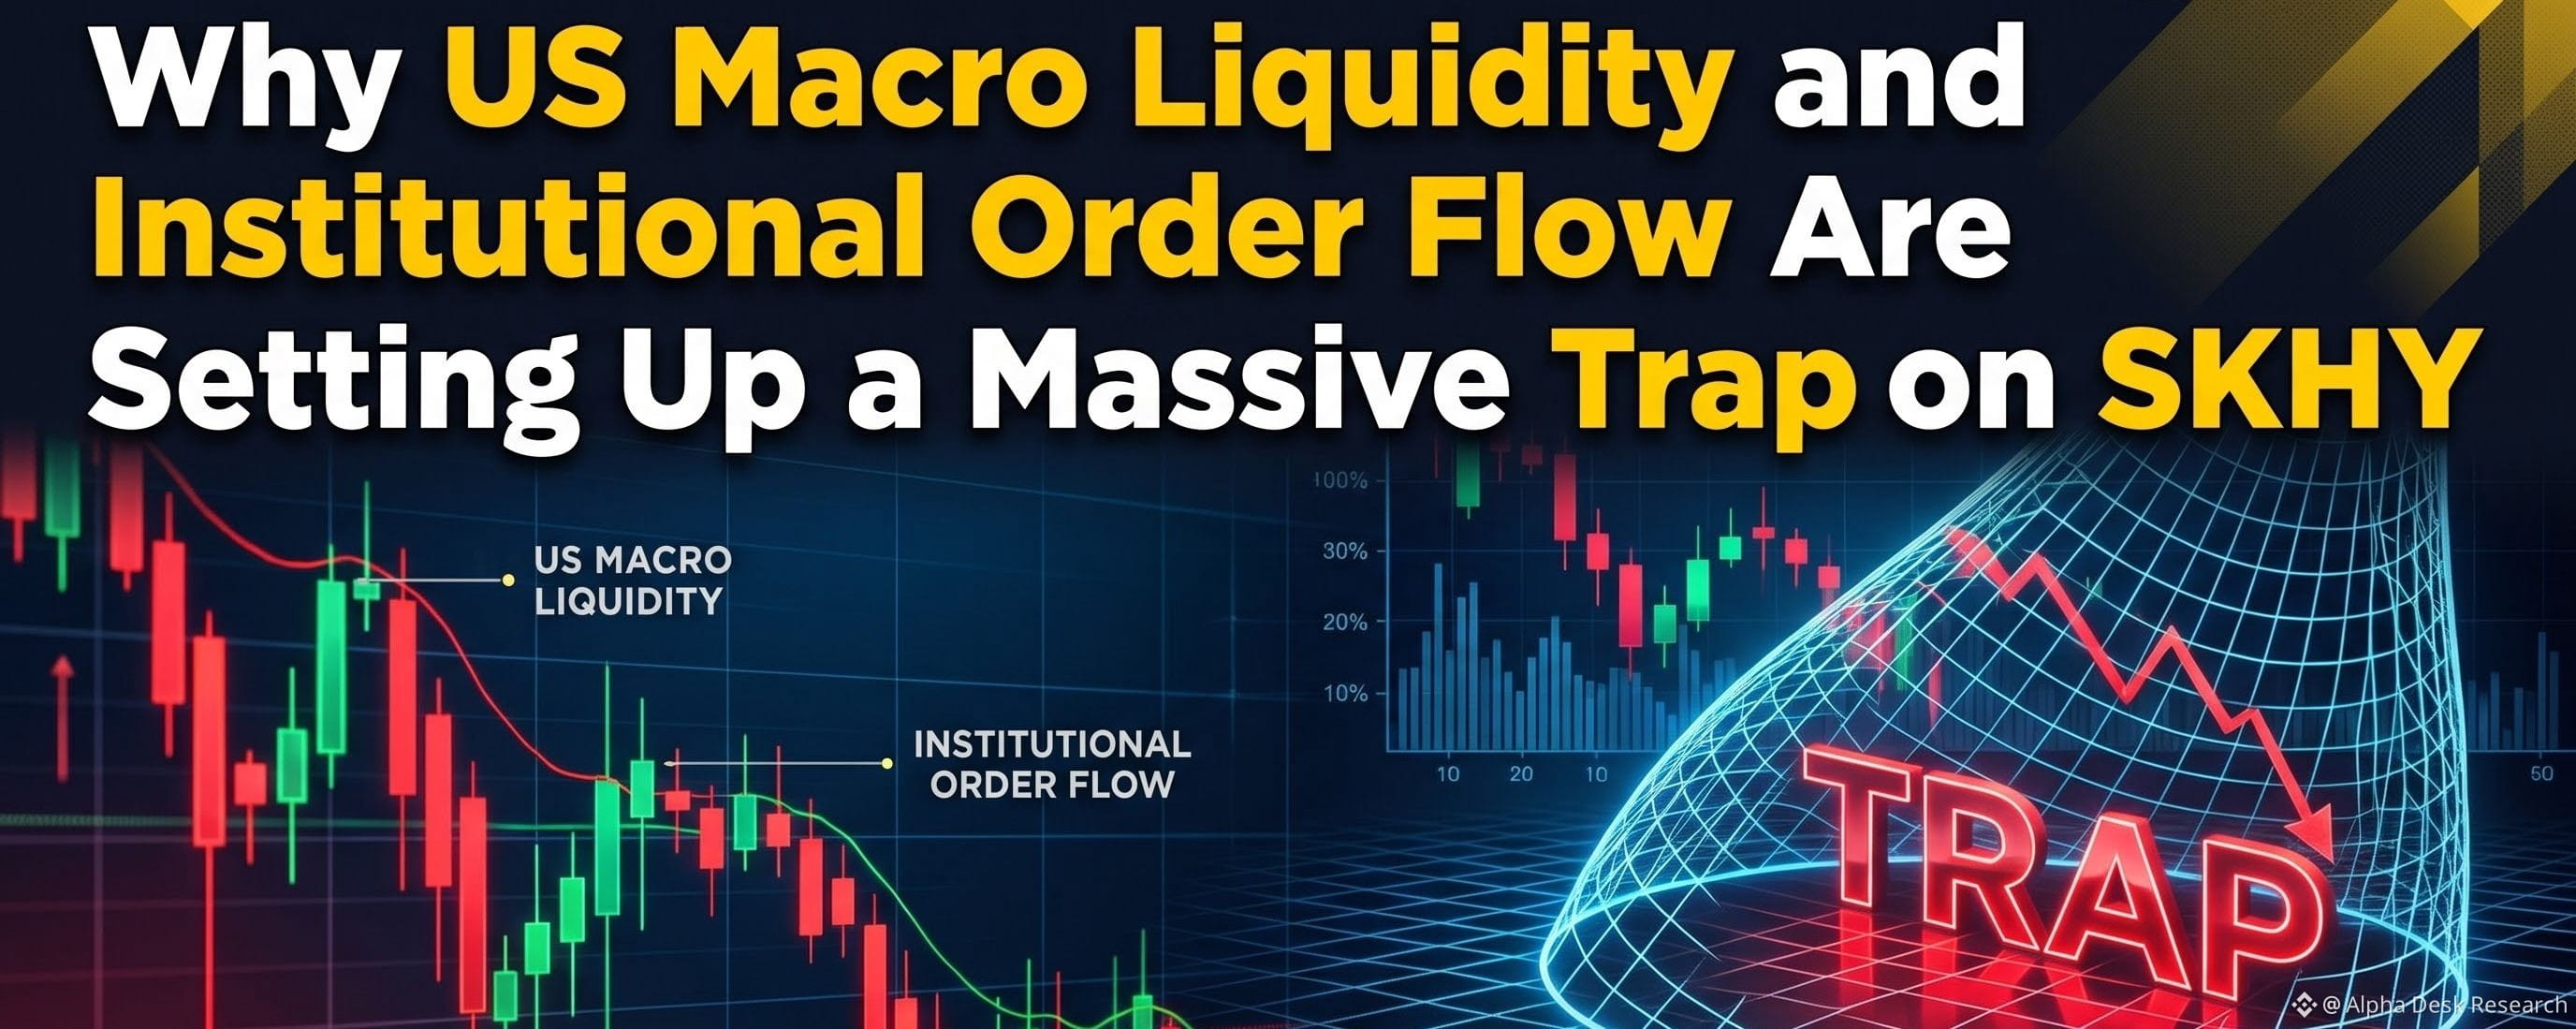
Why US Macro Liquidity and Institutional Order Flow Are Setting Up a Massive Trap on SKHYWith the latest US economic data reinforcing sticky Treasury yields and Federal Reserve officials maintaining a patient policy stance, institutional desks used the macro fog to engineer an aggressive liquidity sweep on $SKHY. While retail participants hesitated amid the headline uncertainty, the underlying tape on the 4-hour chart reveals a textbook liquidity trap where sell-side stops were flushed directly into resting institutional bids. Smart money operators used that manufactured volatility window to absorb inventory quietly without allowing spot prices to drift away from fair value.
When you inspect the tape following the impulse displacement, the telltale footprint appears right at the 50 percent base candle. Instead of aggressive follow-through selling, volume abruptly dried up as market sell orders were absorbed by passive resting bids. We are seeing a parallel absorption signature unfolding across $BTC, confirming that institutional liquidity is quietly rotating through key market leaders rather than fleeing the asset class.
For traders mapping their execution on $SKHY, I am closely watching the primary demand base between $154.50 and $155. A clean 4-hour close below $153 completely invalidates this premise, signaling that institutional absorption has failed. If the recovery thesis holds, initial de-risking for $SKHY sits at $184.50, leaving an extended runner for the broader macro liquidity pool at $225.50.
In institutional trading, longevity comes down to keeping risk strictly capped at one to two percent per idea and letting the tape confirm the thesis before sizing up. You can track this setup and execute your limits directly via the interactive $SKHY trade widget on this chart. Do you believe this absorption is genuine spot accumulation ahead of the next FOMC cycle, or are we witnessing a temporary hedge?
$SKHY #BinanceSquare #CryptoTrading #PriceAction
Why US Macro Liquidity and Institutional Order Flow Are Setting Up a Massive Trap on SKHY
With the latest US economic data reinforcing sticky Treasury yields and Federal Reserve officials maintaining a patient policy stance, institutional desks used the macro fog to engineer an aggressive liquidity sweep on $SKHY. While retail participants hesitated amid the headline uncertainty, the underlying tape on the 4-hour chart reveals a textbook liquidity trap where sell-side stops were flushed directly into resting institutional bids. Smart money operators used that manufactured volatility window to absorb inventory quietly without allowing spot prices to drift away from fair value.
When you inspect the tape following the impulse displacement, the telltale footprint appears right at the 50 percent base candle. Instead of aggressive follow-through selling, volume abruptly dried up as market sell orders were absorbed by passive resting bids. We are seeing a parallel absorption signature unfolding across $BTC, confirming that institutional liquidity is quietly rotating through key market leaders rather than fleeing the asset class.
For traders mapping their execution on $SKHY, I am closely watching the primary demand base between $154.50 and $155. A clean 4-hour close below $153 completely invalidates this premise, signaling that institutional absorption has failed. If the recovery thesis holds, initial de-risking for $SKHY sits at $184.50, leaving an extended runner for the broader macro liquidity pool at $225.50.
In institutional trading, longevity comes down to keeping risk strictly capped at one to two percent per idea and letting the tape confirm the thesis before sizing up. You can track this setup and execute your limits directly via the interactive $SKHY trade widget on this chart. Do you believe this absorption is genuine spot accumulation ahead of the next FOMC cycle, or are we witnessing a temporary hedge?
$SKHY #BinanceSquare #CryptoTrading #PriceAction
211
Статья
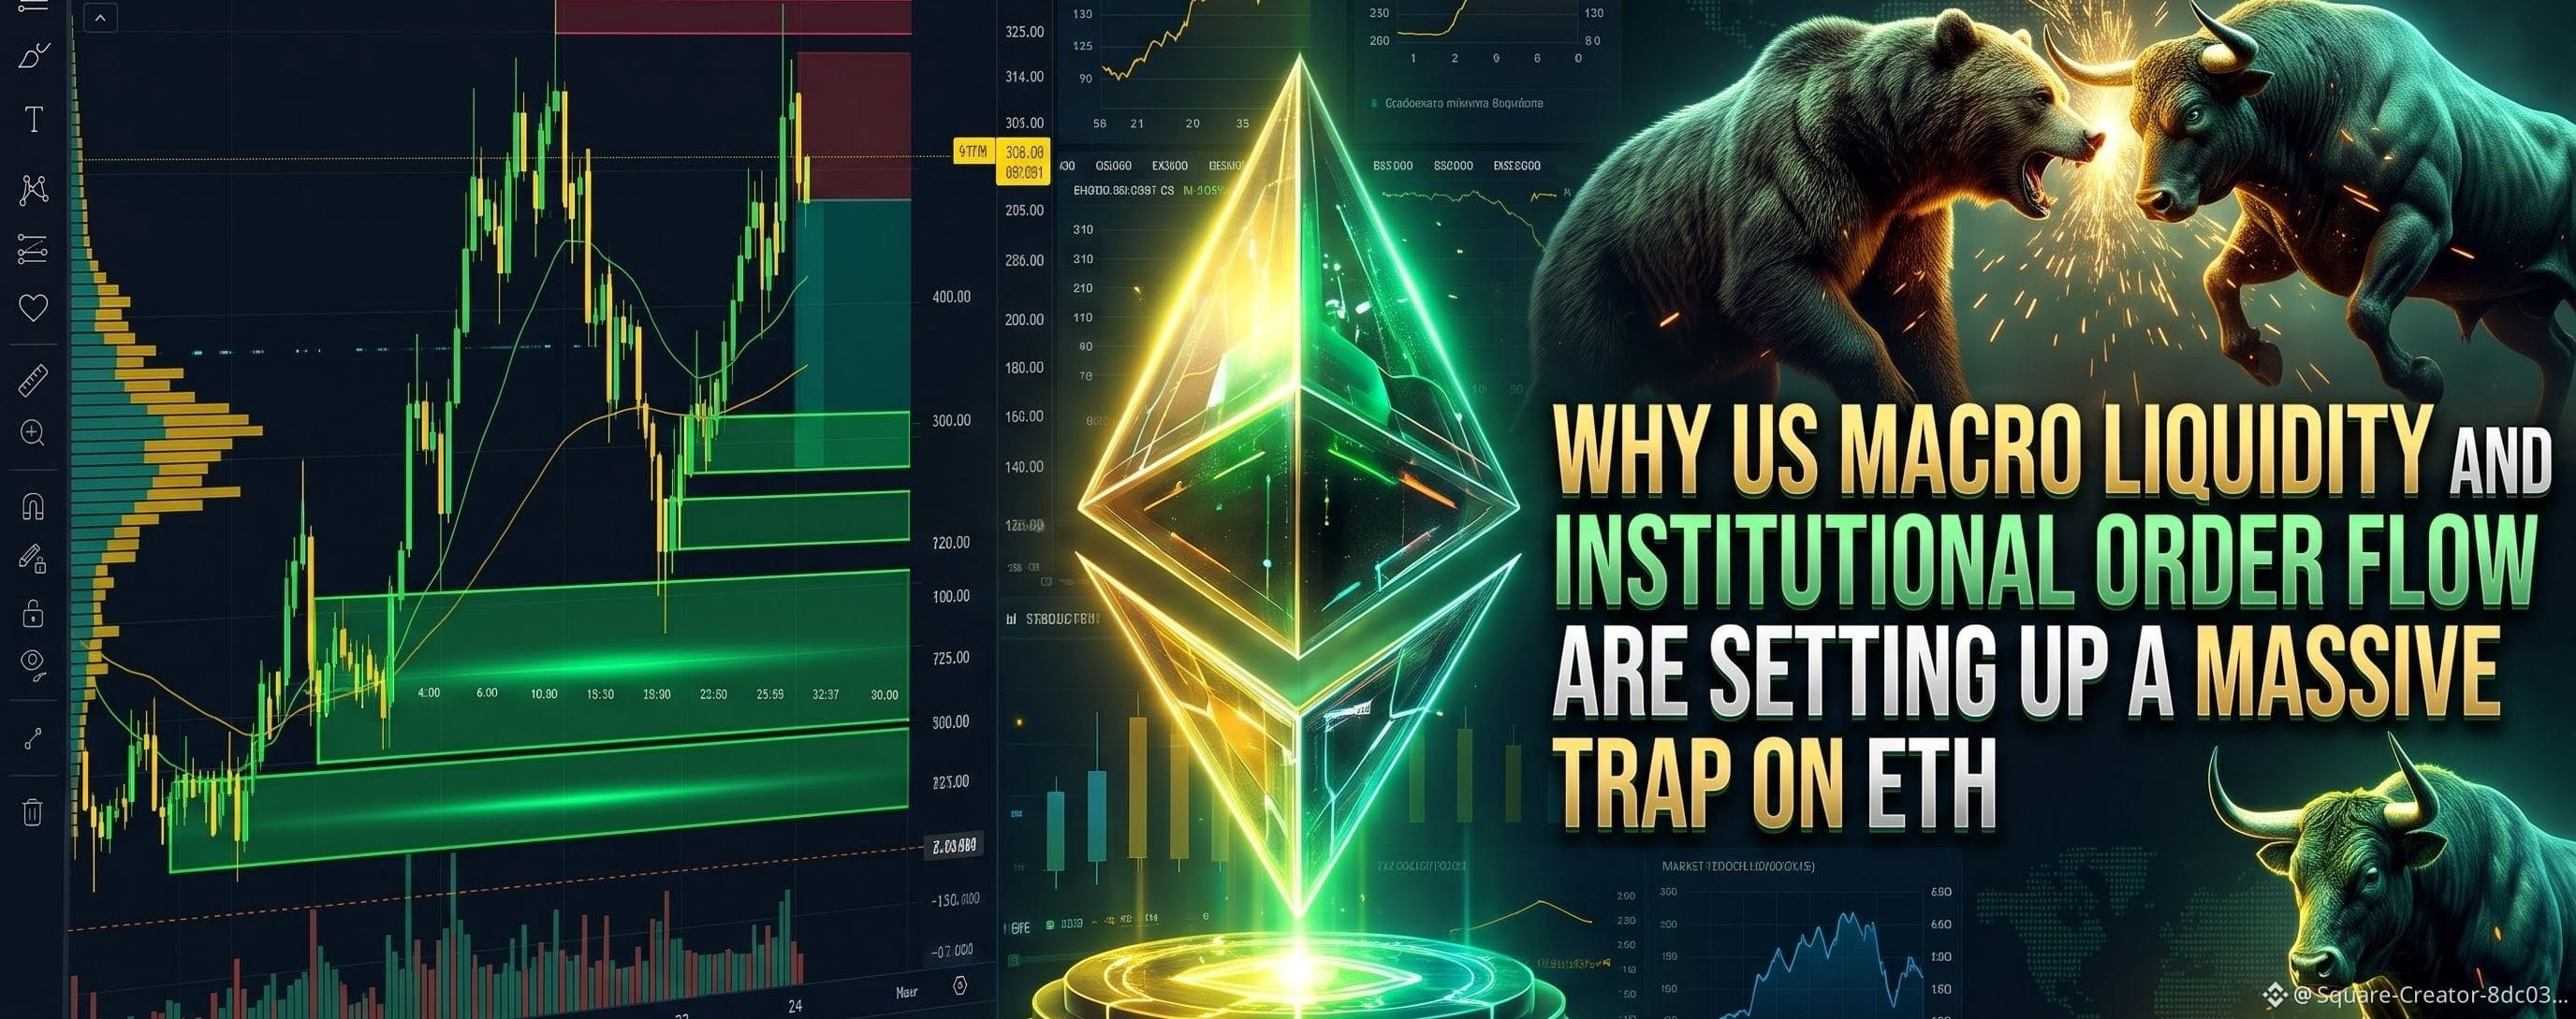
Why US Macro Liquidity and Institutional Order Flow Are Setting Up a Massive Trap on ETHWith the latest US economic data reinforcing sticky Treasury yields and Federal Reserve officials maintaining a patient policy stance, institutional desks used the macro fog to engineer an aggressive liquidity sweep on $ETH. While retail participants hesitated amid the headline uncertainty, the underlying tape on the 4-hour chart reveals a textbook liquidity trap where sell-side stops were flushed directly into resting institutional bids. Smart money operators used that manufactured volatility window to absorb inventory quietly without allowing spot prices to drift away from fair value.
When you inspect the tape following the impulse displacement, the telltale footprint appears right at the 50 percent base candle. Instead of aggressive follow-through selling, volume abruptly dried up as market sell orders were absorbed by passive resting bids. We are seeing a parallel absorption signature unfolding across $SOL, confirming that institutional liquidity is quietly rotating through key market leaders rather than fleeing the asset class.
For traders mapping their execution on $ETH, I am closely watching the primary demand base between $2,330 and $2,340. A clean 4-hour close below $2,310 completely invalidates this premise, signaling that institutional absorption has failed. If the recovery thesis holds, initial de-risking for $ETH sits at $2,780, leaving an extended runner for the broader macro liquidity pool at $3,400.
#EthereumDropsBelow$2300
In institutional trading, longevity comes down to keeping risk strictly capped at one to two percent per idea and letting the tape confirm the thesis before sizing up. You can track this setup and execute your limits directly via the interactive $ETH trade widget on this chart. Do you believe this absorption is genuine spot accumulation ahead of the next FOMC cycle, or are we witnessing a temporary hedge?
$ETH #BinanceSquare #CryptoTrading #PriceAction #CanMicrosoftDeliverOnAI
Why US Macro Liquidity and Institutional Order Flow Are Setting Up a Massive Trap on ETH
With the latest US economic data reinforcing sticky Treasury yields and Federal Reserve officials maintaining a patient policy stance, institutional desks used the macro fog to engineer an aggressive liquidity sweep on $ETH. While retail participants hesitated amid the headline uncertainty, the underlying tape on the 4-hour chart reveals a textbook liquidity trap where sell-side stops were flushed directly into resting institutional bids. Smart money operators used that manufactured volatility window to absorb inventory quietly without allowing spot prices to drift away from fair value.
When you inspect the tape following the impulse displacement, the telltale footprint appears right at the 50 percent base candle. Instead of aggressive follow-through selling, volume abruptly dried up as market sell orders were absorbed by passive resting bids. We are seeing a parallel absorption signature unfolding across $SOL, confirming that institutional liquidity is quietly rotating through key market leaders rather than fleeing the asset class.
For traders mapping their execution on $ETH, I am closely watching the primary demand base between $2,330 and $2,340. A clean 4-hour close below $2,310 completely invalidates this premise, signaling that institutional absorption has failed. If the recovery thesis holds, initial de-risking for $ETH sits at $2,780, leaving an extended runner for the broader macro liquidity pool at $3,400.
#EthereumDropsBelow$2300
In institutional trading, longevity comes down to keeping risk strictly capped at one to two percent per idea and letting the tape confirm the thesis before sizing up. You can track this setup and execute your limits directly via the interactive $ETH trade widget on this chart. Do you believe this absorption is genuine spot accumulation ahead of the next FOMC cycle, or are we witnessing a temporary hedge?
$ETH #BinanceSquare #CryptoTrading #PriceAction #CanMicrosoftDeliverOnAI
103

Статья
Why BTC Order Flow Is Signaling an Impending Trap Above Recent ResistanceWhile the broader tape gives the impression of ordinary consolidation, the underlying order flow across the 4-hour chart reveals a far more deliberate campaign. The recent probe below key support was not genuine continuation selling, but an engineered liquidity sweep designed to flush retail stops into resting institutional bids. Smart money operators used that manufactured liquidity window to absorb inventory quietly without allowing price to drift too far from value.
When you inspect the tape following the impulse displacement, the telltale footprint appears right at the 50 percent base candle. Instead of aggressive follow-through selling, volume abruptly dried up as market sell orders were absorbed by passive resting bids. This specific exhaustion of aggressive seller delta indicates that supply has been absorbed, and the market is now coiling for displacement rather than extended chop.
From a structural standpoint, I am closely watching the primary demand block between $79,700 and $80,050. A clean 4-hour close below $79,150 completely invalidates this premise, signaling that absorption has failed. If the thesis holds, initial de-risking sits at $95,200, leaving a runner for the broader macro liquidity pool at $116,500.
In this business, longevity comes down to keeping risk capped at one to two percent per idea and letting the tape confirm the thesis before adding size. Do you believe this absorption is genuine institutional accumulation, or are we witnessing a temporary hedge ahead of macro volatility?
$BTC #BinanceSquare #CryptoTrading #PriceAction
Why BTC Order Flow Is Signaling an Impending Trap Above Recent Resistance
While the broader tape gives the impression of ordinary consolidation, the underlying order flow across the 4-hour chart reveals a far more deliberate campaign. The recent probe below key support was not genuine continuation selling, but an engineered liquidity sweep designed to flush retail stops into resting institutional bids. Smart money operators used that manufactured liquidity window to absorb inventory quietly without allowing price to drift too far from value.
When you inspect the tape following the impulse displacement, the telltale footprint appears right at the 50 percent base candle. Instead of aggressive follow-through selling, volume abruptly dried up as market sell orders were absorbed by passive resting bids. This specific exhaustion of aggressive seller delta indicates that supply has been absorbed, and the market is now coiling for displacement rather than extended chop.
From a structural standpoint, I am closely watching the primary demand block between $79,700 and $80,050. A clean 4-hour close below $79,150 completely invalidates this premise, signaling that absorption has failed. If the thesis holds, initial de-risking sits at $95,200, leaving a runner for the broader macro liquidity pool at $116,500.
In this business, longevity comes down to keeping risk capped at one to two percent per idea and letting the tape confirm the thesis before adding size. Do you believe this absorption is genuine institutional accumulation, or are we witnessing a temporary hedge ahead of macro volatility?
$BTC #BinanceSquare #CryptoTrading #PriceAction
93
Войдите, чтобы посмотреть больше материала
Присоединяйтесь к пользователям криптовалют по всему миру на Binance Square
⚡️ Получайте новейшую и полезную информацию о криптоактивах.
💬 Нам доверяет крупнейшая в мире криптобиржа.
👍 Получите достоверные аналитические данные от верифицированных создателей контента.
Эл. почта/номер телефона
В тренде
$1.5BInLeveragedCryptoBetsLiquidated
Просмотров: 5,153
70 обсуждают
#$1.5BInLeveragedCryptoBetsLiquidated
📉 Kripto fiyatları düşünce, kaldıraçla yükselişe oynayanların pozisyonları otomatik kapatıldı. 24 saatte toplam 1,53 milyar dolarlık işlem tasfiye edildi; bunun yaklaşık %83,8’i fiyatların yükseleceğine bahis oynayan “long” pozisyonlardı. Bu rakam, yatırımcıların cebinden çıkan nakdin değil, kapatılan pozisyonların toplam değerinin ölçüsü. 💸
⚙️ Kaldıraç, az parayla daha büyük bir işlem açmak gibi. Fiyat ters yönde yeterince hareket edince teminat yetmiyor ve borsa pozisyonu zorla kapatıyor. Bu satışlar düşüşü daha da hızlandırabiliyor. Haber, satış dalgasını Binance’teki güvenlik ihlali sonrasına bağlıyor
🔄 Fiyatlar toparlanınca bu kez düşüşe oynayan bazı “short” pozisyonlar da tasfiye edildi; onları kapatmak için alım yapılması yükselişi besleyebiliyor.$LSK $IDOL $Q
Sat_Stacker
·Лайков: 0
·Просмотров: 924
KOSPIFalls3.53%BackBelow6000
Просмотров: 10,119
304 обсуждают
AmazonSharesFallAbout7%InPremarketTrading
Просмотров: 1
7 обсуждают