
Marcus Corvinus 1
299 Публикации

Marcus Corvinus 1
Отправить жалобу
Заблокировать пользователя
I'm Marcus Crypto Expert & Strategist~Chart Analyst. Verified Kol CMC & #Binance Square • X• @CryptoBull009
0 подписок(и/а)
0 подписчиков(а)
1 понравилось
Посты
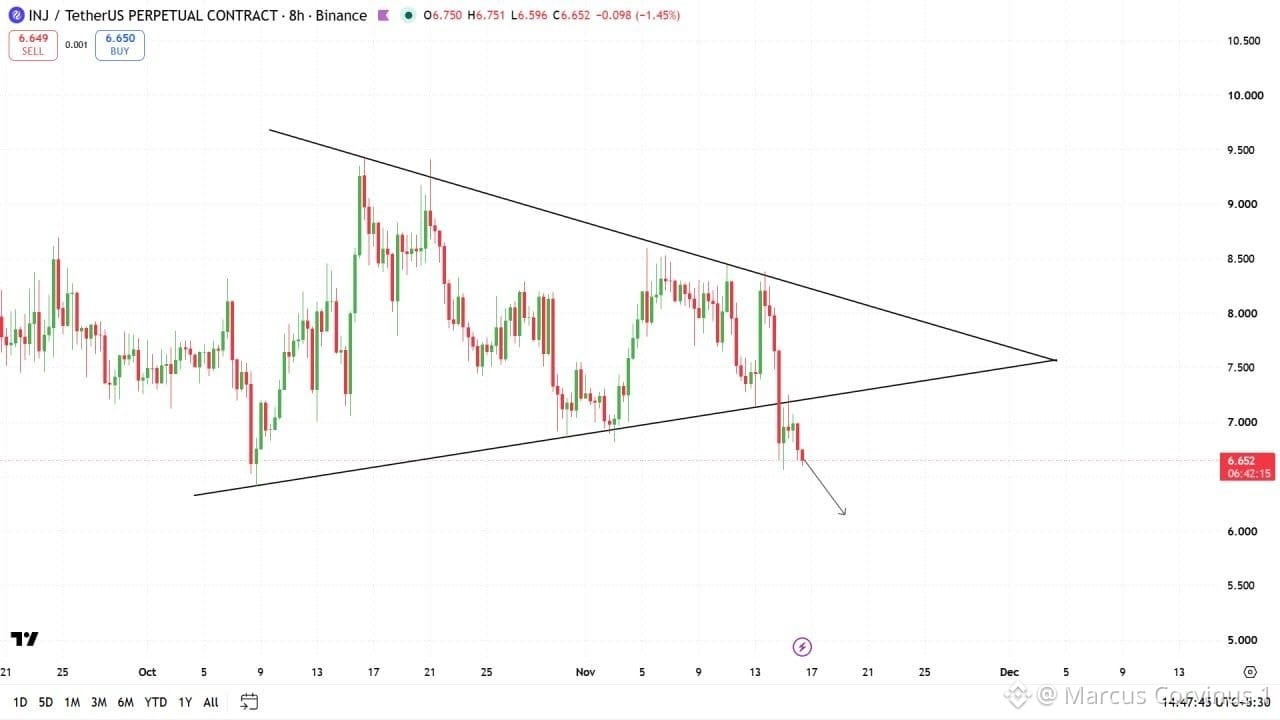
$INJ is looking extremely bearish after a major breakdown!
The 8H chart confirms a breakdown below the ascending support trendline.
The symmetrical triangle pattern has broken to the downside, signaling increasing selling pressure.
Bears are gaining control as the price struggles below $7.00.
The next potential downside targets are $6.30 and $6.00.
Any recovery toward the broken support could face strong resistance.
Unless buyers reclaim the breakdown zone, further downside remains possible.
I'm expecting another bearish move soon if selling pressure continues.
Keep INJ on your radar. The next move could be significant!
#BTC Price Analysis# #Macro Insights# #Altcoin Season# #Meme Alpha# #BNBChain#
$INJ is looking extremely bearish after a major breakdown!
The 8H chart confirms a breakdown below the ascending support trendline.
The symmetrical triangle pattern has broken to the downside, signaling increasing selling pressure.
Bears are gaining control as the price struggles below $7.00.
The next potential downside targets are $6.30 and $6.00.
Any recovery toward the broken support could face strong resistance.
Unless buyers reclaim the breakdown zone, further downside remains possible.
I'm expecting another bearish move soon if selling pressure continues.
Keep INJ on your radar. The next move could be significant!
#BTC Price Analysis# #Macro Insights# #Altcoin Season# #Meme Alpha# #BNBChain#
The 8H chart confirms a breakdown below the ascending support trendline.
The symmetrical triangle pattern has broken to the downside, signaling increasing selling pressure.
Bears are gaining control as the price struggles below $7.00.
The next potential downside targets are $6.30 and $6.00.
Any recovery toward the broken support could face strong resistance.
Unless buyers reclaim the breakdown zone, further downside remains possible.
I'm expecting another bearish move soon if selling pressure continues.
Keep INJ on your radar. The next move could be significant!
#BTC Price Analysis# #Macro Insights# #Altcoin Season# #Meme Alpha# #BNBChain#
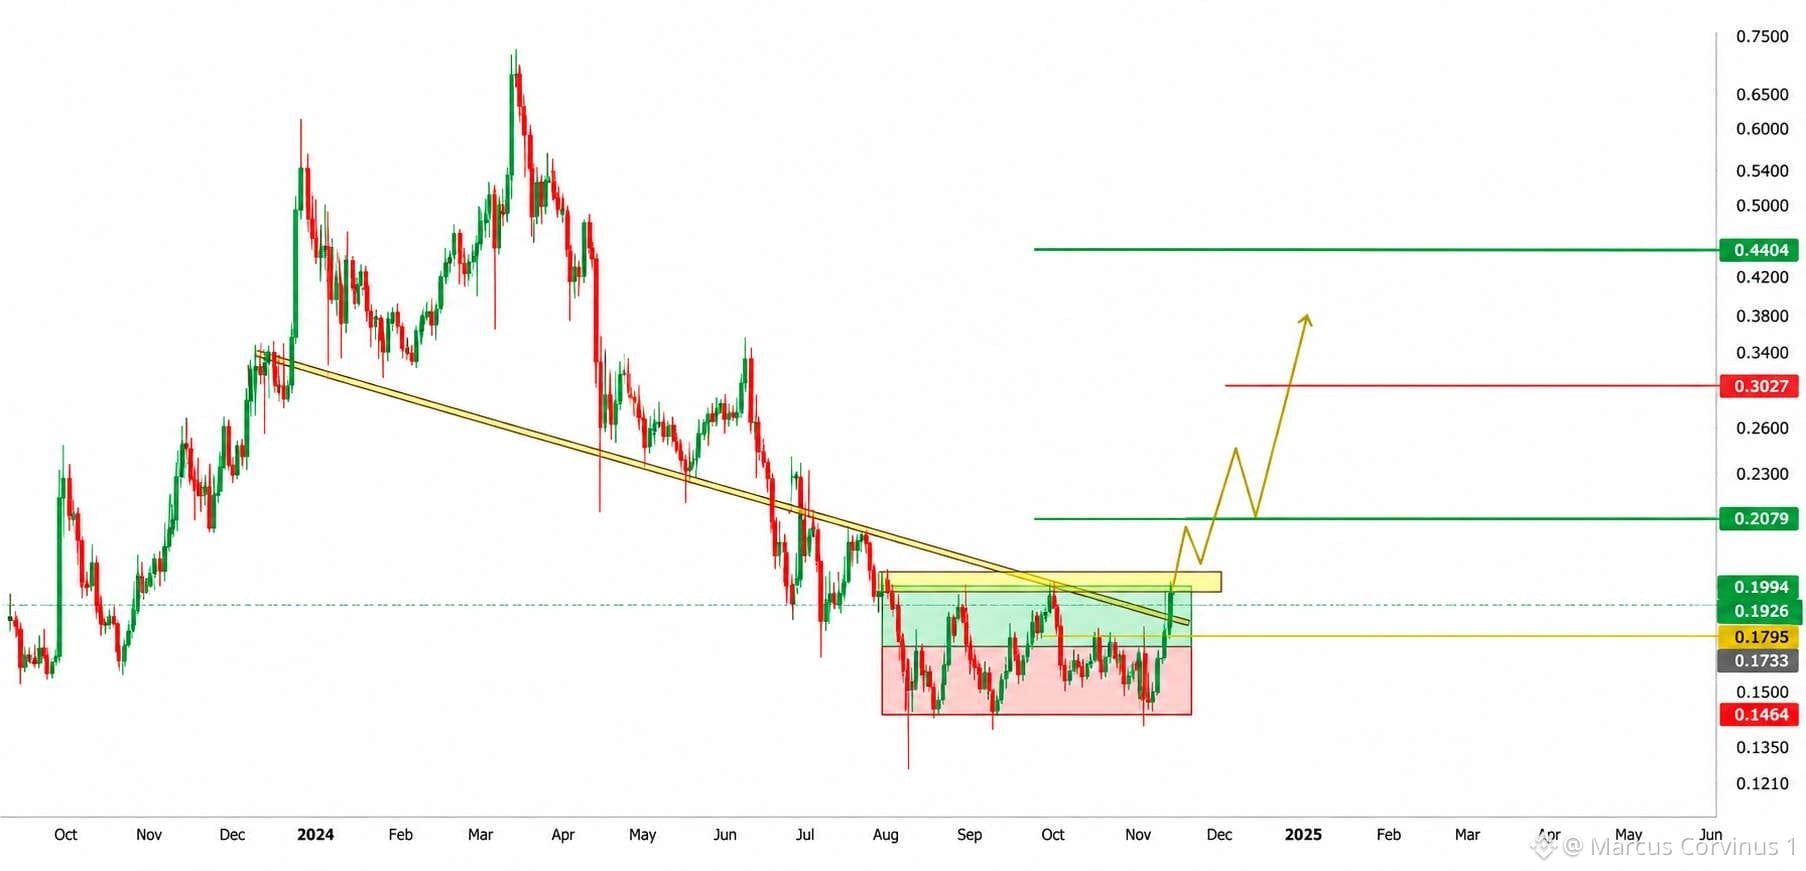
$GLMR is showing signs of a potential explosive move!
After a prolonged period of selling pressure and consolidation, GLMR is approaching an important technical area that could determine its next major direction.
The price is attempting to break above a descending trendline while building a stronger base around its recent support zone.
A confirmed breakout above $0.1994 could open the door toward $0.2329, followed by $0.3227 if bullish momentum continues.
If buyers maintain control and trading volume increases, the larger upside target around $0.4484 could come into focus.
The key is holding support near $0.1752. Losing this level could weaken the bullish setup.
GLMR buy and hold — a big move could be coming soon!
#BTC Price Analysis# #Macro Insights# #Altcoin Season# #Meme Alpha# #BNBChain#
$GLMR is showing signs of a potential explosive move!
After a prolonged period of selling pressure and consolidation, GLMR is approaching an important technical area that could determine its next major direction.
The price is attempting to break above a descending trendline while building a stronger base around its recent support zone.
A confirmed breakout above $0.1994 could open the door toward $0.2329, followed by $0.3227 if bullish momentum continues.
If buyers maintain control and trading volume increases, the larger upside target around $0.4484 could come into focus.
The key is holding support near $0.1752. Losing this level could weaken the bullish setup.
GLMR buy and hold — a big move could be coming soon!
#BTC Price Analysis# #Macro Insights# #Altcoin Season# #Meme Alpha# #BNBChain#
After a prolonged period of selling pressure and consolidation, GLMR is approaching an important technical area that could determine its next major direction.
The price is attempting to break above a descending trendline while building a stronger base around its recent support zone.
A confirmed breakout above $0.1994 could open the door toward $0.2329, followed by $0.3227 if bullish momentum continues.
If buyers maintain control and trading volume increases, the larger upside target around $0.4484 could come into focus.
The key is holding support near $0.1752. Losing this level could weaken the bullish setup.
GLMR buy and hold — a big move could be coming soon!
#BTC Price Analysis# #Macro Insights# #Altcoin Season# #Meme Alpha# #BNBChain#
76
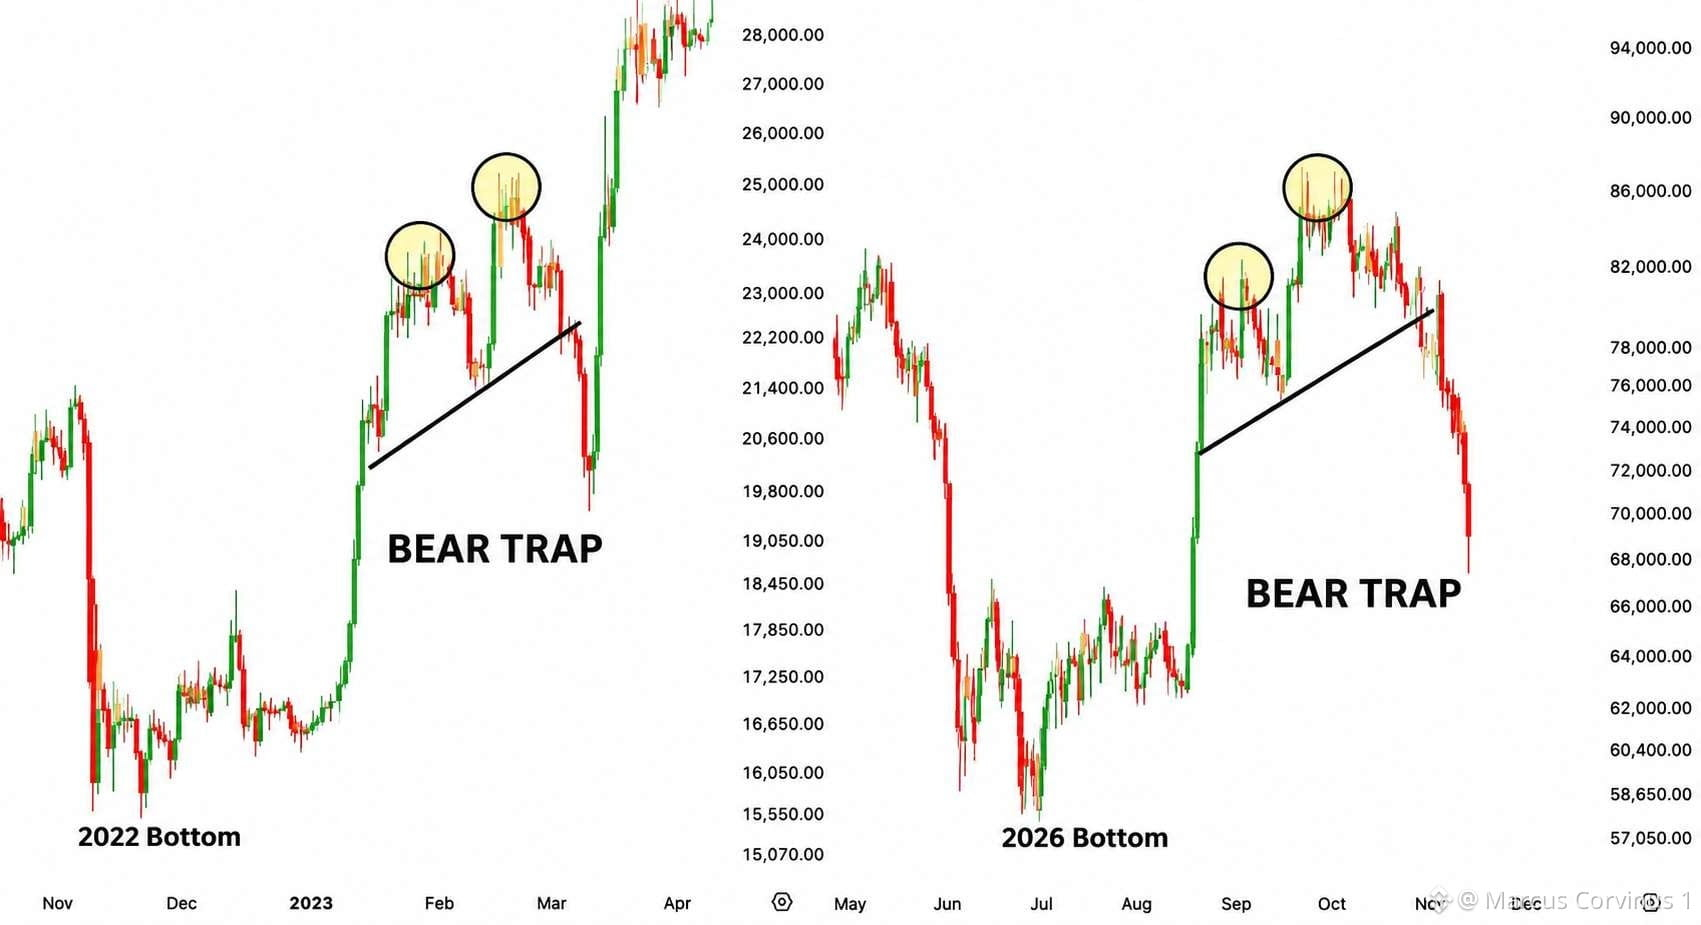
$BTC Could Be Setting Up a MASSIVE BEAR TRAP!
We might be witnessing the same pattern that shook the market in 2023.
Bitcoin broke key support, triggering panic selling and trapping traders on the bearish side.
Back in 2023, a similar breakdown was followed by a powerful bullish recovery.
Now the chart is showing striking similarities.
If history repeats, this could turn into one of the biggest bear traps of 2026.
The next BTC move could shock the entire market!
#BTC Price Analysis# #Macro Insights# #Altcoin Season# #Meme Alpha# #BNBChain#
$BTC Could Be Setting Up a MASSIVE BEAR TRAP!
We might be witnessing the same pattern that shook the market in 2023.
Bitcoin broke key support, triggering panic selling and trapping traders on the bearish side.
Back in 2023, a similar breakdown was followed by a powerful bullish recovery.
Now the chart is showing striking similarities.
If history repeats, this could turn into one of the biggest bear traps of 2026.
The next BTC move could shock the entire market!
#BTC Price Analysis# #Macro Insights# #Altcoin Season# #Meme Alpha# #BNBChain#
We might be witnessing the same pattern that shook the market in 2023.
Bitcoin broke key support, triggering panic selling and trapping traders on the bearish side.
Back in 2023, a similar breakdown was followed by a powerful bullish recovery.
Now the chart is showing striking similarities.
If history repeats, this could turn into one of the biggest bear traps of 2026.
The next BTC move could shock the entire market!
#BTC Price Analysis# #Macro Insights# #Altcoin Season# #Meme Alpha# #BNBChain#
50
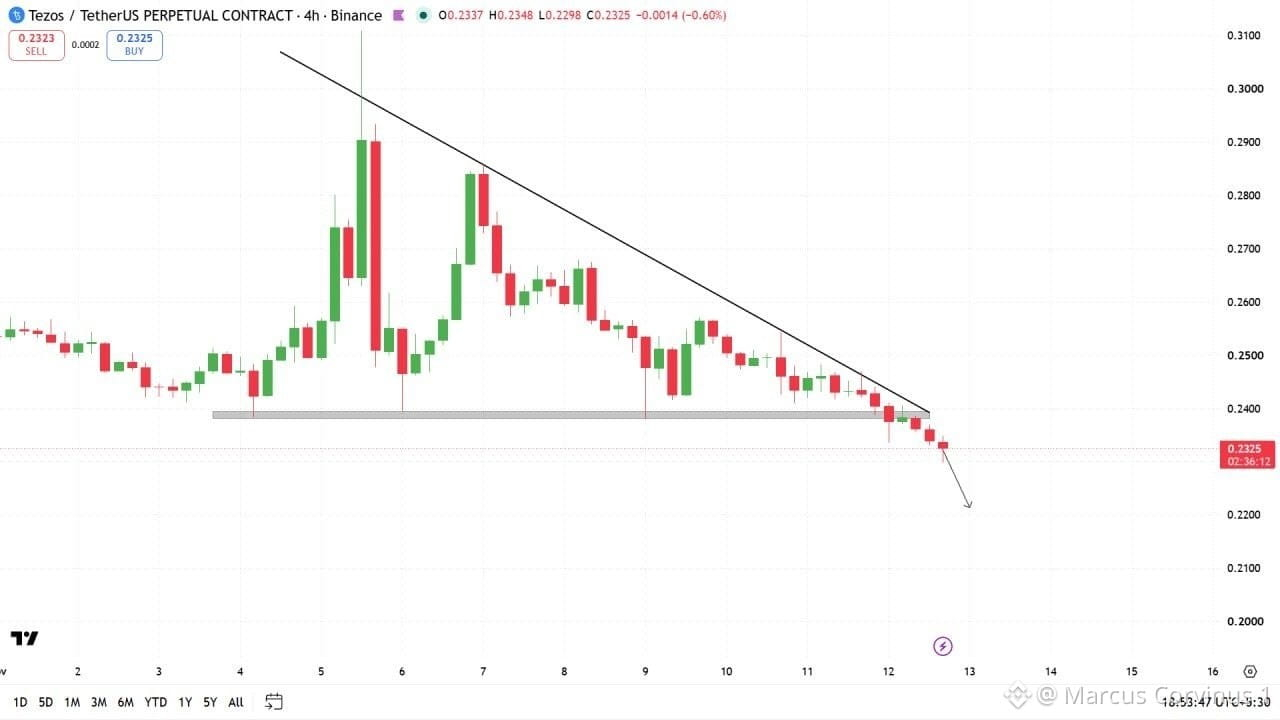
$XTZ could be heading into dangerous territory!
The breakdown has opened the door for a potential wave of downside momentum.
Market structure is weakening, with sellers appearing ready to take control.
Any weak recovery could turn into another selling opportunity.
A deeper correction may be approaching if bulls fail to defend current levels.
Watch XTZ closely. The next move could be brutal!
#BTC Price Analysis# #Macro Insights# #Altcoin Season# #Meme Alpha# #BNBChain#
$XTZ could be heading into dangerous territory!
The breakdown has opened the door for a potential wave of downside momentum.
Market structure is weakening, with sellers appearing ready to take control.
Any weak recovery could turn into another selling opportunity.
A deeper correction may be approaching if bulls fail to defend current levels.
Watch XTZ closely. The next move could be brutal!
#BTC Price Analysis# #Macro Insights# #Altcoin Season# #Meme Alpha# #BNBChain#
The breakdown has opened the door for a potential wave of downside momentum.
Market structure is weakening, with sellers appearing ready to take control.
Any weak recovery could turn into another selling opportunity.
A deeper correction may be approaching if bulls fail to defend current levels.
Watch XTZ closely. The next move could be brutal!
#BTC Price Analysis# #Macro Insights# #Altcoin Season# #Meme Alpha# #BNBChain#
75
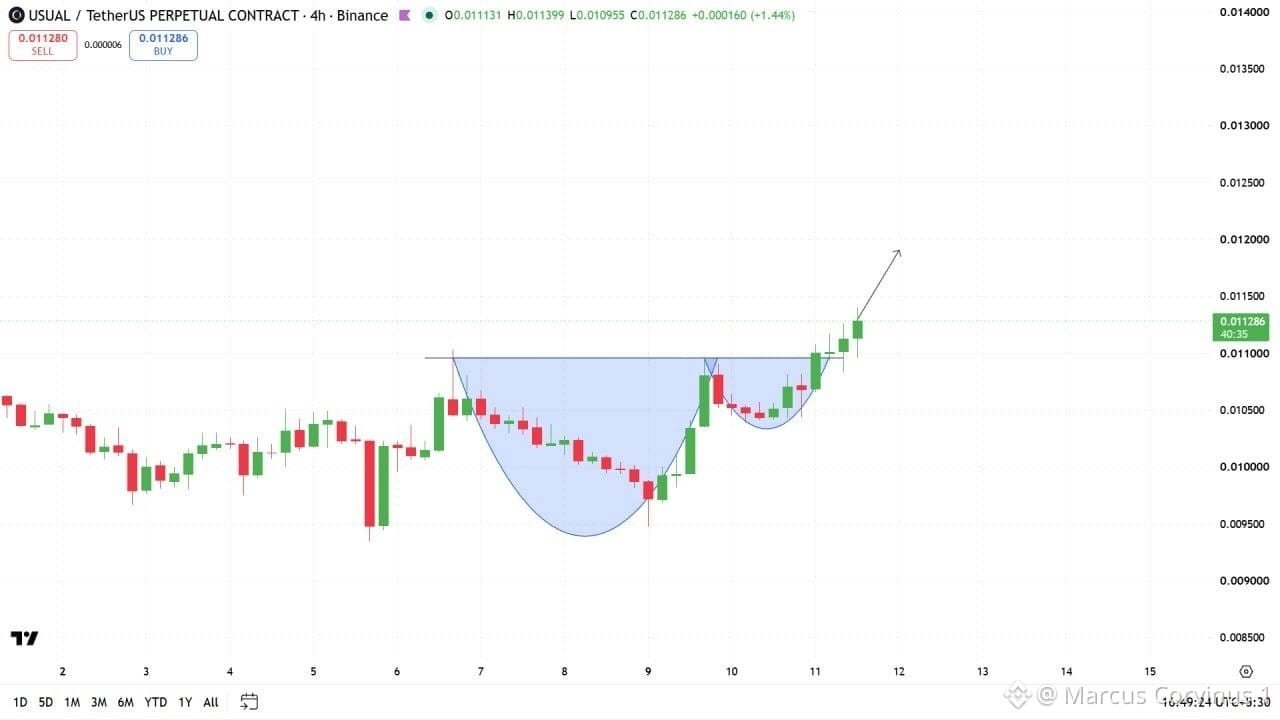
$USUAL is gaining strong bullish momentum after a clean breakout!
The chart shows a clear cup and handle formation, signaling a potential trend reversal.
Buyers are stepping in with strength, pushing the price above key resistance.
The breakout structure looks promising, with momentum building for another upward move.
If buyers maintain control, a massive pump could be around the corner.
Keep USUAL on your radar!
#BTC Price Analysis# #Macro Insights# #Altcoin Season# #Meme Alpha# #BNBChain#
$USUAL is gaining strong bullish momentum after a clean breakout!
The chart shows a clear cup and handle formation, signaling a potential trend reversal.
Buyers are stepping in with strength, pushing the price above key resistance.
The breakout structure looks promising, with momentum building for another upward move.
If buyers maintain control, a massive pump could be around the corner.
Keep USUAL on your radar!
#BTC Price Analysis# #Macro Insights# #Altcoin Season# #Meme Alpha# #BNBChain#
The chart shows a clear cup and handle formation, signaling a potential trend reversal.
Buyers are stepping in with strength, pushing the price above key resistance.
The breakout structure looks promising, with momentum building for another upward move.
If buyers maintain control, a massive pump could be around the corner.
Keep USUAL on your radar!
#BTC Price Analysis# #Macro Insights# #Altcoin Season# #Meme Alpha# #BNBChain#
59
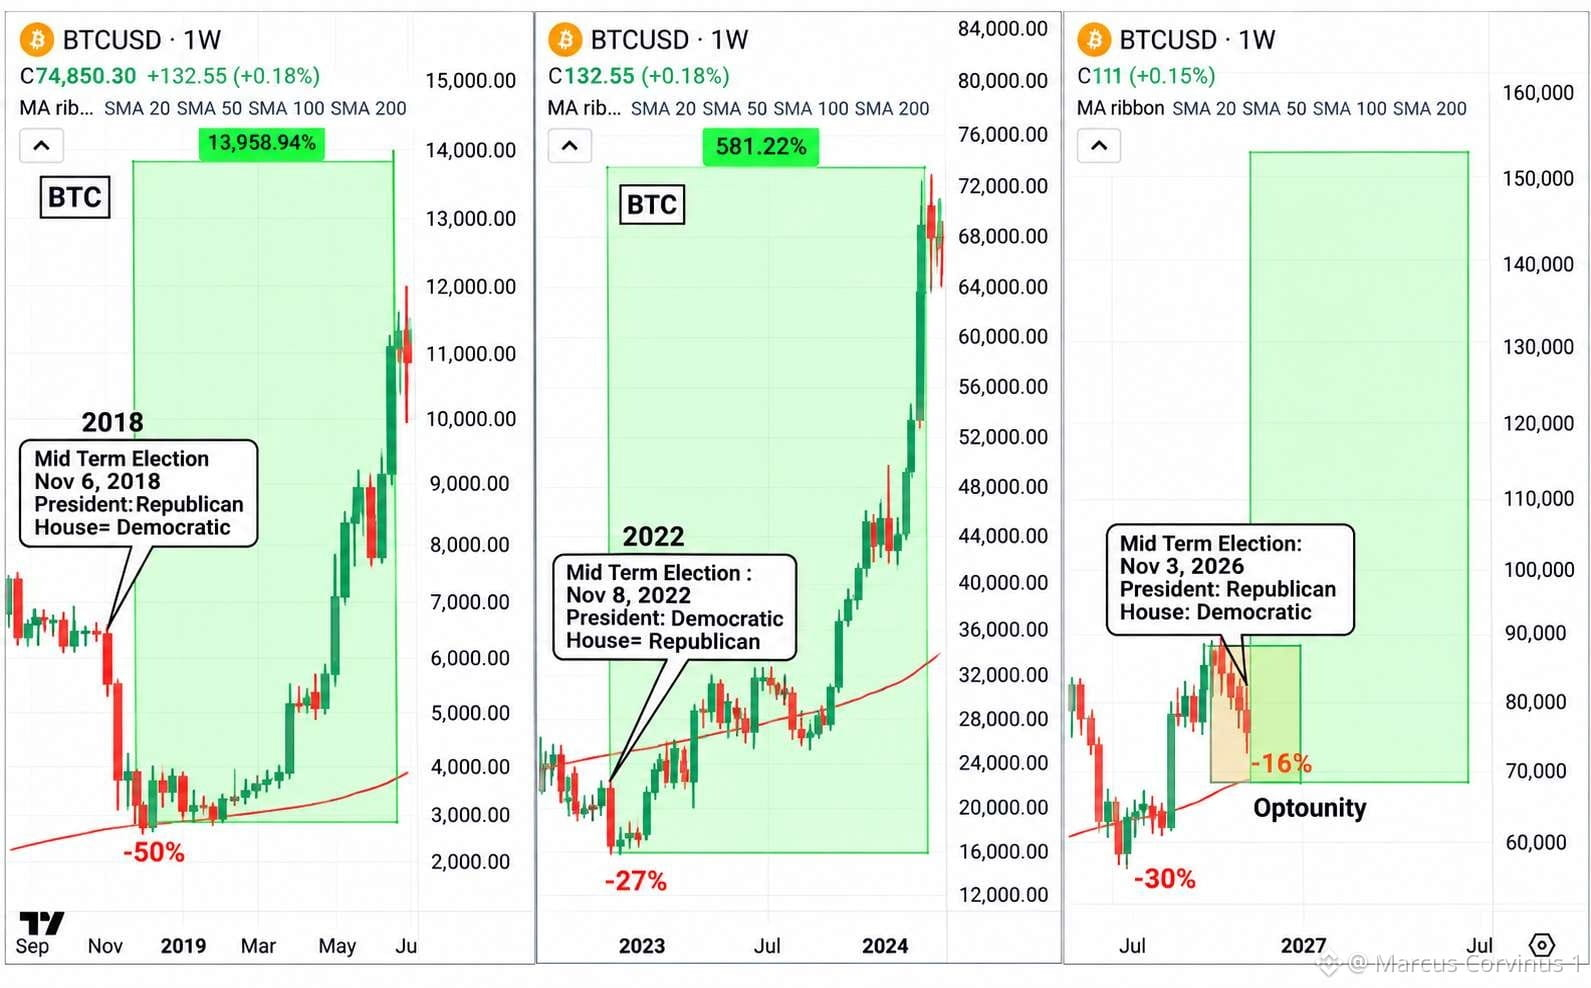
$BTC to $200,000 could be closer than most people think.
History suggests that midterm election panic could create one of the biggest buying opportunities before the next explosive Bitcoin rally.
In 2018, BTC crashed from $6,000 to nearly $3,200.
Three years later, Bitcoin reached $69,000, rewarding investors who accumulated during extreme fear.
In 2022, BTC dropped from $21,000 to around $16,000.
The following cycle eventually pushed Bitcoin beyond $120,000.
Now 2026 is bringing another wave of market uncertainty, selling pressure, and election-related fear.
But history suggests these painful periods can create opportunities for patient investors.
Buying BTC at $75,000 or $65,000 could look like an incredible opportunity if Bitcoin eventually reaches $200,000.
The biggest gains often begin when market confidence is at its lowest.
A move toward $200,000 is not guaranteed, but the long-term bullish scenario remains worth watching.
The next parabolic move could surprise everyone.
Fear dominates today. Opportunity could define tomorrow.
#BTC Price Analysis# #Macro Insights# #Altcoin Season# #Meme Alpha# #BNBChain#
$BTC to $200,000 could be closer than most people think.
History suggests that midterm election panic could create one of the biggest buying opportunities before the next explosive Bitcoin rally.
In 2018, BTC crashed from $6,000 to nearly $3,200.
Three years later, Bitcoin reached $69,000, rewarding investors who accumulated during extreme fear.
In 2022, BTC dropped from $21,000 to around $16,000.
The following cycle eventually pushed Bitcoin beyond $120,000.
Now 2026 is bringing another wave of market uncertainty, selling pressure, and election-related fear.
But history suggests these painful periods can create opportunities for patient investors.
Buying BTC at $75,000 or $65,000 could look like an incredible opportunity if Bitcoin eventually reaches $200,000.
The biggest gains often begin when market confidence is at its lowest.
A move toward $200,000 is not guaranteed, but the long-term bullish scenario remains worth watching.
The next parabolic move could surprise everyone.
Fear dominates today. Opportunity could define tomorrow.
#BTC Price Analysis# #Macro Insights# #Altcoin Season# #Meme Alpha# #BNBChain#
History suggests that midterm election panic could create one of the biggest buying opportunities before the next explosive Bitcoin rally.
In 2018, BTC crashed from $6,000 to nearly $3,200.
Three years later, Bitcoin reached $69,000, rewarding investors who accumulated during extreme fear.
In 2022, BTC dropped from $21,000 to around $16,000.
The following cycle eventually pushed Bitcoin beyond $120,000.
Now 2026 is bringing another wave of market uncertainty, selling pressure, and election-related fear.
But history suggests these painful periods can create opportunities for patient investors.
Buying BTC at $75,000 or $65,000 could look like an incredible opportunity if Bitcoin eventually reaches $200,000.
The biggest gains often begin when market confidence is at its lowest.
A move toward $200,000 is not guaranteed, but the long-term bullish scenario remains worth watching.
The next parabolic move could surprise everyone.
Fear dominates today. Opportunity could define tomorrow.
#BTC Price Analysis# #Macro Insights# #Altcoin Season# #Meme Alpha# #BNBChain#
66
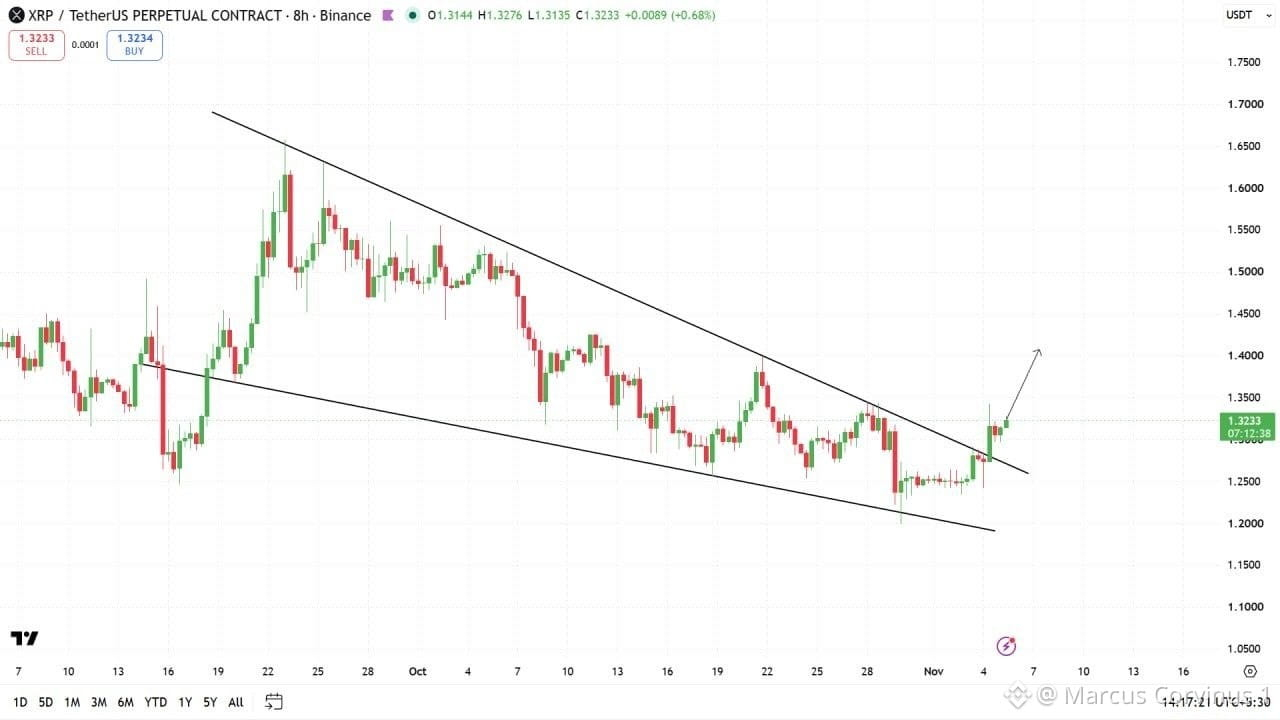
$XRP is gaining bullish momentum after breaking out of a descending channel!
After weeks of selling pressure, buyers are finally showing strength.
The breakout signals a potential trend reversal as XRP pushes above its declining resistance.
Price is holding around $1.32, with $1.35 acting as immediate resistance.
A strong move above $1.35 could open the door toward $1.40.
If bulls successfully defend the breakout zone, momentum could accelerate further.
XRP could be preparing for a powerful upside move. Keep watching closely!
#BTC Price Analysis# #Macro Insights# #Altcoin Season# #Meme Alpha# #BNBChain#
$XRP is gaining bullish momentum after breaking out of a descending channel!
After weeks of selling pressure, buyers are finally showing strength.
The breakout signals a potential trend reversal as XRP pushes above its declining resistance.
Price is holding around $1.32, with $1.35 acting as immediate resistance.
A strong move above $1.35 could open the door toward $1.40.
If bulls successfully defend the breakout zone, momentum could accelerate further.
XRP could be preparing for a powerful upside move. Keep watching closely!
#BTC Price Analysis# #Macro Insights# #Altcoin Season# #Meme Alpha# #BNBChain#
After weeks of selling pressure, buyers are finally showing strength.
The breakout signals a potential trend reversal as XRP pushes above its declining resistance.
Price is holding around $1.32, with $1.35 acting as immediate resistance.
A strong move above $1.35 could open the door toward $1.40.
If bulls successfully defend the breakout zone, momentum could accelerate further.
XRP could be preparing for a powerful upside move. Keep watching closely!
#BTC Price Analysis# #Macro Insights# #Altcoin Season# #Meme Alpha# #BNBChain#
66
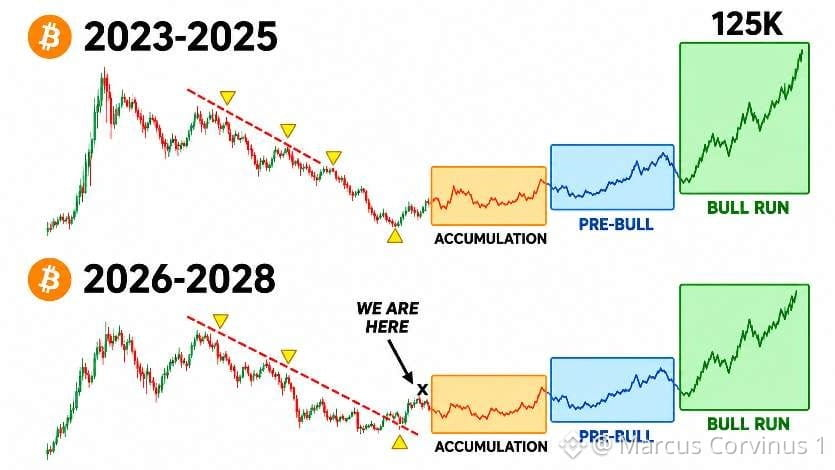
$BTC could be preparing for another massive bull run!
Bitcoin's projected 2026–2028 cycle is showing striking similarities to the previous market structure.
A prolonged downtrend, potential breakout, and accumulation phase could be setting the stage for something huge.
The chart suggests Bitcoin may be approaching a critical transition before its next major market phase.
First comes accumulation, then pre-bull momentum, followed by a possible explosive rally.
The previous cycle pushed Bitcoin toward $125K. Could the next cycle deliver an even bigger move?
History doesn't guarantee a repeat, but this setup is worth watching closely.
The next major opportunity could be forming while the market remains uncertain.
#BTC Price Analysis# #Macro Insights# #Altcoin Season# #Meme Alpha# #BNBChain#
$BTC could be preparing for another massive bull run!
Bitcoin's projected 2026–2028 cycle is showing striking similarities to the previous market structure.
A prolonged downtrend, potential breakout, and accumulation phase could be setting the stage for something huge.
The chart suggests Bitcoin may be approaching a critical transition before its next major market phase.
First comes accumulation, then pre-bull momentum, followed by a possible explosive rally.
The previous cycle pushed Bitcoin toward $125K. Could the next cycle deliver an even bigger move?
History doesn't guarantee a repeat, but this setup is worth watching closely.
The next major opportunity could be forming while the market remains uncertain.
#BTC Price Analysis# #Macro Insights# #Altcoin Season# #Meme Alpha# #BNBChain#
Bitcoin's projected 2026–2028 cycle is showing striking similarities to the previous market structure.
A prolonged downtrend, potential breakout, and accumulation phase could be setting the stage for something huge.
The chart suggests Bitcoin may be approaching a critical transition before its next major market phase.
First comes accumulation, then pre-bull momentum, followed by a possible explosive rally.
The previous cycle pushed Bitcoin toward $125K. Could the next cycle deliver an even bigger move?
History doesn't guarantee a repeat, but this setup is worth watching closely.
The next major opportunity could be forming while the market remains uncertain.
#BTC Price Analysis# #Macro Insights# #Altcoin Season# #Meme Alpha# #BNBChain#
66
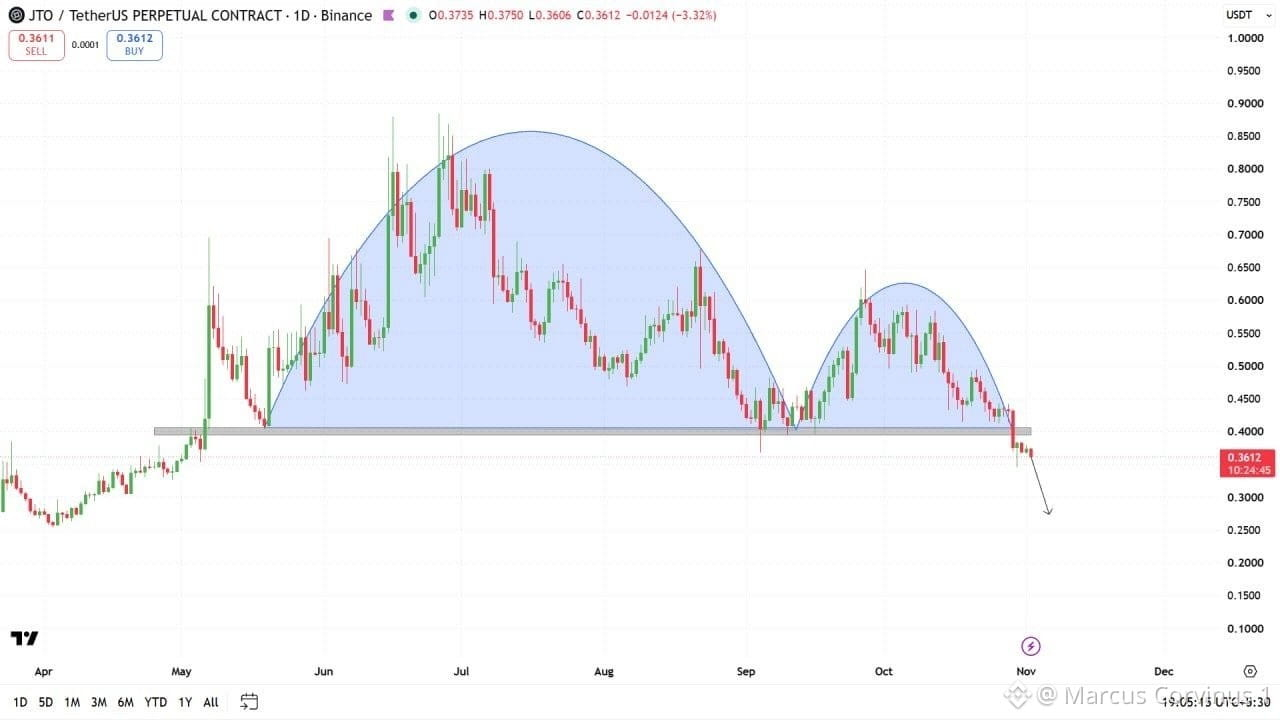
$JTO is flashing strong bearish signals!
A major breakdown has appeared on the daily chart after two rounded tops formed, showing clear weakness in the market.
The crucial $0.40 support zone has been broken, and sellers are starting to dominate.
With price hovering around $0.3612, bulls need a strong recovery to regain control.
If $JTO fails to reclaim its broken support, another aggressive sell-off could be ahead.
The bearish structure is clear. Keep $JTO on your radar!
#BTC Price Analysis# #Macro Insights# #Altcoin Season# #BNBChain# #BNBChain#
$JTO is flashing strong bearish signals!
A major breakdown has appeared on the daily chart after two rounded tops formed, showing clear weakness in the market.
The crucial $0.40 support zone has been broken, and sellers are starting to dominate.
With price hovering around $0.3612, bulls need a strong recovery to regain control.
If $JTO fails to reclaim its broken support, another aggressive sell-off could be ahead.
The bearish structure is clear. Keep $JTO on your radar!
#BTC Price Analysis# #Macro Insights# #Altcoin Season# #BNBChain# #BNBChain#
A major breakdown has appeared on the daily chart after two rounded tops formed, showing clear weakness in the market.
The crucial $0.40 support zone has been broken, and sellers are starting to dominate.
With price hovering around $0.3612, bulls need a strong recovery to regain control.
If $JTO fails to reclaim its broken support, another aggressive sell-off could be ahead.
The bearish structure is clear. Keep $JTO on your radar!
#BTC Price Analysis# #Macro Insights# #Altcoin Season# #BNBChain# #BNBChain#
52
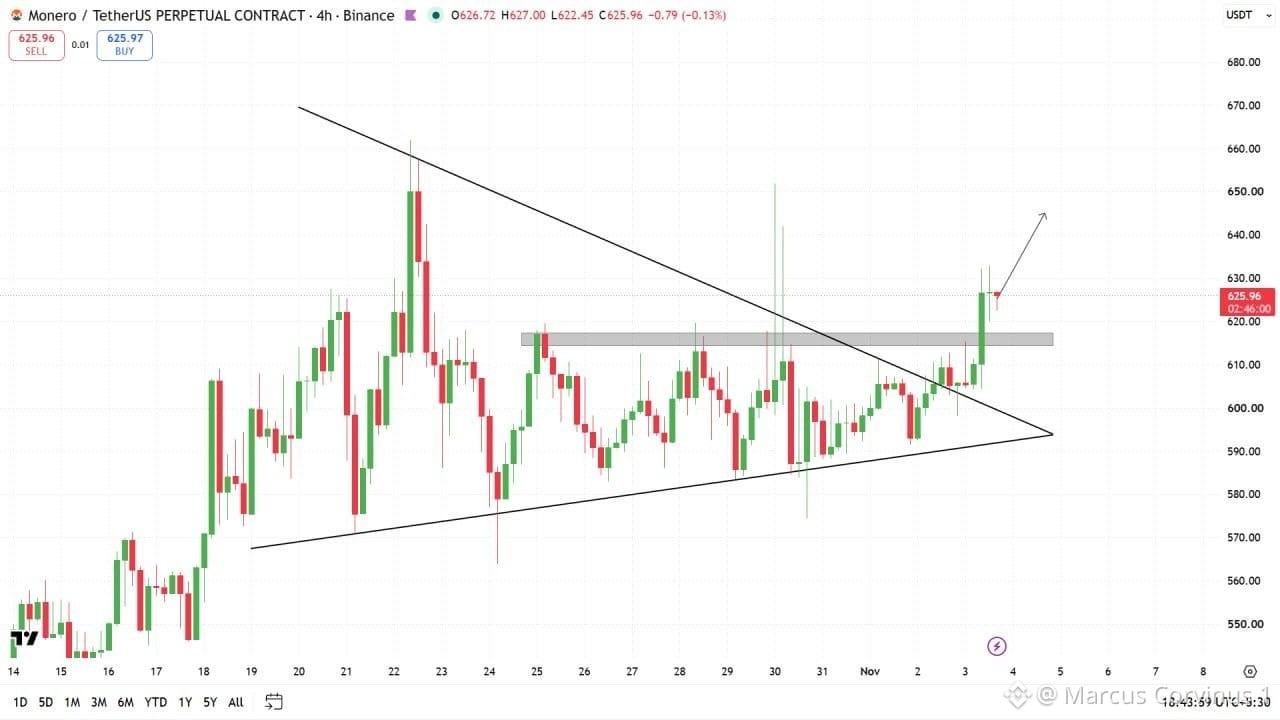
$XMR is making a powerful move, and the bulls are stepping up!
After spending several days trapped inside a tightening triangle, Monero has finally pushed through the upper boundary with strong buying pressure.
The breakout above $615 has changed the short-term market structure, with price now pushing toward $630.
What makes this setup interesting is the breakout from both trendline resistance and a major horizontal supply zone.
As long as buyers defend the $615–$620 region, the bullish momentum could extend toward $640–$650.
A strong 4H close above $630 would add further confirmation, while losing $615 could signal a failed breakout.
The consolidation phase may be ending, and XMR could be preparing for its next explosive leg higher.
#BTC Price Analysis# #Macro Insights# #Altcoin Season# #Meme Alpha# #BNBChain#
$XMR is making a powerful move, and the bulls are stepping up!
After spending several days trapped inside a tightening triangle, Monero has finally pushed through the upper boundary with strong buying pressure.
The breakout above $615 has changed the short-term market structure, with price now pushing toward $630.
What makes this setup interesting is the breakout from both trendline resistance and a major horizontal supply zone.
As long as buyers defend the $615–$620 region, the bullish momentum could extend toward $640–$650.
A strong 4H close above $630 would add further confirmation, while losing $615 could signal a failed breakout.
The consolidation phase may be ending, and XMR could be preparing for its next explosive leg higher.
#BTC Price Analysis# #Macro Insights# #Altcoin Season# #Meme Alpha# #BNBChain#
After spending several days trapped inside a tightening triangle, Monero has finally pushed through the upper boundary with strong buying pressure.
The breakout above $615 has changed the short-term market structure, with price now pushing toward $630.
What makes this setup interesting is the breakout from both trendline resistance and a major horizontal supply zone.
As long as buyers defend the $615–$620 region, the bullish momentum could extend toward $640–$650.
A strong 4H close above $630 would add further confirmation, while losing $615 could signal a failed breakout.
The consolidation phase may be ending, and XMR could be preparing for its next explosive leg higher.
#BTC Price Analysis# #Macro Insights# #Altcoin Season# #Meme Alpha# #BNBChain#
71
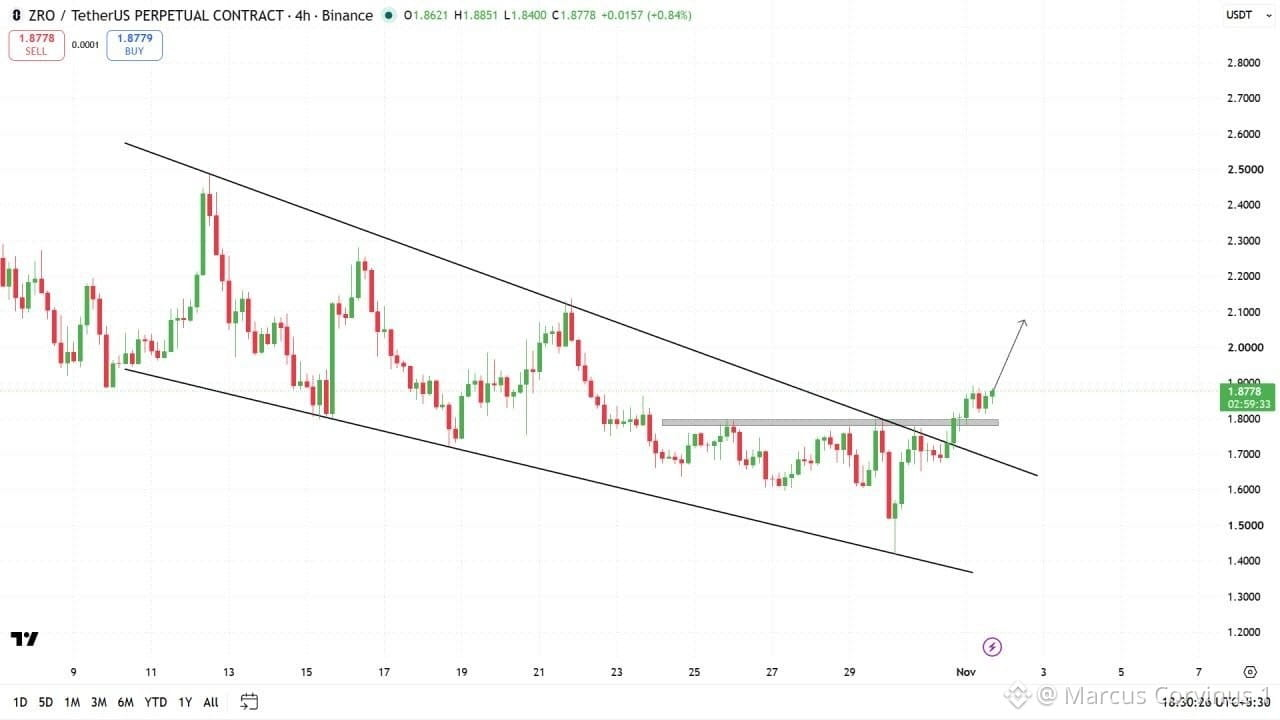
$ZRO is setting up for an exciting move!
After weeks of downward pressure, the chart is finally showing signs of strength.
A clean escape from the falling trendline has opened the door for a fresh upward expansion.
The recent surge toward $1.88 suggests buyers are becoming more aggressive.
The $1.75–$1.80 area is now an important zone to watch for continued strength.
If demand stays strong, price could challenge $1.95 before attempting the $2.10 region.
Momentum is building, and the next few 4H candles could be crucial.
ZRO might be entering a new bullish phase. Watch closely!
#BTC Price Analysis# #Macro Insights# #Altcoin Season# #Meme Alpha# #BNBChain#
$ZRO is setting up for an exciting move!
After weeks of downward pressure, the chart is finally showing signs of strength.
A clean escape from the falling trendline has opened the door for a fresh upward expansion.
The recent surge toward $1.88 suggests buyers are becoming more aggressive.
The $1.75–$1.80 area is now an important zone to watch for continued strength.
If demand stays strong, price could challenge $1.95 before attempting the $2.10 region.
Momentum is building, and the next few 4H candles could be crucial.
ZRO might be entering a new bullish phase. Watch closely!
#BTC Price Analysis# #Macro Insights# #Altcoin Season# #Meme Alpha# #BNBChain#
After weeks of downward pressure, the chart is finally showing signs of strength.
A clean escape from the falling trendline has opened the door for a fresh upward expansion.
The recent surge toward $1.88 suggests buyers are becoming more aggressive.
The $1.75–$1.80 area is now an important zone to watch for continued strength.
If demand stays strong, price could challenge $1.95 before attempting the $2.10 region.
Momentum is building, and the next few 4H candles could be crucial.
ZRO might be entering a new bullish phase. Watch closely!
#BTC Price Analysis# #Macro Insights# #Altcoin Season# #Meme Alpha# #BNBChain#
51
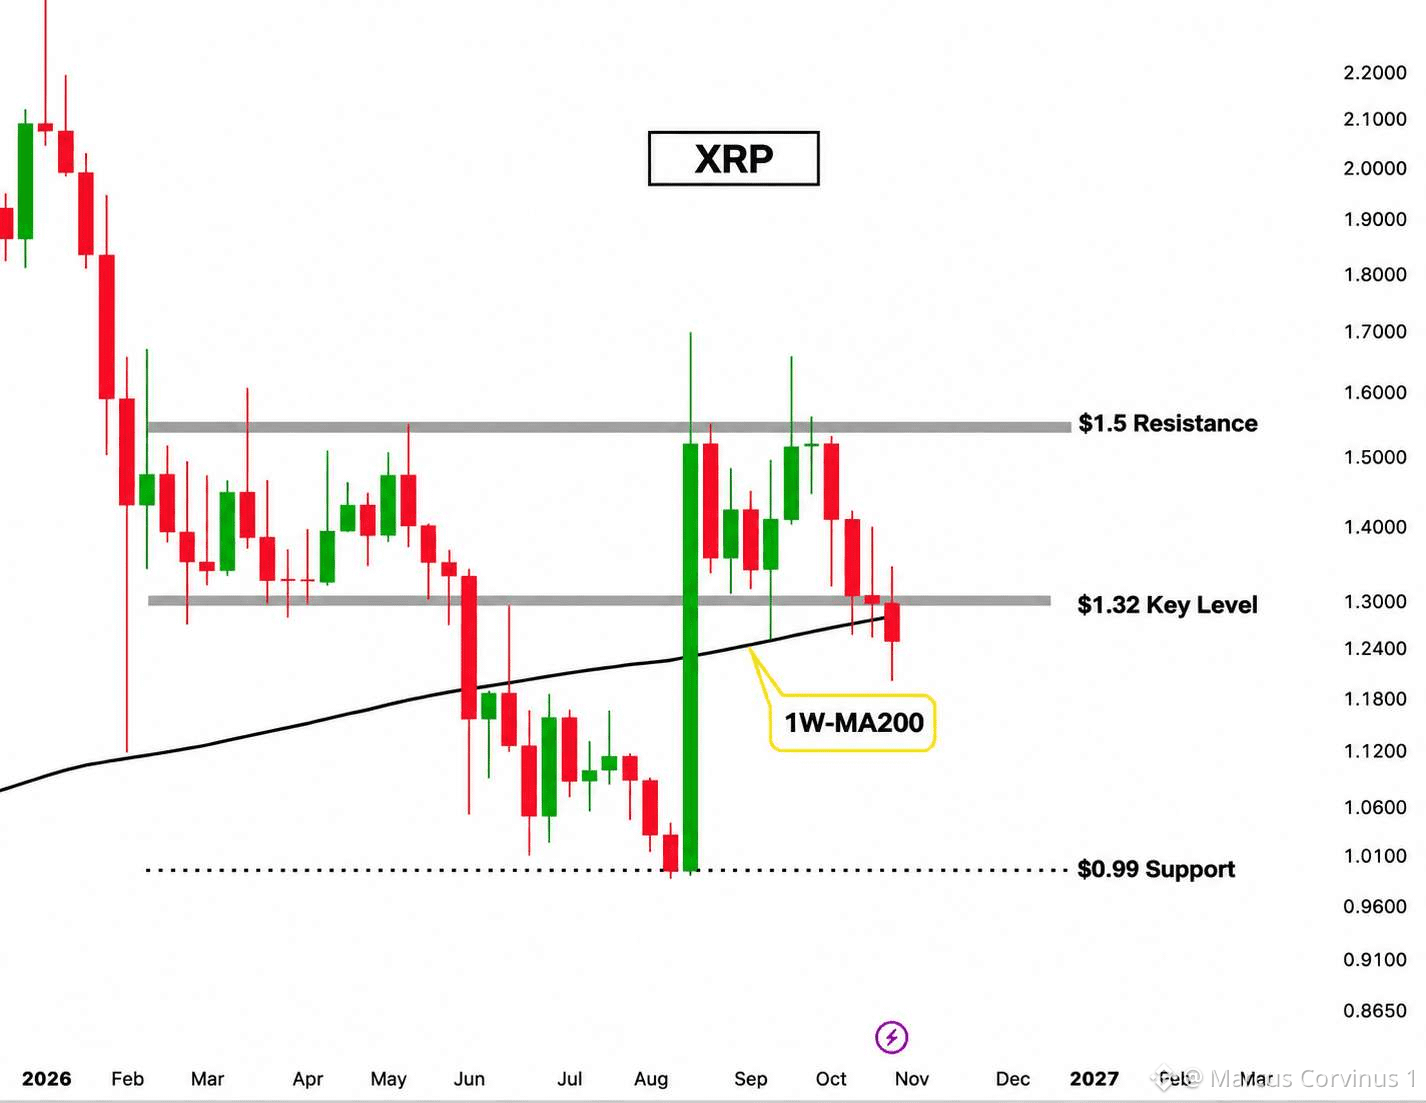
$XRP is facing a critical moment on the weekly chart!
Price is trapped between $0.99 support and $1.50 resistance, but the latest technical development is raising serious concerns.
After reclaiming the 1W MA200 in August, XRP has slipped below this important moving average once again. This puts the bullish structure under pressure.
The $1.32 level is now the battlefield. Bulls must reclaim this zone and secure a weekly close above it to regain momentum.
Failure to recover $1.32 could invite stronger selling pressure, potentially pushing XRP toward the major $0.99 support.
A successful breakout above $1.32 could shift attention back toward the $1.50 resistance zone.
The next weekly close could be crucial for XRP's direction. Keep your eyes on these levels!
#BTC Price Analysis# #Macro Insights# #Altcoin Season# #Meme Alpha# #BNBChain#
$XRP is facing a critical moment on the weekly chart!
Price is trapped between $0.99 support and $1.50 resistance, but the latest technical development is raising serious concerns.
After reclaiming the 1W MA200 in August, XRP has slipped below this important moving average once again. This puts the bullish structure under pressure.
The $1.32 level is now the battlefield. Bulls must reclaim this zone and secure a weekly close above it to regain momentum.
Failure to recover $1.32 could invite stronger selling pressure, potentially pushing XRP toward the major $0.99 support.
A successful breakout above $1.32 could shift attention back toward the $1.50 resistance zone.
The next weekly close could be crucial for XRP's direction. Keep your eyes on these levels!
#BTC Price Analysis# #Macro Insights# #Altcoin Season# #Meme Alpha# #BNBChain#
Price is trapped between $0.99 support and $1.50 resistance, but the latest technical development is raising serious concerns.
After reclaiming the 1W MA200 in August, XRP has slipped below this important moving average once again. This puts the bullish structure under pressure.
The $1.32 level is now the battlefield. Bulls must reclaim this zone and secure a weekly close above it to regain momentum.
Failure to recover $1.32 could invite stronger selling pressure, potentially pushing XRP toward the major $0.99 support.
A successful breakout above $1.32 could shift attention back toward the $1.50 resistance zone.
The next weekly close could be crucial for XRP's direction. Keep your eyes on these levels!
#BTC Price Analysis# #Macro Insights# #Altcoin Season# #Meme Alpha# #BNBChain#
53
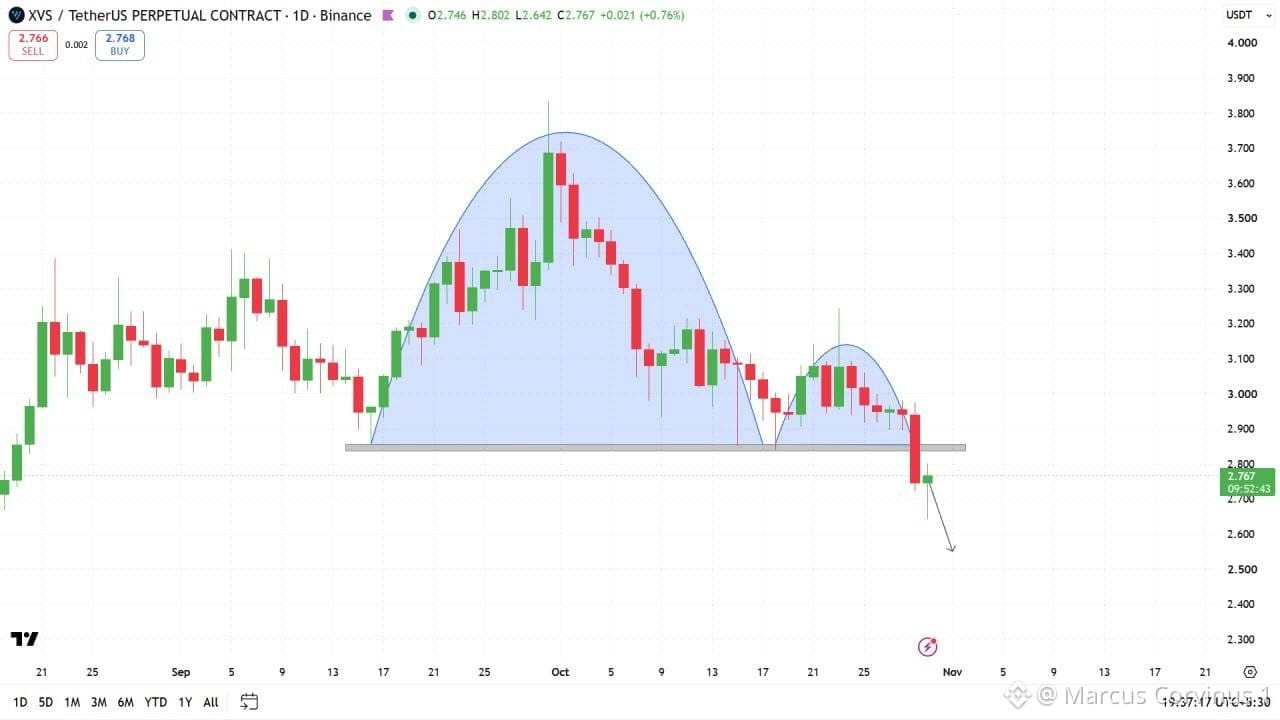
$XVS could be heading into a dangerous phase!
The recent price action reveals a clear loss of bullish strength, with sellers repeatedly rejecting attempts to move higher.
A major distribution pattern appears to have completed, and the latest sharp decline signals growing downside risk.
The $2.70 region is now worth monitoring. Losing this area could trigger another wave of liquidation toward $2.55 and $2.40.
Any short-term bounce may struggle to gain traction while the broader structure remains weak.
XVS is entering a critical zone. Watch for the next breakdown confirmation!
#BTC Price Analysis# #Macro Insights# #Altcoin Season# #Meme Alpha# #BNBChain#
$XVS could be heading into a dangerous phase!
The recent price action reveals a clear loss of bullish strength, with sellers repeatedly rejecting attempts to move higher.
A major distribution pattern appears to have completed, and the latest sharp decline signals growing downside risk.
The $2.70 region is now worth monitoring. Losing this area could trigger another wave of liquidation toward $2.55 and $2.40.
Any short-term bounce may struggle to gain traction while the broader structure remains weak.
XVS is entering a critical zone. Watch for the next breakdown confirmation!
#BTC Price Analysis# #Macro Insights# #Altcoin Season# #Meme Alpha# #BNBChain#
The recent price action reveals a clear loss of bullish strength, with sellers repeatedly rejecting attempts to move higher.
A major distribution pattern appears to have completed, and the latest sharp decline signals growing downside risk.
The $2.70 region is now worth monitoring. Losing this area could trigger another wave of liquidation toward $2.55 and $2.40.
Any short-term bounce may struggle to gain traction while the broader structure remains weak.
XVS is entering a critical zone. Watch for the next breakdown confirmation!
#BTC Price Analysis# #Macro Insights# #Altcoin Season# #Meme Alpha# #BNBChain#
43
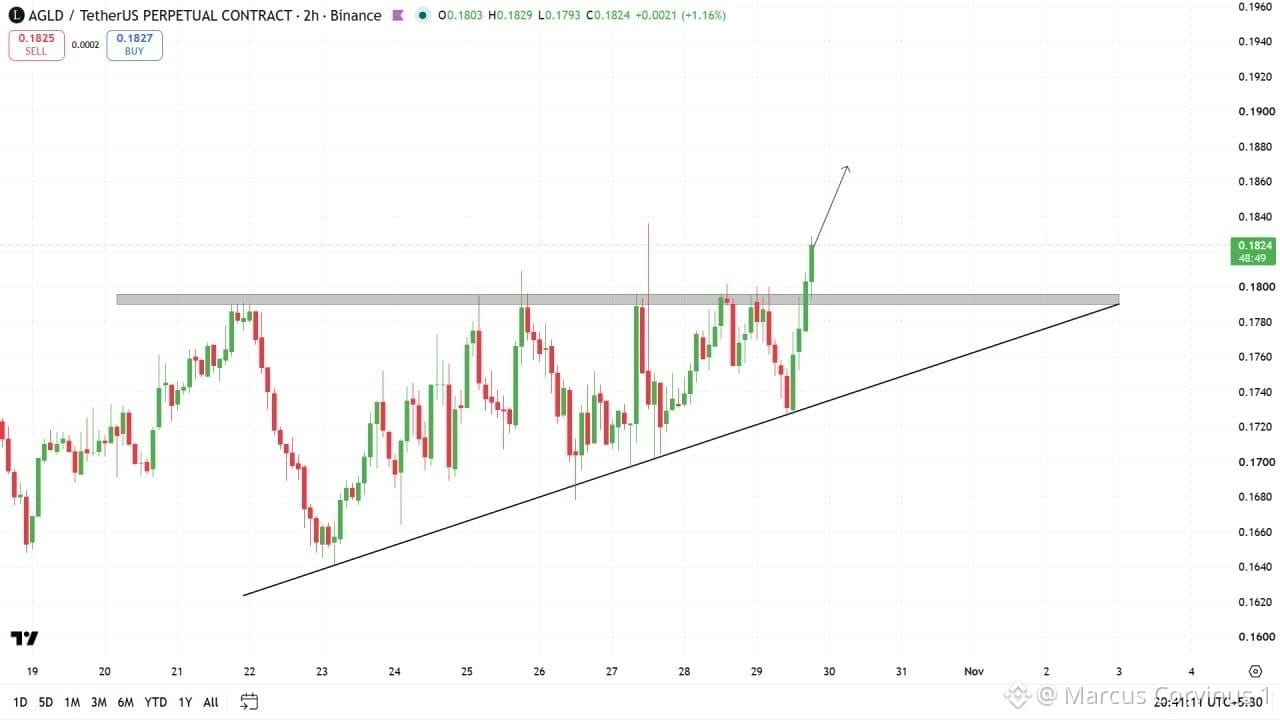
$AGLD could be preparing for its next explosive move!
The 2H chart is flashing an interesting signal as the market shifts away from its previous sideways movement.
Sellers struggled to push the price lower, while buyers gradually gained ground and eventually forced a move above the recent trading range.
The sudden upward expansion suggests growing demand, with $0.190 becoming a possible target if momentum continues.
I am watching whether the bulls can maintain this strength without giving back the recent gains.
A fresh wave of buying could make $AGLD one of the tokens to watch in the coming sessions.
#BTC Price Analysis# #Macro Insights# #Altcoin Season# #Meme Alpha# #BNBChain#
$AGLD could be preparing for its next explosive move!
The 2H chart is flashing an interesting signal as the market shifts away from its previous sideways movement.
Sellers struggled to push the price lower, while buyers gradually gained ground and eventually forced a move above the recent trading range.
The sudden upward expansion suggests growing demand, with $0.190 becoming a possible target if momentum continues.
I am watching whether the bulls can maintain this strength without giving back the recent gains.
A fresh wave of buying could make $AGLD one of the tokens to watch in the coming sessions.
#BTC Price Analysis# #Macro Insights# #Altcoin Season# #Meme Alpha# #BNBChain#
The 2H chart is flashing an interesting signal as the market shifts away from its previous sideways movement.
Sellers struggled to push the price lower, while buyers gradually gained ground and eventually forced a move above the recent trading range.
The sudden upward expansion suggests growing demand, with $0.190 becoming a possible target if momentum continues.
I am watching whether the bulls can maintain this strength without giving back the recent gains.
A fresh wave of buying could make $AGLD one of the tokens to watch in the coming sessions.
#BTC Price Analysis# #Macro Insights# #Altcoin Season# #Meme Alpha# #BNBChain#
68
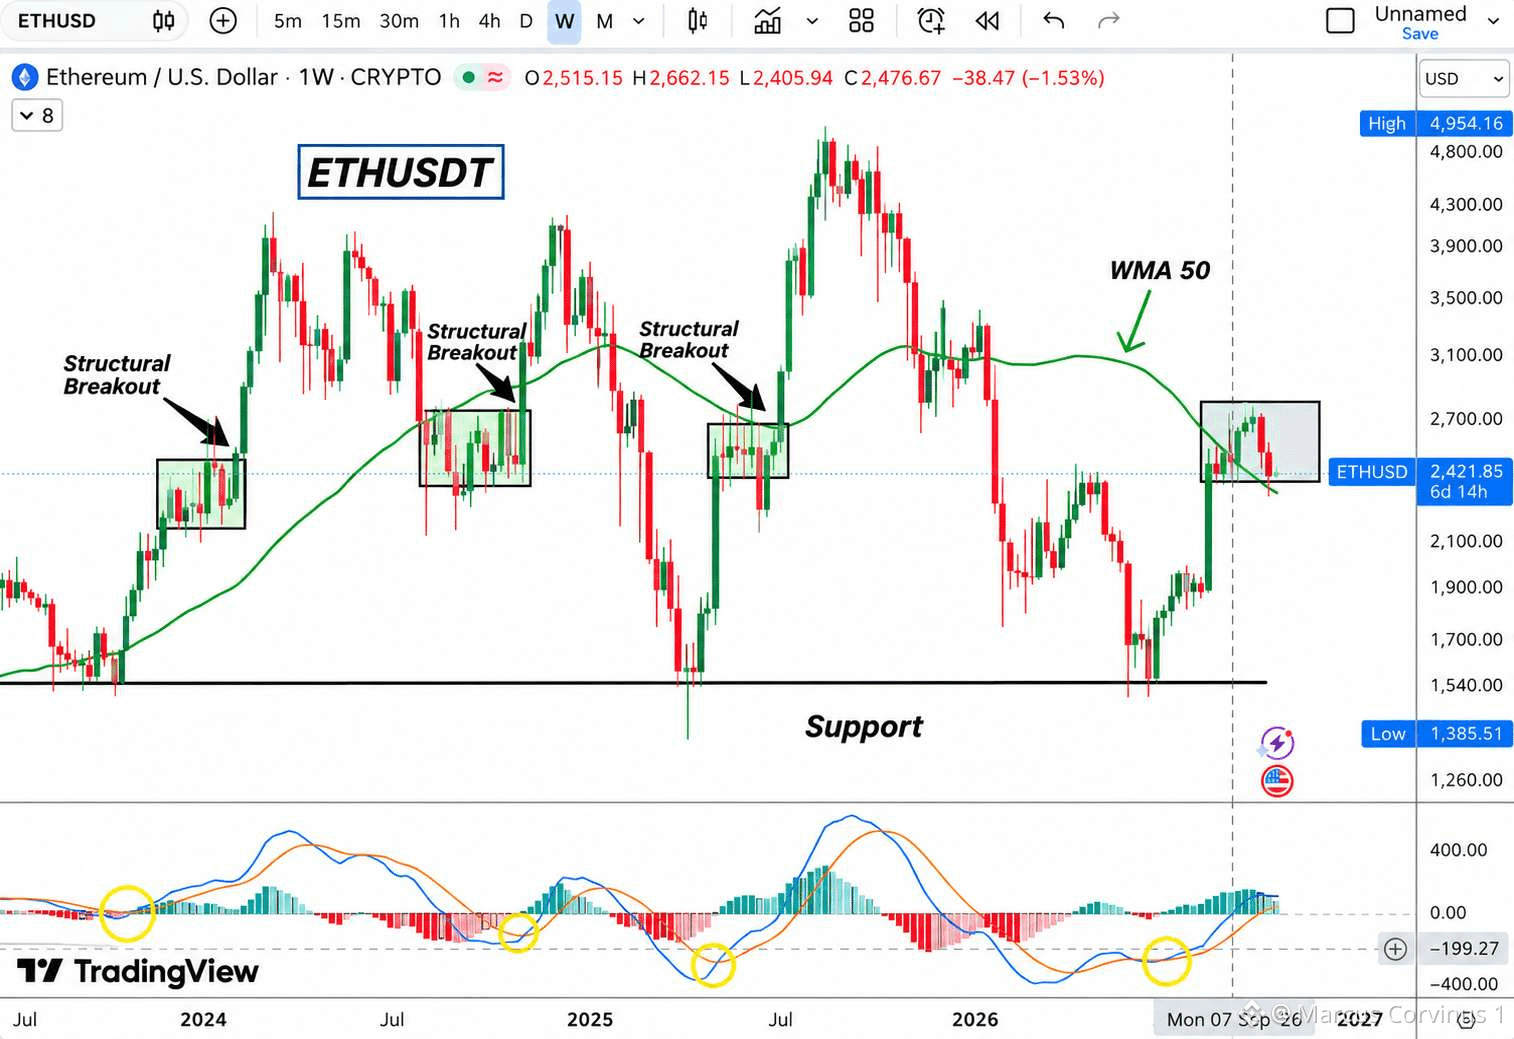
$ETH bulls aren't backing down just yet.
Despite a 5% weekly drop, Ethereum defended its 50-week moving average near $2,332, keeping the bullish structure alive.
ETH remains trapped between $2,300 and $2,800, but this range won't hold forever.
A push above $2,550 could open the door to $2,800, where the real breakout test begins.
Lose $2,300, though, and $1,900 becomes the next downside target.
Bulls still have the edge, but the next breakout will decide who truly controls the market.
#BTC Price Analysis# #Macro Insights# #Altcoin Season# #Meme Alpha# #BNBChain#
$ETH bulls aren't backing down just yet.
Despite a 5% weekly drop, Ethereum defended its 50-week moving average near $2,332, keeping the bullish structure alive.
ETH remains trapped between $2,300 and $2,800, but this range won't hold forever.
A push above $2,550 could open the door to $2,800, where the real breakout test begins.
Lose $2,300, though, and $1,900 becomes the next downside target.
Bulls still have the edge, but the next breakout will decide who truly controls the market.
#BTC Price Analysis# #Macro Insights# #Altcoin Season# #Meme Alpha# #BNBChain#
Despite a 5% weekly drop, Ethereum defended its 50-week moving average near $2,332, keeping the bullish structure alive.
ETH remains trapped between $2,300 and $2,800, but this range won't hold forever.
A push above $2,550 could open the door to $2,800, where the real breakout test begins.
Lose $2,300, though, and $1,900 becomes the next downside target.
Bulls still have the edge, but the next breakout will decide who truly controls the market.
#BTC Price Analysis# #Macro Insights# #Altcoin Season# #Meme Alpha# #BNBChain#
78
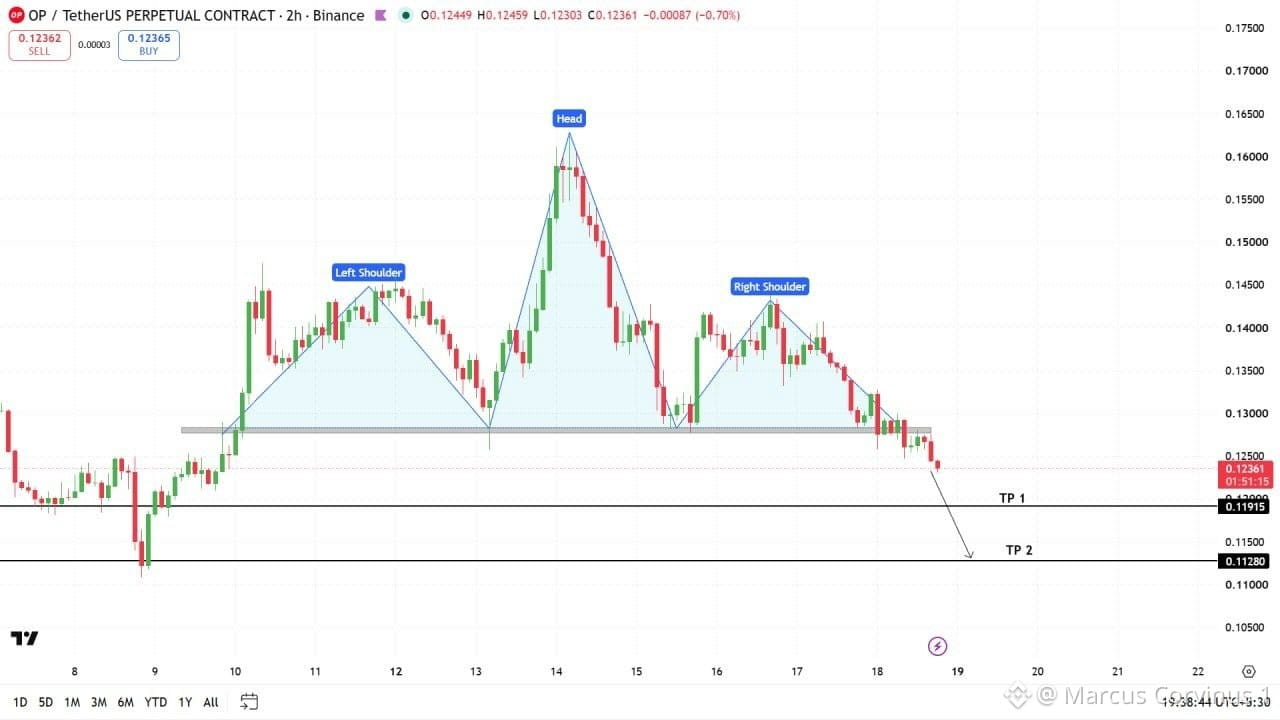
$OP is flashing serious bearish signals as the recent breakdown puts sellers in control.
The price has slipped below a key support zone, raising concerns about a deeper correction ahead.
Selling pressure is building, while buyers are struggling to regain momentum.
If the broken support turns into resistance, another sharp downward move could follow.
Lower support levels and liquidity zones are now becoming important targets to watch.
Any weak recovery could attract fresh selling pressure, making the next few candles crucial.
The market is entering a critical phase, and volatility could increase rapidly.
Keep a close eye on $OP as bears look ready to push the price even lower.
#BTC Price Analysis# #Macro Insights# #Altcoin Season# #Meme Alpha# #BNBChain#
$OP is flashing serious bearish signals as the recent breakdown puts sellers in control.
The price has slipped below a key support zone, raising concerns about a deeper correction ahead.
Selling pressure is building, while buyers are struggling to regain momentum.
If the broken support turns into resistance, another sharp downward move could follow.
Lower support levels and liquidity zones are now becoming important targets to watch.
Any weak recovery could attract fresh selling pressure, making the next few candles crucial.
The market is entering a critical phase, and volatility could increase rapidly.
Keep a close eye on $OP as bears look ready to push the price even lower.
#BTC Price Analysis# #Macro Insights# #Altcoin Season# #Meme Alpha# #BNBChain#
The price has slipped below a key support zone, raising concerns about a deeper correction ahead.
Selling pressure is building, while buyers are struggling to regain momentum.
If the broken support turns into resistance, another sharp downward move could follow.
Lower support levels and liquidity zones are now becoming important targets to watch.
Any weak recovery could attract fresh selling pressure, making the next few candles crucial.
The market is entering a critical phase, and volatility could increase rapidly.
Keep a close eye on $OP as bears look ready to push the price even lower.
#BTC Price Analysis# #Macro Insights# #Altcoin Season# #Meme Alpha# #BNBChain#
69
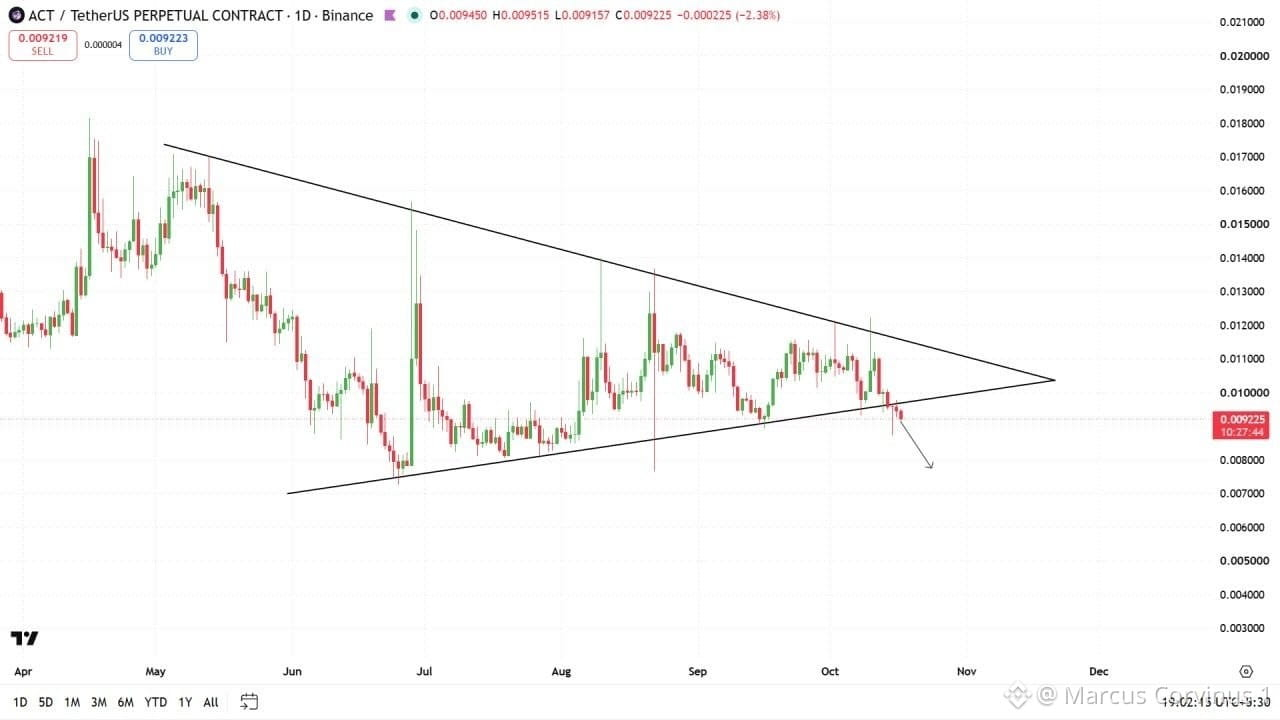
$ACT is showing serious bearish signals after a major breakdown, and the next move could catch traders off guard.
The price has broken below an important support level, suggesting that sellers are gaining strength while buyers struggle to regain control.
The market structure is turning increasingly bearish, raising concerns about another potential downward move.
• Support breakdown indicates growing selling pressure.
• Weak buying momentum suggests bulls are losing control.
• Failure to reclaim broken support could trigger further downside.
• The next major support zone may become the immediate target.
ACT is now entering a critical phase where a failed recovery could accelerate selling pressure.
If bearish momentum continues, another sharp decline could be approaching.
Traders should closely monitor price action and watch for confirmation before making their next move.
The breakdown is a warning. The next move could be even bigger.
#BTC Price Analysis# #Macro Insights# #Altcoin Season# #Meme Alpha# #BNBChain#
$ACT is showing serious bearish signals after a major breakdown, and the next move could catch traders off guard.
The price has broken below an important support level, suggesting that sellers are gaining strength while buyers struggle to regain control.
The market structure is turning increasingly bearish, raising concerns about another potential downward move.
• Support breakdown indicates growing selling pressure.
• Weak buying momentum suggests bulls are losing control.
• Failure to reclaim broken support could trigger further downside.
• The next major support zone may become the immediate target.
ACT is now entering a critical phase where a failed recovery could accelerate selling pressure.
If bearish momentum continues, another sharp decline could be approaching.
Traders should closely monitor price action and watch for confirmation before making their next move.
The breakdown is a warning. The next move could be even bigger.
#BTC Price Analysis# #Macro Insights# #Altcoin Season# #Meme Alpha# #BNBChain#
The price has broken below an important support level, suggesting that sellers are gaining strength while buyers struggle to regain control.
The market structure is turning increasingly bearish, raising concerns about another potential downward move.
• Support breakdown indicates growing selling pressure.
• Weak buying momentum suggests bulls are losing control.
• Failure to reclaim broken support could trigger further downside.
• The next major support zone may become the immediate target.
ACT is now entering a critical phase where a failed recovery could accelerate selling pressure.
If bearish momentum continues, another sharp decline could be approaching.
Traders should closely monitor price action and watch for confirmation before making their next move.
The breakdown is a warning. The next move could be even bigger.
#BTC Price Analysis# #Macro Insights# #Altcoin Season# #Meme Alpha# #BNBChain#
74
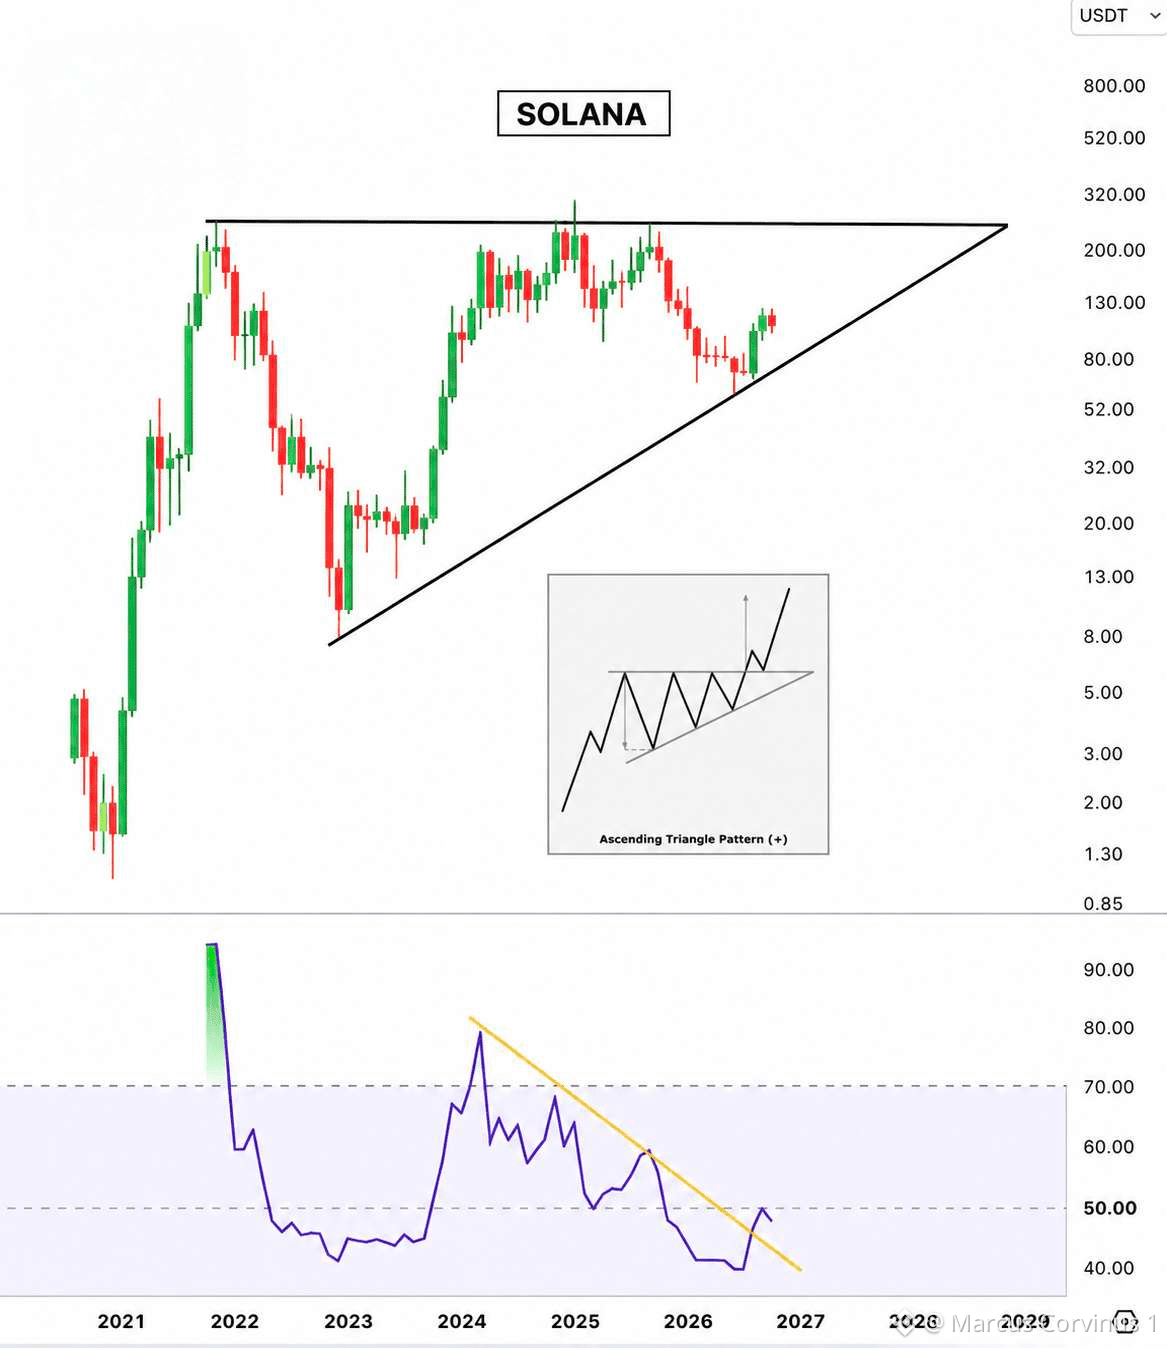
$SOL is forming a massive bullish ascending triangle on the monthly timeframe, and something big could be brewing!
After multiple attempts to break resistance, Solana continues to form higher lows while respecting its long-term ascending support trendline.
The major resistance zone sits around $250–$260, a critical level that could determine the next major move.
A confirmed monthly breakout above this zone could unleash strong bullish momentum, potentially opening the door toward $300–$350 and beyond.
Meanwhile, the monthly RSI is showing signs of recovery, with momentum attempting to break above its descending trendline.
This creates an interesting setup where both price action and momentum are approaching crucial breakout levels.
As long as the rising support holds, the broader bullish structure remains intact. However, losing that support could invalidate the setup.
If buyers successfully break resistance with strong volume, could enter a powerful new expansion phase.
The next major move could be closer than many expect!
#BTC Price Analysis# #Macro Insights# #Altcoin Season# #Meme Alpha# #BNBChain#
$SOL is forming a massive bullish ascending triangle on the monthly timeframe, and something big could be brewing!
After multiple attempts to break resistance, Solana continues to form higher lows while respecting its long-term ascending support trendline.
The major resistance zone sits around $250–$260, a critical level that could determine the next major move.
A confirmed monthly breakout above this zone could unleash strong bullish momentum, potentially opening the door toward $300–$350 and beyond.
Meanwhile, the monthly RSI is showing signs of recovery, with momentum attempting to break above its descending trendline.
This creates an interesting setup where both price action and momentum are approaching crucial breakout levels.
As long as the rising support holds, the broader bullish structure remains intact. However, losing that support could invalidate the setup.
If buyers successfully break resistance with strong volume, could enter a powerful new expansion phase.
The next major move could be closer than many expect!
#BTC Price Analysis# #Macro Insights# #Altcoin Season# #Meme Alpha# #BNBChain#
After multiple attempts to break resistance, Solana continues to form higher lows while respecting its long-term ascending support trendline.
The major resistance zone sits around $250–$260, a critical level that could determine the next major move.
A confirmed monthly breakout above this zone could unleash strong bullish momentum, potentially opening the door toward $300–$350 and beyond.
Meanwhile, the monthly RSI is showing signs of recovery, with momentum attempting to break above its descending trendline.
This creates an interesting setup where both price action and momentum are approaching crucial breakout levels.
As long as the rising support holds, the broader bullish structure remains intact. However, losing that support could invalidate the setup.
If buyers successfully break resistance with strong volume, could enter a powerful new expansion phase.
The next major move could be closer than many expect!
#BTC Price Analysis# #Macro Insights# #Altcoin Season# #Meme Alpha# #BNBChain#
79
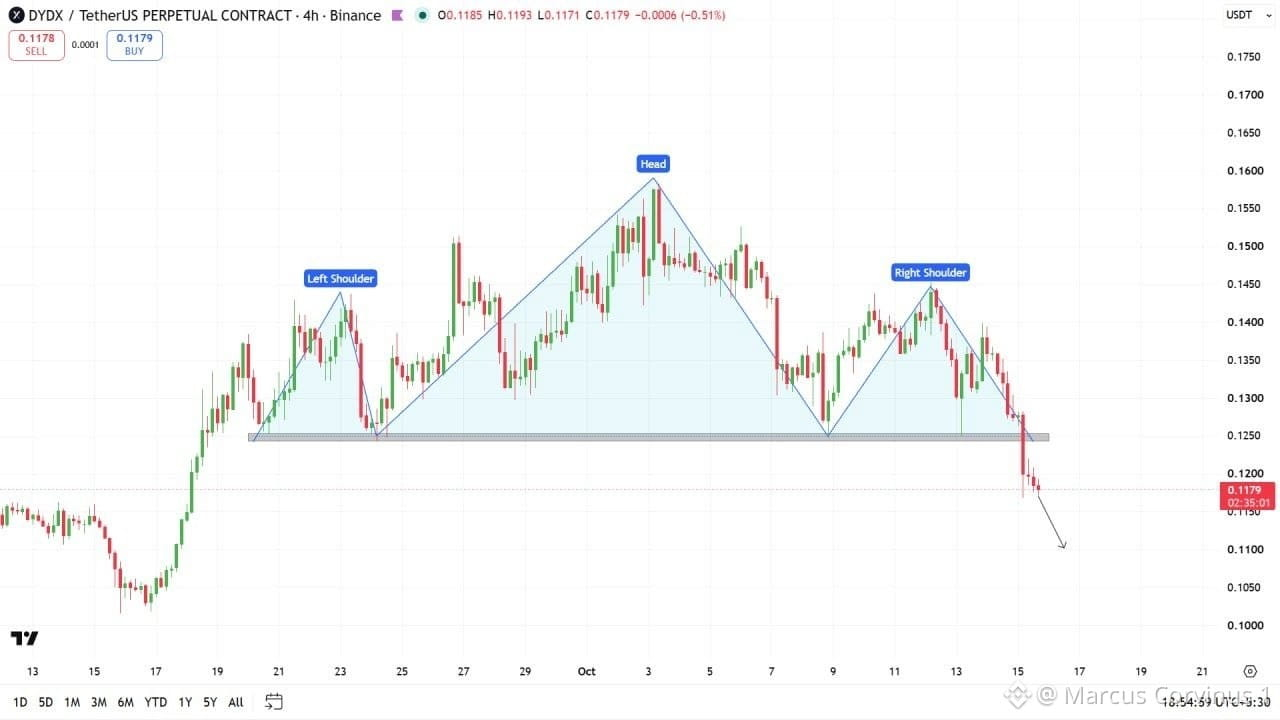
$DYDX is flashing serious bearish signals after a major breakdown!
The recent price action suggests that sellers are gaining control, and bearish momentum could intensify in the coming sessions.
The breakdown has weakened the market structure, putting DYDX in a vulnerable position as buyers struggle to regain momentum.
If the price fails to reclaim the broken support level, another wave of selling pressure could push DYDX toward lower demand zones.
Any short-term recovery might face strong resistance as traders look to exit positions near key levels.
The most critical factor now is whether buyers can defend the next support zone or whether bears will continue dominating the trend.
$DYDX could be approaching a decisive moment, and the next major move might catch unprepared traders off guard.
Keep your eyes on $DYDX. The bearish setup is developing, and the next breakdown could bring even stronger volatility!
#BTC Price Analysis# #Macro Insights# #Altcoin Season# #Meme Alpha# #BNBChain#
$DYDX is flashing serious bearish signals after a major breakdown!
The recent price action suggests that sellers are gaining control, and bearish momentum could intensify in the coming sessions.
The breakdown has weakened the market structure, putting DYDX in a vulnerable position as buyers struggle to regain momentum.
If the price fails to reclaim the broken support level, another wave of selling pressure could push DYDX toward lower demand zones.
Any short-term recovery might face strong resistance as traders look to exit positions near key levels.
The most critical factor now is whether buyers can defend the next support zone or whether bears will continue dominating the trend.
$DYDX could be approaching a decisive moment, and the next major move might catch unprepared traders off guard.
Keep your eyes on $DYDX. The bearish setup is developing, and the next breakdown could bring even stronger volatility!
#BTC Price Analysis# #Macro Insights# #Altcoin Season# #Meme Alpha# #BNBChain#
The recent price action suggests that sellers are gaining control, and bearish momentum could intensify in the coming sessions.
The breakdown has weakened the market structure, putting DYDX in a vulnerable position as buyers struggle to regain momentum.
If the price fails to reclaim the broken support level, another wave of selling pressure could push DYDX toward lower demand zones.
Any short-term recovery might face strong resistance as traders look to exit positions near key levels.
The most critical factor now is whether buyers can defend the next support zone or whether bears will continue dominating the trend.
$DYDX could be approaching a decisive moment, and the next major move might catch unprepared traders off guard.
Keep your eyes on $DYDX. The bearish setup is developing, and the next breakdown could bring even stronger volatility!
#BTC Price Analysis# #Macro Insights# #Altcoin Season# #Meme Alpha# #BNBChain#
79
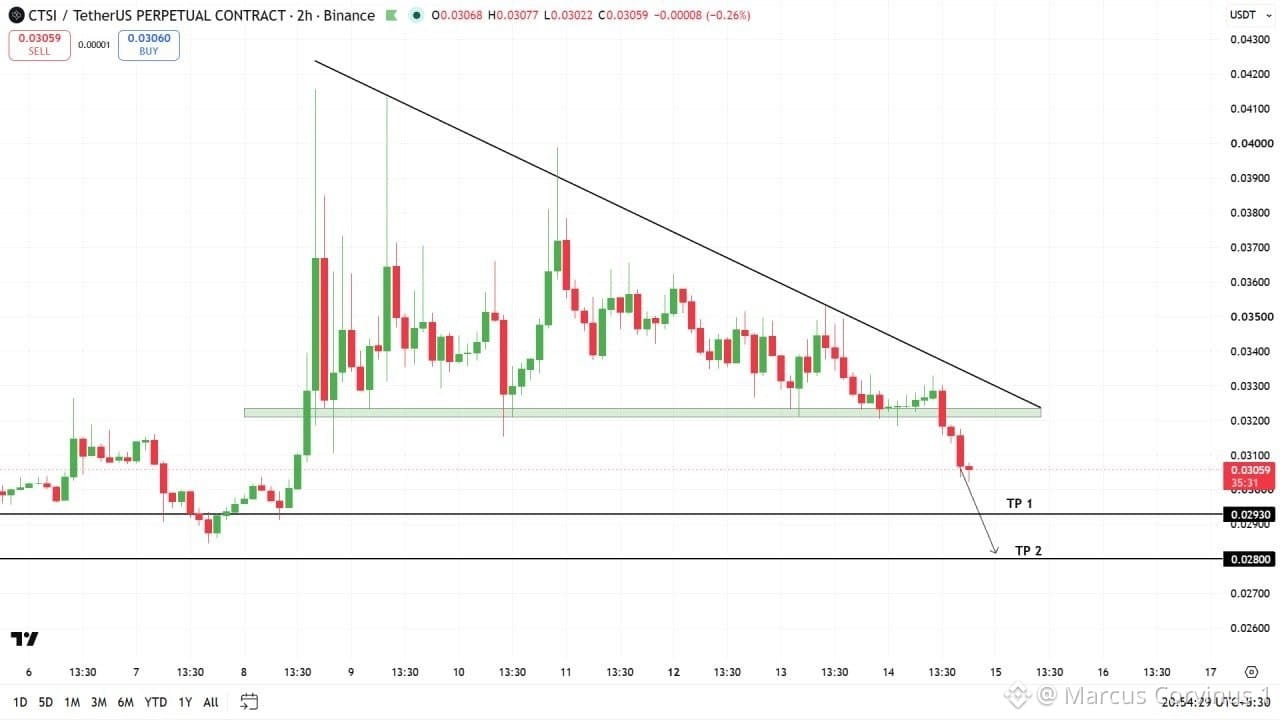
$CTSI is showing strong bearish signals after breaking below a key support level.
Selling pressure is increasing, and the recent breakdown suggests that bears are gaining control.
If $CTSI fails to reclaim its broken support, a deeper correction toward lower price levels could follow.
Weak buying momentum and continued selling pressure may accelerate the decline.
Traders should closely monitor the next support zones, as another breakdown could trigger a sharper sell-off.
CTSI is entering a critical phase, and the next major move could bring significant volatility.
Keep watching. The bears may not be finished yet.
#BTC Price Analysis# #Macro Insights# #Altcoin Season# #Meme Alpha# #BNBChain#
$CTSI is showing strong bearish signals after breaking below a key support level.
Selling pressure is increasing, and the recent breakdown suggests that bears are gaining control.
If $CTSI fails to reclaim its broken support, a deeper correction toward lower price levels could follow.
Weak buying momentum and continued selling pressure may accelerate the decline.
Traders should closely monitor the next support zones, as another breakdown could trigger a sharper sell-off.
CTSI is entering a critical phase, and the next major move could bring significant volatility.
Keep watching. The bears may not be finished yet.
#BTC Price Analysis# #Macro Insights# #Altcoin Season# #Meme Alpha# #BNBChain#
Selling pressure is increasing, and the recent breakdown suggests that bears are gaining control.
If $CTSI fails to reclaim its broken support, a deeper correction toward lower price levels could follow.
Weak buying momentum and continued selling pressure may accelerate the decline.
Traders should closely monitor the next support zones, as another breakdown could trigger a sharper sell-off.
CTSI is entering a critical phase, and the next major move could bring significant volatility.
Keep watching. The bears may not be finished yet.
#BTC Price Analysis# #Macro Insights# #Altcoin Season# #Meme Alpha# #BNBChain#
75
Войдите, чтобы посмотреть больше материала
Присоединяйтесь к пользователям криптовалют по всему миру на Binance Square
⚡️ Получайте новейшую и полезную информацию о криптоактивах.
💬 Нам доверяет крупнейшая в мире криптобиржа.
👍 Получите достоверные аналитические данные от верифицированных создателей контента.
Эл. почта/номер телефона
В тренде
A Packed Week of Earnings and Data Tests Markets
Просмотров: 50,215
337 обсуждают
Nvidia, Anthropic і ФРС. Три тести за один тиждень
Nick_Invest
·Лайков: 3
·Просмотров: 891
AnthropicIPOTestsInvestorAppetiteForAI
Просмотров: 85,185
1,195 обсуждают
BitcoinExtendsLosingStreakToSixWeeks
Просмотров: 45,278
544 обсуждают