
ajuxarjun
16 Публикации

ajuxarjun
Отправить жалобу
Заблокировать пользователя
Visualisation is the key 💸
0 подписок(и/а)
0 подписчиков(а)
5 понравилось
Посты
·
--
🚨 $SOL IS APPROACHING A LEVEL THAT COULD GET VERY INTERESTING.
SOL is trading around $118.79, up roughly 2% in 24 hours, with about $4.2B in 24H volume. (Binance)
But the bigger story isn’t just the chart.
Solana’s Alpenglow upgrade is targeting roughly 150ms transaction finality, compared with about 12.8 seconds under the current consensus system. Solana says the upgrade is on track for mainnet release later this year. (Solana)
Now look at the chart:
📍 $120 = immediate psychological resistance
📍 $115.95 = recent 24H low / nearby support
📍 $118.79 = current price
If SOL can break and hold above $120 with expanding volume, the breakout becomes much more interesting.
If $120 rejects and price loses $115.95, the momentum setup weakens.
The upgrade is the catalyst.
$120 is the battlefield.
[INSERT LIVE $SOL CANDLE CHART WIDGET HERE]
Would you wait for SOL to reclaim $120 — or wait for a pullback first? 👇
#SOL #Solana #CryptoTrading #BinanceSquare #Altcoins #Crypto
🚨 $SOL IS APPROACHING A LEVEL THAT COULD GET VERY INTERESTING.
SOL is trading around $118.79, up roughly 2% in 24 hours, with about $4.2B in 24H volume. (Binance)
But the bigger story isn’t just the chart.
Solana’s Alpenglow upgrade is targeting roughly 150ms transaction finality, compared with about 12.8 seconds under the current consensus system. Solana says the upgrade is on track for mainnet release later this year. (Solana)
Now look at the chart:
📍 $120 = immediate psychological resistance
📍 $115.95 = recent 24H low / nearby support
📍 $118.79 = current price
If SOL can break and hold above $120 with expanding volume, the breakout becomes much more interesting.
If $120 rejects and price loses $115.95, the momentum setup weakens.
The upgrade is the catalyst.
$120 is the battlefield.
[INSERT LIVE $SOL CANDLE CHART WIDGET HERE]
Would you wait for SOL to reclaim $120 — or wait for a pullback first? 👇
#SOL #Solana #CryptoTrading #BinanceSquare #Altcoins #Crypto
SOL is trading around $118.79, up roughly 2% in 24 hours, with about $4.2B in 24H volume. (Binance)
But the bigger story isn’t just the chart.
Solana’s Alpenglow upgrade is targeting roughly 150ms transaction finality, compared with about 12.8 seconds under the current consensus system. Solana says the upgrade is on track for mainnet release later this year. (Solana)
Now look at the chart:
📍 $120 = immediate psychological resistance
📍 $115.95 = recent 24H low / nearby support
📍 $118.79 = current price
If SOL can break and hold above $120 with expanding volume, the breakout becomes much more interesting.
If $120 rejects and price loses $115.95, the momentum setup weakens.
The upgrade is the catalyst.
$120 is the battlefield.
[INSERT LIVE $SOL CANDLE CHART WIDGET HERE]
Would you wait for SOL to reclaim $120 — or wait for a pullback first? 👇
#SOL #Solana #CryptoTrading #BinanceSquare #Altcoins #Crypto

43
·
--
🚨 $ETH IS AT THE LEVEL THAT MATTERS.
Ethereum has rallied hard, but the real battle is now $2,775–$2,825. A clean breakout and hold could confirm continuation; rejection could send ETH back toward the breakout zone around $2,661. The ETF inflows make this move even more interesting — but price still has to prove itself. 👀
Would you wait for the breakout or the retest?
#ETH #Ethereum #CryptoTrading #BinanceSquare #Crypto #Altcoins
🚨 $ETH IS AT THE LEVEL THAT MATTERS.
Ethereum has rallied hard, but the real battle is now $2,775–$2,825. A clean breakout and hold could confirm continuation; rejection could send ETH back toward the breakout zone around $2,661. The ETF inflows make this move even more interesting — but price still has to prove itself. 👀
Would you wait for the breakout or the retest?
#ETH #Ethereum #CryptoTrading #BinanceSquare #Crypto #Altcoins
Ethereum has rallied hard, but the real battle is now $2,775–$2,825. A clean breakout and hold could confirm continuation; rejection could send ETH back toward the breakout zone around $2,661. The ETF inflows make this move even more interesting — but price still has to prove itself. 👀
Would you wait for the breakout or the retest?
#ETH #Ethereum #CryptoTrading #BinanceSquare #Crypto #Altcoins

73
·
--
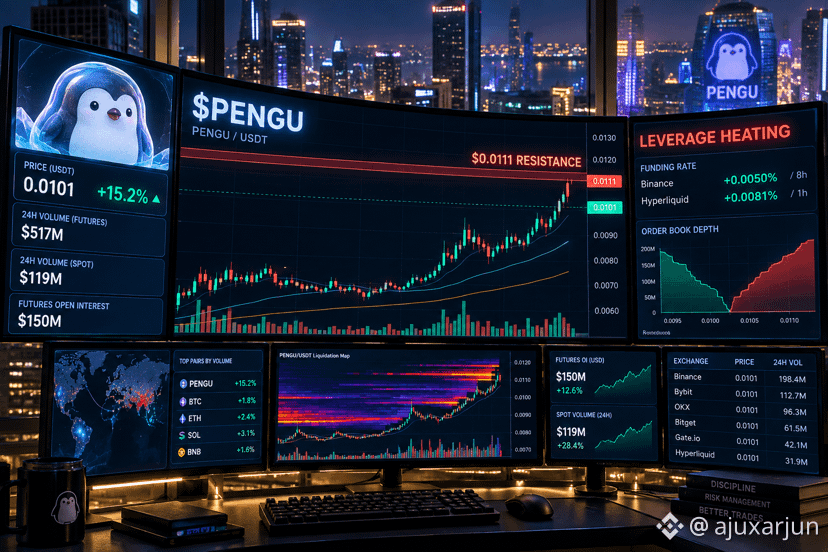
🚨 $PENGU JUST RAN INTO THE LEVEL THAT MATTERS.
PENGU is ripping higher — but the interesting part isn’t the pump.
It’s what happens here.
Price is pressing into the $0.0111 resistance zone after a sharp move, while futures activity and open interest have expanded.
That creates a simple battle:
🐂 Bull case:
A clean breakout + strong volume + acceptance above resistance could open the door for another leg higher.
🐻 Bear case:
If $0.0111 rejects and leveraged longs start unwinding, the move could retrace quickly.
The mistake is chasing the candle.
The level is the story.
📍 Key level: $0.0111 resistance
📍 Watch: volume + OI during the breakout
⚠️ Invalidation: failure back below the breakout structure
I’m watching the reaction, not predicting the outcome.
Would you trade the breakout — or wait for the retest? 👇
#PENGU #Crypto #BinanceSquare #Altcoins #Trading #CryptoTrading
🚨 $PENGU JUST RAN INTO THE LEVEL THAT MATTERS.
PENGU is ripping higher — but the interesting part isn’t the pump.
It’s what happens here.
Price is pressing into the $0.0111 resistance zone after a sharp move, while futures activity and open interest have expanded.
That creates a simple battle:
🐂 Bull case:
A clean breakout + strong volume + acceptance above resistance could open the door for another leg higher.
🐻 Bear case:
If $0.0111 rejects and leveraged longs start unwinding, the move could retrace quickly.
The mistake is chasing the candle.
The level is the story.
📍 Key level: $0.0111 resistance
📍 Watch: volume + OI during the breakout
⚠️ Invalidation: failure back below the breakout structure
I’m watching the reaction, not predicting the outcome.
Would you trade the breakout — or wait for the retest? 👇
#PENGU #Crypto #BinanceSquare #Altcoins #Trading #CryptoTrading
PENGU is ripping higher — but the interesting part isn’t the pump.
It’s what happens here.
Price is pressing into the $0.0111 resistance zone after a sharp move, while futures activity and open interest have expanded.
That creates a simple battle:
🐂 Bull case:
A clean breakout + strong volume + acceptance above resistance could open the door for another leg higher.
🐻 Bear case:
If $0.0111 rejects and leveraged longs start unwinding, the move could retrace quickly.
The mistake is chasing the candle.
The level is the story.
📍 Key level: $0.0111 resistance
📍 Watch: volume + OI during the breakout
⚠️ Invalidation: failure back below the breakout structure
I’m watching the reaction, not predicting the outcome.
Would you trade the breakout — or wait for the retest? 👇
#PENGU #Crypto #BinanceSquare #Altcoins #Trading #CryptoTrading
173
·
--
⚡ $ASTER IS SITTING RIGHT UNDER A MAJOR LIQUIDITY WALL
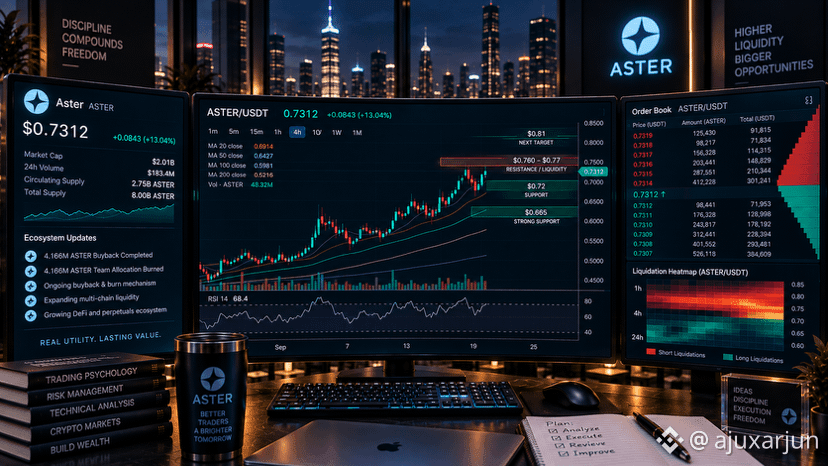
$ASTER is around $0.73, down roughly 1% over 24h after failing to hold the recent $0.76–$0.77 area. The key technical levels are $0.7606 resistance and $0.6655 support, with $0.81 becoming the next upside reference if buyers establish acceptance above resistance. (Binance)
The bigger story is tokenomics: Aster’s latest cycle used 99% of platform fees from Sept. 7–21 to buy back 4.166M $ASTER, while another 4.166M $ASTER was burned from the team allocation. The broader mechanism targets a reduction in total supply from 8B toward 3B, although the pace depends on actual platform fees. (Bitrue)
Derivatives are where this gets interesting: tracked ASTER perpetual open interest is around $148M, with Binance accounting for roughly 60%, while funding remains positive. Current liquidation data shows approximately $6.8M of short-liquidation exposure, meaning a breakout could produce a volatility event—but leverage can accelerate reversals just as quickly. (Squeeze Insights Lab)
🎯 $ASTER LEVELS
* 🔴 $0.760–$0.77 — breakout / liquidity zone
* 🚀 $0.81 — next upside reference
* 🟢 $0.72 — immediate support
* 🟢 $0.665 — major support
* 🔻 $0.573 — deeper structural support
The chart is compressed. The leverage is real. Let price choose the direction. ⚡📊
#ASTER #Aster #Crypto #Altcoins #BinanceSquare
⚡ $ASTER IS SITTING RIGHT UNDER A MAJOR LIQUIDITY WALL
$ASTER is around $0.73, down roughly 1% over 24h after failing to hold the recent $0.76–$0.77 area. The key technical levels are $0.7606 resistance and $0.6655 support, with $0.81 becoming the next upside reference if buyers establish acceptance above resistance. (Binance)
The bigger story is tokenomics: Aster’s latest cycle used 99% of platform fees from Sept. 7–21 to buy back 4.166M $ASTER, while another 4.166M $ASTER was burned from the team allocation. The broader mechanism targets a reduction in total supply from 8B toward 3B, although the pace depends on actual platform fees. (Bitrue)
Derivatives are where this gets interesting: tracked ASTER perpetual open interest is around $148M, with Binance accounting for roughly 60%, while funding remains positive. Current liquidation data shows approximately $6.8M of short-liquidation exposure, meaning a breakout could produce a volatility event—but leverage can accelerate reversals just as quickly. (Squeeze Insights Lab)
🎯 $ASTER LEVELS
* 🔴 $0.760–$0.77 — breakout / liquidity zone
* 🚀 $0.81 — next upside reference
* 🟢 $0.72 — immediate support
* 🟢 $0.665 — major support
* 🔻 $0.573 — deeper structural support
The chart is compressed. The leverage is real. Let price choose the direction. ⚡📊
#ASTER #Aster #Crypto #Altcoins #BinanceSquare
$ASTER is around $0.73, down roughly 1% over 24h after failing to hold the recent $0.76–$0.77 area. The key technical levels are $0.7606 resistance and $0.6655 support, with $0.81 becoming the next upside reference if buyers establish acceptance above resistance. (Binance)
The bigger story is tokenomics: Aster’s latest cycle used 99% of platform fees from Sept. 7–21 to buy back 4.166M $ASTER, while another 4.166M $ASTER was burned from the team allocation. The broader mechanism targets a reduction in total supply from 8B toward 3B, although the pace depends on actual platform fees. (Bitrue)
Derivatives are where this gets interesting: tracked ASTER perpetual open interest is around $148M, with Binance accounting for roughly 60%, while funding remains positive. Current liquidation data shows approximately $6.8M of short-liquidation exposure, meaning a breakout could produce a volatility event—but leverage can accelerate reversals just as quickly. (Squeeze Insights Lab)
🎯 $ASTER LEVELS
* 🔴 $0.760–$0.77 — breakout / liquidity zone
* 🚀 $0.81 — next upside reference
* 🟢 $0.72 — immediate support
* 🟢 $0.665 — major support
* 🔻 $0.573 — deeper structural support
The chart is compressed. The leverage is real. Let price choose the direction. ⚡📊
#ASTER #Aster #Crypto #Altcoins #BinanceSquare
622
·
--
🚨 $BTC HAS ONE LAST WALL TO CLEAR — $87K
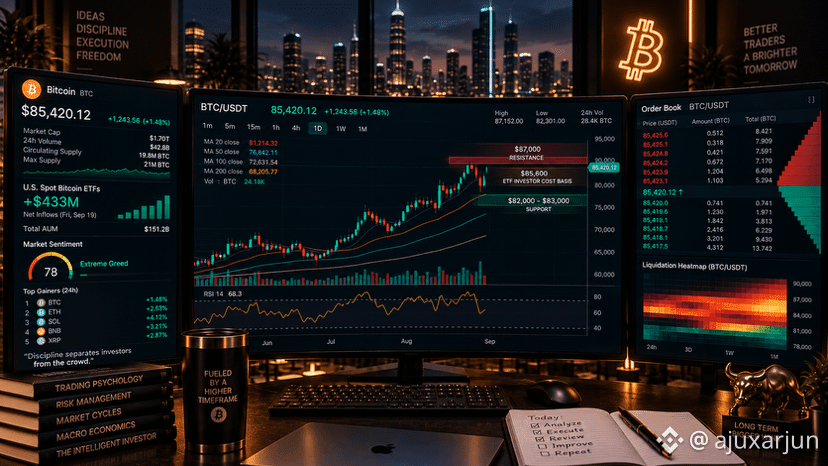
$BTC surged above $86K for the first time since January and briefly traded above $87K, while the broader crypto market pushed back toward a $3T total market cap. Institutional demand has been part of the move: U.S. spot Bitcoin ETFs recorded roughly $433M of inflows on Friday, while Strategy bought approximately $75.7M of BTC. (The Wall Street Journal)
Now comes the important part: the squeeze has already happened. More than $1B of crypto positions were liquidated over the past day, with roughly 82% reportedly being shorts, meaning the next leg needs genuine spot buying rather than another wave of forced liquidations. (CoinDesk)
Technically, $87K is the immediate ceiling. A sustained breakout above it would put the market into price discovery territory relative to the recent range; rejection keeps $85.6K as an important reference and $82K–$83K as the major support zone. This is a confirmation setup—not a reason to chase a vertical candle.
🎯 FINAL $BTC LEVELS
* 🔴 $87,000 — breakout / liquidity wall
* 🟡 $85,600 — key near-term reference
* 🟢 $82,000–$83,000 — major support
* 🔻 $78,500 — deeper structural support
$87K decides the next chapter. Watch the reaction, not the headline. 👀📊⚡
#BTC #Bitcoin #Crypto #BinanceSquare #Trading
🚨 $BTC HAS ONE LAST WALL TO CLEAR — $87K
$BTC surged above $86K for the first time since January and briefly traded above $87K, while the broader crypto market pushed back toward a $3T total market cap. Institutional demand has been part of the move: U.S. spot Bitcoin ETFs recorded roughly $433M of inflows on Friday, while Strategy bought approximately $75.7M of BTC. (The Wall Street Journal)
Now comes the important part: the squeeze has already happened. More than $1B of crypto positions were liquidated over the past day, with roughly 82% reportedly being shorts, meaning the next leg needs genuine spot buying rather than another wave of forced liquidations. (CoinDesk)
Technically, $87K is the immediate ceiling. A sustained breakout above it would put the market into price discovery territory relative to the recent range; rejection keeps $85.6K as an important reference and $82K–$83K as the major support zone. This is a confirmation setup—not a reason to chase a vertical candle.
🎯 FINAL $BTC LEVELS
* 🔴 $87,000 — breakout / liquidity wall
* 🟡 $85,600 — key near-term reference
* 🟢 $82,000–$83,000 — major support
* 🔻 $78,500 — deeper structural support
$87K decides the next chapter. Watch the reaction, not the headline. 👀📊⚡
#BTC #Bitcoin #Crypto #BinanceSquare #Trading
$BTC surged above $86K for the first time since January and briefly traded above $87K, while the broader crypto market pushed back toward a $3T total market cap. Institutional demand has been part of the move: U.S. spot Bitcoin ETFs recorded roughly $433M of inflows on Friday, while Strategy bought approximately $75.7M of BTC. (The Wall Street Journal)
Now comes the important part: the squeeze has already happened. More than $1B of crypto positions were liquidated over the past day, with roughly 82% reportedly being shorts, meaning the next leg needs genuine spot buying rather than another wave of forced liquidations. (CoinDesk)
Technically, $87K is the immediate ceiling. A sustained breakout above it would put the market into price discovery territory relative to the recent range; rejection keeps $85.6K as an important reference and $82K–$83K as the major support zone. This is a confirmation setup—not a reason to chase a vertical candle.
🎯 FINAL $BTC LEVELS
* 🔴 $87,000 — breakout / liquidity wall
* 🟡 $85,600 — key near-term reference
* 🟢 $82,000–$83,000 — major support
* 🔻 $78,500 — deeper structural support
$87K decides the next chapter. Watch the reaction, not the headline. 👀📊⚡
#BTC #Bitcoin #Crypto #BinanceSquare #Trading
8
·
--
🚨 $SUI JUST RECLAIMED $1 — NOW THE REAL TEST BEGINS ⚡
$SUI is back above the psychological $1.00 level, trading around $1.04 after a powerful momentum burst. 24h volume is around $1.7B, while SUI has gained roughly 44% over seven days — this isn’t a quiet recovery anymore. (CoinStats)
The chart is now sitting directly at the $1.04–$1.08 decision zone. A clean acceptance above $1.08 would put $1.16–$1.28 into focus, while losing the $0.9725 breakout level would weaken the setup and potentially expose the $0.91 region. (CoinMarketCap)
There’s also a fundamental narrative behind the move: Suilend launched V2.0, consolidating lending, borrowing and capital-management tools, while Sui ecosystem activity has been approaching 5 billion transactions. Traders are also watching the upcoming Sui Basecamp event on October 7–8 and expectations around a teased finance product. (CoinStats)
But here’s the danger: leverage is rising fast. Reported SUI open interest reached roughly $1B, up nearly 65% over seven days, while daily RSI readings are already in overbought territory on some technical feeds. Momentum is real; chasing it blindly is the risk. (CoinStats)
🎯 SUI LEVELS
* 🔥 $1.08 — breakout confirmation
* 🚀 $1.16–$1.28 — next momentum zone
* 🟢 $0.9725 — critical breakout support
* 🟢 $0.91 — deeper support
$1 was the psychological battle. $1.08 is where the chart gets interesting. 👀📊
#SUI #SuiNetwork #Crypto #Altcoins #BinanceSquare
🚨 $SUI JUST RECLAIMED $1 — NOW THE REAL TEST BEGINS ⚡
$SUI is back above the psychological $1.00 level, trading around $1.04 after a powerful momentum burst. 24h volume is around $1.7B, while SUI has gained roughly 44% over seven days — this isn’t a quiet recovery anymore. (CoinStats)
The chart is now sitting directly at the $1.04–$1.08 decision zone. A clean acceptance above $1.08 would put $1.16–$1.28 into focus, while losing the $0.9725 breakout level would weaken the setup and potentially expose the $0.91 region. (CoinMarketCap)
There’s also a fundamental narrative behind the move: Suilend launched V2.0, consolidating lending, borrowing and capital-management tools, while Sui ecosystem activity has been approaching 5 billion transactions. Traders are also watching the upcoming Sui Basecamp event on October 7–8 and expectations around a teased finance product. (CoinStats)
But here’s the danger: leverage is rising fast. Reported SUI open interest reached roughly $1B, up nearly 65% over seven days, while daily RSI readings are already in overbought territory on some technical feeds. Momentum is real; chasing it blindly is the risk. (CoinStats)
🎯 SUI LEVELS
* 🔥 $1.08 — breakout confirmation
* 🚀 $1.16–$1.28 — next momentum zone
* 🟢 $0.9725 — critical breakout support
* 🟢 $0.91 — deeper support
$1 was the psychological battle. $1.08 is where the chart gets interesting. 👀📊
#SUI #SuiNetwork #Crypto #Altcoins #BinanceSquare
$SUI is back above the psychological $1.00 level, trading around $1.04 after a powerful momentum burst. 24h volume is around $1.7B, while SUI has gained roughly 44% over seven days — this isn’t a quiet recovery anymore. (CoinStats)
The chart is now sitting directly at the $1.04–$1.08 decision zone. A clean acceptance above $1.08 would put $1.16–$1.28 into focus, while losing the $0.9725 breakout level would weaken the setup and potentially expose the $0.91 region. (CoinMarketCap)
There’s also a fundamental narrative behind the move: Suilend launched V2.0, consolidating lending, borrowing and capital-management tools, while Sui ecosystem activity has been approaching 5 billion transactions. Traders are also watching the upcoming Sui Basecamp event on October 7–8 and expectations around a teased finance product. (CoinStats)
But here’s the danger: leverage is rising fast. Reported SUI open interest reached roughly $1B, up nearly 65% over seven days, while daily RSI readings are already in overbought territory on some technical feeds. Momentum is real; chasing it blindly is the risk. (CoinStats)
🎯 SUI LEVELS
* 🔥 $1.08 — breakout confirmation
* 🚀 $1.16–$1.28 — next momentum zone
* 🟢 $0.9725 — critical breakout support
* 🟢 $0.91 — deeper support
$1 was the psychological battle. $1.08 is where the chart gets interesting. 👀📊
#SUI #SuiNetwork #Crypto #Altcoins #BinanceSquare

68
·
--
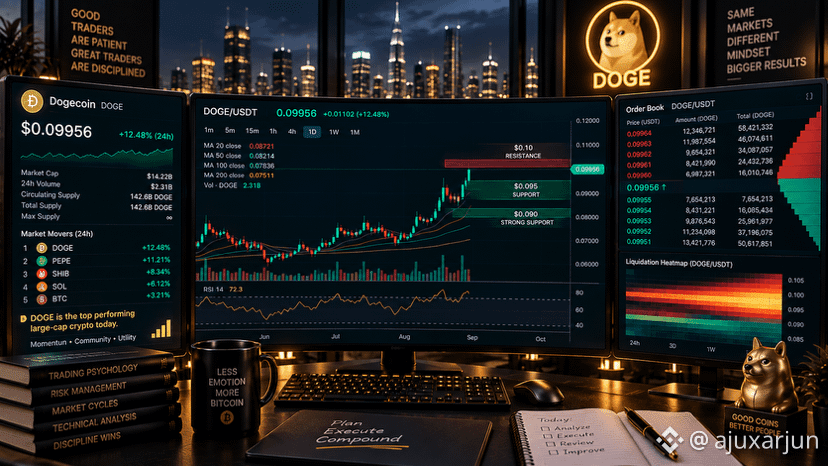
🐕🚨 $DOGE JUST BECAME THE MEMECOIN TO WATCH TODAY
$DOGE is currently around $0.0996, up ~12.5%, making it the leading mover in a live crypto snapshot, while overall crypto breadth is also strong. Binance’s market feed has BTC around $85.5K (+4.7%), ETH around $2.73K (+2.6%), and SOL around $116.7 (+4.1%) — meaning DOGE is participating in a broader risk-on move rather than moving in isolation. (InteractiveCrypto)
The technical setup is getting interesting: $0.10 is the psychological resistance, while $0.095 is the first retest zone and $0.090 the stronger support area. Momentum is powerful, but the live snapshot already shows crypto sentiment around 78 / Extreme Greed, so chasing a vertical candle introduces considerably more volatility than waiting for price to establish support. (InteractiveCrypto)
Here’s the trigger I’m watching: break and hold above $0.10 with expanding volume versus rejection back below $0.095. If buyers establish acceptance above resistance, the next upside zones become a momentum-trading question; if $0.095 fails, the market has a clear nearby level to reassess rather than blindly averaging into weakness.
🎯 $DOGE LEVELS
* 🔴 $0.100 — psychological resistance / breakout trigger
* 🟢 $0.095 — first retest zone
* 🟢 $0.090 — stronger support
* ⚠️ RSI ~72 — momentum is strong, but stretched
DOGE doesn’t need a prediction. It needs a level to break. 🐕📊
#DOGE #Dogecoin #Memecoin #Crypto #BinanceSquare
🐕🚨 $DOGE JUST BECAME THE MEMECOIN TO WATCH TODAY
$DOGE is currently around $0.0996, up ~12.5%, making it the leading mover in a live crypto snapshot, while overall crypto breadth is also strong. Binance’s market feed has BTC around $85.5K (+4.7%), ETH around $2.73K (+2.6%), and SOL around $116.7 (+4.1%) — meaning DOGE is participating in a broader risk-on move rather than moving in isolation. (InteractiveCrypto)
The technical setup is getting interesting: $0.10 is the psychological resistance, while $0.095 is the first retest zone and $0.090 the stronger support area. Momentum is powerful, but the live snapshot already shows crypto sentiment around 78 / Extreme Greed, so chasing a vertical candle introduces considerably more volatility than waiting for price to establish support. (InteractiveCrypto)
Here’s the trigger I’m watching: break and hold above $0.10 with expanding volume versus rejection back below $0.095. If buyers establish acceptance above resistance, the next upside zones become a momentum-trading question; if $0.095 fails, the market has a clear nearby level to reassess rather than blindly averaging into weakness.
🎯 $DOGE LEVELS
* 🔴 $0.100 — psychological resistance / breakout trigger
* 🟢 $0.095 — first retest zone
* 🟢 $0.090 — stronger support
* ⚠️ RSI ~72 — momentum is strong, but stretched
DOGE doesn’t need a prediction. It needs a level to break. 🐕📊
#DOGE #Dogecoin #Memecoin #Crypto #BinanceSquare
$DOGE is currently around $0.0996, up ~12.5%, making it the leading mover in a live crypto snapshot, while overall crypto breadth is also strong. Binance’s market feed has BTC around $85.5K (+4.7%), ETH around $2.73K (+2.6%), and SOL around $116.7 (+4.1%) — meaning DOGE is participating in a broader risk-on move rather than moving in isolation. (InteractiveCrypto)
The technical setup is getting interesting: $0.10 is the psychological resistance, while $0.095 is the first retest zone and $0.090 the stronger support area. Momentum is powerful, but the live snapshot already shows crypto sentiment around 78 / Extreme Greed, so chasing a vertical candle introduces considerably more volatility than waiting for price to establish support. (InteractiveCrypto)
Here’s the trigger I’m watching: break and hold above $0.10 with expanding volume versus rejection back below $0.095. If buyers establish acceptance above resistance, the next upside zones become a momentum-trading question; if $0.095 fails, the market has a clear nearby level to reassess rather than blindly averaging into weakness.
🎯 $DOGE LEVELS
* 🔴 $0.100 — psychological resistance / breakout trigger
* 🟢 $0.095 — first retest zone
* 🟢 $0.090 — stronger support
* ⚠️ RSI ~72 — momentum is strong, but stretched
DOGE doesn’t need a prediction. It needs a level to break. 🐕📊
#DOGE #Dogecoin #Memecoin #Crypto #BinanceSquare
17
·
--
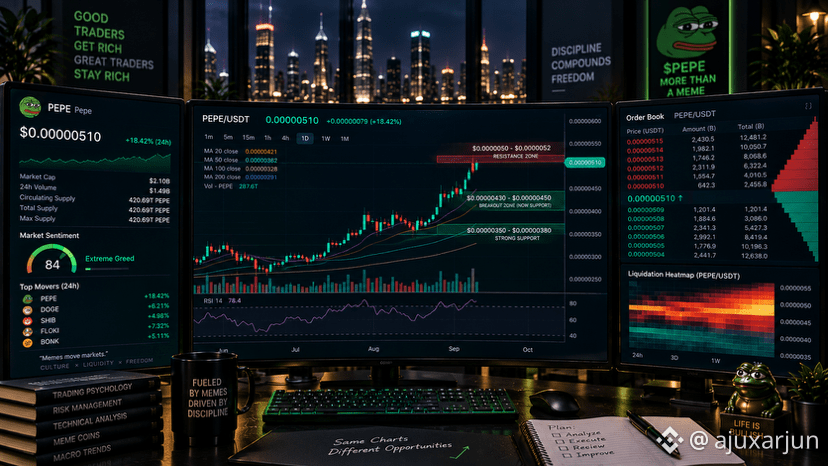
🐸🚨 $PEPE JUST EXPLODED 26% — MEMECOIN ROTATION IS ON
$PEPE is trading around $0.0000051, up roughly 26% in 24 hours, with approximately $1.5B in 24h volume and a market cap near $2.1B. The move is part of a broader risk-on rotation into meme coins as $BTC strengthens, but PEPE is currently moving much faster than the majors. (CoinMarketCap)
The interesting technical level is the $0.00000430–$0.00000450 breakout zone. PEPE has reclaimed that area and pushed toward $0.0000052, while hourly momentum remains positive; however, daily RSI is around 75, meaning the move is already stretched and a retest/consolidation would not be surprising. (InteractiveCrypto)
There’s another layer: recent reporting points to significant whale accumulation, while PEPE’s enormous trading volume shows just how aggressively speculative capital is rotating into the token. The flip side is equally important—meme coins can reverse violently, and PEPE’s high wallet concentration adds additional volatility risk. (InteractiveCrypto)
🎯 PEPE LEVELS
* 🔴 $0.00000520 — immediate breakout area
* 🚀 $0.00000550–$0.00000600 — momentum zone
* 🟢 $0.00000430–$0.00000450 — critical breakout-retest support
* 🟢 $0.00000350–$0.00000380 — stronger support
🐸 Meme season doesn’t announce itself. Volume usually does. 📊⚡
#PEPE #Memecoin #Crypto #BinanceSquare
🐸🚨 $PEPE JUST EXPLODED 26% — MEMECOIN ROTATION IS ON
$PEPE is trading around $0.0000051, up roughly 26% in 24 hours, with approximately $1.5B in 24h volume and a market cap near $2.1B. The move is part of a broader risk-on rotation into meme coins as $BTC strengthens, but PEPE is currently moving much faster than the majors. (CoinMarketCap)
The interesting technical level is the $0.00000430–$0.00000450 breakout zone. PEPE has reclaimed that area and pushed toward $0.0000052, while hourly momentum remains positive; however, daily RSI is around 75, meaning the move is already stretched and a retest/consolidation would not be surprising. (InteractiveCrypto)
There’s another layer: recent reporting points to significant whale accumulation, while PEPE’s enormous trading volume shows just how aggressively speculative capital is rotating into the token. The flip side is equally important—meme coins can reverse violently, and PEPE’s high wallet concentration adds additional volatility risk. (InteractiveCrypto)
🎯 PEPE LEVELS
* 🔴 $0.00000520 — immediate breakout area
* 🚀 $0.00000550–$0.00000600 — momentum zone
* 🟢 $0.00000430–$0.00000450 — critical breakout-retest support
* 🟢 $0.00000350–$0.00000380 — stronger support
🐸 Meme season doesn’t announce itself. Volume usually does. 📊⚡
#PEPE #Memecoin #Crypto #BinanceSquare
$PEPE is trading around $0.0000051, up roughly 26% in 24 hours, with approximately $1.5B in 24h volume and a market cap near $2.1B. The move is part of a broader risk-on rotation into meme coins as $BTC strengthens, but PEPE is currently moving much faster than the majors. (CoinMarketCap)
The interesting technical level is the $0.00000430–$0.00000450 breakout zone. PEPE has reclaimed that area and pushed toward $0.0000052, while hourly momentum remains positive; however, daily RSI is around 75, meaning the move is already stretched and a retest/consolidation would not be surprising. (InteractiveCrypto)
There’s another layer: recent reporting points to significant whale accumulation, while PEPE’s enormous trading volume shows just how aggressively speculative capital is rotating into the token. The flip side is equally important—meme coins can reverse violently, and PEPE’s high wallet concentration adds additional volatility risk. (InteractiveCrypto)
🎯 PEPE LEVELS
* 🔴 $0.00000520 — immediate breakout area
* 🚀 $0.00000550–$0.00000600 — momentum zone
* 🟢 $0.00000430–$0.00000450 — critical breakout-retest support
* 🟢 $0.00000350–$0.00000380 — stronger support
🐸 Meme season doesn’t announce itself. Volume usually does. 📊⚡
#PEPE #Memecoin #Crypto #BinanceSquare
25
·
--
🚨 $BTC JUST PRINTED AN 8-MONTH HIGH — NOW WATCH $87K
$BTC ripped above $87,000 on Sept. 21, reaching its highest level since January before pulling back toward the mid-$85Ks. The move came alongside strong U.S. spot ETF inflows and a large wave of short covering, with reports putting Friday ETF inflows around $433M and total crypto short liquidations near $919M. (The Wall Street Journal)
The technical structure has changed: Bitcoin reclaimed the 50-week moving average after spending roughly 45 weeks below it, while the current ETF-investor cost basis has been reported around $85,600. That makes the $85K–$86K region an important area to watch if the breakout is going to hold. (The Economic Times)
But here’s the important part: $87K is resistance, not confirmation. A clean acceptance above the recent high would keep momentum intact; rejection followed by a loss of $85K could shift attention toward $82K–$83K, with $78.5K as a deeper structural level. Meanwhile, macro conditions remain mixed, with Treasury yields near 4.9% and markets still watching geopolitical and Fed-rate developments. (Reuters)
🎯 LEVELS TO WATCH
* 🔴 $87,000 — recent high / major resistance
* 🟡 $85,600 — reported ETF investor cost basis
* 🟢 $82,000–$83,000 — key support
* 🔻 $78,500 — deeper support
Breakout or bull trap? Let price prove it. 📊⚡
🚨 $BTC JUST PRINTED AN 8-MONTH HIGH — NOW WATCH $87K
$BTC ripped above $87,000 on Sept. 21, reaching its highest level since January before pulling back toward the mid-$85Ks. The move came alongside strong U.S. spot ETF inflows and a large wave of short covering, with reports putting Friday ETF inflows around $433M and total crypto short liquidations near $919M. (The Wall Street Journal)
The technical structure has changed: Bitcoin reclaimed the 50-week moving average after spending roughly 45 weeks below it, while the current ETF-investor cost basis has been reported around $85,600. That makes the $85K–$86K region an important area to watch if the breakout is going to hold. (The Economic Times)
But here’s the important part: $87K is resistance, not confirmation. A clean acceptance above the recent high would keep momentum intact; rejection followed by a loss of $85K could shift attention toward $82K–$83K, with $78.5K as a deeper structural level. Meanwhile, macro conditions remain mixed, with Treasury yields near 4.9% and markets still watching geopolitical and Fed-rate developments. (Reuters)
🎯 LEVELS TO WATCH
* 🔴 $87,000 — recent high / major resistance
* 🟡 $85,600 — reported ETF investor cost basis
* 🟢 $82,000–$83,000 — key support
* 🔻 $78,500 — deeper support
Breakout or bull trap? Let price prove it. 📊⚡
$BTC ripped above $87,000 on Sept. 21, reaching its highest level since January before pulling back toward the mid-$85Ks. The move came alongside strong U.S. spot ETF inflows and a large wave of short covering, with reports putting Friday ETF inflows around $433M and total crypto short liquidations near $919M. (The Wall Street Journal)
The technical structure has changed: Bitcoin reclaimed the 50-week moving average after spending roughly 45 weeks below it, while the current ETF-investor cost basis has been reported around $85,600. That makes the $85K–$86K region an important area to watch if the breakout is going to hold. (The Economic Times)
But here’s the important part: $87K is resistance, not confirmation. A clean acceptance above the recent high would keep momentum intact; rejection followed by a loss of $85K could shift attention toward $82K–$83K, with $78.5K as a deeper structural level. Meanwhile, macro conditions remain mixed, with Treasury yields near 4.9% and markets still watching geopolitical and Fed-rate developments. (Reuters)
🎯 LEVELS TO WATCH
* 🔴 $87,000 — recent high / major resistance
* 🟡 $85,600 — reported ETF investor cost basis
* 🟢 $82,000–$83,000 — key support
* 🔻 $78,500 — deeper support
Breakout or bull trap? Let price prove it. 📊⚡

10
·
--
⚡ $BNB IS APPROACHING $823 — THE NEXT BREAKOUT TEST IS HERE
$BNB has climbed sharply from the July lows and is now hovering around the $780–$800 decision zone, with recent analysis placing $823.20 as the key resistance overhead. Momentum remains constructive on the higher timeframes, but price is also showing signs of cooling after the latest advance. (Pluang)
The technical structure is straightforward: $823 is the liquidity/resistance ceiling, while $780–$800 is the immediate battleground. A sustained move above $823 would change the short-term structure; rejection keeps $700 and then $670 as the major downside reference zones. (AMBCrypto)
There is also an important ecosystem backdrop. Binance completed a scheduled system upgrade today, while Binance announced a $100M investment in Circle and an expanded USDC partnership, including plans to integrate USDC into Binance digital-asset products. Separately, BNB’s U.S. ETF story remains an institutional catalyst to monitor. (Binance)
🎯 Key levels
* 🔴 $823 — major resistance / liquidity
* 🟡 $780–$800 — decision zone
* 🟢 $700 — primary support
* 🟢 $670 — strong lower support
$823 is the level to watch — confirmation matters more than prediction. 📊⚡
⚡ $BNB IS APPROACHING $823 — THE NEXT BREAKOUT TEST IS HERE
$BNB has climbed sharply from the July lows and is now hovering around the $780–$800 decision zone, with recent analysis placing $823.20 as the key resistance overhead. Momentum remains constructive on the higher timeframes, but price is also showing signs of cooling after the latest advance. (Pluang)
The technical structure is straightforward: $823 is the liquidity/resistance ceiling, while $780–$800 is the immediate battleground. A sustained move above $823 would change the short-term structure; rejection keeps $700 and then $670 as the major downside reference zones. (AMBCrypto)
There is also an important ecosystem backdrop. Binance completed a scheduled system upgrade today, while Binance announced a $100M investment in Circle and an expanded USDC partnership, including plans to integrate USDC into Binance digital-asset products. Separately, BNB’s U.S. ETF story remains an institutional catalyst to monitor. (Binance)
🎯 Key levels
* 🔴 $823 — major resistance / liquidity
* 🟡 $780–$800 — decision zone
* 🟢 $700 — primary support
* 🟢 $670 — strong lower support
$823 is the level to watch — confirmation matters more than prediction. 📊⚡
$BNB has climbed sharply from the July lows and is now hovering around the $780–$800 decision zone, with recent analysis placing $823.20 as the key resistance overhead. Momentum remains constructive on the higher timeframes, but price is also showing signs of cooling after the latest advance. (Pluang)
The technical structure is straightforward: $823 is the liquidity/resistance ceiling, while $780–$800 is the immediate battleground. A sustained move above $823 would change the short-term structure; rejection keeps $700 and then $670 as the major downside reference zones. (AMBCrypto)
There is also an important ecosystem backdrop. Binance completed a scheduled system upgrade today, while Binance announced a $100M investment in Circle and an expanded USDC partnership, including plans to integrate USDC into Binance digital-asset products. Separately, BNB’s U.S. ETF story remains an institutional catalyst to monitor. (Binance)
🎯 Key levels
* 🔴 $823 — major resistance / liquidity
* 🟡 $780–$800 — decision zone
* 🟢 $700 — primary support
* 🟢 $670 — strong lower support
$823 is the level to watch — confirmation matters more than prediction. 📊⚡

29
·
--
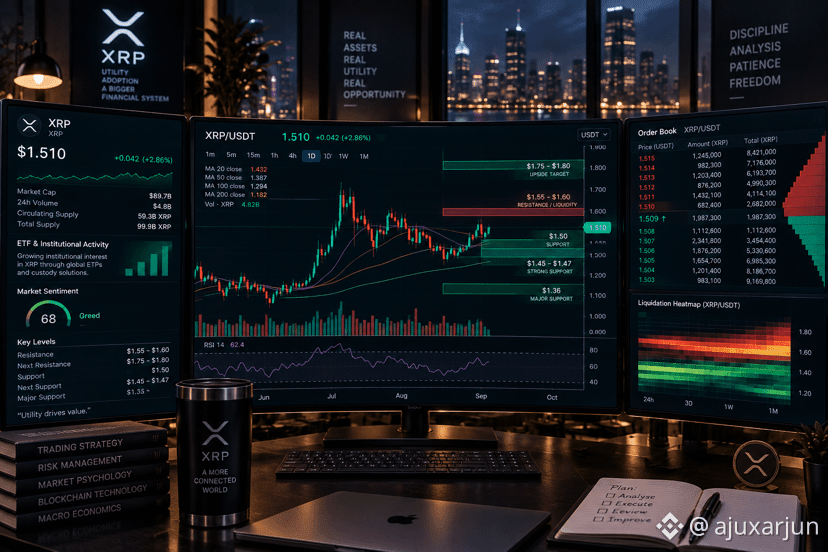
🚨 $XRP IS BREAKING OUT — $1.60 IS THE DECISION ZONE
$XRP has pushed through a multi-week descending channel and is trading around $1.51, with momentum accelerating after the breakout. Current technical readings put the next major test around $1.55–$1.60, while the $1.50 area becomes the first level to defend if price retests the breakout. (CoinStats)
The derivatives tape is expanding alongside price: reported XRP futures open interest has risen roughly 19%, while short liquidations accounted for the overwhelming majority of recent liquidations. That confirms aggressive positioning behind the move, but it also means a failed breakout could produce elevated volatility in either direction. (CoinStats)
There is also a fundamental catalyst window: XRP spot ETFs have maintained a reported 10-week consecutive weekly inflow streak, while the XRPL is scheduled for a Batch V1.1 upgrade around September 29. The combination of improving technical structure and institutional/ledger developments makes $1.55–$1.60 the area I would watch for confirmation rather than blindly chasing the current move. (Coin Edition)
🎯 Key levels
* 🔴 $1.55–$1.60 — breakout / liquidity zone
* 🚀 $1.75–$1.80 — next upside resistance
* 🟢 $1.50 — immediate support
* 🟢 $1.45–$1.47 — stronger retest zone
* 🔻 $1.36 — major structural support
The breakout is interesting. The retest is where the information is. 📊⚡
🚨 $XRP IS BREAKING OUT — $1.60 IS THE DECISION ZONE
$XRP has pushed through a multi-week descending channel and is trading around $1.51, with momentum accelerating after the breakout. Current technical readings put the next major test around $1.55–$1.60, while the $1.50 area becomes the first level to defend if price retests the breakout. (CoinStats)
The derivatives tape is expanding alongside price: reported XRP futures open interest has risen roughly 19%, while short liquidations accounted for the overwhelming majority of recent liquidations. That confirms aggressive positioning behind the move, but it also means a failed breakout could produce elevated volatility in either direction. (CoinStats)
There is also a fundamental catalyst window: XRP spot ETFs have maintained a reported 10-week consecutive weekly inflow streak, while the XRPL is scheduled for a Batch V1.1 upgrade around September 29. The combination of improving technical structure and institutional/ledger developments makes $1.55–$1.60 the area I would watch for confirmation rather than blindly chasing the current move. (Coin Edition)
🎯 Key levels
* 🔴 $1.55–$1.60 — breakout / liquidity zone
* 🚀 $1.75–$1.80 — next upside resistance
* 🟢 $1.50 — immediate support
* 🟢 $1.45–$1.47 — stronger retest zone
* 🔻 $1.36 — major structural support
The breakout is interesting. The retest is where the information is. 📊⚡
$XRP has pushed through a multi-week descending channel and is trading around $1.51, with momentum accelerating after the breakout. Current technical readings put the next major test around $1.55–$1.60, while the $1.50 area becomes the first level to defend if price retests the breakout. (CoinStats)
The derivatives tape is expanding alongside price: reported XRP futures open interest has risen roughly 19%, while short liquidations accounted for the overwhelming majority of recent liquidations. That confirms aggressive positioning behind the move, but it also means a failed breakout could produce elevated volatility in either direction. (CoinStats)
There is also a fundamental catalyst window: XRP spot ETFs have maintained a reported 10-week consecutive weekly inflow streak, while the XRPL is scheduled for a Batch V1.1 upgrade around September 29. The combination of improving technical structure and institutional/ledger developments makes $1.55–$1.60 the area I would watch for confirmation rather than blindly chasing the current move. (Coin Edition)
🎯 Key levels
* 🔴 $1.55–$1.60 — breakout / liquidity zone
* 🚀 $1.75–$1.80 — next upside resistance
* 🟢 $1.50 — immediate support
* 🟢 $1.45–$1.47 — stronger retest zone
* 🔻 $1.36 — major structural support
The breakout is interesting. The retest is where the information is. 📊⚡
70
·
--
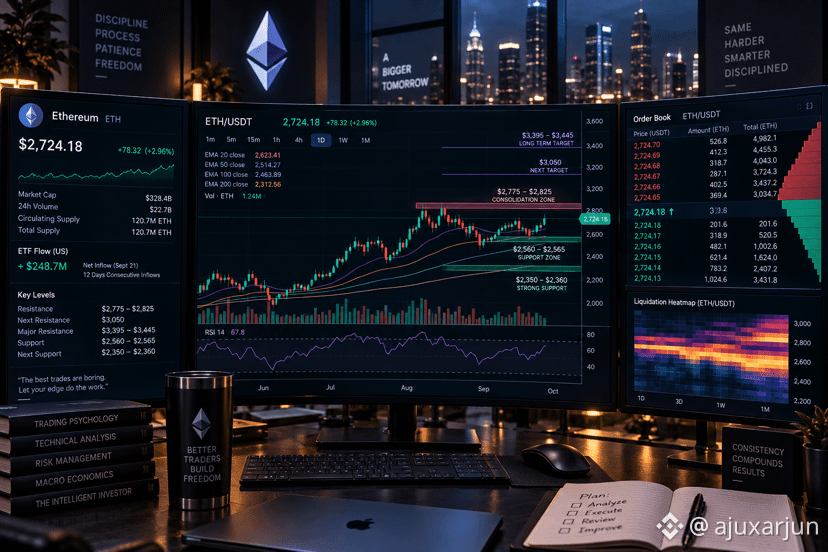
⚡ $ETH JUST BROKE THE BULL FLAG — $3,050 NEXT?
$ETH is trading around $2,725, after breaking above the $2,661.52 resistance that capped the recent consolidation. Reuters’ technical analysis identifies this as a breakout from a bull-flag structure, with the measured target around $3,050 and an interim consolidation zone around $2,775–$2,825. (Reuters)
The momentum picture is strong, but the market is extended. ETH is above its major moving averages, while RSI readings are approaching the upper range; that makes $2,775–$2,825 the critical area to watch for either continuation or a rejection. (The Cryptonomist)
Flows are adding fuel: spot Ether ETFs reportedly recorded about $270M of inflows on Sept. 21, their strongest single-day inflow of 2026 according to recent reporting. At the same time, ETH remains highly sensitive to broader risk sentiment and the Bitcoin-led market move, so confirmation matters more than chasing momentum. (FinanceFeeds)
🎯 Levels on my radar
* 🔥 $2,775–$2,825 — immediate resistance / breakout confirmation
* 🚀 $3,050 — measured breakout target
* 🟣 $3,395–$3,445 — major higher-timeframe resistance
* 🟢 $2,560–$2,565 — first major support
* 🔻 $2,350–$2,360 — deeper structural support
Breakout confirmed? Or one more retest before the next leg? 📊⚡
⚡ $ETH JUST BROKE THE BULL FLAG — $3,050 NEXT?
$ETH is trading around $2,725, after breaking above the $2,661.52 resistance that capped the recent consolidation. Reuters’ technical analysis identifies this as a breakout from a bull-flag structure, with the measured target around $3,050 and an interim consolidation zone around $2,775–$2,825. (Reuters)
The momentum picture is strong, but the market is extended. ETH is above its major moving averages, while RSI readings are approaching the upper range; that makes $2,775–$2,825 the critical area to watch for either continuation or a rejection. (The Cryptonomist)
Flows are adding fuel: spot Ether ETFs reportedly recorded about $270M of inflows on Sept. 21, their strongest single-day inflow of 2026 according to recent reporting. At the same time, ETH remains highly sensitive to broader risk sentiment and the Bitcoin-led market move, so confirmation matters more than chasing momentum. (FinanceFeeds)
🎯 Levels on my radar
* 🔥 $2,775–$2,825 — immediate resistance / breakout confirmation
* 🚀 $3,050 — measured breakout target
* 🟣 $3,395–$3,445 — major higher-timeframe resistance
* 🟢 $2,560–$2,565 — first major support
* 🔻 $2,350–$2,360 — deeper structural support
Breakout confirmed? Or one more retest before the next leg? 📊⚡
$ETH is trading around $2,725, after breaking above the $2,661.52 resistance that capped the recent consolidation. Reuters’ technical analysis identifies this as a breakout from a bull-flag structure, with the measured target around $3,050 and an interim consolidation zone around $2,775–$2,825. (Reuters)
The momentum picture is strong, but the market is extended. ETH is above its major moving averages, while RSI readings are approaching the upper range; that makes $2,775–$2,825 the critical area to watch for either continuation or a rejection. (The Cryptonomist)
Flows are adding fuel: spot Ether ETFs reportedly recorded about $270M of inflows on Sept. 21, their strongest single-day inflow of 2026 according to recent reporting. At the same time, ETH remains highly sensitive to broader risk sentiment and the Bitcoin-led market move, so confirmation matters more than chasing momentum. (FinanceFeeds)
🎯 Levels on my radar
* 🔥 $2,775–$2,825 — immediate resistance / breakout confirmation
* 🚀 $3,050 — measured breakout target
* 🟣 $3,395–$3,445 — major higher-timeframe resistance
* 🟢 $2,560–$2,565 — first major support
* 🔻 $2,350–$2,360 — deeper structural support
Breakout confirmed? Or one more retest before the next leg? 📊⚡
3
116
·
--
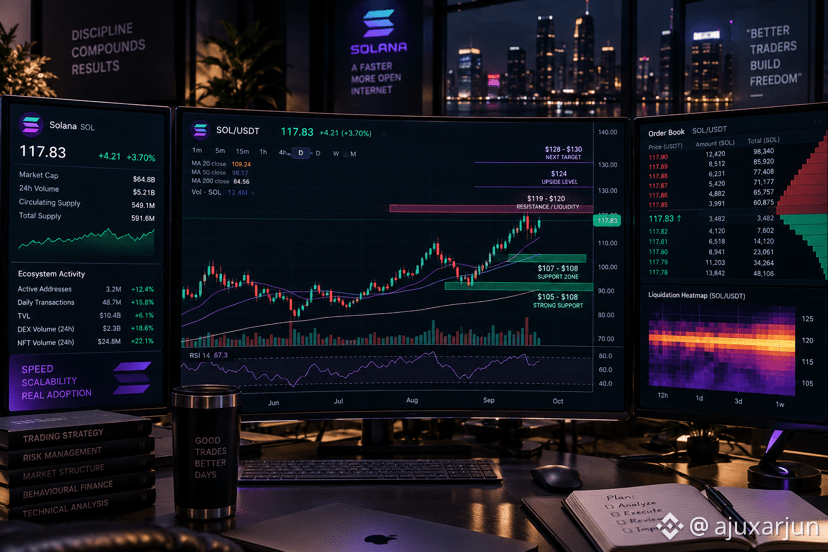
⚡ $SOL IS TESTING THE $120 WALL — BREAKOUT OR REJECTION?
$SOL is trading around $117–$118 after a strong recovery, with the daily structure firmly above its major moving averages. The key battle is now $119–$120, where recent price action has encountered sellers. (Invezz)
Momentum is strong, but the setup is getting extended: daily RSI is around 70, while SOL remains above the 20/50/100/200-day averages. That creates a classic momentum-continuation vs. exhaustion decision point rather than a level to chase blindly. (CoinLore)
The demand backdrop is notable: U.S. spot SOL ETFs recorded approximately $26.1M of net inflows on Sept. 21, extending the reported inflow streak to 12 weeks, while DeFi Development Corp. disclosed an additional 101,381 SOL accumulation. (Invezz)
My systematic framework: acceptance above $120 would put $124 and then $128–$130 into focus; failure at resistance keeps $107–$108 as the first major support zone, with roughly $105 as deeper trend support. 📊
Watch the confirmation. Don’t chase the candle. ⚡📈
⚡ $SOL IS TESTING THE $120 WALL — BREAKOUT OR REJECTION?
$SOL is trading around $117–$118 after a strong recovery, with the daily structure firmly above its major moving averages. The key battle is now $119–$120, where recent price action has encountered sellers. (Invezz)
Momentum is strong, but the setup is getting extended: daily RSI is around 70, while SOL remains above the 20/50/100/200-day averages. That creates a classic momentum-continuation vs. exhaustion decision point rather than a level to chase blindly. (CoinLore)
The demand backdrop is notable: U.S. spot SOL ETFs recorded approximately $26.1M of net inflows on Sept. 21, extending the reported inflow streak to 12 weeks, while DeFi Development Corp. disclosed an additional 101,381 SOL accumulation. (Invezz)
My systematic framework: acceptance above $120 would put $124 and then $128–$130 into focus; failure at resistance keeps $107–$108 as the first major support zone, with roughly $105 as deeper trend support. 📊
Watch the confirmation. Don’t chase the candle. ⚡📈
$SOL is trading around $117–$118 after a strong recovery, with the daily structure firmly above its major moving averages. The key battle is now $119–$120, where recent price action has encountered sellers. (Invezz)
Momentum is strong, but the setup is getting extended: daily RSI is around 70, while SOL remains above the 20/50/100/200-day averages. That creates a classic momentum-continuation vs. exhaustion decision point rather than a level to chase blindly. (CoinLore)
The demand backdrop is notable: U.S. spot SOL ETFs recorded approximately $26.1M of net inflows on Sept. 21, extending the reported inflow streak to 12 weeks, while DeFi Development Corp. disclosed an additional 101,381 SOL accumulation. (Invezz)
My systematic framework: acceptance above $120 would put $124 and then $128–$130 into focus; failure at resistance keeps $107–$108 as the first major support zone, with roughly $105 as deeper trend support. 📊
Watch the confirmation. Don’t chase the candle. ⚡📈
1
76
·
--
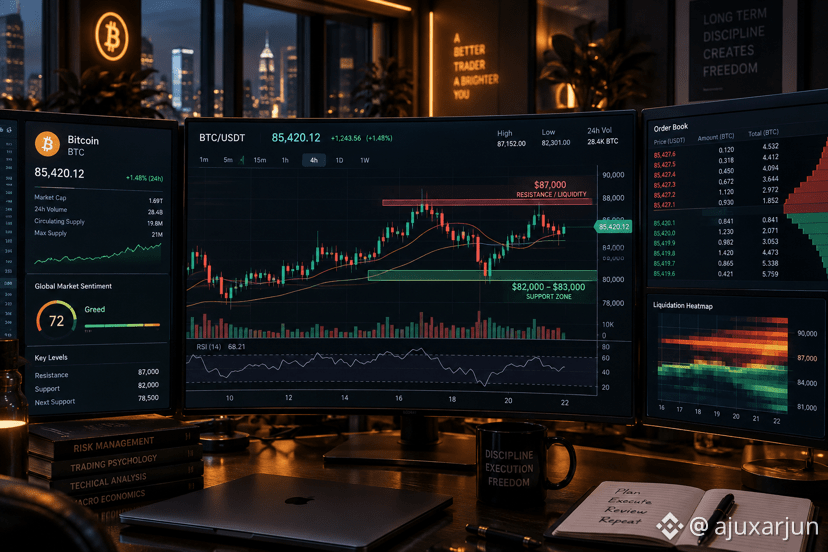
🚨 $BTC IS BACK ABOVE $85K — BUT THE NEXT MOVE MATTERS
$BTC has rebounded sharply into the $85K–$87K area, with price recently reaching roughly $87K before pulling back. The broader structure remains constructive, but momentum is becoming stretched: one current technical reading places daily RSI around 69, while the market’s Fear & Greed reading is in extreme-greed territory. (The Cryptonomist)
The key battle is now $87,000 resistance/liquidity. A clean breakout and acceptance above that zone would strengthen the bullish structure; rejection could send price back toward the $82,000–$83,000 support zone, which is currently being watched as an important area for buyers. (Moneycontrol)
Institutional flows are also part of the backdrop: Strategy recently added about 950 BTC (~$75–76M), while recent reporting pointed to meaningful spot-Bitcoin ETF inflows. At the same time, BTC has been sensitive to broader risk sentiment, Treasury yields and geopolitical developments, so chasing an extended candle carries additional volatility risk. (The Wall Street Journal)
My framework: bullish while the higher-timeframe structure holds, but I want confirmation rather than blindly buying into resistance. 📊⚡
🎯 Key levels
* 🔴 $87,000 — breakout / liquidity zone
* 🟢 $82,000–$83,000 — major support
* 🟡 $78,500 — deeper invalidation area
BTC setup: breakout confirmation > emotional FOMO. 📈
🚨 $BTC IS BACK ABOVE $85K — BUT THE NEXT MOVE MATTERS
$BTC has rebounded sharply into the $85K–$87K area, with price recently reaching roughly $87K before pulling back. The broader structure remains constructive, but momentum is becoming stretched: one current technical reading places daily RSI around 69, while the market’s Fear & Greed reading is in extreme-greed territory. (The Cryptonomist)
The key battle is now $87,000 resistance/liquidity. A clean breakout and acceptance above that zone would strengthen the bullish structure; rejection could send price back toward the $82,000–$83,000 support zone, which is currently being watched as an important area for buyers. (Moneycontrol)
Institutional flows are also part of the backdrop: Strategy recently added about 950 BTC (~$75–76M), while recent reporting pointed to meaningful spot-Bitcoin ETF inflows. At the same time, BTC has been sensitive to broader risk sentiment, Treasury yields and geopolitical developments, so chasing an extended candle carries additional volatility risk. (The Wall Street Journal)
My framework: bullish while the higher-timeframe structure holds, but I want confirmation rather than blindly buying into resistance. 📊⚡
🎯 Key levels
* 🔴 $87,000 — breakout / liquidity zone
* 🟢 $82,000–$83,000 — major support
* 🟡 $78,500 — deeper invalidation area
BTC setup: breakout confirmation > emotional FOMO. 📈
$BTC has rebounded sharply into the $85K–$87K area, with price recently reaching roughly $87K before pulling back. The broader structure remains constructive, but momentum is becoming stretched: one current technical reading places daily RSI around 69, while the market’s Fear & Greed reading is in extreme-greed territory. (The Cryptonomist)
The key battle is now $87,000 resistance/liquidity. A clean breakout and acceptance above that zone would strengthen the bullish structure; rejection could send price back toward the $82,000–$83,000 support zone, which is currently being watched as an important area for buyers. (Moneycontrol)
Institutional flows are also part of the backdrop: Strategy recently added about 950 BTC (~$75–76M), while recent reporting pointed to meaningful spot-Bitcoin ETF inflows. At the same time, BTC has been sensitive to broader risk sentiment, Treasury yields and geopolitical developments, so chasing an extended candle carries additional volatility risk. (The Wall Street Journal)
My framework: bullish while the higher-timeframe structure holds, but I want confirmation rather than blindly buying into resistance. 📊⚡
🎯 Key levels
* 🔴 $87,000 — breakout / liquidity zone
* 🟢 $82,000–$83,000 — major support
* 🟡 $78,500 — deeper invalidation area
BTC setup: breakout confirmation > emotional FOMO. 📈
1
124
Войдите, чтобы посмотреть больше материала
Присоединяйтесь к пользователям криптовалют по всему миру на Binance Square
⚡️ Получайте новейшую и полезную информацию о криптоактивах.
💬 Нам доверяет крупнейшая в мире криптобиржа.
👍 Получите достоверные аналитические данные от верифицированных создателей контента.
Эл. почта/номер телефона