
BlockViz.xyz
230 Публикации

BlockViz.xyz
Отправить жалобу
Заблокировать пользователя
Crypto price and market data analysis, visualizations, and portfolio simulations. Do your own at → blockviz.xyz
0 подписок(и/а)
3 подписчиков(а)
8 понравилось
Посты
·
--
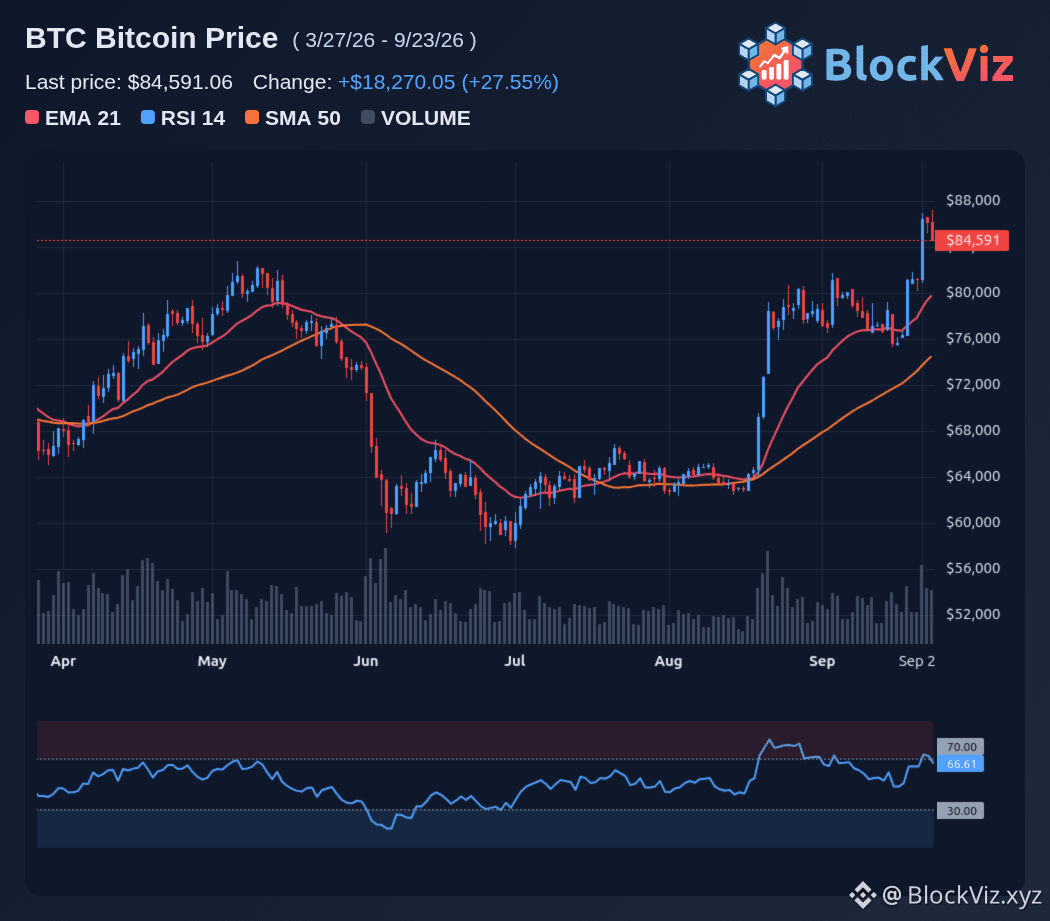
About 18 billion in BTC and ETH options expire Friday, and max pain sits right at 75,000 for Bitcoin. That is roughly 10,000 below the current spot price near 85,000 to 86,000, and it has traders asking whether dealer hedging and gamma flows will drag BTC lower into the 08:00 UTC settlement. The tension is between the max pain magnet and the call-heavy positioning. BTC options are skewed bullish with about 9.4 billion in calls versus 6.5 billion in puts, crowded at 90,000 and 100,000 strikes. For the settlement price to land on max pain, Bitcoin would need to fall 11% to 12% between now and Friday, which is a big move but not impossible in a quarterly expiry week. History shows max pain does not always win, but it often acts as a soft magnet into expiry. In past quarters, BTC has settled closer to max pain when open interest is large and dealer gamma is short. This week, the 70,000 strike has the most open contracts, and puts are stacked at 60,000, 70,000 and 75,000, creating a layered support floor that could limit downside if sellers push toward 75,000. For traders, the setup is clear. Watch 85,000 as the key support and 88,000 to 90,000 for resistance into Friday. A break below 85,000 could open the path to 80,000 and then 75,000 max pain, while a hold above 88,000 would suggest buyers are defending the call-heavy positioning. The next catalysts are the daily options rolls and any large block trades that shift dealer hedges before the 08:00 UTC Friday settlement. $BTC
About 18 billion in BTC and ETH options expire Friday, and max pain sits right at 75,000 for Bitcoin. That is roughly 10,000 below the current spot price near 85,000 to 86,000, and it has traders asking whether dealer hedging and gamma flows will drag BTC lower into the 08:00 UTC settlement. The tension is between the max pain magnet and the call-heavy positioning. BTC options are skewed bullish with about 9.4 billion in calls versus 6.5 billion in puts, crowded at 90,000 and 100,000 strikes. For the settlement price to land on max pain, Bitcoin would need to fall 11% to 12% between now and Friday, which is a big move but not impossible in a quarterly expiry week. History shows max pain does not always win, but it often acts as a soft magnet into expiry. In past quarters, BTC has settled closer to max pain when open interest is large and dealer gamma is short. This week, the 70,000 strike has the most open contracts, and puts are stacked at 60,000, 70,000 and 75,000, creating a layered support floor that could limit downside if sellers push toward 75,000. For traders, the setup is clear. Watch 85,000 as the key support and 88,000 to 90,000 for resistance into Friday. A break below 85,000 could open the path to 80,000 and then 75,000 max pain, while a hold above 88,000 would suggest buyers are defending the call-heavy positioning. The next catalysts are the daily options rolls and any large block trades that shift dealer hedges before the 08:00 UTC Friday settlement. $BTC
60
·
--
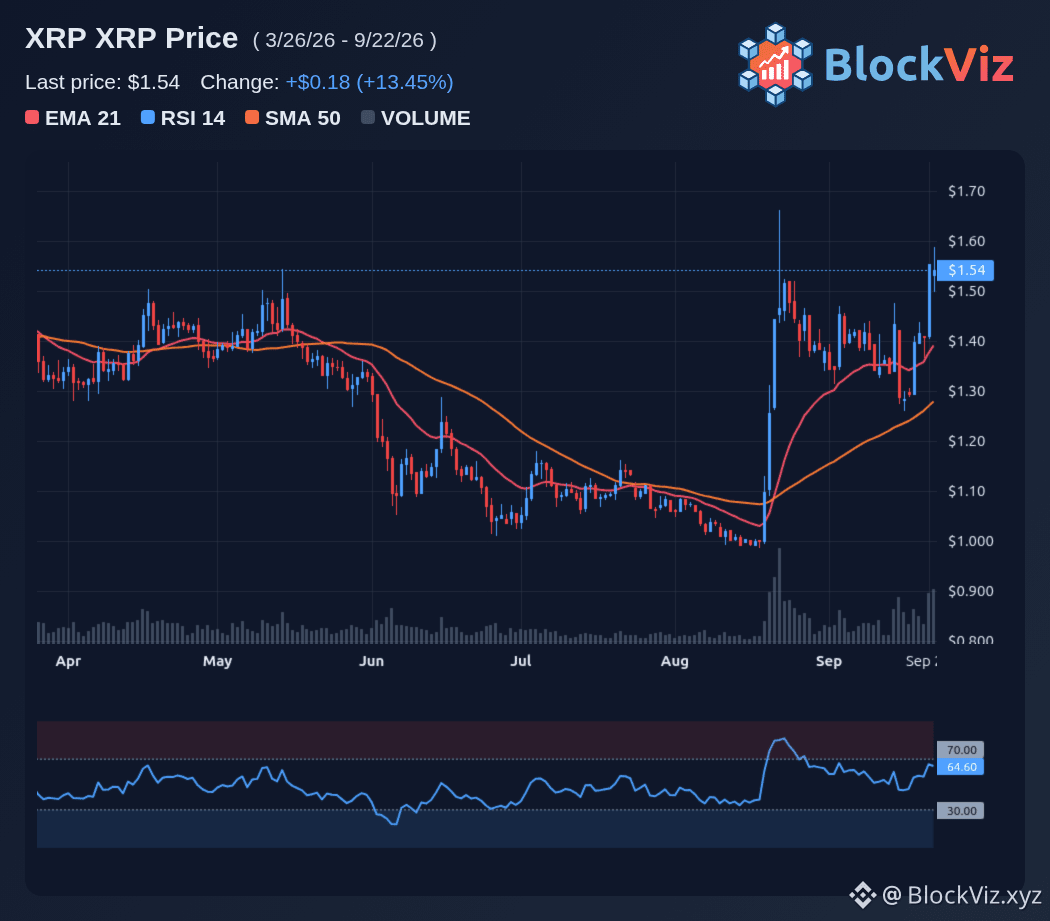
XRP, DOGE, BCH and NEAR just left BTC behind, but not all of these runs are built the same. DOGE is up 14% to 15% in 24 hours, XRP jumped from 1.40 to 1.54, and NEAR is posting double-digit gains with a 55% weekly move. BTC added roughly 5% over the same window, and its dominance slipped to about 57% from 59.2% earlier in September. The tension is whether this is early altseason or just a late-cycle speculative leg. Altcoin Season Index readings are still near 46 to 49, well below the 75 threshold traders use to call a full altseason. NEAR and BCH have strong momentum and clear catalysts, with NEAR up 55% on the week and BCH logging a 14% weekly gain. XRP and DOGE are more mixed, with XRP still almost 10% below its August 22 high and DOGE rallying into heavy leverage and memecoin speculation. For traders, the question is which runs have follow-through and which are fading fast. NEAR and BCH look like the real momentum plays, with sustained volume and breakouts above key resistance. XRP needs a clean break above 1.54 and then 1.60 to confirm the trend, while DOGE is more sensitive to retail flows and could reverse quickly if leverage unwinds. Watch BTC dominance at 57% and the Altcoin Season Index at 50 for signs of a broader rotation. A break below 56% dominance and a push above 55 on the index would signal capital is rotating into alts, while a bounce back above 58% would suggest BTC is still anchoring liquidity. The next catalysts are the September monthly candle close and any follow-through above 1.60 for XRP and 0.10 for DOGE. $XRP
XRP, DOGE, BCH and NEAR just left BTC behind, but not all of these runs are built the same. DOGE is up 14% to 15% in 24 hours, XRP jumped from 1.40 to 1.54, and NEAR is posting double-digit gains with a 55% weekly move. BTC added roughly 5% over the same window, and its dominance slipped to about 57% from 59.2% earlier in September. The tension is whether this is early altseason or just a late-cycle speculative leg. Altcoin Season Index readings are still near 46 to 49, well below the 75 threshold traders use to call a full altseason. NEAR and BCH have strong momentum and clear catalysts, with NEAR up 55% on the week and BCH logging a 14% weekly gain. XRP and DOGE are more mixed, with XRP still almost 10% below its August 22 high and DOGE rallying into heavy leverage and memecoin speculation. For traders, the question is which runs have follow-through and which are fading fast. NEAR and BCH look like the real momentum plays, with sustained volume and breakouts above key resistance. XRP needs a clean break above 1.54 and then 1.60 to confirm the trend, while DOGE is more sensitive to retail flows and could reverse quickly if leverage unwinds. Watch BTC dominance at 57% and the Altcoin Season Index at 50 for signs of a broader rotation. A break below 56% dominance and a push above 55 on the index would signal capital is rotating into alts, while a bounce back above 58% would suggest BTC is still anchoring liquidity. The next catalysts are the September monthly candle close and any follow-through above 1.60 for XRP and 0.10 for DOGE. $XRP
53
·
--
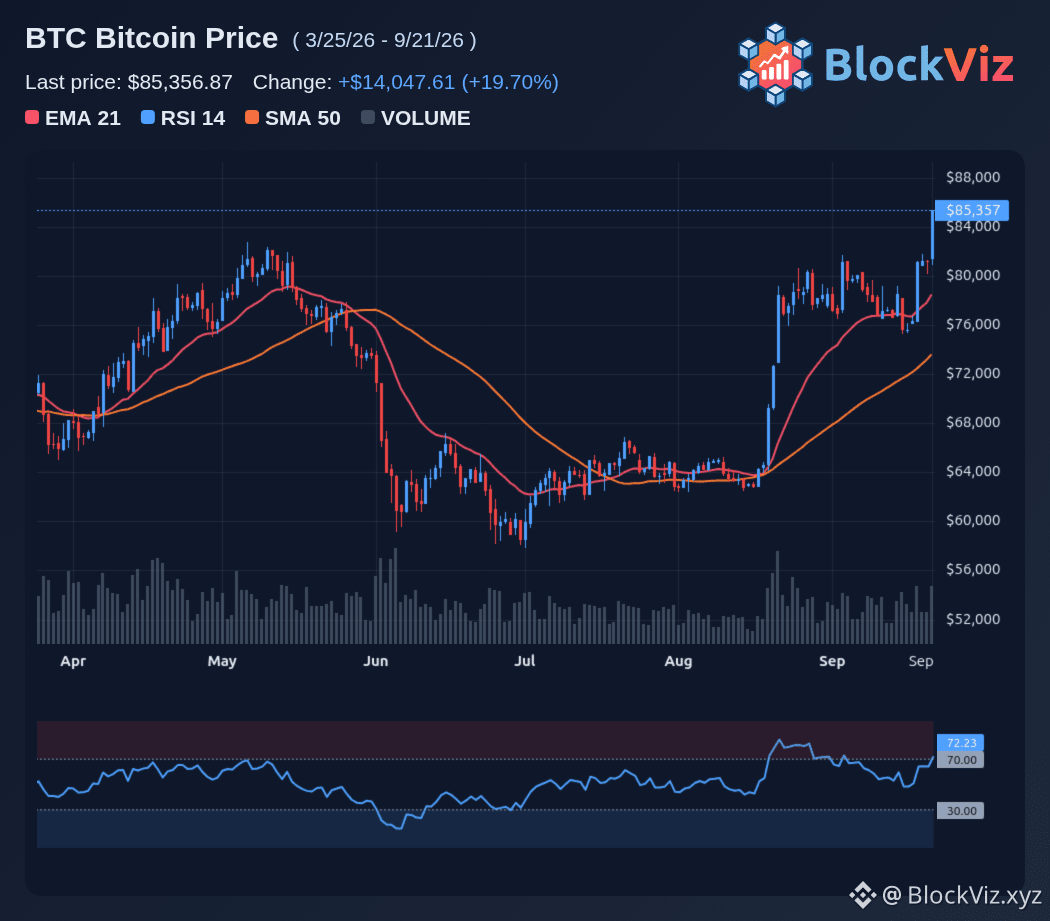
Bitcoin just closed above its 50-week moving average for the first time in 45 weeks, and history says this matters. Galaxy Research notes that in four of five completed bear markets, the first weekly reclaim of the 50W MA confirmed the cycle low was in. That is a signal that has ended 84% of bear markets, and it is flashing green now with BTC closing the week at 81,159 above the 78,788 average. The tension is whether this close is enough to call the bull market or whether we need more confirmation. Analysts are watching 83,000 as the key level that would break the lower-high pattern on the monthly chart and open the path to 90,000. A sustained move above 83,000 would align with past cycles where BTC gained 700% to 900% after breaking the 50W MA, while a failure could see a retest of 78,800 and then 74,000. For traders, the setup is clear. Hold above 80,000 and then 83,000, and the path to 90,000 opens with momentum. Lose 78,800 on a weekly close, and the signal is invalidated, with a drop toward 74,000 to 75,000 likely. The next catalysts are the September monthly candle close and any follow-through above 83,000 to confirm the trend reversal. Watch 83,000 for the breakout and 78,800 for the invalidation. A clean break and hold above 83,000 would signal the bull market has begun, while a weekly close below 78,800 would suggest the bear is not done yet. The 50W MA close is a strong signal, but it is the follow-through that will determine whether 90,000 is next or whether BTC remains stuck in its consolidation phase. $BTC
Bitcoin just closed above its 50-week moving average for the first time in 45 weeks, and history says this matters. Galaxy Research notes that in four of five completed bear markets, the first weekly reclaim of the 50W MA confirmed the cycle low was in. That is a signal that has ended 84% of bear markets, and it is flashing green now with BTC closing the week at 81,159 above the 78,788 average. The tension is whether this close is enough to call the bull market or whether we need more confirmation. Analysts are watching 83,000 as the key level that would break the lower-high pattern on the monthly chart and open the path to 90,000. A sustained move above 83,000 would align with past cycles where BTC gained 700% to 900% after breaking the 50W MA, while a failure could see a retest of 78,800 and then 74,000. For traders, the setup is clear. Hold above 80,000 and then 83,000, and the path to 90,000 opens with momentum. Lose 78,800 on a weekly close, and the signal is invalidated, with a drop toward 74,000 to 75,000 likely. The next catalysts are the September monthly candle close and any follow-through above 83,000 to confirm the trend reversal. Watch 83,000 for the breakout and 78,800 for the invalidation. A clean break and hold above 83,000 would signal the bull market has begun, while a weekly close below 78,800 would suggest the bear is not done yet. The 50W MA close is a strong signal, but it is the follow-through that will determine whether 90,000 is next or whether BTC remains stuck in its consolidation phase. $BTC
1
157
·
--
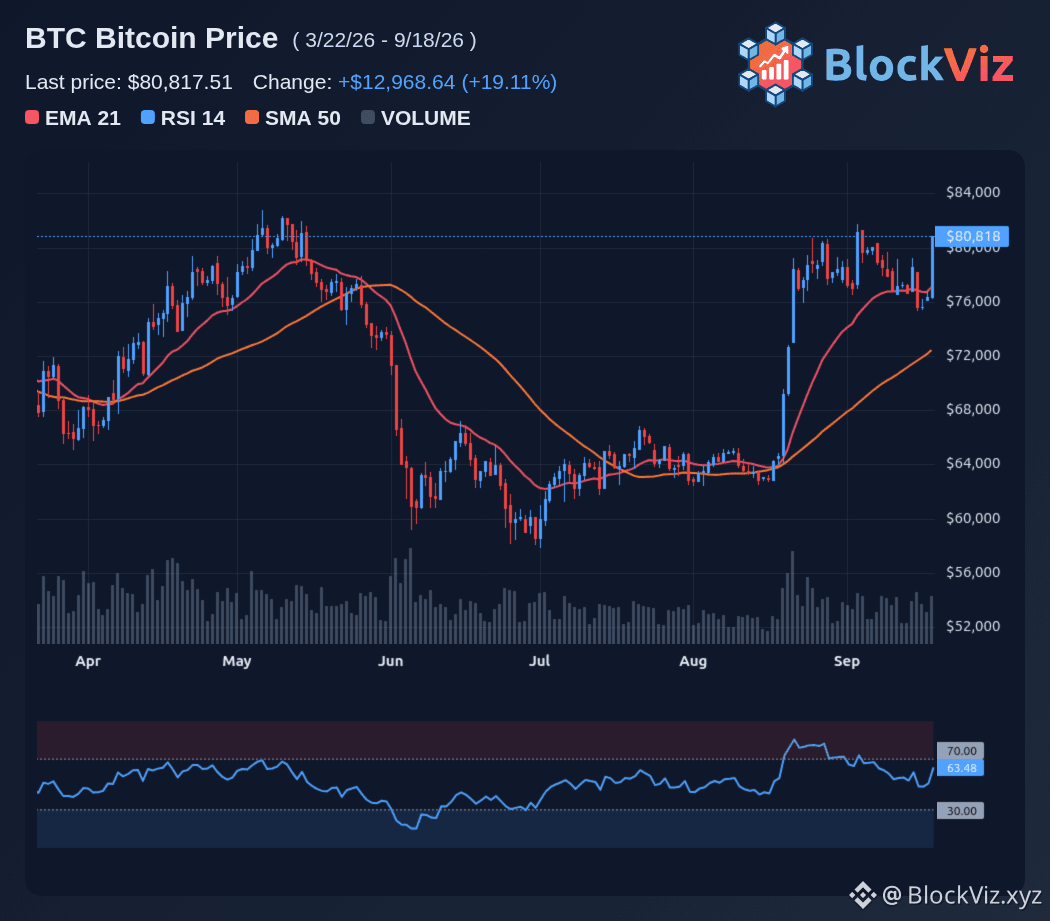
The Fed just hiked rates, but the market is fixated on a different number: 15.6 billion. That is the size of the Treasury's latest bond buyback operation, and it has traders asking whether this is stealth QE that is fueling Bitcoin's breakout toward 80,000. The tension is real. On one side, the Fed raised the policy rate by 25 basis points to 3.75% to 4.00%, the first hike since 2023, and signaled a hawkish path with one more increase possible by year end. On the other side, the Treasury is injecting liquidity through debt buybacks, with up to 14.5 billion per week in purchases and a 15.6 billion operation hitting the market this week. That combination of tightening policy and targeted liquidity is exactly what has BTC ripping from the 76,000s back toward 77,300 to 78,000. For traders, the question is whether this liquidity bid is enough to offset the headwinds from higher rates, ETF outflows, and the Clarity Act setback. BTC has already recovered from a July low near 58,000, gaining nearly 33% into mid-September, but it still faces heavy resistance at 78,000 and then the 365-day moving average near 82,300. A clean break above 78,000 would signal that the Treasury liquidity injection is winning, while a failure could see BTC slide back toward 74,000 to 75,000. Watch the next Treasury buyback announcements and the Fed's balance sheet data for signs of continued liquidity support. The key levels are 78,000 on the upside and 74,000 on the downside. If the 15.6 billion operation is just the start of a larger program, BTC could test 80,000 and then 82,300. If the liquidity tap slows, the hawkish Fed path will likely dominate and push BTC back toward 70,000. $BTC
The Fed just hiked rates, but the market is fixated on a different number: 15.6 billion. That is the size of the Treasury's latest bond buyback operation, and it has traders asking whether this is stealth QE that is fueling Bitcoin's breakout toward 80,000. The tension is real. On one side, the Fed raised the policy rate by 25 basis points to 3.75% to 4.00%, the first hike since 2023, and signaled a hawkish path with one more increase possible by year end. On the other side, the Treasury is injecting liquidity through debt buybacks, with up to 14.5 billion per week in purchases and a 15.6 billion operation hitting the market this week. That combination of tightening policy and targeted liquidity is exactly what has BTC ripping from the 76,000s back toward 77,300 to 78,000. For traders, the question is whether this liquidity bid is enough to offset the headwinds from higher rates, ETF outflows, and the Clarity Act setback. BTC has already recovered from a July low near 58,000, gaining nearly 33% into mid-September, but it still faces heavy resistance at 78,000 and then the 365-day moving average near 82,300. A clean break above 78,000 would signal that the Treasury liquidity injection is winning, while a failure could see BTC slide back toward 74,000 to 75,000. Watch the next Treasury buyback announcements and the Fed's balance sheet data for signs of continued liquidity support. The key levels are 78,000 on the upside and 74,000 on the downside. If the 15.6 billion operation is just the start of a larger program, BTC could test 80,000 and then 82,300. If the liquidity tap slows, the hawkish Fed path will likely dominate and push BTC back toward 70,000. $BTC
71
·
--
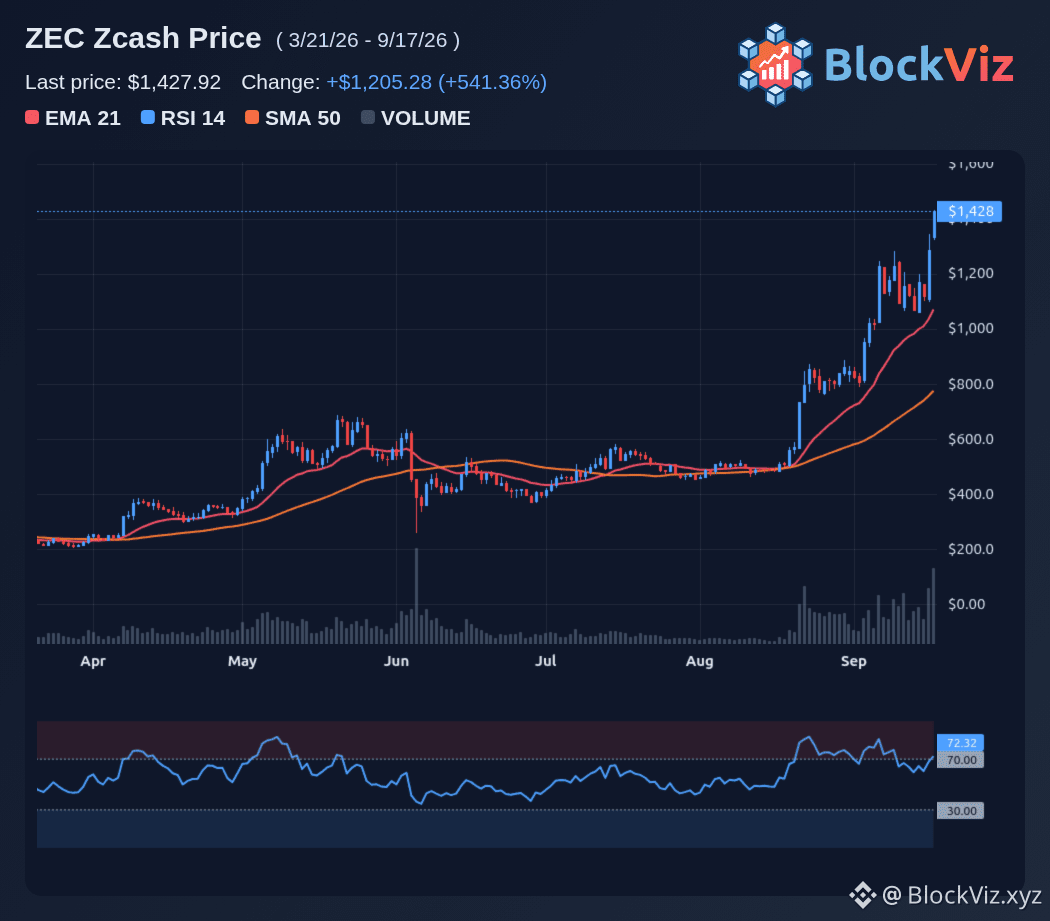
Hackers want Monero. VCs want Zcash. That split is the cleanest read on the privacy trade right now. The Revolut breach just put Monero back in the headlines with a 3 million dollar ransom demand, while Zcash is riding a wave of institutional flows, ETF access, and VC treasury positioning that has pushed ZEC toward 1,400 and extended its lead over XMR by more than 10 billion in market cap. The tension matters because the two assets are now telling different stories. Monero is the default privacy choice for illicit actors, with every transaction hidden at the protocol level and no viewing key option. That keeps demand high in the underground economy but also keeps regulated venues away, with Kraken and other EU platforms already restricting XMR ahead of the July 2027 AMLR ban. Zcash, by contrast, offers optional shielded transactions and viewing keys that let holders disclose details to auditors or regulators, which is exactly why Grayscale could launch a US-listed product and why funds like Multicoin Capital and Cypherpunk have built large ZEC positions. For traders, the question is whether the privacy bid rotates further into ZEC or whether Monero's illicit-use narrative and delisting pressure create a contrarian setup. ZEC has outperformed on institutional inflows, with more than 34 million in net flows reported in the first two weeks of the ZCSH product and fresh liquidity from THORChain integration and SwissBorg listing. XMR remains more sensitive to exchange delistings and regulatory headlines, but it still commands deep liquidity in OTC and non-KYC venues. Watch ZEC around 1,400 and then 1,500 for the next leg, with a failure back below 1,200 signaling a cooling institutional bid. For XMR, monitor whether it can hold key support after the Revolut headlines fade and whether any new exc... $ZEC
Hackers want Monero. VCs want Zcash. That split is the cleanest read on the privacy trade right now. The Revolut breach just put Monero back in the headlines with a 3 million dollar ransom demand, while Zcash is riding a wave of institutional flows, ETF access, and VC treasury positioning that has pushed ZEC toward 1,400 and extended its lead over XMR by more than 10 billion in market cap. The tension matters because the two assets are now telling different stories. Monero is the default privacy choice for illicit actors, with every transaction hidden at the protocol level and no viewing key option. That keeps demand high in the underground economy but also keeps regulated venues away, with Kraken and other EU platforms already restricting XMR ahead of the July 2027 AMLR ban. Zcash, by contrast, offers optional shielded transactions and viewing keys that let holders disclose details to auditors or regulators, which is exactly why Grayscale could launch a US-listed product and why funds like Multicoin Capital and Cypherpunk have built large ZEC positions. For traders, the question is whether the privacy bid rotates further into ZEC or whether Monero's illicit-use narrative and delisting pressure create a contrarian setup. ZEC has outperformed on institutional inflows, with more than 34 million in net flows reported in the first two weeks of the ZCSH product and fresh liquidity from THORChain integration and SwissBorg listing. XMR remains more sensitive to exchange delistings and regulatory headlines, but it still commands deep liquidity in OTC and non-KYC venues. Watch ZEC around 1,400 and then 1,500 for the next leg, with a failure back below 1,200 signaling a cooling institutional bid. For XMR, monitor whether it can hold key support after the Revolut headlines fade and whether any new exc... $ZEC
52
·
--
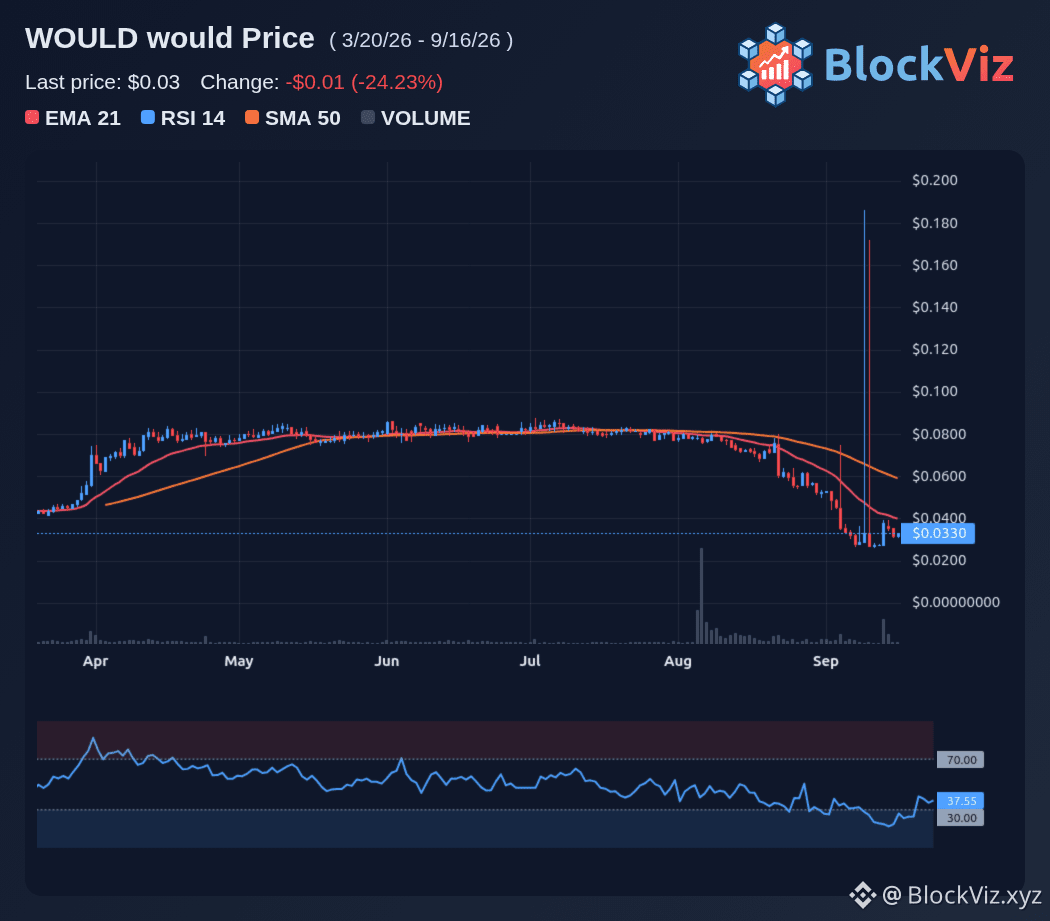
The first Fed hike in three years is now the main event, but the real risk for crypto is not the hike itself. Markets are pricing a 92% to 93% chance of a 25 basis point move to 3.75% to 4.00%, so the headline is largely expected. What can move BTC from the 75,000 to 78,000 range is a surprise hold or a dot plot and press conference tone that is more hawkish or dovish than priced in. A surprise hold would be the bigger shock. It would force shorts to cover quickly and could push Bitcoin through 78,189, with XRP and ETH also breaking key resistance. The odds are against it, but that is exactly why a hold would hit harder than a standard hike. The more likely scenario is a hike with the market watching the dot plot for clues on whether another move is coming in October or December. BTC is already down from the low 80,000s after the Clarity Act failed to clear the 60-vote hurdle, and it briefly dipped below 75,000 before stabilizing near 75,500 to 75,900. A hawkish dot plot or guidance could extend the move toward 74,000 and then 70,000. A neutral to dovish read could help BTC reclaim 78,000 and test 80,000 again. Traders should watch the 2 p.m. ET decision, the dot plot projections and Warsh's press conference at 2:30 p.m. ET. The key levels are 74,000 on the downside and 78,189 on the upside. A close below 74,000 would confirm a hawkish read, while a break and hold above 78,189 would signal that the market is treating the hike as a buy-the-news event. $WOULD
The first Fed hike in three years is now the main event, but the real risk for crypto is not the hike itself. Markets are pricing a 92% to 93% chance of a 25 basis point move to 3.75% to 4.00%, so the headline is largely expected. What can move BTC from the 75,000 to 78,000 range is a surprise hold or a dot plot and press conference tone that is more hawkish or dovish than priced in. A surprise hold would be the bigger shock. It would force shorts to cover quickly and could push Bitcoin through 78,189, with XRP and ETH also breaking key resistance. The odds are against it, but that is exactly why a hold would hit harder than a standard hike. The more likely scenario is a hike with the market watching the dot plot for clues on whether another move is coming in October or December. BTC is already down from the low 80,000s after the Clarity Act failed to clear the 60-vote hurdle, and it briefly dipped below 75,000 before stabilizing near 75,500 to 75,900. A hawkish dot plot or guidance could extend the move toward 74,000 and then 70,000. A neutral to dovish read could help BTC reclaim 78,000 and test 80,000 again. Traders should watch the 2 p.m. ET decision, the dot plot projections and Warsh's press conference at 2:30 p.m. ET. The key levels are 74,000 on the downside and 78,189 on the upside. A close below 74,000 would confirm a hawkish read, while a break and hold above 78,189 would signal that the market is treating the hike as a buy-the-news event. $WOULD
74
·
--
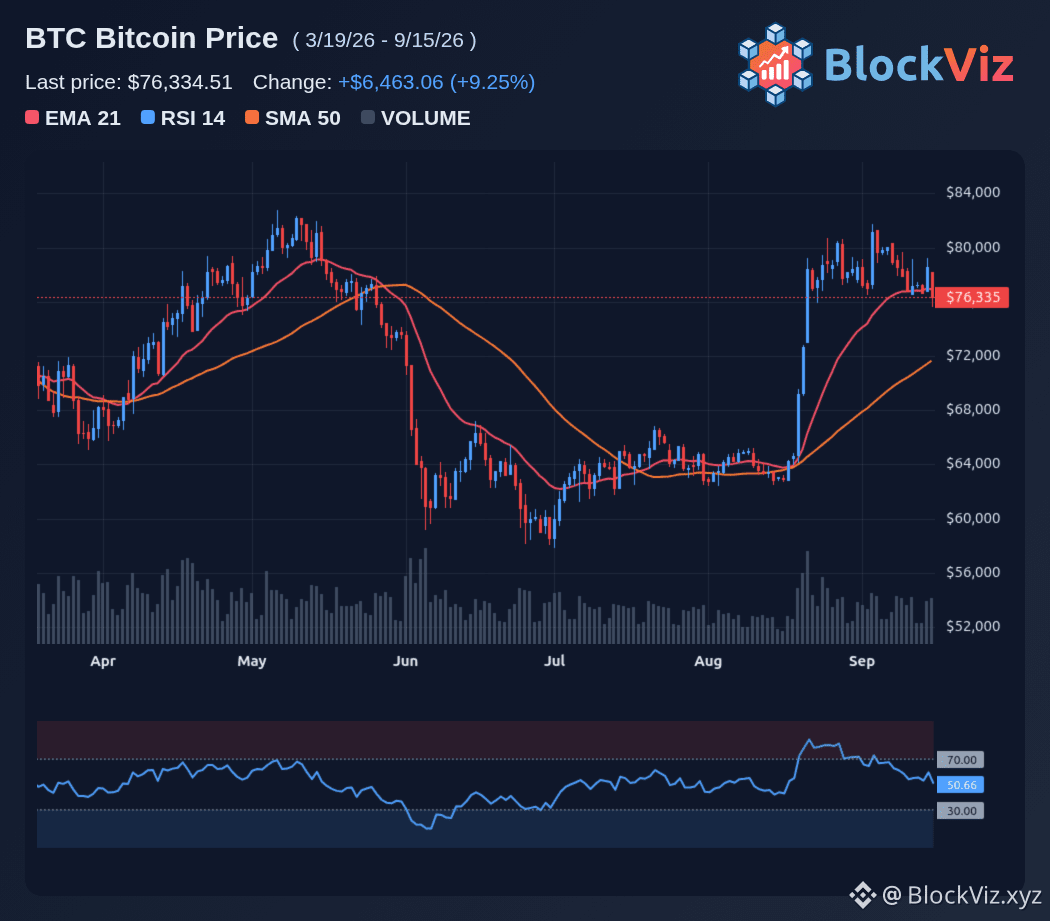
The Clarity Act just went from priced-in win to real doubt in less than 24 hours. Prediction markets saw passage odds jump from about 14% to near 30% over the weekend, then crash back toward 14% to 18% on Tuesday as Democrats pushed back on ethics provisions and banks, state attorneys general and Elizabeth Warren all voiced opposition. The immediate test is the Senate cloture vote at 2:15 p.m. ET. This is not final passage. It is a procedural vote on whether the Senate can even start debating the bill, and it needs 60 yes votes. Republicans hold 53 seats, so at least seven Democrats must cross the aisle, with some analysts saying the real number could be closer to nine if one or two Republicans defect on procedure. That is why BTC slid from the high 70,000s toward 76,000 and why majors turned red across the board. The market spent Monday pricing a regulatory win and then spent Tuesday morning taking that bet back off the table. If cloture clears, the bill moves to formal debate and a final vote that only needs 51 votes. If it fails, the Clarity Act is likely dead for 2026 and possibly until after the midterms. Traders should watch the vote count, whether it lands above or below 60, and how BTC reacts around 76,000 to 78,000. A close failure in the 55 to 59 range would keep some hope for 2027. A clear miss would shift focus back to macro, with the Fed decision and liquidity conditions dominating the next move. $BTC
The Clarity Act just went from priced-in win to real doubt in less than 24 hours. Prediction markets saw passage odds jump from about 14% to near 30% over the weekend, then crash back toward 14% to 18% on Tuesday as Democrats pushed back on ethics provisions and banks, state attorneys general and Elizabeth Warren all voiced opposition. The immediate test is the Senate cloture vote at 2:15 p.m. ET. This is not final passage. It is a procedural vote on whether the Senate can even start debating the bill, and it needs 60 yes votes. Republicans hold 53 seats, so at least seven Democrats must cross the aisle, with some analysts saying the real number could be closer to nine if one or two Republicans defect on procedure. That is why BTC slid from the high 70,000s toward 76,000 and why majors turned red across the board. The market spent Monday pricing a regulatory win and then spent Tuesday morning taking that bet back off the table. If cloture clears, the bill moves to formal debate and a final vote that only needs 51 votes. If it fails, the Clarity Act is likely dead for 2026 and possibly until after the midterms. Traders should watch the vote count, whether it lands above or below 60, and how BTC reacts around 76,000 to 78,000. A close failure in the 55 to 59 range would keep some hope for 2027. A clear miss would shift focus back to macro, with the Fed decision and liquidity conditions dominating the next move. $BTC
48
·
--
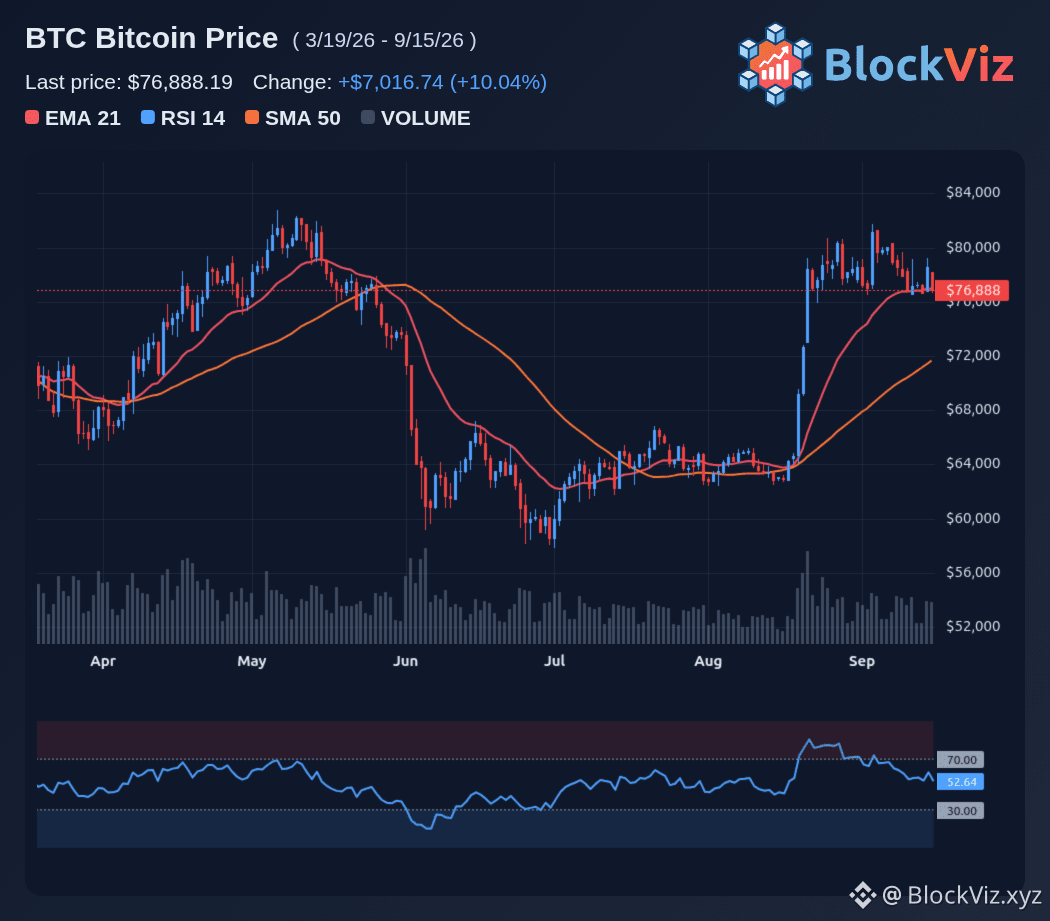
Two very different narratives are colliding this week. On the policy side, Trump's ethics concession lifted Clarity Act odds to around 32% to 34%, setting up a key Senate vote. On the flow side, BlackRock's ETH products have now seen 20 straight days of net inflows, with ETHA and the staking-enabled ETHB pulling in hundreds of millions while BTC ETFs bled about 463 million over four sessions before a partial rebound. That divergence is why people are asking whether Wall Street is quietly tilting toward ETH. Ethereum ETFs drew roughly 197 million last week and then another 281 million on Monday, with BlackRock supplying the largest share. Bitcoin ETFs, by contrast, just ended their best three-week inflow streak of 2026 with a 462.7 million outflow week, even as IBIT managed a 160 million inflow day on September 14. The macro overlay matters. Markets are pricing a high probability of a 25 basis point Fed hike on September 16, which would tighten liquidity and strengthen the dollar right as Clarity hopes to lift sentiment. BTC has been rejected multiple times at 82,000 and is hovering in the high 70,000s, while ETH has shown more relative strength into the decision. Traders should watch Tuesday's cloture outcome, Wednesday's Fed decision, and whether BTC can reclaim 80,000 to 82,000 while ETH holds above 2,500. If Clarity advances and the Fed pauses, both BTC and ETH can rerate higher. If Clarity stalls and the Fed hikes, the macro headwind may dominate, and the ETH-BTC flow divergence will be the key tell on whether institutions are really rotating or just tactically positioning. $BTC
Two very different narratives are colliding this week. On the policy side, Trump's ethics concession lifted Clarity Act odds to around 32% to 34%, setting up a key Senate vote. On the flow side, BlackRock's ETH products have now seen 20 straight days of net inflows, with ETHA and the staking-enabled ETHB pulling in hundreds of millions while BTC ETFs bled about 463 million over four sessions before a partial rebound. That divergence is why people are asking whether Wall Street is quietly tilting toward ETH. Ethereum ETFs drew roughly 197 million last week and then another 281 million on Monday, with BlackRock supplying the largest share. Bitcoin ETFs, by contrast, just ended their best three-week inflow streak of 2026 with a 462.7 million outflow week, even as IBIT managed a 160 million inflow day on September 14. The macro overlay matters. Markets are pricing a high probability of a 25 basis point Fed hike on September 16, which would tighten liquidity and strengthen the dollar right as Clarity hopes to lift sentiment. BTC has been rejected multiple times at 82,000 and is hovering in the high 70,000s, while ETH has shown more relative strength into the decision. Traders should watch Tuesday's cloture outcome, Wednesday's Fed decision, and whether BTC can reclaim 80,000 to 82,000 while ETH holds above 2,500. If Clarity advances and the Fed pauses, both BTC and ETH can rerate higher. If Clarity stalls and the Fed hikes, the macro headwind may dominate, and the ETH-BTC flow divergence will be the key tell on whether institutions are really rotating or just tactically positioning. $BTC
60
·
--
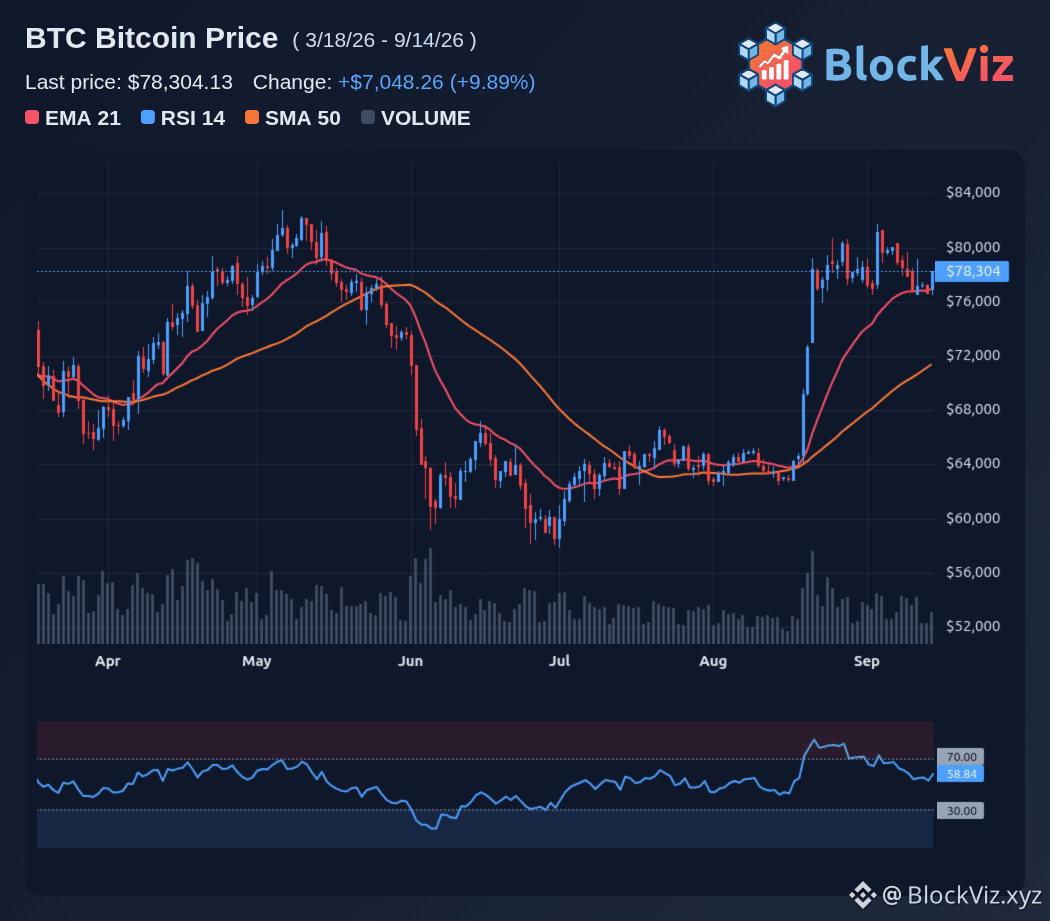
The Clarity Act just got its best political tailwind in months, but the Fed is still the bigger hammer. Trump's concession on ethics provisions has lifted the odds of the bill becoming law to around 32% on prediction markets, up from the low teens last week. A cloture vote is scheduled for Tuesday, and sponsors say they expect to clear the 60-vote threshold needed to advance debate. That is the bullish setup for crypto. If Clarity passes, it would create the first clear U.S. regulatory framework for digital assets, splitting oversight between the SEC and CFTC and potentially unlocking more institutional participation. Bernstein notes that any positive surprise is not priced in, with Bitcoin hovering near 77,700 to 80,000 and XRP up about 4% on the news. The problem is timing. The Fed meets on September 16, one day after the Senate vote, and markets are pricing a high probability of a 25 basis point rate hike. A hike would tighten liquidity, strengthen the dollar and pressure risk assets just as Clarity hopes to lift sentiment. Bitcoin has already been rejected multiple times at 82,000, and a hawkish Fed could push it back toward 77,300 and then 75,500 if Clarity fails or disappoints. Traders should watch Tuesday's cloture outcome, Wednesday's Fed decision and whether BTC can close above 82,283 before the Fed speaks. If Clarity advances and the Fed pauses or signals a dovish path, 80,000 to 82,000 could flip from resistance to support. If Clarity stalls and the Fed hikes, the macro headwind may dominate, regardless of the regulatory progress. $BTC
The Clarity Act just got its best political tailwind in months, but the Fed is still the bigger hammer. Trump's concession on ethics provisions has lifted the odds of the bill becoming law to around 32% on prediction markets, up from the low teens last week. A cloture vote is scheduled for Tuesday, and sponsors say they expect to clear the 60-vote threshold needed to advance debate. That is the bullish setup for crypto. If Clarity passes, it would create the first clear U.S. regulatory framework for digital assets, splitting oversight between the SEC and CFTC and potentially unlocking more institutional participation. Bernstein notes that any positive surprise is not priced in, with Bitcoin hovering near 77,700 to 80,000 and XRP up about 4% on the news. The problem is timing. The Fed meets on September 16, one day after the Senate vote, and markets are pricing a high probability of a 25 basis point rate hike. A hike would tighten liquidity, strengthen the dollar and pressure risk assets just as Clarity hopes to lift sentiment. Bitcoin has already been rejected multiple times at 82,000, and a hawkish Fed could push it back toward 77,300 and then 75,500 if Clarity fails or disappoints. Traders should watch Tuesday's cloture outcome, Wednesday's Fed decision and whether BTC can close above 82,283 before the Fed speaks. If Clarity advances and the Fed pauses or signals a dovish path, 80,000 to 82,000 could flip from resistance to support. If Clarity stalls and the Fed hikes, the macro headwind may dominate, regardless of the regulatory progress. $BTC
70
·
--
Hunter Biden is turning political meme warfare into an on-chain experiment. LAPTOP, a 1 billion supply memecoin launching on Base on September 9, is allocating 20% of its tokens to airdrops that include wallets that lost money on TRUMP, plus subscribers to his Substack and Andrew Callaghan's Channel 5 list. The angle is obvious: target the underwater TRUMP bagholders and frame LAPTOP as the coin funded by the other side's losses. About 20 million LAPTOP is reportedly reserved for TRUMP-loss recipients, distributed through participating exchanges, while the rest of the airdrop goes to early subscribers. Founders hold 30% locked for six months, with additional event-based burns tied to political and market milestones. The degen vote will likely split along lines rather than logic. TRUMP holders who are deep in loss now have a potential recovery narrative, but they are being asked to engage with a token explicitly designed to mock their position. Biden and crypto-native degens may see it as a clever distribution mechanism, but the overlap between Substack subscribers and active memecoin traders is not guaranteed. Traders should watch the launch liquidity, whether the airdrop creates immediate sell pressure, and how TRUMP itself reacts as the snapshot and claim window approach. If LAPTOP opens strong and holds, it could pull attention and volume toward Base memecoins. If it fades quickly, this may be remembered as a political stunt rather than a lasting shift in where the degen flow goes. $ETH
Hunter Biden is turning political meme warfare into an on-chain experiment. LAPTOP, a 1 billion supply memecoin launching on Base on September 9, is allocating 20% of its tokens to airdrops that include wallets that lost money on TRUMP, plus subscribers to his Substack and Andrew Callaghan's Channel 5 list. The angle is obvious: target the underwater TRUMP bagholders and frame LAPTOP as the coin funded by the other side's losses. About 20 million LAPTOP is reportedly reserved for TRUMP-loss recipients, distributed through participating exchanges, while the rest of the airdrop goes to early subscribers. Founders hold 30% locked for six months, with additional event-based burns tied to political and market milestones. The degen vote will likely split along lines rather than logic. TRUMP holders who are deep in loss now have a potential recovery narrative, but they are being asked to engage with a token explicitly designed to mock their position. Biden and crypto-native degens may see it as a clever distribution mechanism, but the overlap between Substack subscribers and active memecoin traders is not guaranteed. Traders should watch the launch liquidity, whether the airdrop creates immediate sell pressure, and how TRUMP itself reacts as the snapshot and claim window approach. If LAPTOP opens strong and holds, it could pull attention and volume toward Base memecoins. If it fades quickly, this may be remembered as a political stunt rather than a lasting shift in where the degen flow goes. $ETH

54
·
--
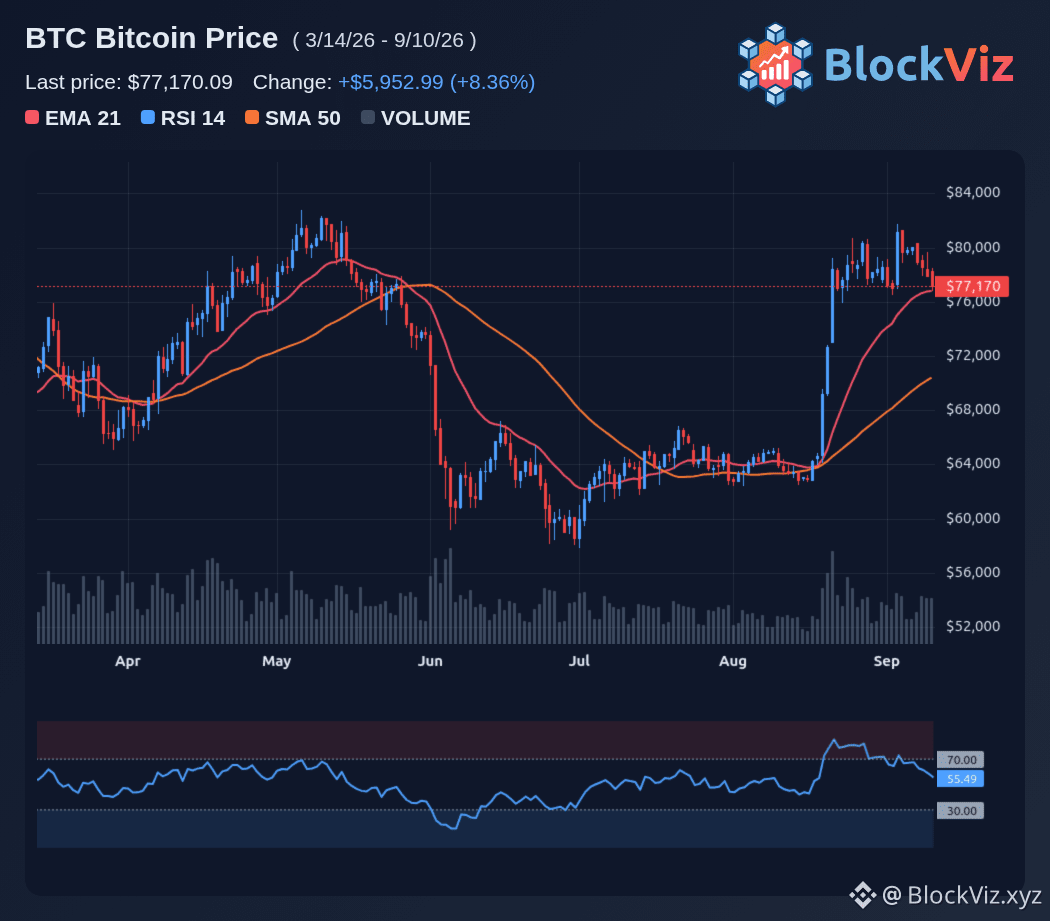
Stimulus talk is back, and the market is immediately asking whether this can replay the 2020 Bitcoin run. The setup is different this time. In 2020, fresh fiscal and monetary stimulus flooded the system while BTC was still priced around 10,000 dollars and had years of adoption ahead. Now BTC is consolidating near 80,000 to 82,000 after a strong August, with a much larger market cap and more institutional ownership. The bullish argument is that any new 1 trillion dollar stimulus package would weaken the dollar, lift inflation expectations and push investors back into hard assets. Bitcoin’s 90-day correlation with gold just hit a six-year high above 0.5, echoing the 2020 stimulus era. If liquidity expands again, the debasement trade could extend the rally toward 90,000 and then 100,000. The bearish case is that stimulus alone may not be enough. Rate expectations, Treasury yields and the dollar still matter, and BTC is no longer the small, high-beta asset it was in 2020. A stimulus headline without follow-through could produce a sell-the-news reaction, especially if price fails to break cleanly above 82,000 to 84,000. Traders should watch whether BTC can hold 80,000 as support, whether a stimulus push drives fresh ETF inflows and a weaker dollar, and whether gold and BTC continue to move together. If stimulus leads to sustained liquidity expansion, 100K is back in play. If the move fades at resistance, this may be another macro headfake rather than a 2020-style rerating. $BTC
Stimulus talk is back, and the market is immediately asking whether this can replay the 2020 Bitcoin run. The setup is different this time. In 2020, fresh fiscal and monetary stimulus flooded the system while BTC was still priced around 10,000 dollars and had years of adoption ahead. Now BTC is consolidating near 80,000 to 82,000 after a strong August, with a much larger market cap and more institutional ownership. The bullish argument is that any new 1 trillion dollar stimulus package would weaken the dollar, lift inflation expectations and push investors back into hard assets. Bitcoin’s 90-day correlation with gold just hit a six-year high above 0.5, echoing the 2020 stimulus era. If liquidity expands again, the debasement trade could extend the rally toward 90,000 and then 100,000. The bearish case is that stimulus alone may not be enough. Rate expectations, Treasury yields and the dollar still matter, and BTC is no longer the small, high-beta asset it was in 2020. A stimulus headline without follow-through could produce a sell-the-news reaction, especially if price fails to break cleanly above 82,000 to 84,000. Traders should watch whether BTC can hold 80,000 as support, whether a stimulus push drives fresh ETF inflows and a weaker dollar, and whether gold and BTC continue to move together. If stimulus leads to sustained liquidity expansion, 100K is back in play. If the move fades at resistance, this may be another macro headfake rather than a 2020-style rerating. $BTC
57
·
--
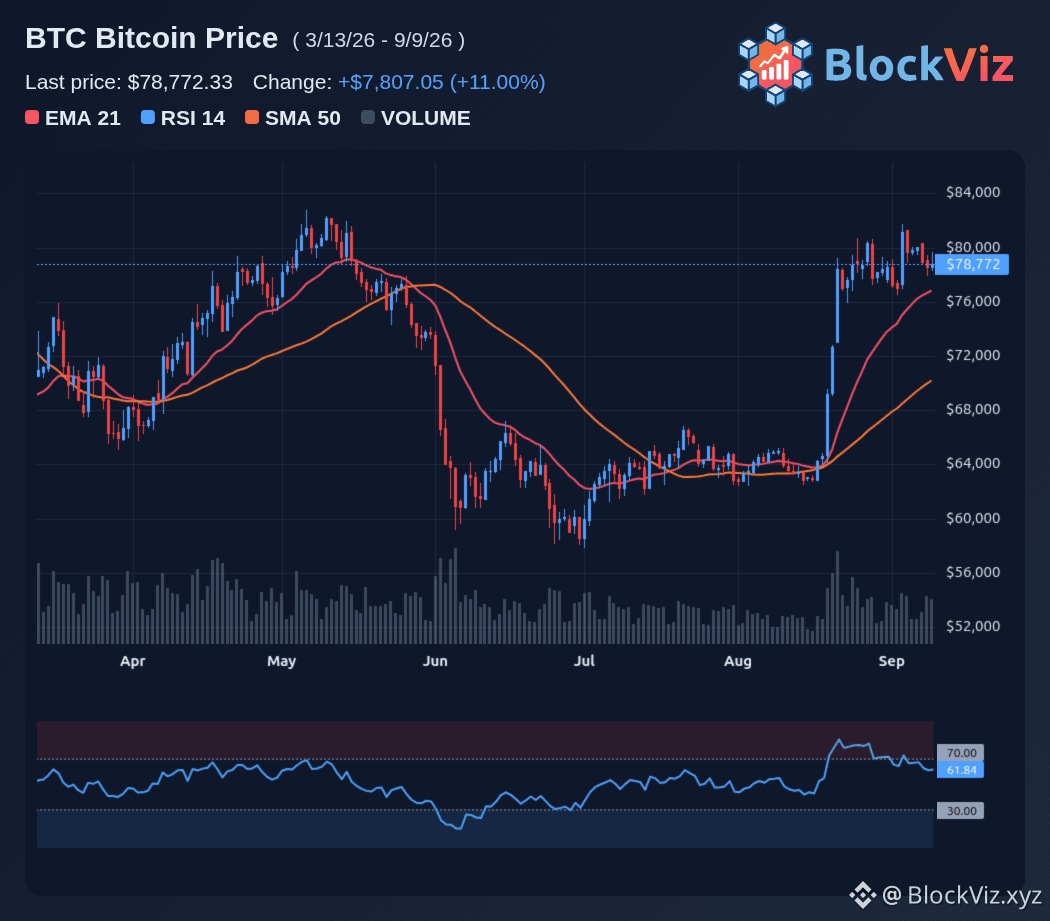
ZEC and XRP are the ones actually breaking out, but the bigger question is whether this is isolated strength or the first real push into altseason. ZEC has been the clear leader, rallying more than 16% in 24 hours and pressing the 960 to 1,000 dollar zone. A daily close above 1,000 would open a path toward 1,200, while support sits around 935. XRP is up about 10% on the week, breaking from 1.31 to a high near 1.48 and now consolidating around 1.45. A clean move through 1.48 would put 1.50 and then 1.66 back in play. The tension is in the context. Bitcoin is also strong above 80,000, and BTC dominance is still near 57 to 58%. Classic altseason usually needs BTC to stall while dominance rolls over toward 55% or lower, allowing capital to rotate more aggressively into alts. Right now this looks more like a selective breakout in ZEC and XRP than a broad handover. For altseason to be confirmed, traders should watch whether ZEC and XRP can hold gains if BTC pulls back, whether BTC dominance starts to fall, and whether breadth improves beyond privacy and large-cap names. If alts keep outperforming while BTC consolidates, the rotation case strengthens. If this fades with the next BTC dip, it was likely a tactical move, not a regime change. $XRP
ZEC and XRP are the ones actually breaking out, but the bigger question is whether this is isolated strength or the first real push into altseason. ZEC has been the clear leader, rallying more than 16% in 24 hours and pressing the 960 to 1,000 dollar zone. A daily close above 1,000 would open a path toward 1,200, while support sits around 935. XRP is up about 10% on the week, breaking from 1.31 to a high near 1.48 and now consolidating around 1.45. A clean move through 1.48 would put 1.50 and then 1.66 back in play. The tension is in the context. Bitcoin is also strong above 80,000, and BTC dominance is still near 57 to 58%. Classic altseason usually needs BTC to stall while dominance rolls over toward 55% or lower, allowing capital to rotate more aggressively into alts. Right now this looks more like a selective breakout in ZEC and XRP than a broad handover. For altseason to be confirmed, traders should watch whether ZEC and XRP can hold gains if BTC pulls back, whether BTC dominance starts to fall, and whether breadth improves beyond privacy and large-cap names. If alts keep outperforming while BTC consolidates, the rotation case strengthens. If this fades with the next BTC dip, it was likely a tactical move, not a regime change. $XRP
67
·
--
Hunter Biden is turning political meme warfare into an on-chain experiment. LAPTOP, a 1 billion supply memecoin launching on Base on September 9, is allocating 20% of its tokens to airdrops that include wallets that lost money on TRUMP, plus subscribers to his Substack and Andrew Callaghan's Channel 5 list. The angle is obvious: target the underwater TRUMP bagholders and frame LAPTOP as the coin funded by the other side's losses. About 20 million LAPTOP is reportedly reserved for TRUMP-loss recipients, distributed through participating exchanges, while the rest of the airdrop goes to early subscribers. Founders hold 30% locked for six months, with additional event-based burns tied to political and market milestones. The degen vote will likely split along lines rather than logic. TRUMP holders who are deep in loss now have a potential recovery narrative, but they are being asked to engage with a token explicitly designed to mock their position. Biden and crypto-native degens may see it as a clever distribution mechanism, but the overlap between Substack subscribers and active memecoin traders is not guaranteed. Traders should watch the launch liquidity, whether the airdrop creates immediate sell pressure, and how TRUMP itself reacts as the snapshot and claim window approach. If LAPTOP opens strong and holds, it could pull attention and volume toward Base memecoins. If it fades quickly, this may be remembered as a political stunt rather than a lasting shift in where the degen flow goes.
Hunter Biden is turning political meme warfare into an on-chain experiment. LAPTOP, a 1 billion supply memecoin launching on Base on September 9, is allocating 20% of its tokens to airdrops that include wallets that lost money on TRUMP, plus subscribers to his Substack and Andrew Callaghan's Channel 5 list. The angle is obvious: target the underwater TRUMP bagholders and frame LAPTOP as the coin funded by the other side's losses. About 20 million LAPTOP is reportedly reserved for TRUMP-loss recipients, distributed through participating exchanges, while the rest of the airdrop goes to early subscribers. Founders hold 30% locked for six months, with additional event-based burns tied to political and market milestones. The degen vote will likely split along lines rather than logic. TRUMP holders who are deep in loss now have a potential recovery narrative, but they are being asked to engage with a token explicitly designed to mock their position. Biden and crypto-native degens may see it as a clever distribution mechanism, but the overlap between Substack subscribers and active memecoin traders is not guaranteed. Traders should watch the launch liquidity, whether the airdrop creates immediate sell pressure, and how TRUMP itself reacts as the snapshot and claim window approach. If LAPTOP opens strong and holds, it could pull attention and volume toward Base memecoins. If it fades quickly, this may be remembered as a political stunt rather than a lasting shift in where the degen flow goes.
49
·
--
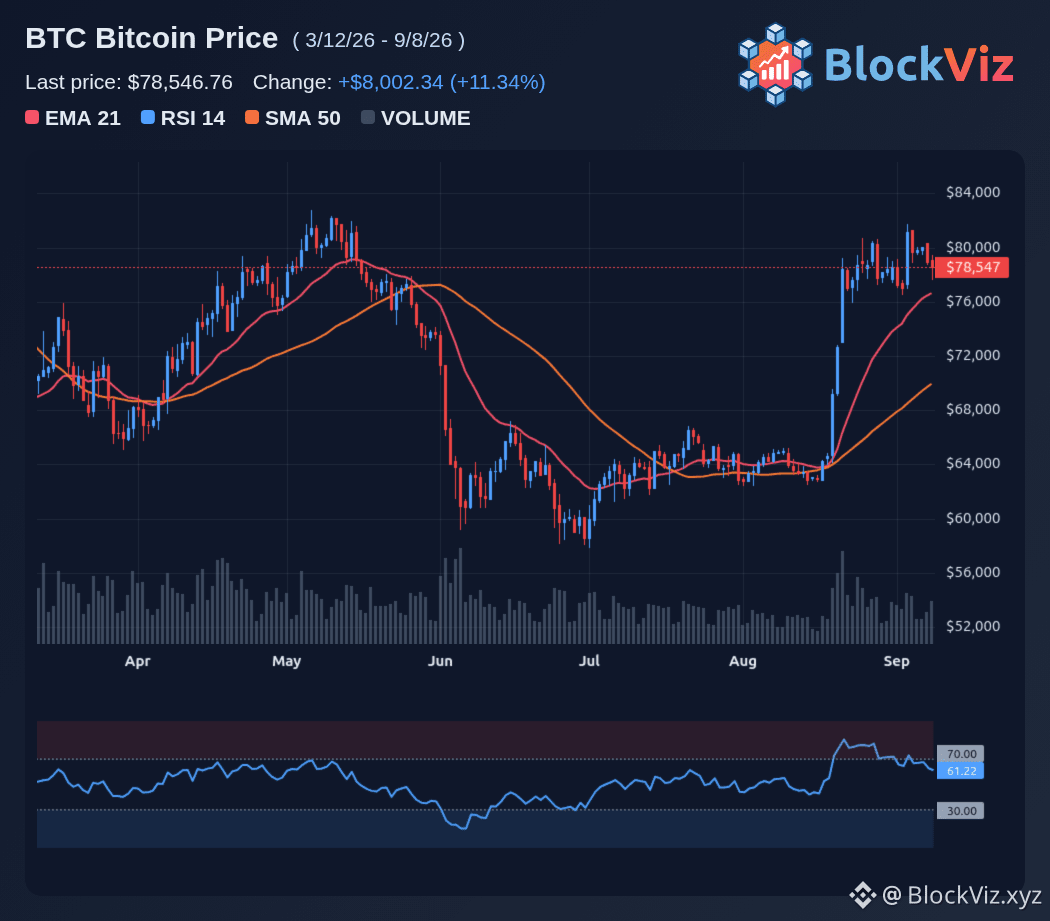
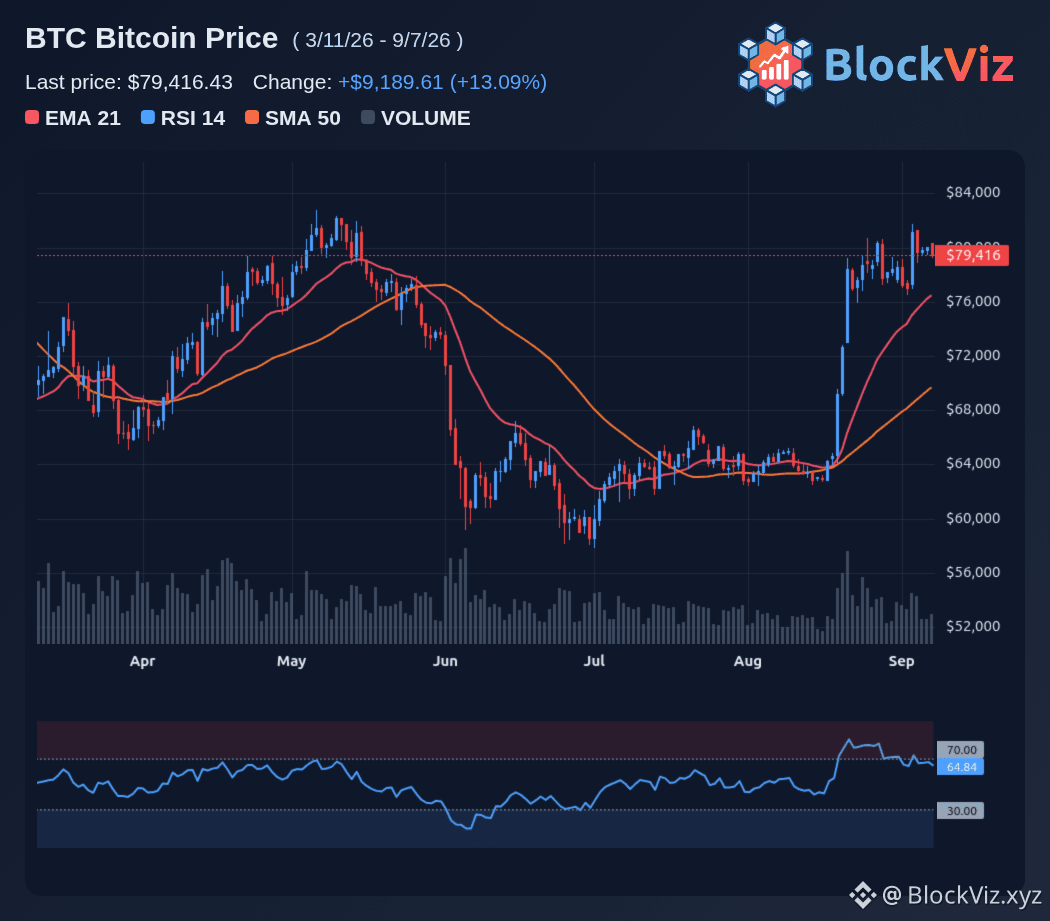
Bitcoin is flirting with one of its most watched technical signals, and the history behind it is hard to ignore. The 50-day moving average is closing in on the 200-day line, setting up a potential golden cross that has only delivered massive moves a few times in the past. In 2012, 2015 and 2020, this pattern preceded gains of more than 300% over the following year. That does not mean 100K is automatic. BTC is currently consolidating between 75,000 and 82,000 after a strong August, but it still needs a decisive break above the 81,500 to 84,400 supply zone to reopen the path toward 98,000 and 100,000. The golden cross itself is a lagging signal, so price action must confirm it. The bullish case improves if BTC holds above 80,000, completes the cross and attracts fresh ETF inflows while macro pressure eases. The bearish risk is a failure at 82,000 to 84,400, followed by a drop back below 75,000 and a test of the 200-day average near 72,500. Traders should watch the 50-day and 200-day convergence, a daily close above 84,400 as breakout confirmation, and whether support at 75,000 to 76,800 holds. If the cross forms with strong volume and institutional flows, 100K moves from narrative to realistic target. If price rejects hard at resistance, the signal may prove to be another false start. $BTC
Bitcoin is flirting with one of its most watched technical signals, and the history behind it is hard to ignore. The 50-day moving average is closing in on the 200-day line, setting up a potential golden cross that has only delivered massive moves a few times in the past. In 2012, 2015 and 2020, this pattern preceded gains of more than 300% over the following year. That does not mean 100K is automatic. BTC is currently consolidating between 75,000 and 82,000 after a strong August, but it still needs a decisive break above the 81,500 to 84,400 supply zone to reopen the path toward 98,000 and 100,000. The golden cross itself is a lagging signal, so price action must confirm it. The bullish case improves if BTC holds above 80,000, completes the cross and attracts fresh ETF inflows while macro pressure eases. The bearish risk is a failure at 82,000 to 84,400, followed by a drop back below 75,000 and a test of the 200-day average near 72,500. Traders should watch the 50-day and 200-day convergence, a daily close above 84,400 as breakout confirmation, and whether support at 75,000 to 76,800 holds. If the cross forms with strong volume and institutional flows, 100K moves from narrative to realistic target. If price rejects hard at resistance, the signal may prove to be another false start. $BTC
64
·
--
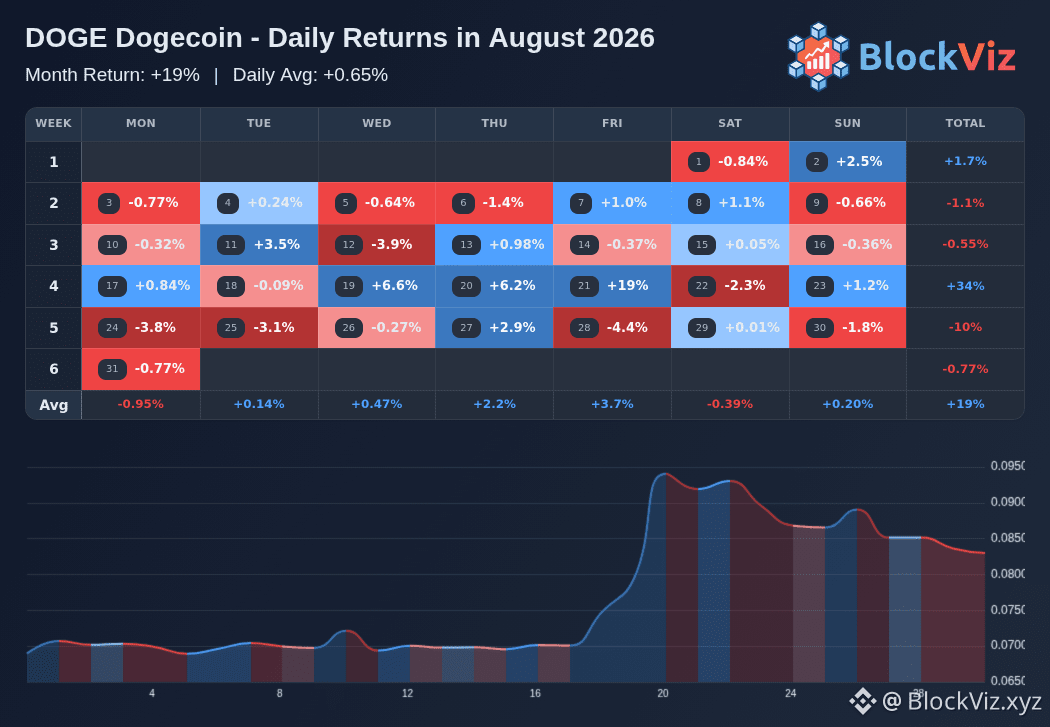
Dogecoin finished August 2026 at +19%. If you held only the best days, the return jumps to +53.0%, while missing them drops it to -22.0%. That tells you the month was driven by a handful of outsized sessions rather than smooth trend strength. The biggest upside day was 8/21/26 (+18.5%), and the roughest day was 8/28/26 (-4.4%) $DOGE
Dogecoin finished August 2026 at +19%. If you held only the best days, the return jumps to +53.0%, while missing them drops it to -22.0%. That tells you the month was driven by a handful of outsized sessions rather than smooth trend strength. The biggest upside day was 8/21/26 (+18.5%), and the roughest day was 8/28/26 (-4.4%) $DOGE
73
·
--
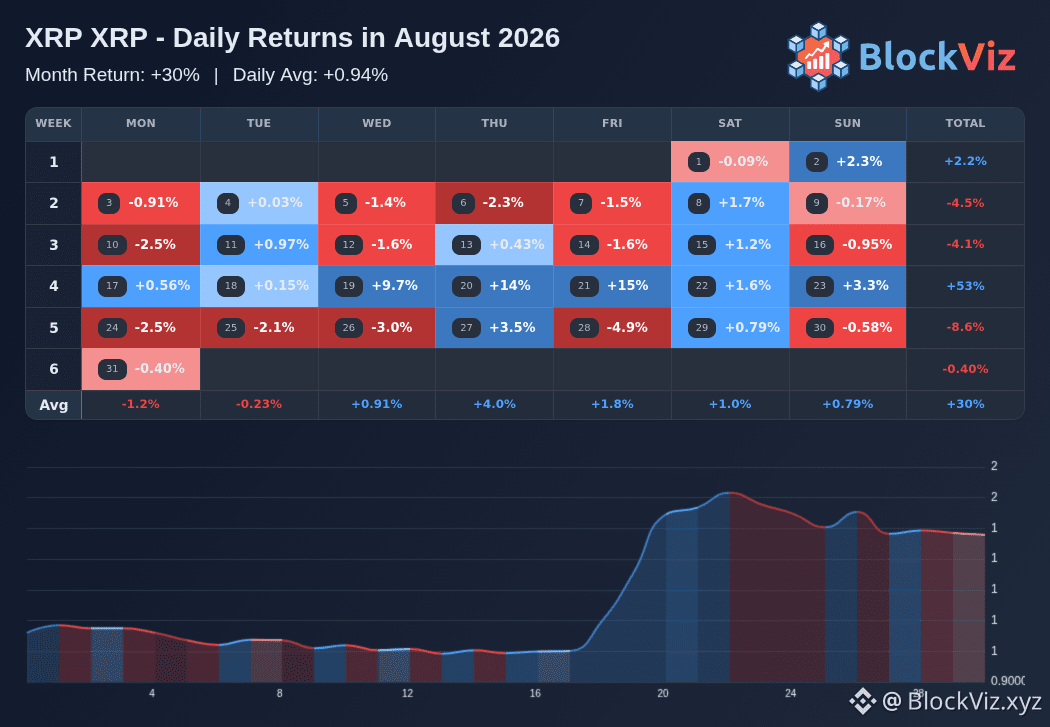
XRP finished August 2026 at +30%. If you held only the best days, the return jumps to +66.6%, while missing them drops it to -21.9%. That tells you the month was driven by a handful of outsized sessions rather than smooth trend strength. The biggest upside day was 8/21/26 (+15.0%), and the roughest day was 8/28/26 (-4.9%) $XRP
XRP finished August 2026 at +30%. If you held only the best days, the return jumps to +66.6%, while missing them drops it to -21.9%. That tells you the month was driven by a handful of outsized sessions rather than smooth trend strength. The biggest upside day was 8/21/26 (+15.0%), and the roughest day was 8/28/26 (-4.9%) $XRP
56
·
--
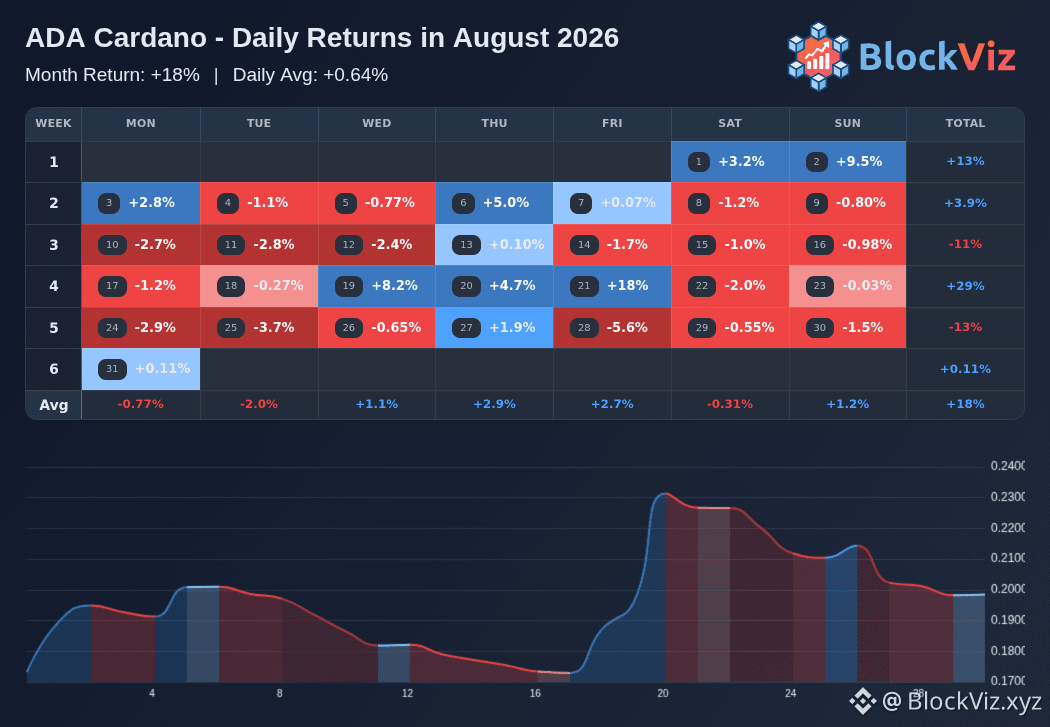
Cardano’s August 2026 finished with an 18% gain and an average daily return of 0.64%, but the month’s real story was concentration. Hold through the full stretch and the move reached 66.5%. Miss the 10 best days and the result flipped to -29.0%. That gives ADA’s month a clear character: upside arrived in bursts, not in a smooth climb. The best day hit 18.0% on 8/21/26, while the worst day was -5.6% on 8/28/26, a reminder that the month rewarded staying in place more than trying to time every swing $ADA
Cardano’s August 2026 finished with an 18% gain and an average daily return of 0.64%, but the month’s real story was concentration. Hold through the full stretch and the move reached 66.5%. Miss the 10 best days and the result flipped to -29.0%. That gives ADA’s month a clear character: upside arrived in bursts, not in a smooth climb. The best day hit 18.0% on 8/21/26, while the worst day was -5.6% on 8/28/26, a reminder that the month rewarded staying in place more than trying to time every swing $ADA
37
·
--
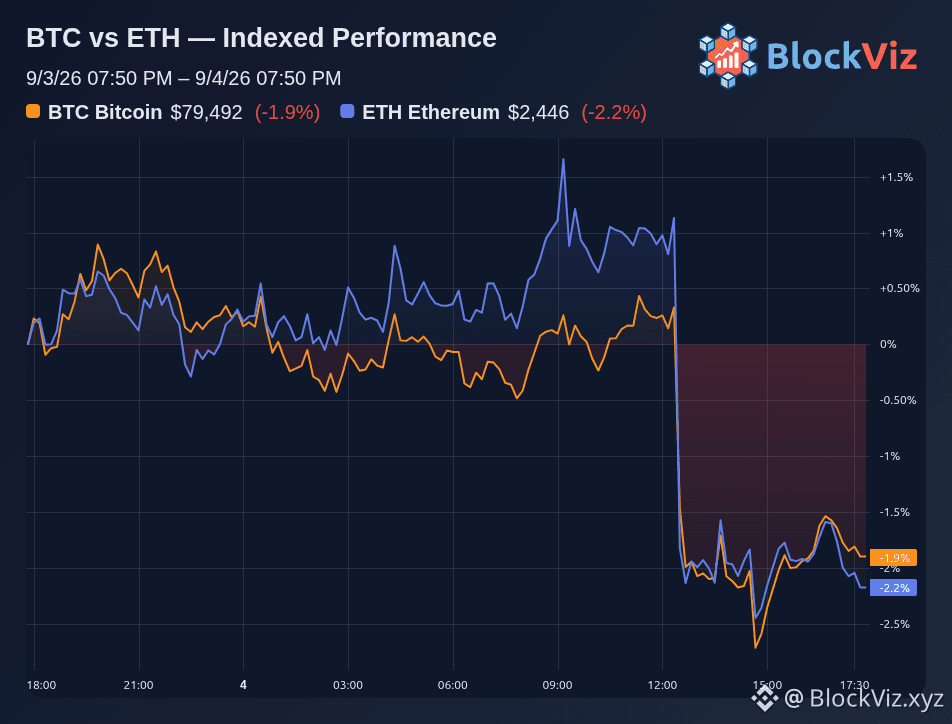
ETH spent this stretch chasing BTC, but the gap never fully closed. On the indexed chart, BTC finished 0.3% ahead of ETH. The widest separation in the window reached 1.4%, which makes the late spread look small, but still leaves BTC in front by the close $BTC
ETH spent this stretch chasing BTC, but the gap never fully closed. On the indexed chart, BTC finished 0.3% ahead of ETH. The widest separation in the window reached 1.4%, which makes the late spread look small, but still leaves BTC in front by the close $BTC
42
·
--
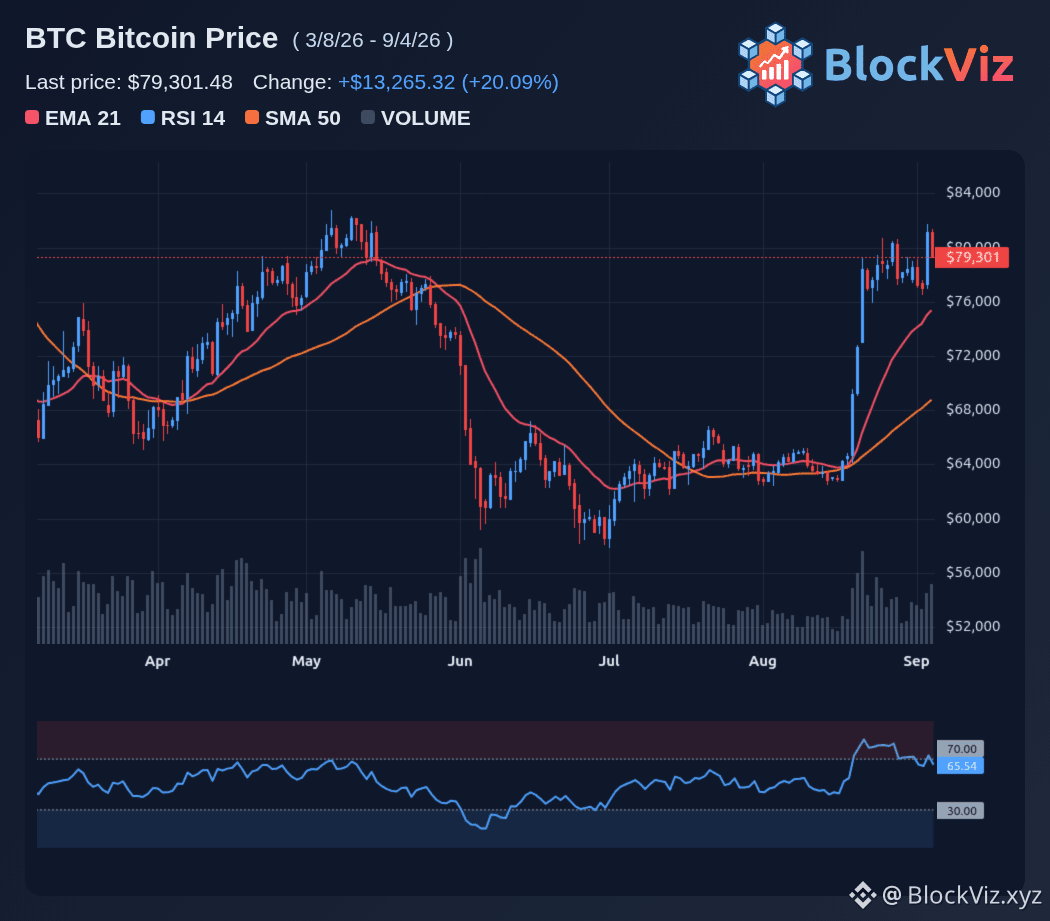
ZEC and XRP are breaking out, but that does not automatically mean altseason is here. ZEC is leading the move, up more than 16% in 24 hours and pressing into the $960 to $1,000 zone. If it can close above $1,000 on the daily, $1,200 becomes the next obvious level. For now, support sits near $935. XRP has also turned higher, climbing from $1.31 to roughly $1.48 before settling around $1.45. A clean break above $1.48 would bring $1.50 into focus first, then $1.66 if momentum holds. The bigger question is breadth. Bitcoin is still firm above $80,000, and BTC dominance remains elevated around 57% to 58%. That usually is not the backdrop for a full altseason. A broader rotation tends to show up when BTC cools off and dominance starts sliding toward 55% or lower. For now, this looks more like selective strength in a few names than a full handoff from BTC. If ZEC and XRP keep holding gains while Bitcoin consolidates and dominance starts to fade, the altseason case gets stronger. If not, this was likely a sharp tactical move, not a regime shift. $XRP
ZEC and XRP are breaking out, but that does not automatically mean altseason is here. ZEC is leading the move, up more than 16% in 24 hours and pressing into the $960 to $1,000 zone. If it can close above $1,000 on the daily, $1,200 becomes the next obvious level. For now, support sits near $935. XRP has also turned higher, climbing from $1.31 to roughly $1.48 before settling around $1.45. A clean break above $1.48 would bring $1.50 into focus first, then $1.66 if momentum holds. The bigger question is breadth. Bitcoin is still firm above $80,000, and BTC dominance remains elevated around 57% to 58%. That usually is not the backdrop for a full altseason. A broader rotation tends to show up when BTC cools off and dominance starts sliding toward 55% or lower. For now, this looks more like selective strength in a few names than a full handoff from BTC. If ZEC and XRP keep holding gains while Bitcoin consolidates and dominance starts to fade, the altseason case gets stronger. If not, this was likely a sharp tactical move, not a regime shift. $XRP
64
·
--
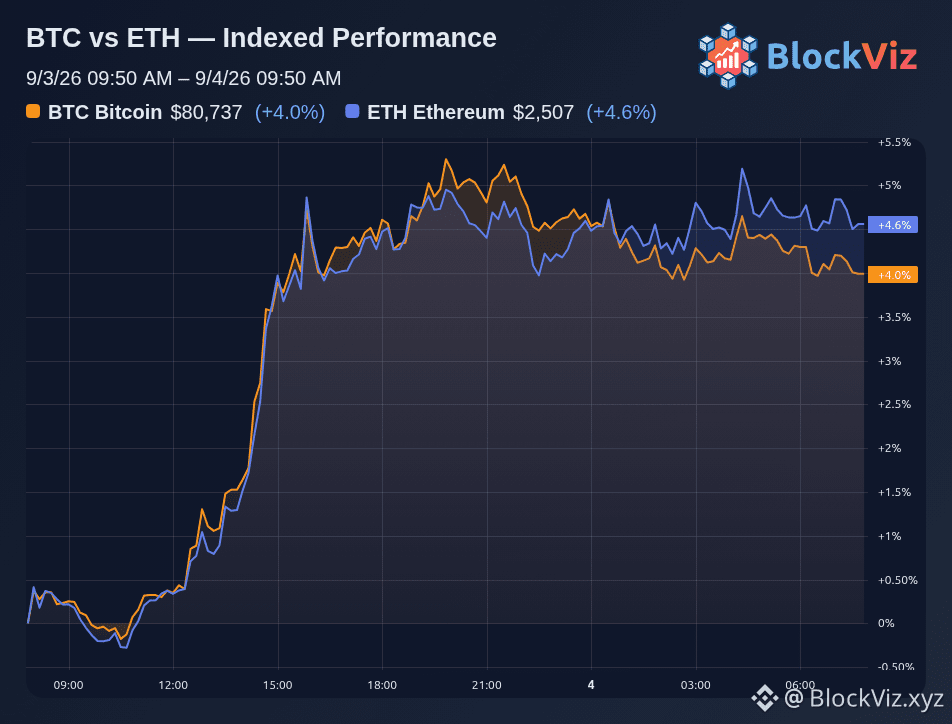
ETH won the indexed 24h comparison, but only by 0.6% over BTC. That tight spread is the story. ETH finished first at +4.56% versus BTC at +3.99%, so the gap never turned into a real breakout. Both moved higher, but neither pulled far away from the other $ETH
ETH won the indexed 24h comparison, but only by 0.6% over BTC. That tight spread is the story. ETH finished first at +4.56% versus BTC at +3.99%, so the gap never turned into a real breakout. Both moved higher, but neither pulled far away from the other $ETH
80
Войдите, чтобы посмотреть больше материала
Присоединяйтесь к пользователям криптовалют по всему миру на Binance Square
⚡️ Получайте новейшую и полезную информацию о криптоактивах.
💬 Нам доверяет крупнейшая в мире криптобиржа.
👍 Получите достоверные аналитические данные от верифицированных создателей контента.
Эл. почта/номер телефона