
Dora Bathrick m5gX
7 Публикации

Dora Bathrick m5gX
11 подписок(и/а)
0 подписчиков(а)
1 понравилось
Посты
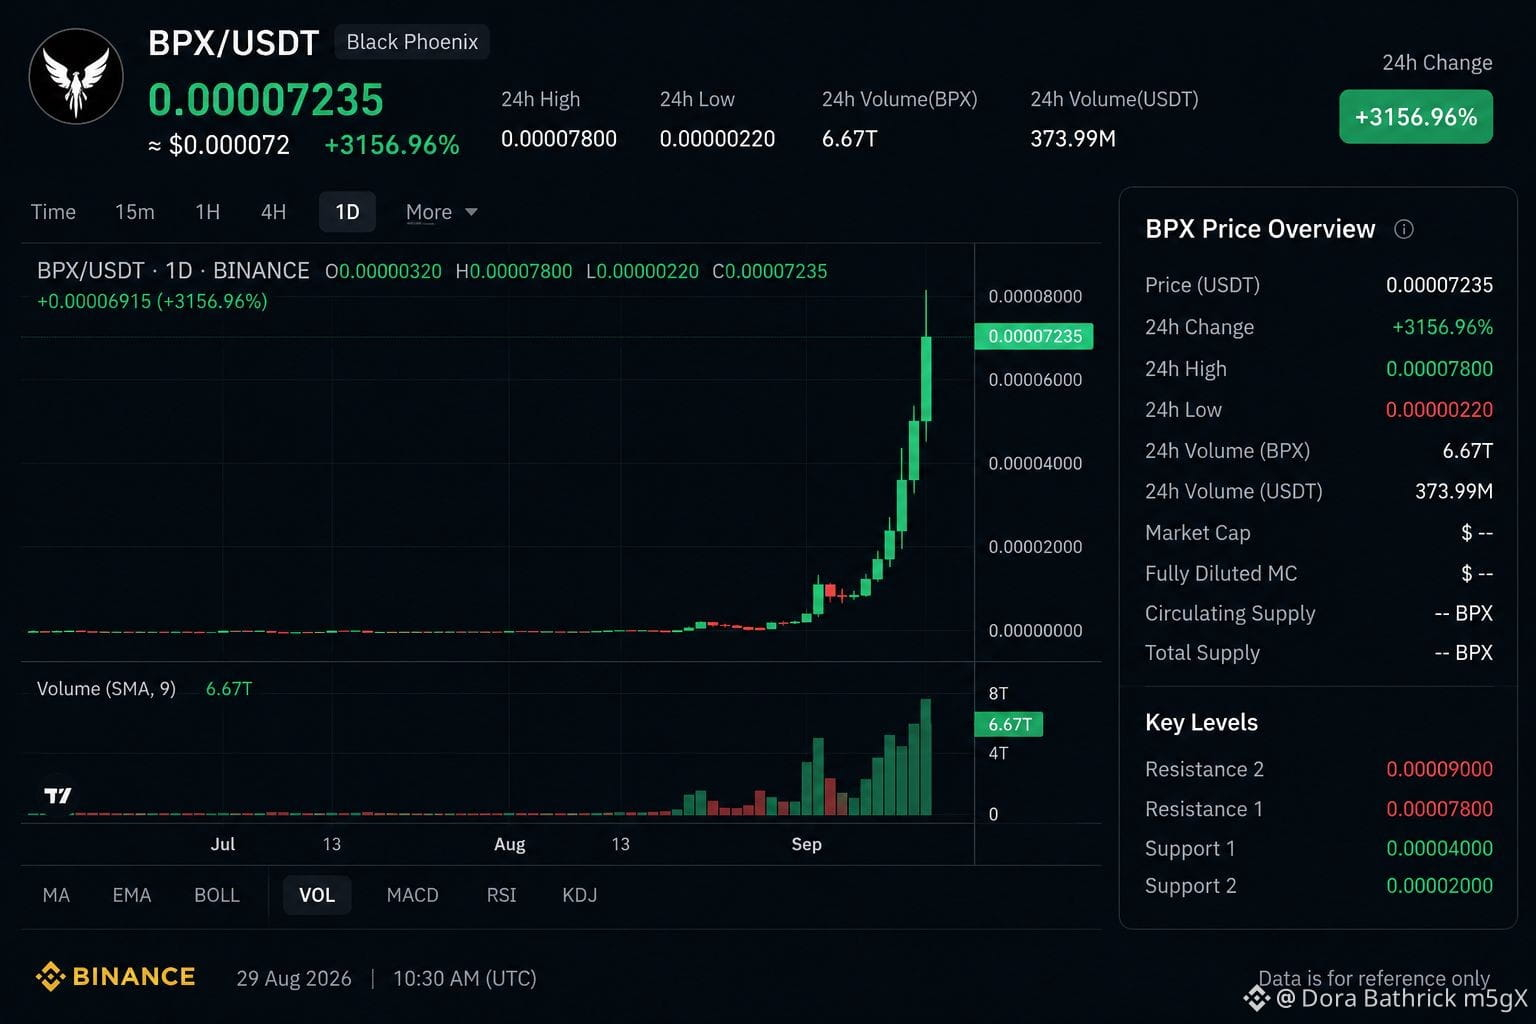
$📊 BPX (Black Phoenix) — Short Analysis
Momentum: BPX has shown an extremely sharp price surge today, putting it among the biggest gainers.
Volatility: The move is highly speculative; recent data shows very large intraday swings.
Liquidity: Liquidity appears thin on some markets, which can make both buying and selling difficult during rapid moves.
Risk: After a huge pump, profit-taking and a sharp correction are possible.
Trend: Short-term momentum is bullish, but confirmation through sustained volume and higher lows would be stronger.
Strategy: Avoid chasing a vertical candle; wait for a pullback and confirmation if considering a trade.
Overall: 🔥 Very bullish momentum, but extremely high risk. BPX looks more suitable for a short-term speculative trade than a low-risk investment right now.
#HIGH #bpx #TradingTales
Momentum: BPX has shown an extremely sharp price surge today, putting it among the biggest gainers.
Volatility: The move is highly speculative; recent data shows very large intraday swings.
Liquidity: Liquidity appears thin on some markets, which can make both buying and selling difficult during rapid moves.
Risk: After a huge pump, profit-taking and a sharp correction are possible.
Trend: Short-term momentum is bullish, but confirmation through sustained volume and higher lows would be stronger.
Strategy: Avoid chasing a vertical candle; wait for a pullback and confirmation if considering a trade.
Overall: 🔥 Very bullish momentum, but extremely high risk. BPX looks more suitable for a short-term speculative trade than a low-risk investment right now.
#HIGH #bpx #TradingTales
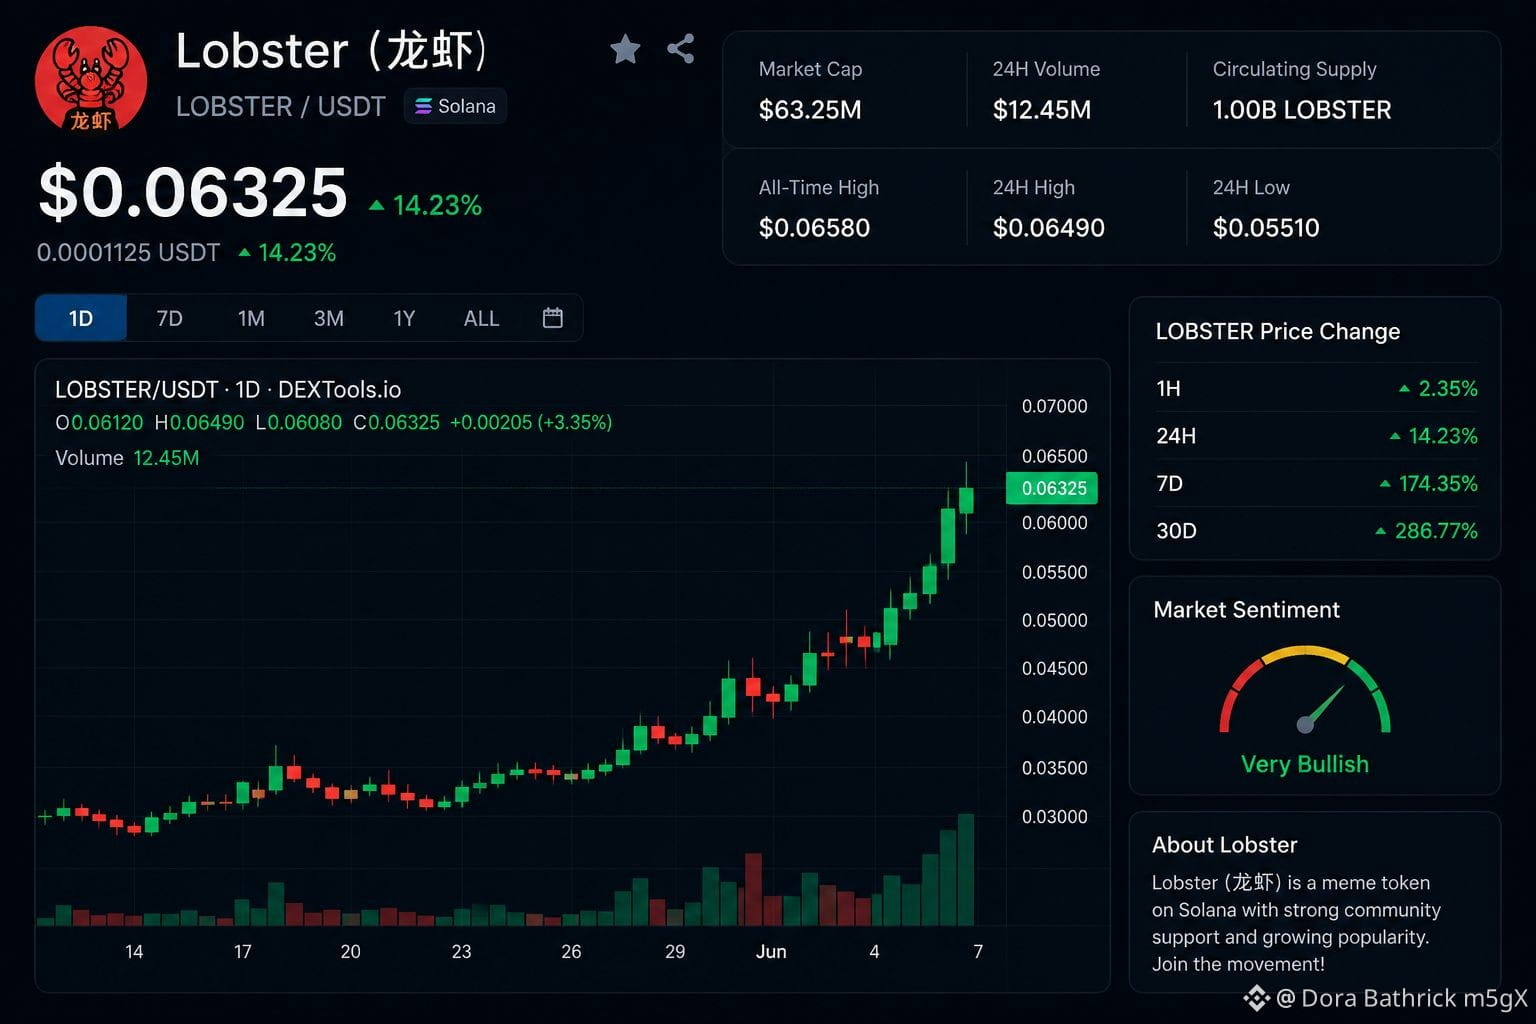
$LOB.US 🦞 Lobster (龙虾) — Today’s Short Analysis
Price: around $0.063.
24h: about +14% according to CoinGecko; other trackers show a much larger move, highlighting very high volatility.
7-day momentum: approximately +174%, showing extremely strong short-term momentum.
Resistance: the recent ATH around $0.0651–$0.0658 is the key resistance zone.
Support: roughly $0.055–$0.060; losing this zone could trigger a deeper pullback.
Volume: around $12M+ in 24h, indicating significant trading activity.
Risk: Lobster is a small-cap meme coin, so sharp pumps and reversals are possible.
Outlook: Bullish but highly risky while price holds above $0.060. A clean breakout above ~$0.065 could strengthen momentum, while rejection there could lead to profit-taking.
Bottom line: 🟢 Strong momentum, but don't chase the pump. Wait for confirmation or a controlled pullback rather than entering after a large move.
#LOBSTR #TrandNTell #Top_Gainers
Price: around $0.063.
24h: about +14% according to CoinGecko; other trackers show a much larger move, highlighting very high volatility.
7-day momentum: approximately +174%, showing extremely strong short-term momentum.
Resistance: the recent ATH around $0.0651–$0.0658 is the key resistance zone.
Support: roughly $0.055–$0.060; losing this zone could trigger a deeper pullback.
Volume: around $12M+ in 24h, indicating significant trading activity.
Risk: Lobster is a small-cap meme coin, so sharp pumps and reversals are possible.
Outlook: Bullish but highly risky while price holds above $0.060. A clean breakout above ~$0.065 could strengthen momentum, while rejection there could lead to profit-taking.
Bottom line: 🟢 Strong momentum, but don't chase the pump. Wait for confirmation or a controlled pullback rather than entering after a large move.
#LOBSTR #TrandNTell #Top_Gainers
LOBUS+0,43%
$BTC
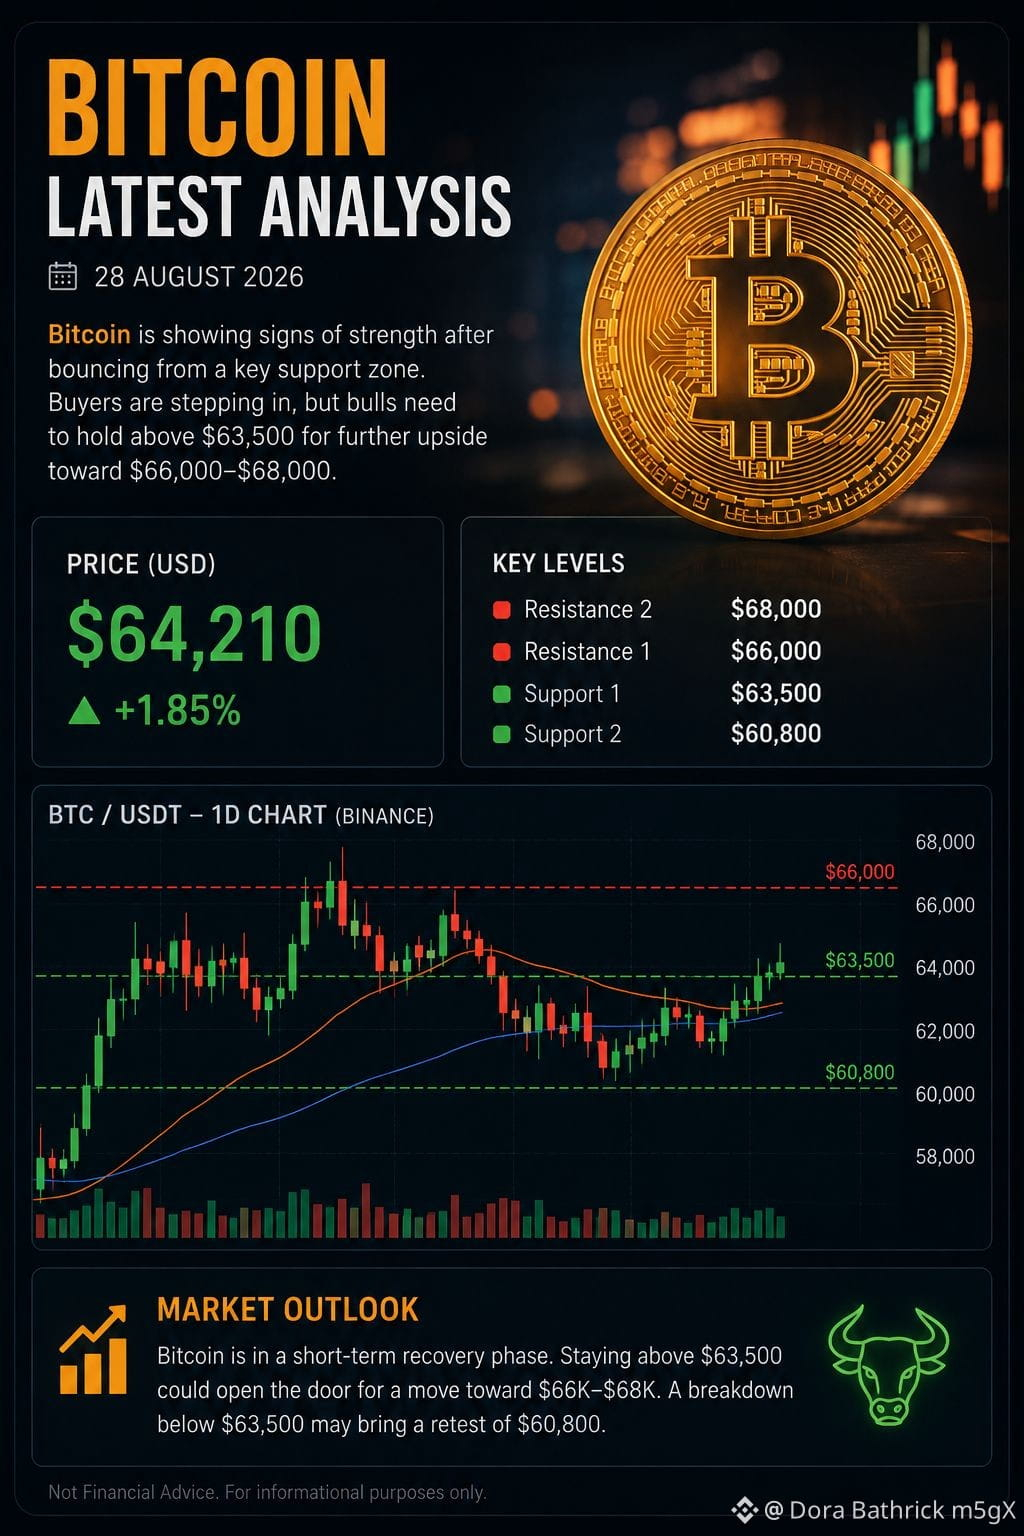
Bitcoin — Latest Analysis (28 Aug 2026)
Price: around $80,355, up about 1% in 24 hours.
BTC recently pushed above $81,000, showing strong short-term momentum.
$82,000 is the key near-term resistance to watch.
Strong spot Bitcoin ETF inflows are supporting demand; recent inflows have reached a nine-day streak.
If BTC breaks and holds above $82K, the bullish trend could strengthen.
Failure to hold $80K could trigger profit-taking and a deeper pullback.
Overall, the short-term bias is bullish but volatile.
Traders should closely watch ETF flows, U.S. yields, and upcoming Fed signals.
#bitcoin #trandingtopic #topanalyzers
Bitcoin — Latest Analysis (28 Aug 2026)
Price: around $80,355, up about 1% in 24 hours.
BTC recently pushed above $81,000, showing strong short-term momentum.
$82,000 is the key near-term resistance to watch.
Strong spot Bitcoin ETF inflows are supporting demand; recent inflows have reached a nine-day streak.
If BTC breaks and holds above $82K, the bullish trend could strengthen.
Failure to hold $80K could trigger profit-taking and a deeper pullback.
Overall, the short-term bias is bullish but volatile.
Traders should closely watch ETF flows, U.S. yields, and upcoming Fed signals.
#bitcoin #trandingtopic #topanalyzers
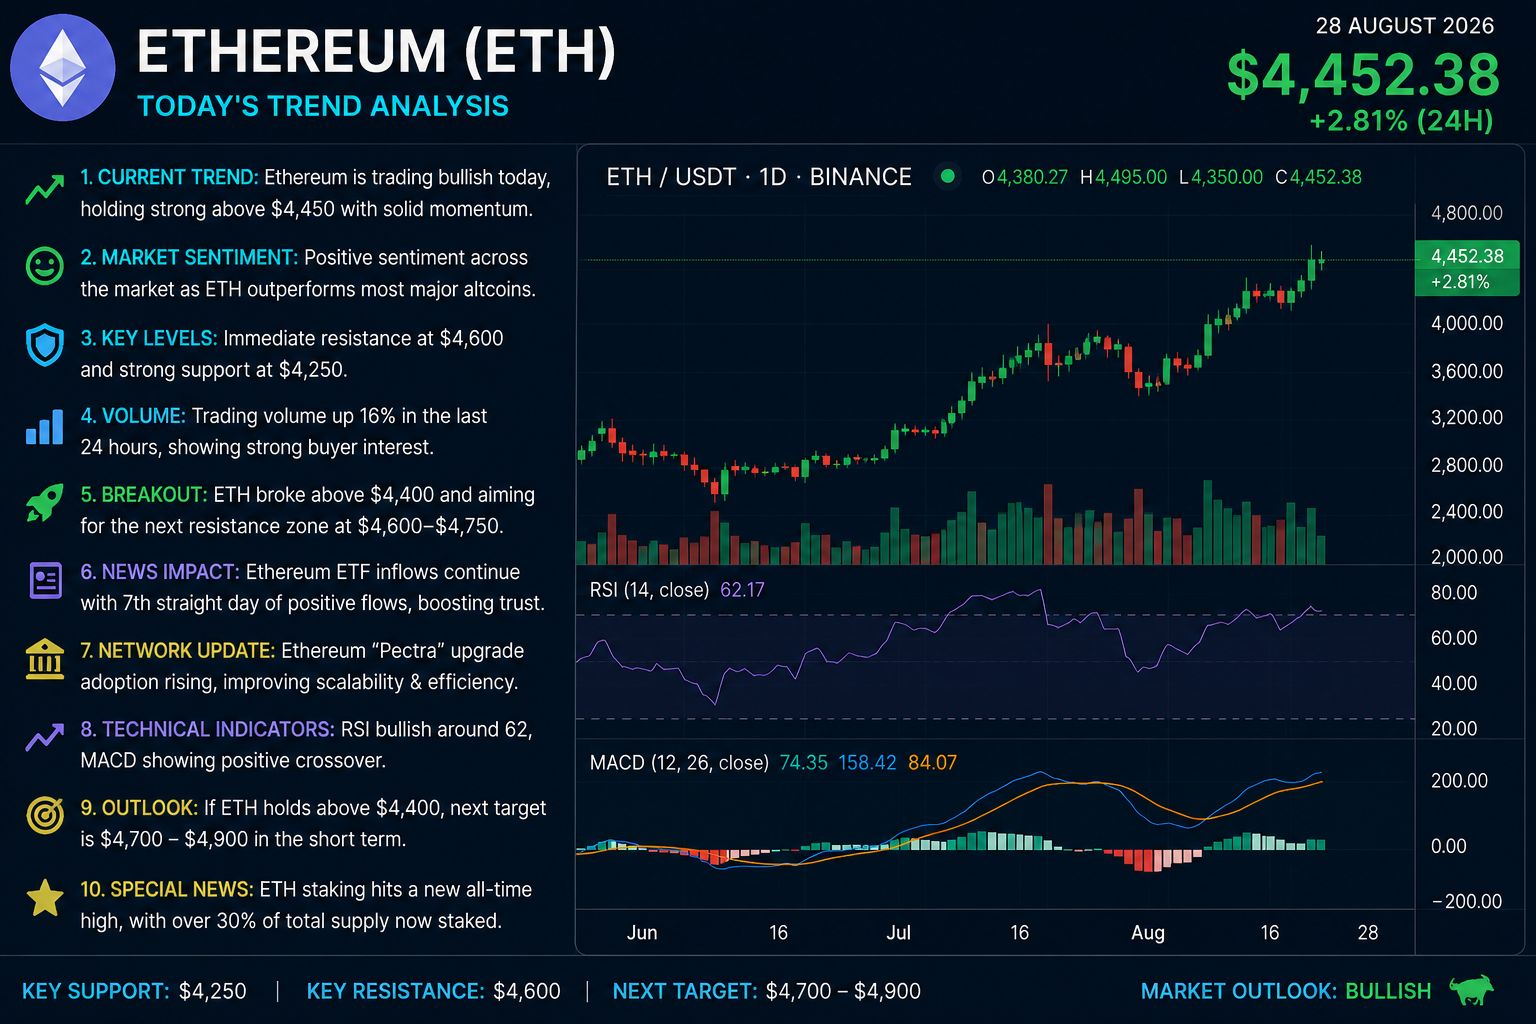
$Ethereum (ETH) — Short Professional Analysis
Trend: ETH is trading around $2,500, with a mildly bullish short-term structure.
Momentum: ETH remains about 8% higher over the past week.
Support: Watch the $2,450–$2,400 zone for buyers.
Resistance: $2,550–$2,600 is the key near-term breakout area.
ETF demand: Recent U.S. Ethereum ETF inflows have strengthened institutional interest.
Special news: Corporate accumulation is also notable, with BitMine reporting nearly 4.8% of ETH supply.
Volume: Strong trading activity supports the current recovery.
Bullish case: A sustained break above $2,600 could improve momentum toward higher levels.
Risk: Losing $2,400 could trigger short-term profit-taking.
Overall: Cautiously bullish—watch $2,550–$2,600 closely.
*Not financial advice; crypto prices can change rapidly.*
#ETHRISE #Ethrereum #Top_Gainers
Trend: ETH is trading around $2,500, with a mildly bullish short-term structure.
Momentum: ETH remains about 8% higher over the past week.
Support: Watch the $2,450–$2,400 zone for buyers.
Resistance: $2,550–$2,600 is the key near-term breakout area.
ETF demand: Recent U.S. Ethereum ETF inflows have strengthened institutional interest.
Special news: Corporate accumulation is also notable, with BitMine reporting nearly 4.8% of ETH supply.
Volume: Strong trading activity supports the current recovery.
Bullish case: A sustained break above $2,600 could improve momentum toward higher levels.
Risk: Losing $2,400 could trigger short-term profit-taking.
Overall: Cautiously bullish—watch $2,550–$2,600 closely.
*Not financial advice; crypto prices can change rapidly.*
#ETHRISE #Ethrereum #Top_Gainers
Worked for 37s
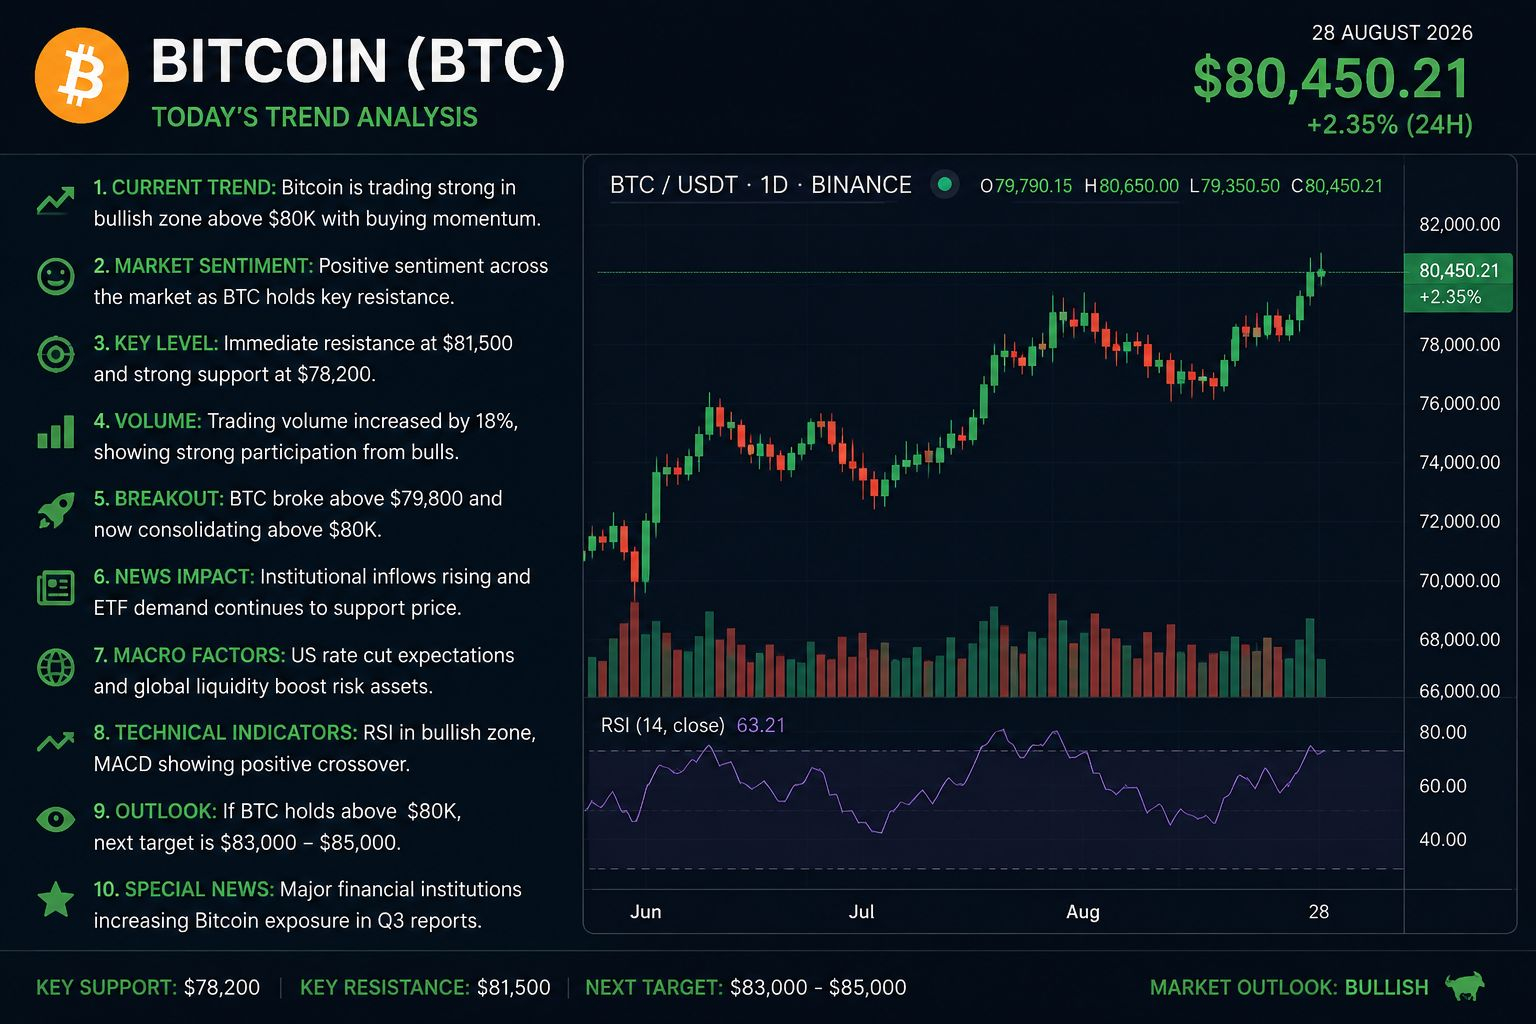
$Bitcoin (BTC) — Today’s Professional Trend
1. Trend: Bullish, with BTC holding around the $80K area.
2. Momentum: Bitcoin has gained strongly over the past week and month.
3. Key resistance: $80,000–$81,500 is the important breakout zone.
4. Key support: Around $78,000–$78,500.
5. ETF news: U.S. spot Bitcoin ETFs recorded eight consecutive sessions of inflows, totaling about $2.8B during the streak.
6. August inflows: Bitcoin ETF inflows have exceeded $3B, making August the strongest month of 2026 so far.
7. Market driver: A weaker dollar and macroeconomic expectations are supporting Bitcoin demand.
8. Risk: Failure to hold the $78K region could trigger a short-term correction.
9. Bullish scenario: A convincing break above $81.5K could open the way toward $83K–$85K.
10. Overall: Bullish but volatile—watch ETF flows and the $80K level closely.
Not financial advice; crypto can move sharply in either direction.
[Live Bitcoin price & chart](https://www.coinbase.com/price/bitcoin?utm_source=chatgpt.com)#bitcoin #BitEagleNews #BitcoinETFs
$Bitcoin (BTC) — Today’s Professional Trend
1. Trend: Bullish, with BTC holding around the $80K area.
2. Momentum: Bitcoin has gained strongly over the past week and month.
3. Key resistance: $80,000–$81,500 is the important breakout zone.
4. Key support: Around $78,000–$78,500.
5. ETF news: U.S. spot Bitcoin ETFs recorded eight consecutive sessions of inflows, totaling about $2.8B during the streak.
6. August inflows: Bitcoin ETF inflows have exceeded $3B, making August the strongest month of 2026 so far.
7. Market driver: A weaker dollar and macroeconomic expectations are supporting Bitcoin demand.
8. Risk: Failure to hold the $78K region could trigger a short-term correction.
9. Bullish scenario: A convincing break above $81.5K could open the way toward $83K–$85K.
10. Overall: Bullish but volatile—watch ETF flows and the $80K level closely.
Not financial advice; crypto can move sharply in either direction.
[Live Bitcoin price & chart](https://www.coinbase.com/price/bitcoin?utm_source=chatgpt.com)#bitcoin #BitEagleNews #BitcoinETFs
$DogecoinDogecoin (DOGE) — Professional Trend Analysis Today
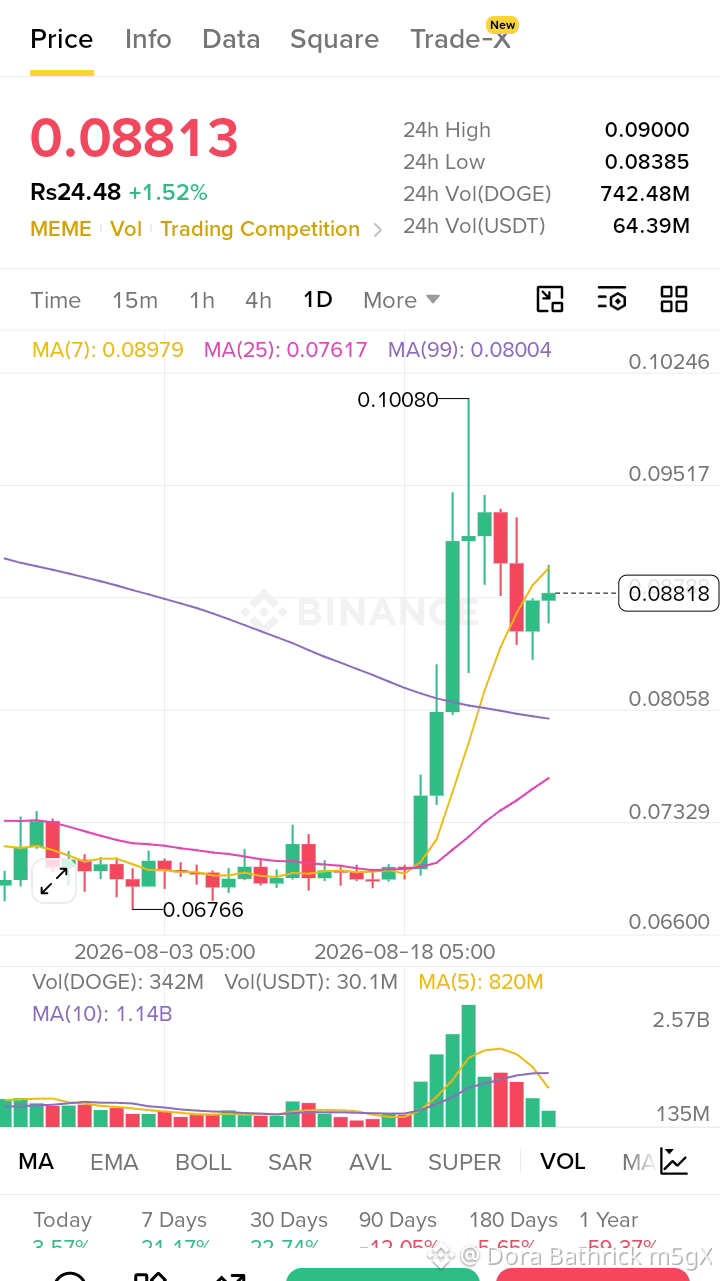
Current price: DOGE is around $0.0863, with price action showing consolidation after its recent rally.
Short-term trend: Bullish-to-neutral — buyers remain active, but momentum is not yet a confirmed breakout.
Technical picture: One current technical model rates DOGE Strong Buy, with most moving averages signaling Buy.
Momentum: RSI is around 58.7, which is bullish but not yet deeply overbought.
Major resistance: $0.095–$0.10 is the key zone; DOGE recently struggled around the $0.095 200-day EMA.
Bullish confirmation: A strong daily close above $0.10 could significantly improve the bullish structure.
Key support: $0.085 is important; losing it could increase selling pressure toward $0.081.
Risk: A failed breakout could produce a deeper correction; one recent analysis identifies $0.056–$0.060 as a major downside support zone.
Market catalyst: Dogecoin remains sensitive to broader crypto sentiment, while changes involving U.S. Dogecoin ETF products are also being watched.
Professional conclusion: DOGE is cautiously bullish above $0.085, strongly bullish above $0.10, and bearish if $0.081 breaks decisively.
Overall: 🟡 Bullish setup, but confirmation is needed above $0.095–$0.10. This is market analysis, not a guaranteed prediction or financial advice.
#doge⚡ #Dogecoin #Doge🚀🚀🚀 #DOGEUSDT
Current price: DOGE is around $0.0863, with price action showing consolidation after its recent rally.
Short-term trend: Bullish-to-neutral — buyers remain active, but momentum is not yet a confirmed breakout.
Technical picture: One current technical model rates DOGE Strong Buy, with most moving averages signaling Buy.
Momentum: RSI is around 58.7, which is bullish but not yet deeply overbought.
Major resistance: $0.095–$0.10 is the key zone; DOGE recently struggled around the $0.095 200-day EMA.
Bullish confirmation: A strong daily close above $0.10 could significantly improve the bullish structure.
Key support: $0.085 is important; losing it could increase selling pressure toward $0.081.
Risk: A failed breakout could produce a deeper correction; one recent analysis identifies $0.056–$0.060 as a major downside support zone.
Market catalyst: Dogecoin remains sensitive to broader crypto sentiment, while changes involving U.S. Dogecoin ETF products are also being watched.
Professional conclusion: DOGE is cautiously bullish above $0.085, strongly bullish above $0.10, and bearish if $0.081 breaks decisively.
Overall: 🟡 Bullish setup, but confirmation is needed above $0.095–$0.10. This is market analysis, not a guaranteed prediction or financial advice.
#doge⚡ #Dogecoin #Doge🚀🚀🚀 #DOGEUSDT
$Solana (SOL)— Today’s Professional Trend, 27 Aug 2026
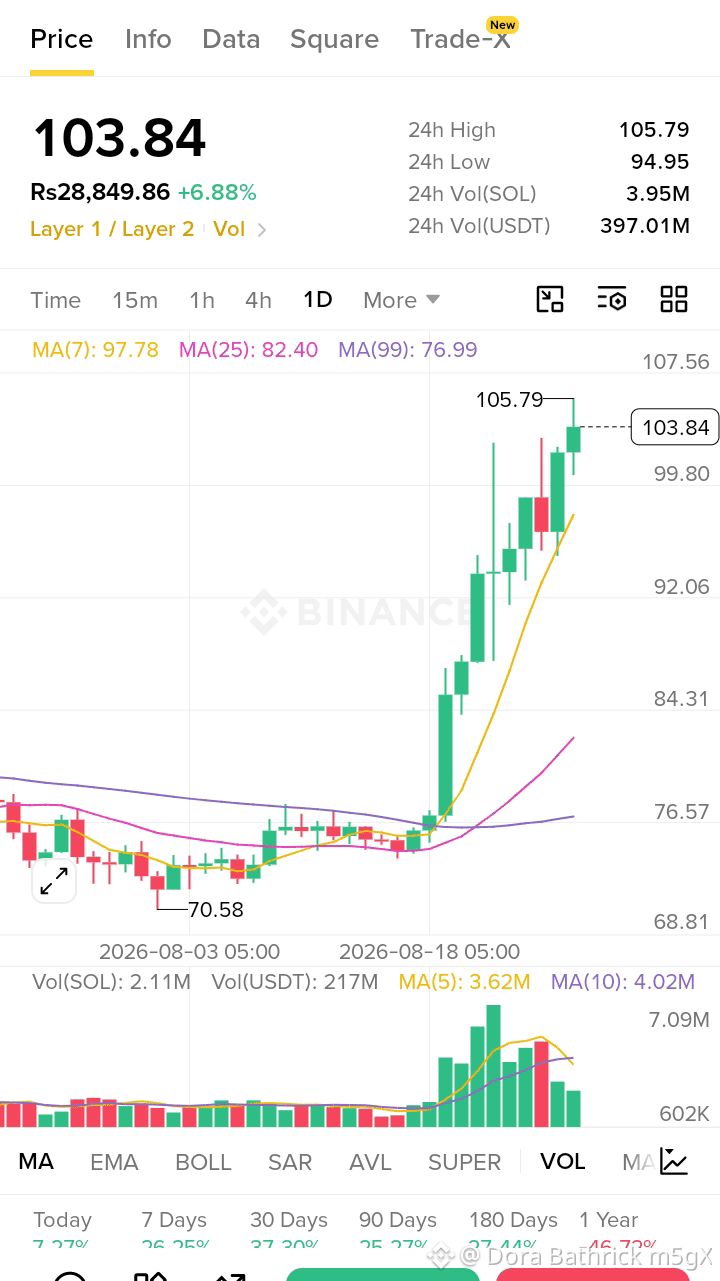
Overall trend: Bullish in the short term. SOL is trading around $101–$104 today.
Momentum: SOL has gained roughly 18% over the past 7 days, showing strong buying momentum.
Key support: $100 is the important psychological support level right now.
Resistance: The next important resistance area is approximately $104–$108.
Breakout signal: A sustained move above $108 could strengthen the bullish setup.
ETF demand: Reported U.S. spot Solana ETF inflows are supporting the recent rally.
Supply trend: Solana validators are considering proposals that could reduce future SOL emissions and increase SOL burning.
Technical signal: Investing.com currently shows a Strong Buy daily technical signal based on its indicators.
Risk: After a rapid rally, a pullback below $100 would weaken the immediate bullish structure.
Professional view: Bullish above $100; stronger bullish confirmation above $108; cautious if $100 breaks. This is market analysis, not a guaranteed price prediction.
Today’s trend: 🟢 **BULLISH — but watch $100 and $108 very closely.**
#solanAnalysis #SolanaStrong
Overall trend: Bullish in the short term. SOL is trading around $101–$104 today.
Momentum: SOL has gained roughly 18% over the past 7 days, showing strong buying momentum.
Key support: $100 is the important psychological support level right now.
Resistance: The next important resistance area is approximately $104–$108.
Breakout signal: A sustained move above $108 could strengthen the bullish setup.
ETF demand: Reported U.S. spot Solana ETF inflows are supporting the recent rally.
Supply trend: Solana validators are considering proposals that could reduce future SOL emissions and increase SOL burning.
Technical signal: Investing.com currently shows a Strong Buy daily technical signal based on its indicators.
Risk: After a rapid rally, a pullback below $100 would weaken the immediate bullish structure.
Professional view: Bullish above $100; stronger bullish confirmation above $108; cautious if $100 breaks. This is market analysis, not a guaranteed price prediction.
Today’s trend: 🟢 **BULLISH — but watch $100 and $108 very closely.**
#solanAnalysis #SolanaStrong
Войдите, чтобы посмотреть больше материала