
AlienOvichO 1
220 Публикации

AlienOvichO 1
Отправить жалобу
Заблокировать пользователя
Helping traders decode market waves at Elliott Wave Forecast.
All insights are educational and reflect my personal take on price action.
0 подписок(и/а)
6 подписчиков(а)
26 понравилось
Посты
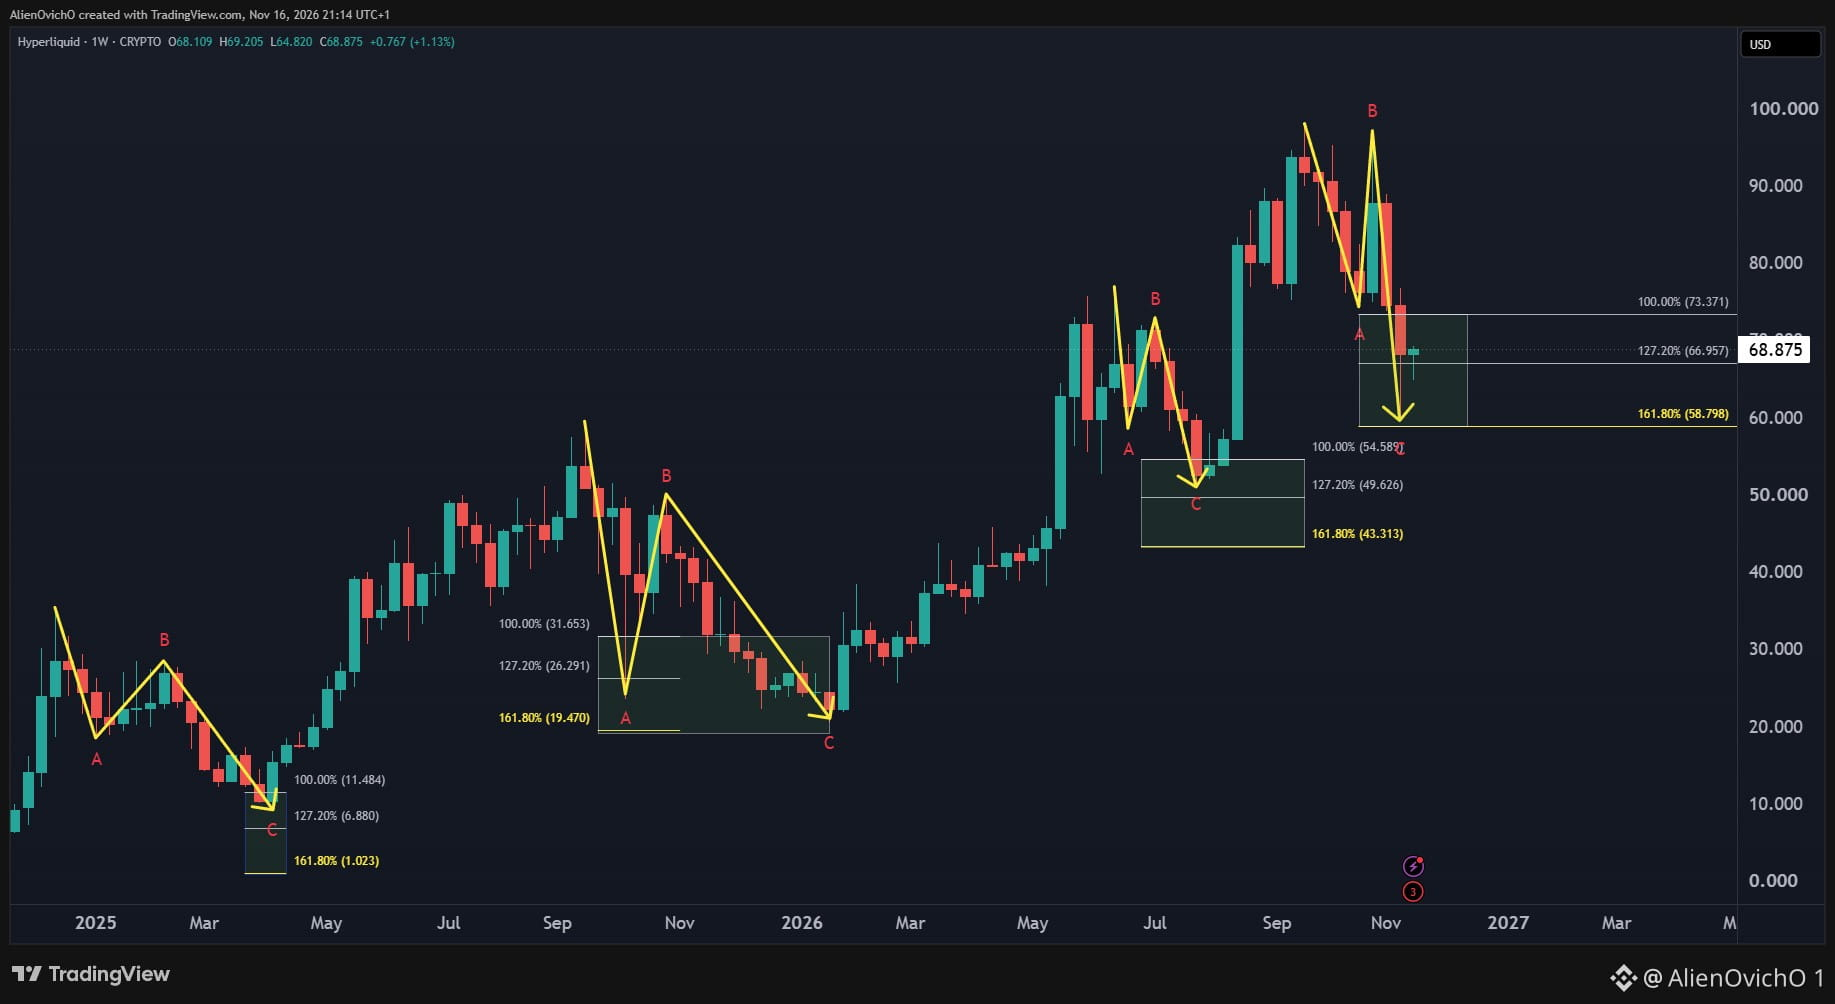
📊 $HYPE Another weekly correction is ending.
Every ABC pullback on this chart has ended in the demand box, then led to new highs. This one looks like the final one before the rally that breaks above $100.
The idea stays valid while price holds above 58.
📊 $HYPE Another weekly correction is ending.
Every ABC pullback on this chart has ended in the demand box, then led to new highs. This one looks like the final one before the rally that breaks above $100.
The idea stays valid while price holds above 58.
Every ABC pullback on this chart has ended in the demand box, then led to new highs. This one looks like the final one before the rally that breaks above $100.
The idea stays valid while price holds above 58.
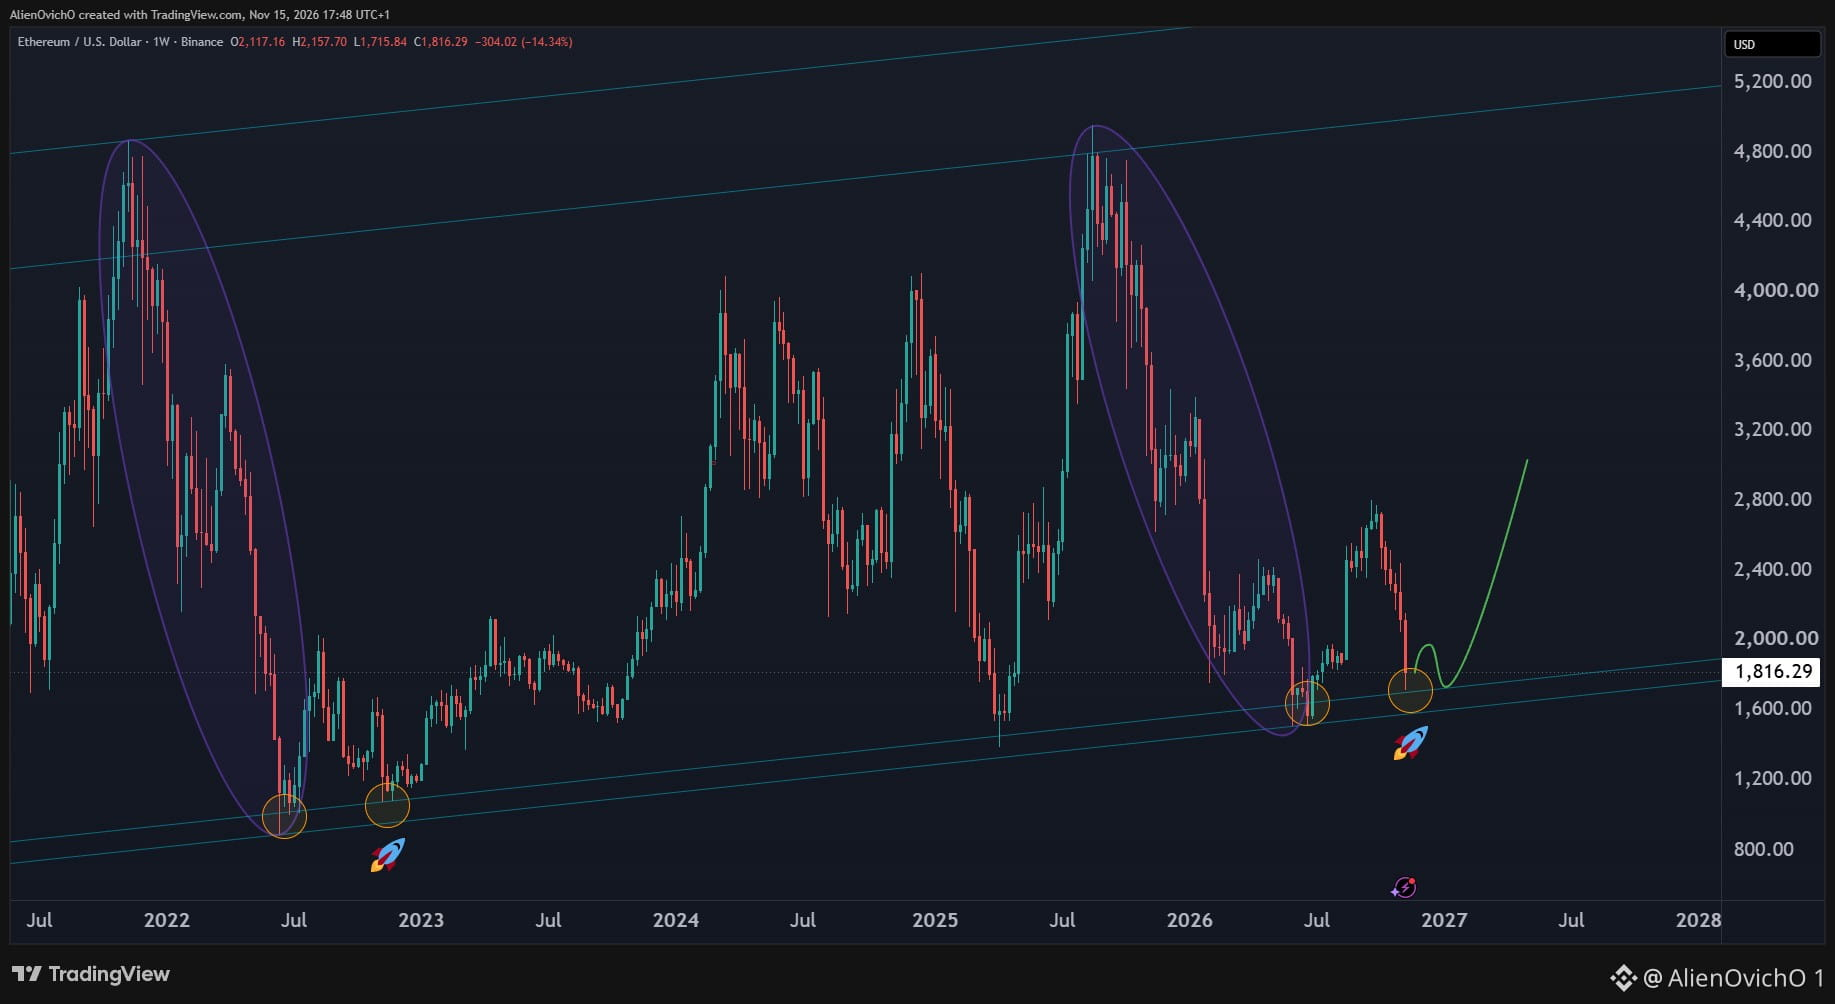
$ETH Are you ready for the next rally? 🚀
Same pattern as 2022: a weekly double bottom on channel support after the big drop.
The setup stays valid while Ethereum holds above 1,500. Lose that and the idea is off.
$ETH Are you ready for the next rally? 🚀
Same pattern as 2022: a weekly double bottom on channel support after the big drop.
The setup stays valid while Ethereum holds above 1,500. Lose that and the idea is off.
Same pattern as 2022: a weekly double bottom on channel support after the big drop.
The setup stays valid while Ethereum holds above 1,500. Lose that and the idea is off.
65
$BTC Everyone wished they'd bought 16K in 2022. 👀
This is that moment again. Anything below 66K could be a double when Bitcoin makes a new ATH in the coming years.
Are you scaling in or waiting?
$BTC Everyone wished they'd bought 16K in 2022. 👀
This is that moment again. Anything below 66K could be a double when Bitcoin makes a new ATH in the coming years.
Are you scaling in or waiting?
This is that moment again. Anything below 66K could be a double when Bitcoin makes a new ATH in the coming years.
Are you scaling in or waiting?

59
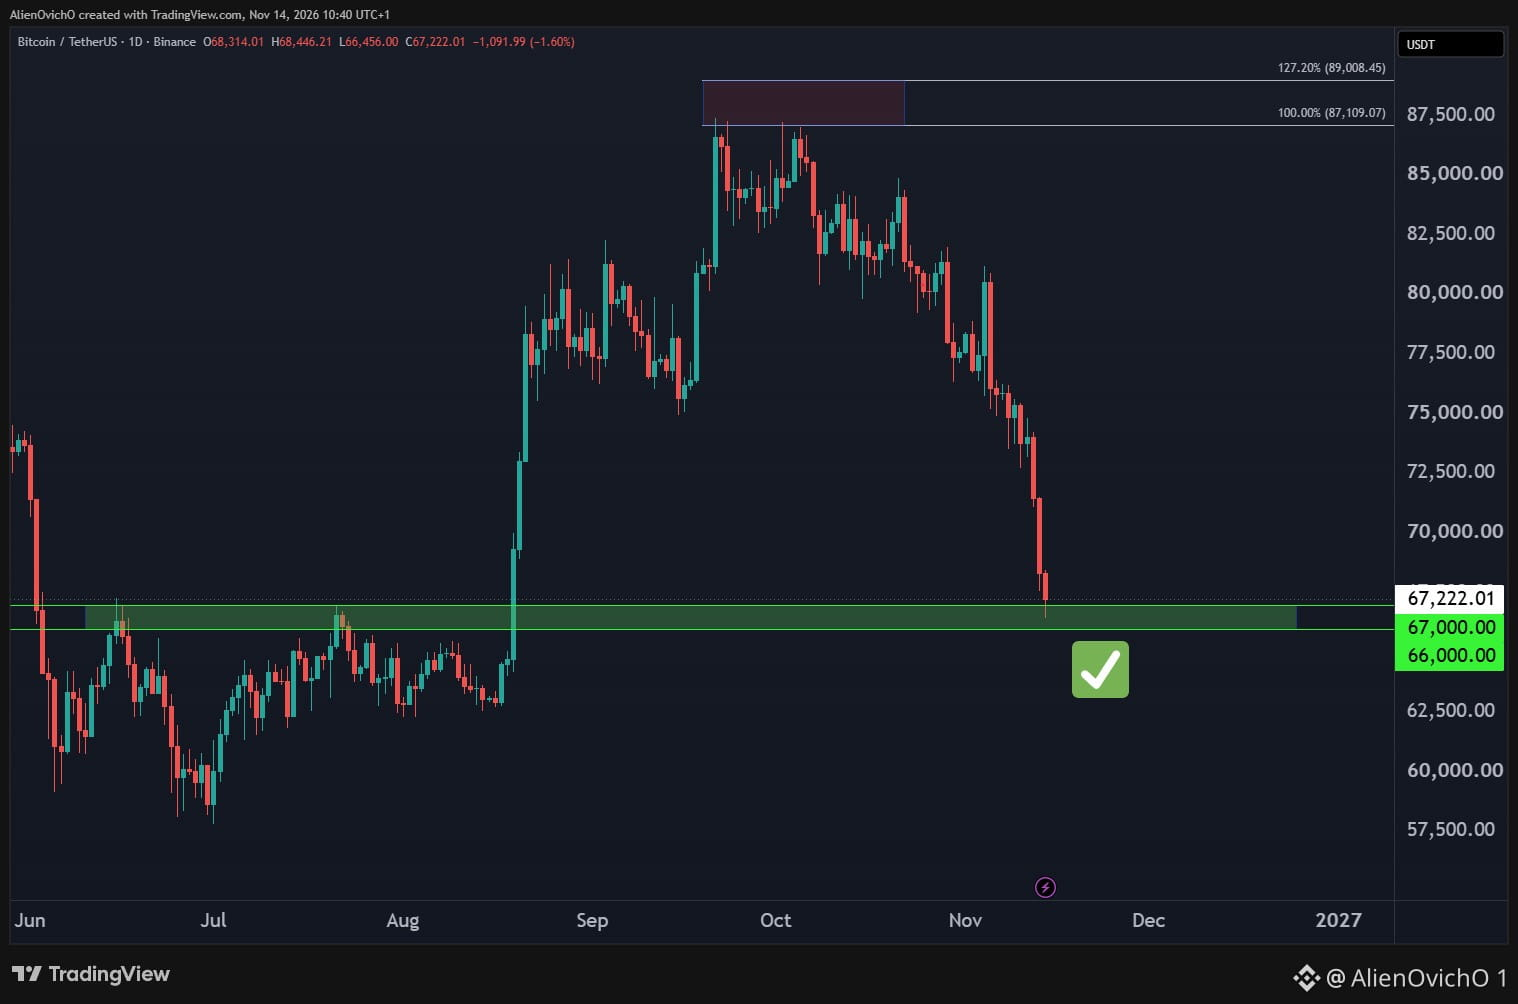
$BTC ✅ The 67K–66K retest is in, right on schedule.
Now we see if the breakout zone holds as support. Bulls need a strong bounce from here to keep the bigger picture intact.
Bounce or break?
$BTC ✅ The 67K–66K retest is in, right on schedule.
Now we see if the breakout zone holds as support. Bulls need a strong bounce from here to keep the bigger picture intact.
Bounce or break?
Now we see if the breakout zone holds as support. Bulls need a strong bounce from here to keep the bigger picture intact.
Bounce or break?
56
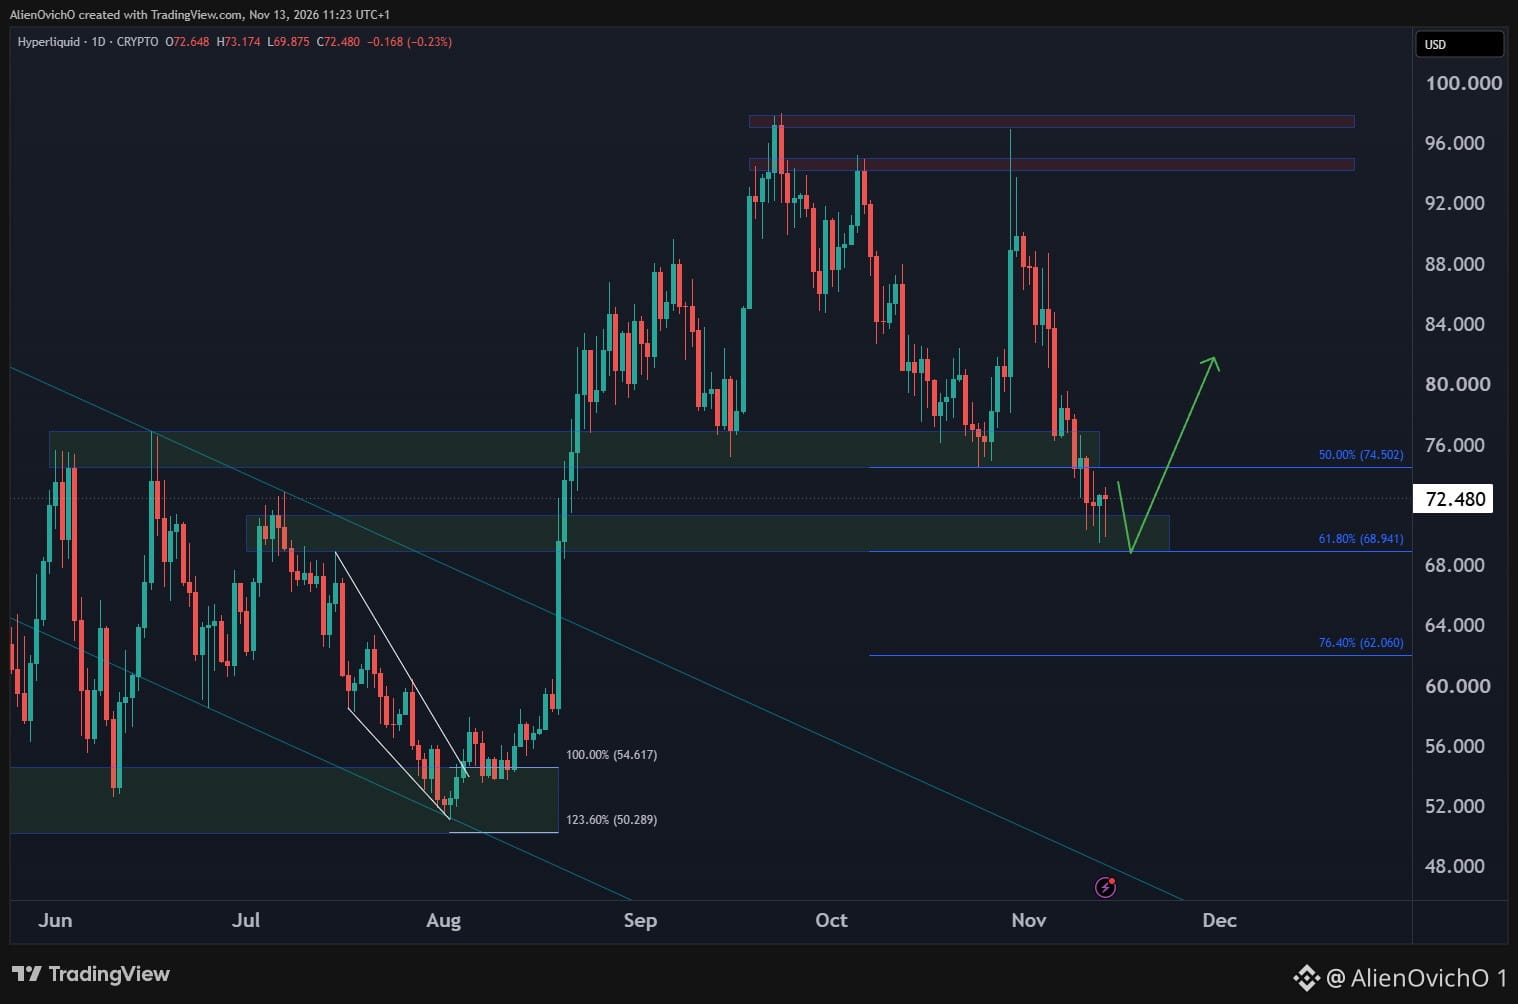
$HYPE is sitting in the daily demand zone and getting ready for the next bounce 📈
Any scaling below $70 will get rewarded in the coming months.
Are you accumulating here?
$HYPE is sitting in the daily demand zone and getting ready for the next bounce 📈
Any scaling below $70 will get rewarded in the coming months.
Are you accumulating here?
Any scaling below $70 will get rewarded in the coming months.
Are you accumulating here?
58
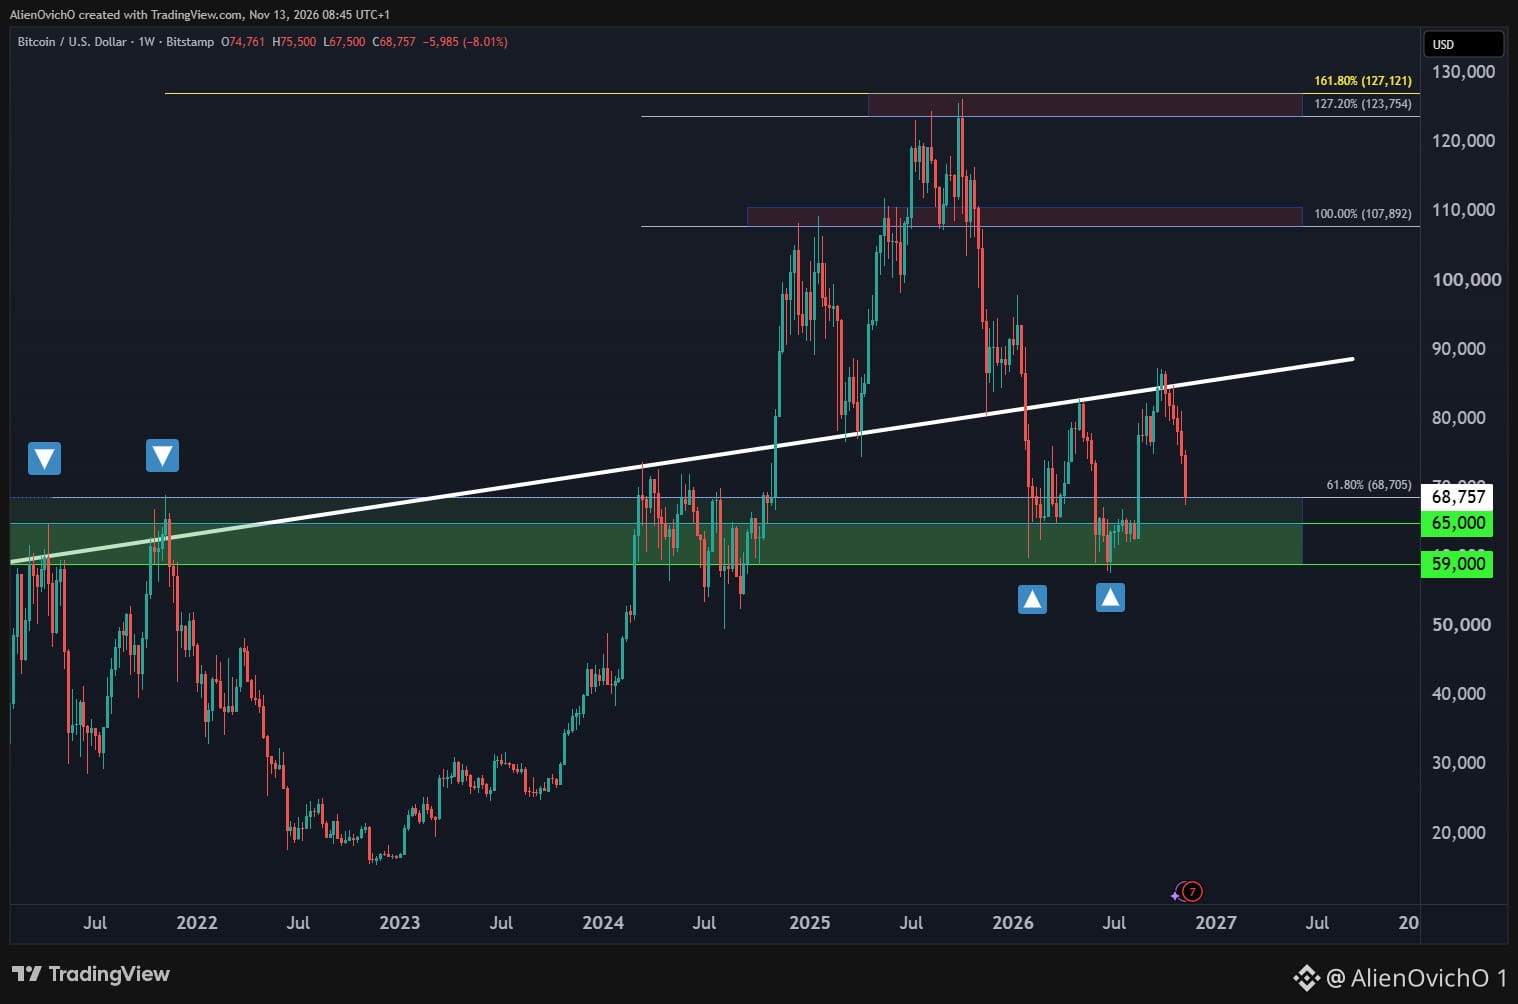
$BTC is back at the weekly equilibrium zone 69K–65K
This is where you should be looking for entries. Long-term investors and swing traders are scaling in around this important zone.
Are you buying Bitcoin here?
$BTC is back at the weekly equilibrium zone 69K–65K
This is where you should be looking for entries. Long-term investors and swing traders are scaling in around this important zone.
Are you buying Bitcoin here?
This is where you should be looking for entries. Long-term investors and swing traders are scaling in around this important zone.
Are you buying Bitcoin here?
68
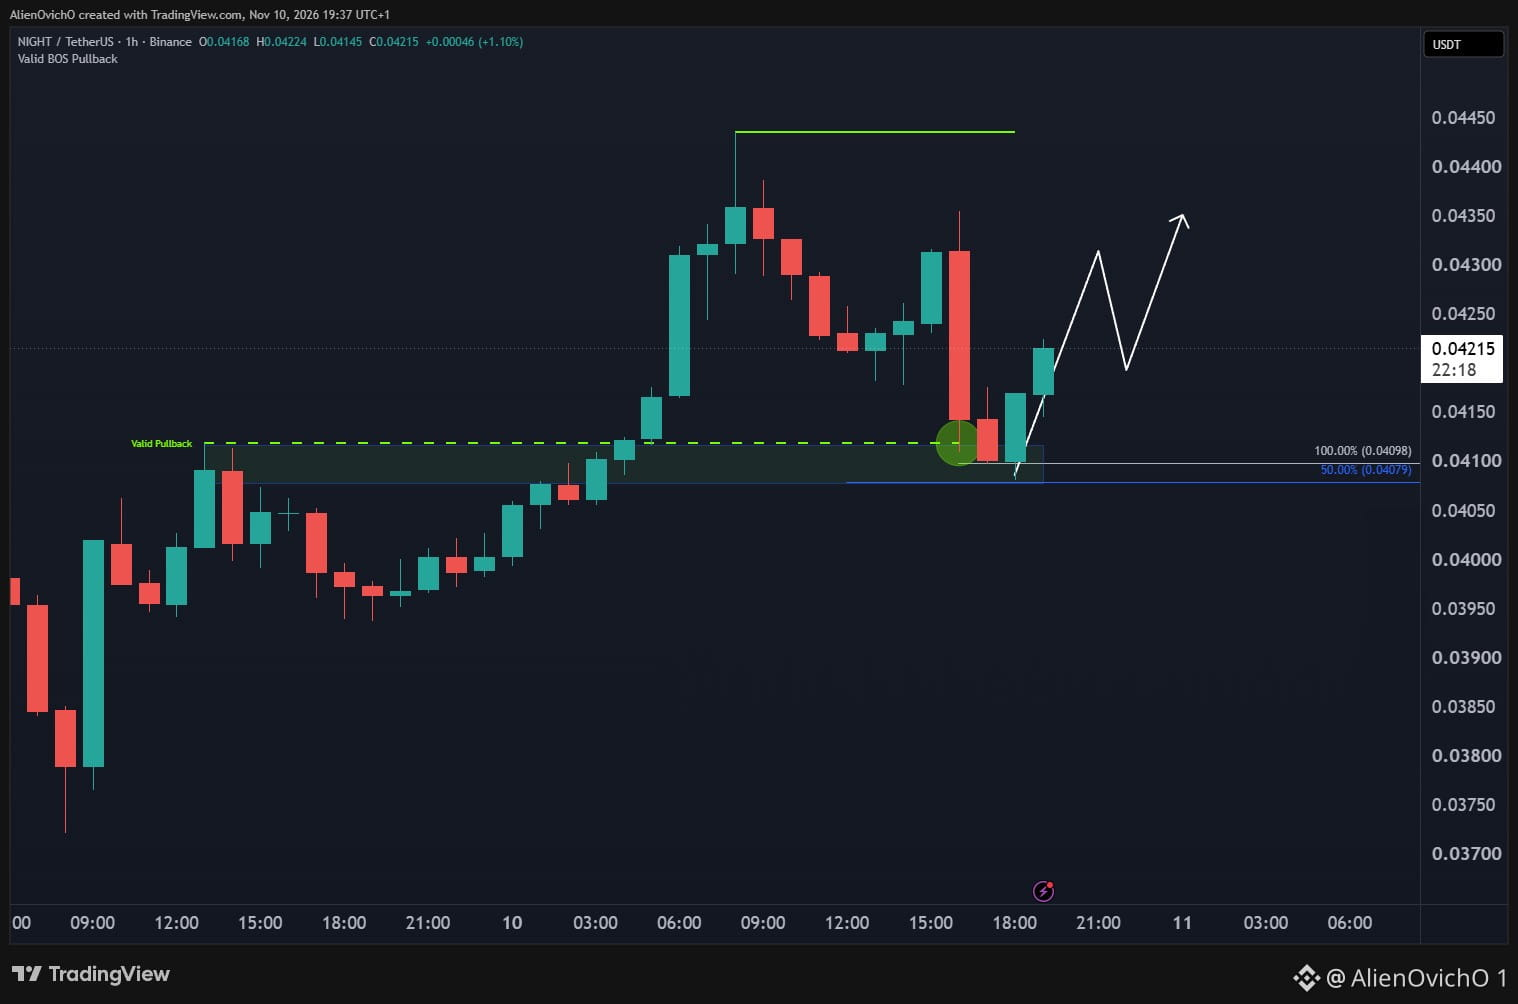
$NIGHT valid BOS on the 1h 🟢
Bulls stepped in at the 50% area around 0.0408. While today's low holds, another push into new highs is on the table.
$NIGHT valid BOS on the 1h 🟢
Bulls stepped in at the 50% area around 0.0408. While today's low holds, another push into new highs is on the table.
Bulls stepped in at the 50% area around 0.0408. While today's low holds, another push into new highs is on the table.
52
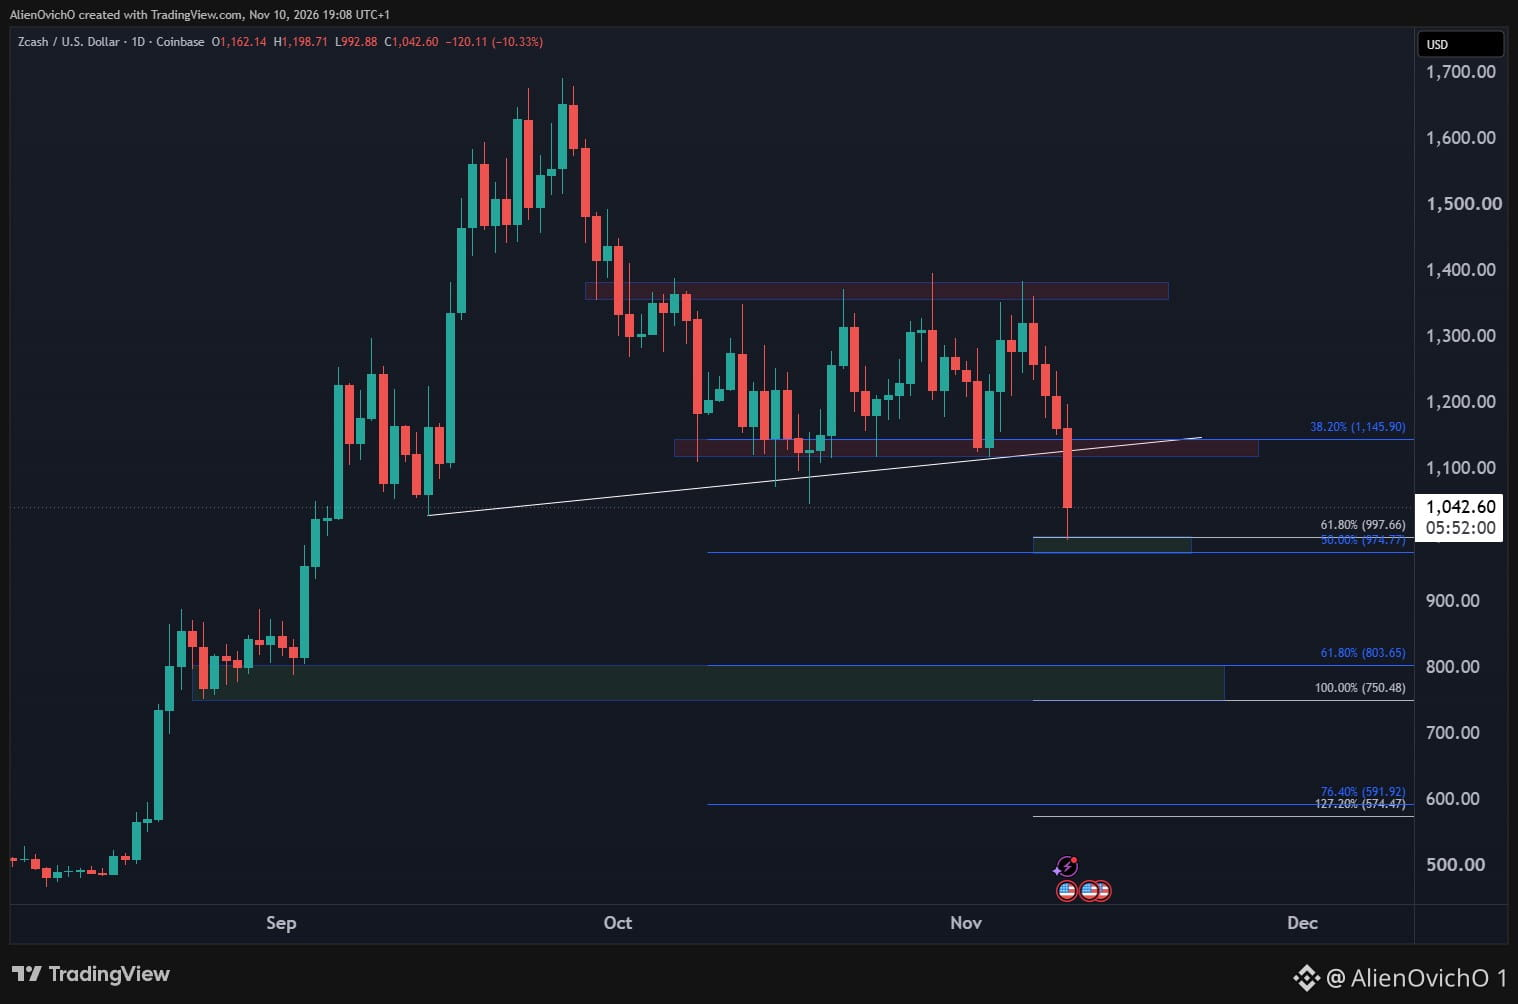
$ZEC lost the support 📉
It's getting a short-term bounce from the $997 level now, but 1,120 could flip into resistance. As long as price stays below it, sellers stay in control, and 803 to 750 is the next area to watch.
Bounce to retest 1,120 first, or straight lower?
$ZEC lost the support 📉
It's getting a short-term bounce from the $997 level now, but 1,120 could flip into resistance. As long as price stays below it, sellers stay in control, and 803 to 750 is the next area to watch.
Bounce to retest 1,120 first, or straight lower?
It's getting a short-term bounce from the $997 level now, but 1,120 could flip into resistance. As long as price stays below it, sellers stay in control, and 803 to 750 is the next area to watch.
Bounce to retest 1,120 first, or straight lower?
60
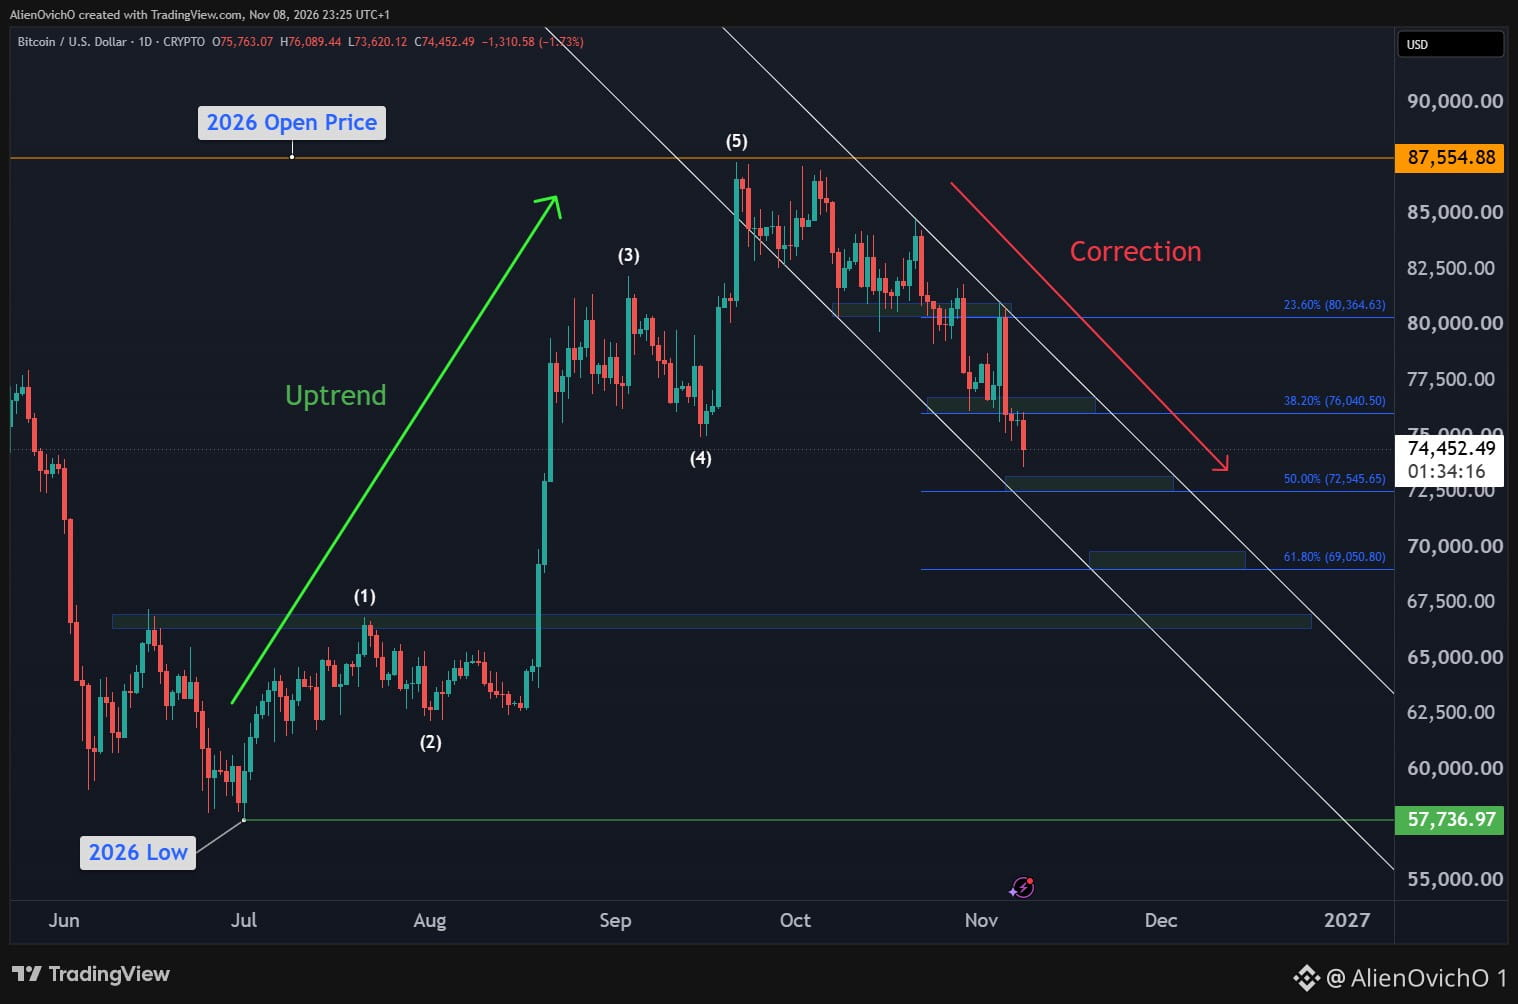
$BTC let's keep it simple 🧭
🔹The rally from the July low (57.7K) was impulsive. It ended the first leg of the new bullish cycle, topping near the 2026 open at 87.5K.
🔹Price is now in a corrective phase inside a falling channel.
🔹No need to guess the exact bottom. Make a plan:
• Long-term: DCA at technical levels.
• Short-term: keep trading the bounces until the uptrend resumes.
A break above the channel would signal that the correction is over.
Are you DCAing Bitcoin here or waiting lower? 👇
$BTC let's keep it simple 🧭
🔹The rally from the July low (57.7K) was impulsive. It ended the first leg of the new bullish cycle, topping near the 2026 open at 87.5K.
🔹Price is now in a corrective phase inside a falling channel.
🔹No need to guess the exact bottom. Make a plan:
• Long-term: DCA at technical levels.
• Short-term: keep trading the bounces until the uptrend resumes.
A break above the channel would signal that the correction is over.
Are you DCAing Bitcoin here or waiting lower? 👇
🔹The rally from the July low (57.7K) was impulsive. It ended the first leg of the new bullish cycle, topping near the 2026 open at 87.5K.
🔹Price is now in a corrective phase inside a falling channel.
🔹No need to guess the exact bottom. Make a plan:
• Long-term: DCA at technical levels.
• Short-term: keep trading the bounces until the uptrend resumes.
A break above the channel would signal that the correction is over.
Are you DCAing Bitcoin here or waiting lower? 👇
66
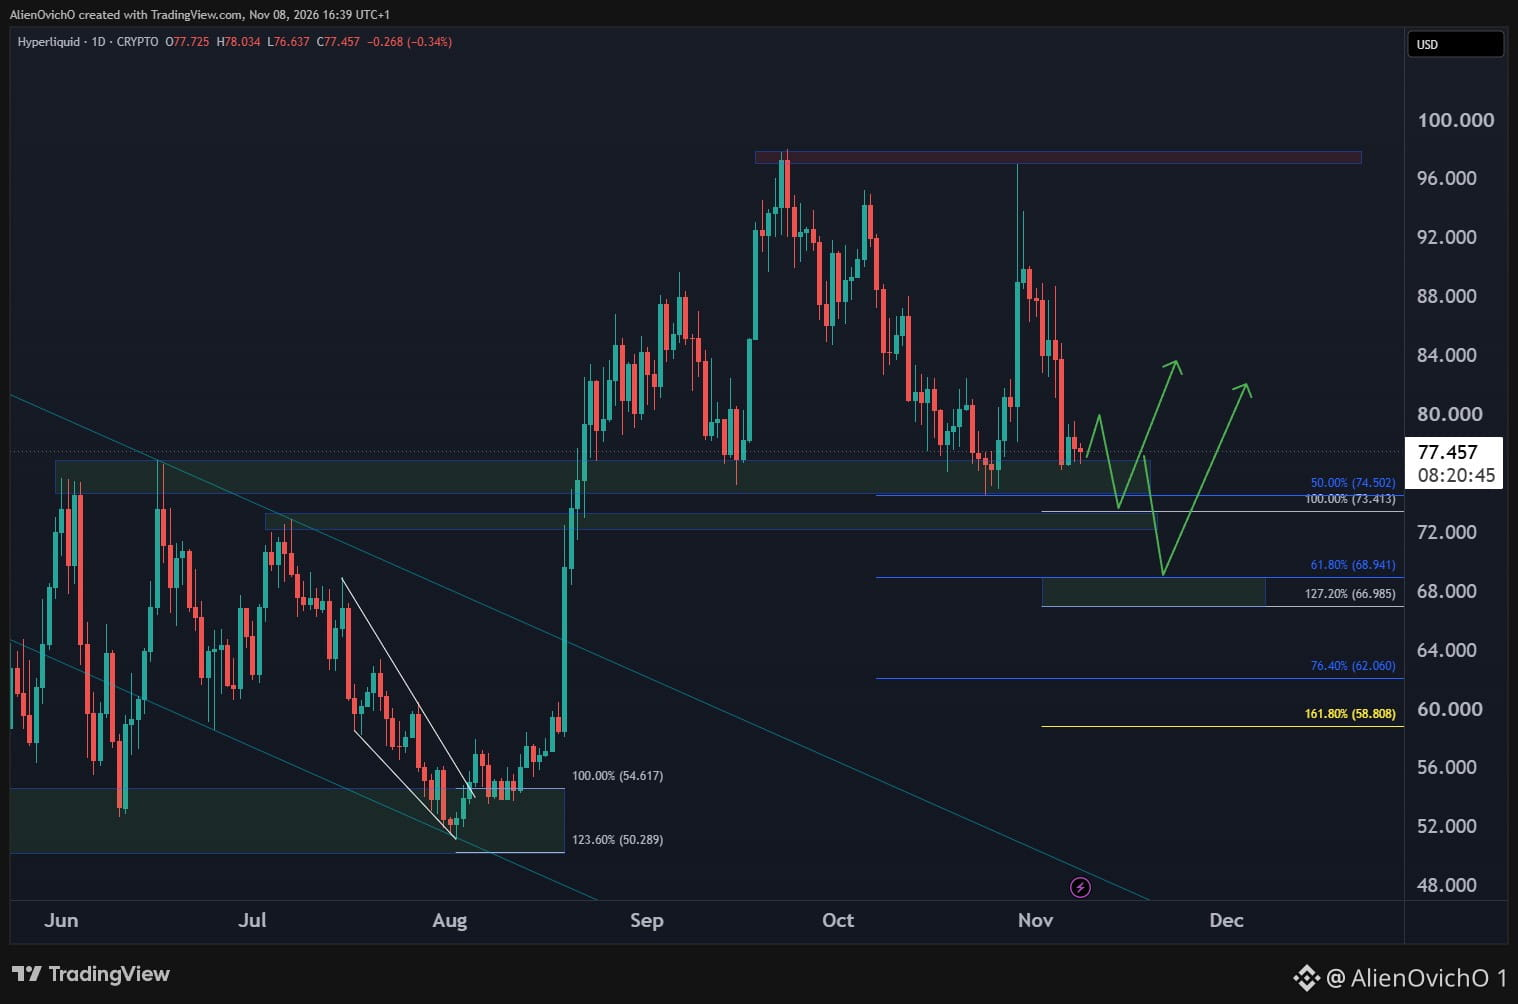
$HYPE is testing the $76 support for the 3rd time 👀
🔹After failing to break into a new ATH near 97, price is back at the 76 support area. The more often support gets tested, the weaker it gets.
🔹A break lower opens the next buying zone at $75–$66: the 100% extension at 73.4, the 61.8% at 68.9 and the 127.2% extension at 66.9 all sit there 🧲.
🔹If price gets there, that's where I'd look for the next turn higher.
Would you buy at 74 or wait for 66–68? 👇
$HYPE is testing the $76 support for the 3rd time 👀
🔹After failing to break into a new ATH near 97, price is back at the 76 support area. The more often support gets tested, the weaker it gets.
🔹A break lower opens the next buying zone at $75–$66: the 100% extension at 73.4, the 61.8% at 68.9 and the 127.2% extension at 66.9 all sit there 🧲.
🔹If price gets there, that's where I'd look for the next turn higher.
Would you buy at 74 or wait for 66–68? 👇
🔹After failing to break into a new ATH near 97, price is back at the 76 support area. The more often support gets tested, the weaker it gets.
🔹A break lower opens the next buying zone at $75–$66: the 100% extension at 73.4, the 61.8% at 68.9 and the 127.2% extension at 66.9 all sit there 🧲.
🔹If price gets there, that's where I'd look for the next turn higher.
Would you buy at 74 or wait for 66–68? 👇
87
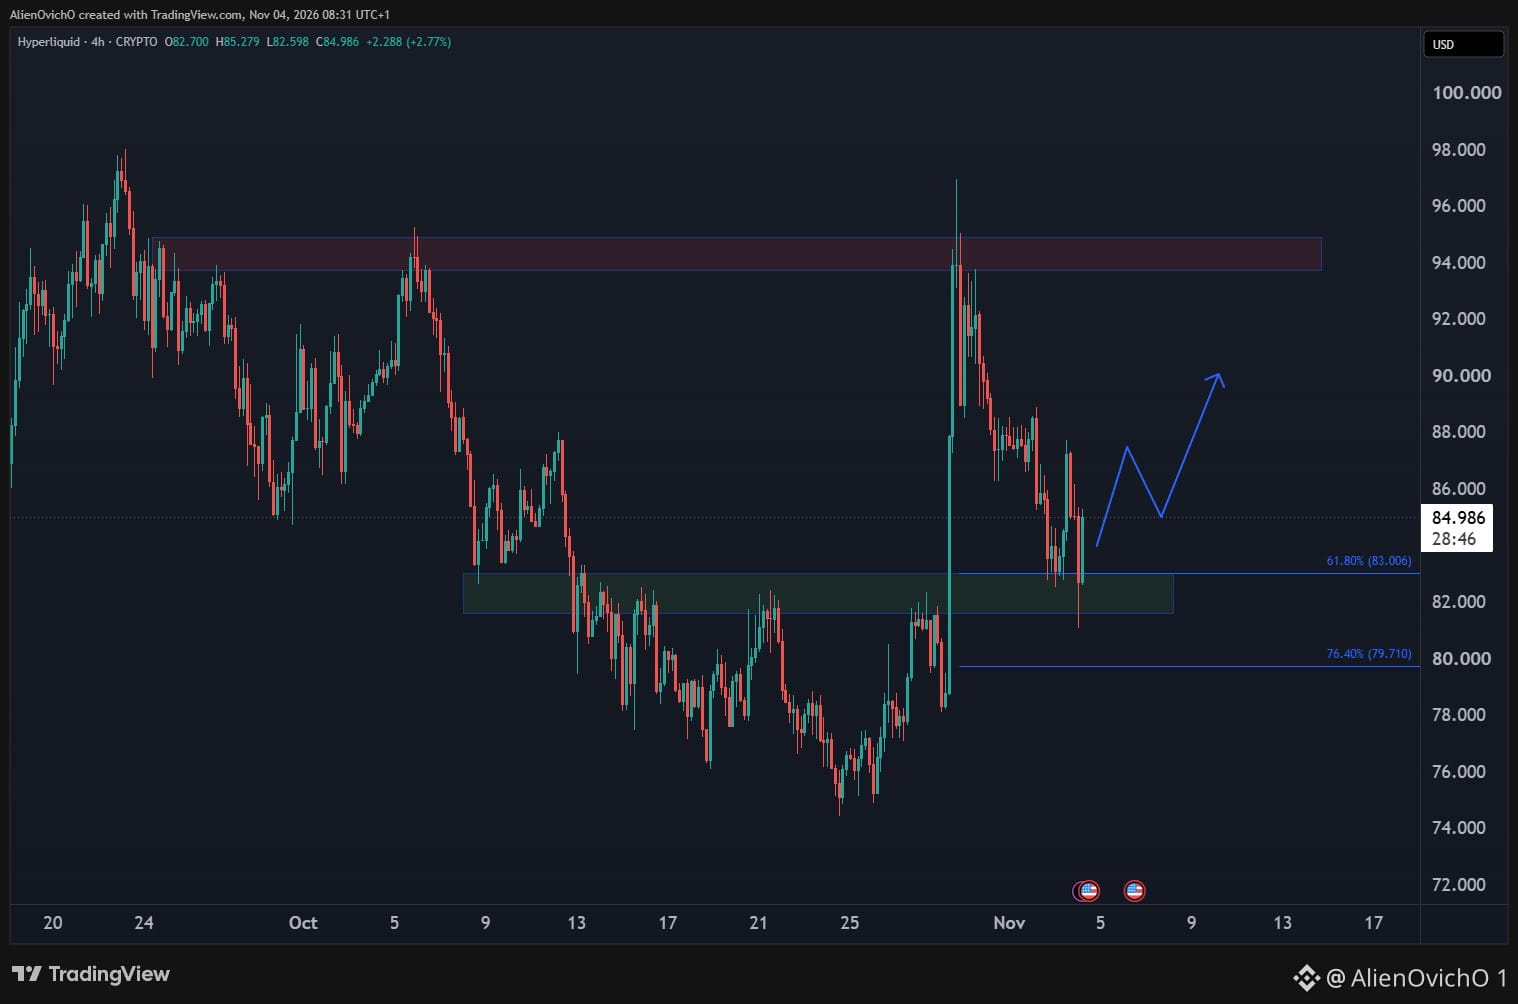
$HYPE tagged the support area 83–82 🎯
As long as today's low holds, bulls will look for a retest of the range highs above $90.
$HYPE tagged the support area 83–82 🎯
As long as today's low holds, bulls will look for a retest of the range highs above $90.
As long as today's low holds, bulls will look for a retest of the range highs above $90.
56
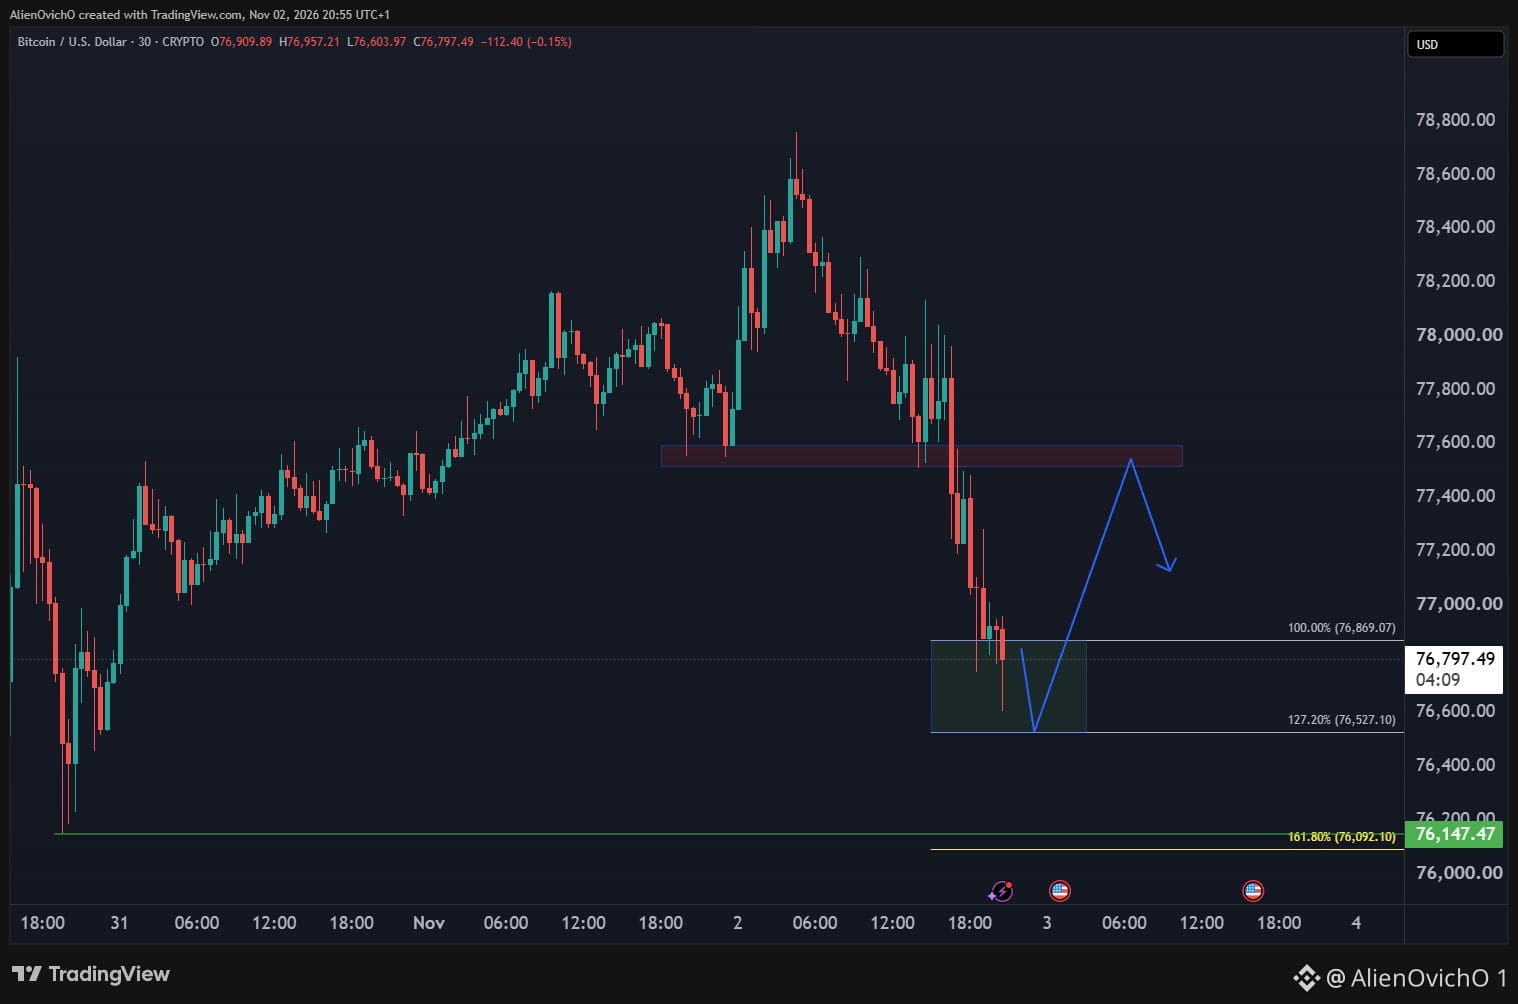
$BTC short-term bounce incoming if 76K holds ⚡
Price dropped into the 76.9K–76.5K demand box after losing 76.5K. The low from Oct 30 sits at 76.1K right below it.
As long as 76K holds, a relief bounce back toward 77.6K is on the table.
Bounce from here or one more sweep first?
$BTC short-term bounce incoming if 76K holds ⚡
Price dropped into the 76.9K–76.5K demand box after losing 76.5K. The low from Oct 30 sits at 76.1K right below it.
As long as 76K holds, a relief bounce back toward 77.6K is on the table.
Bounce from here or one more sweep first?
Price dropped into the 76.9K–76.5K demand box after losing 76.5K. The low from Oct 30 sits at 76.1K right below it.
As long as 76K holds, a relief bounce back toward 77.6K is on the table.
Bounce from here or one more sweep first?
47
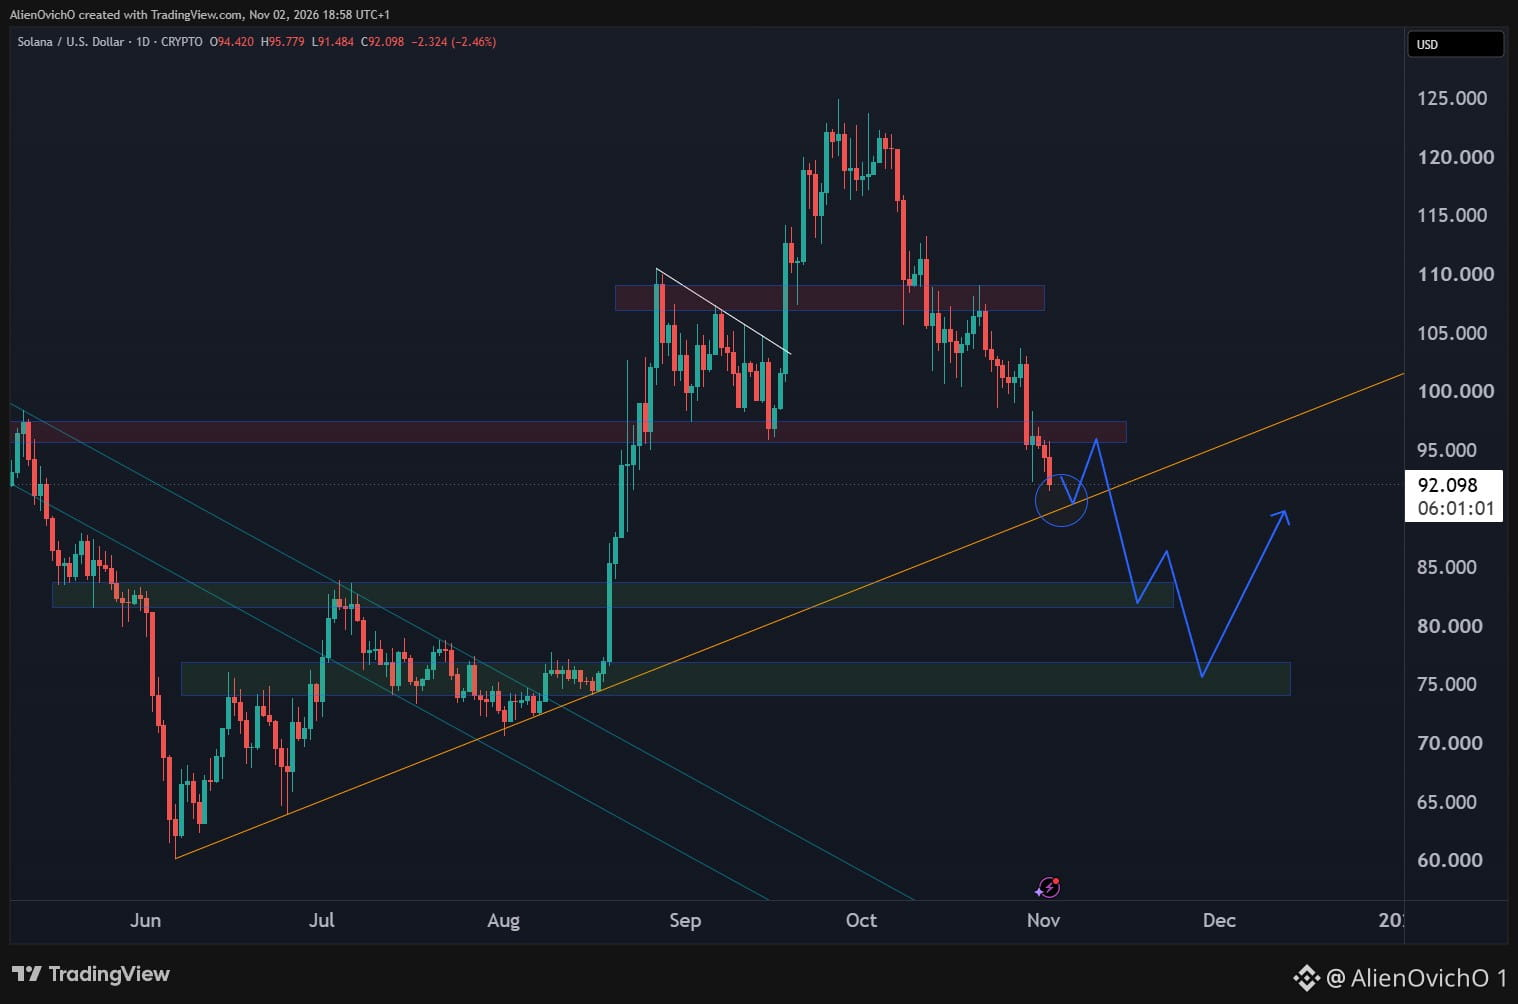
$SOL is approaching the rising trendline from the June low where a short-term bounce off can happen here.
But as long as Solana stays below 97, there's room for a deeper correction toward 83–75 before the next daily bullish reversal shapes up.
Bounce and reclaim 97, or more downside first?
$SOL is approaching the rising trendline from the June low where a short-term bounce off can happen here.
But as long as Solana stays below 97, there's room for a deeper correction toward 83–75 before the next daily bullish reversal shapes up.
Bounce and reclaim 97, or more downside first?
But as long as Solana stays below 97, there's room for a deeper correction toward 83–75 before the next daily bullish reversal shapes up.
Bounce and reclaim 97, or more downside first?
64
📊 $LIT weekly accumulation zone is in sight
Price is cooling off after the run to 5.5. The 2.6–1.9 zone (61.8% to 76.4% retracement) is where I'd expect a base to form.
Holding 2.6 is the stronger path. A flush toward 1.9 would still be a buy zone.
Base first, then a 2027 run to new ATH ↗️
📊 $LIT weekly accumulation zone is in sight
Price is cooling off after the run to 5.5. The 2.6–1.9 zone (61.8% to 76.4% retracement) is where I'd expect a base to form.
Holding 2.6 is the stronger path. A flush toward 1.9 would still be a buy zone.
Base first, then a 2027 run to new ATH ↗️
Price is cooling off after the run to 5.5. The 2.6–1.9 zone (61.8% to 76.4% retracement) is where I'd expect a base to form.
Holding 2.6 is the stronger path. A flush toward 1.9 would still be a buy zone.
Base first, then a 2027 run to new ATH ↗️
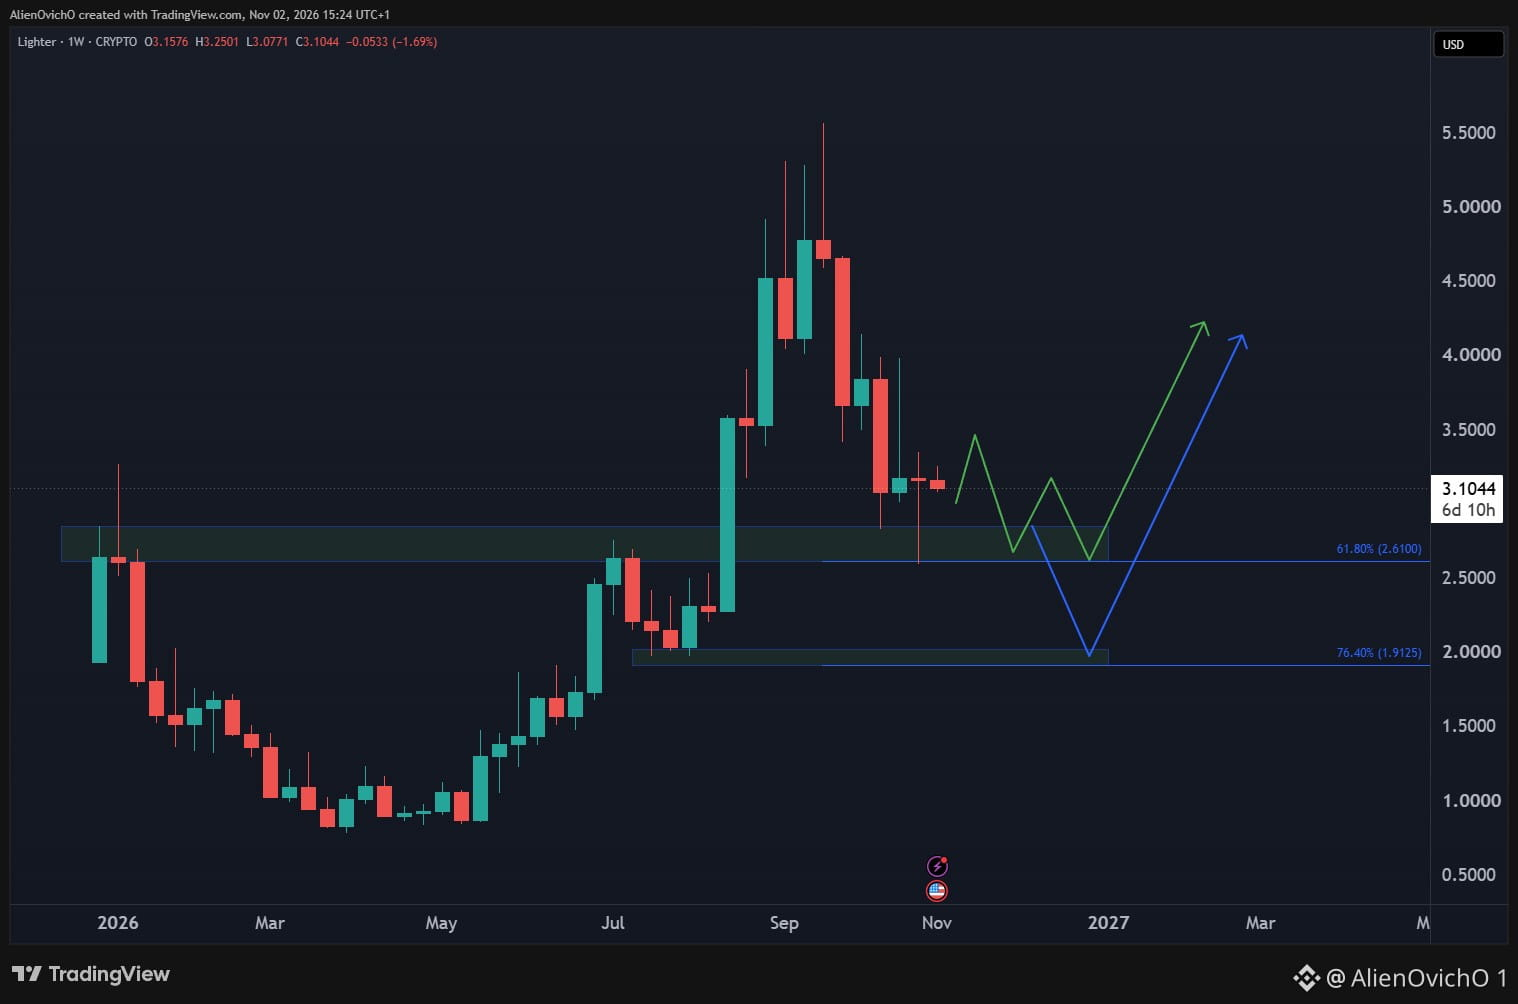
51
$LINK swept the 61.8% retracement and bounced.
Price dipped to 10.34, got bought straight back up, and is now pressing the top of the falling channel at 11.66.
A breakout opens 12.75 - 13.1 before the next reaction lower takes place.
$LINK swept the 61.8% retracement and bounced.
Price dipped to 10.34, got bought straight back up, and is now pressing the top of the falling channel at 11.66.
A breakout opens 12.75 - 13.1 before the next reaction lower takes place.
Price dipped to 10.34, got bought straight back up, and is now pressing the top of the falling channel at 11.66.
A breakout opens 12.75 - 13.1 before the next reaction lower takes place.
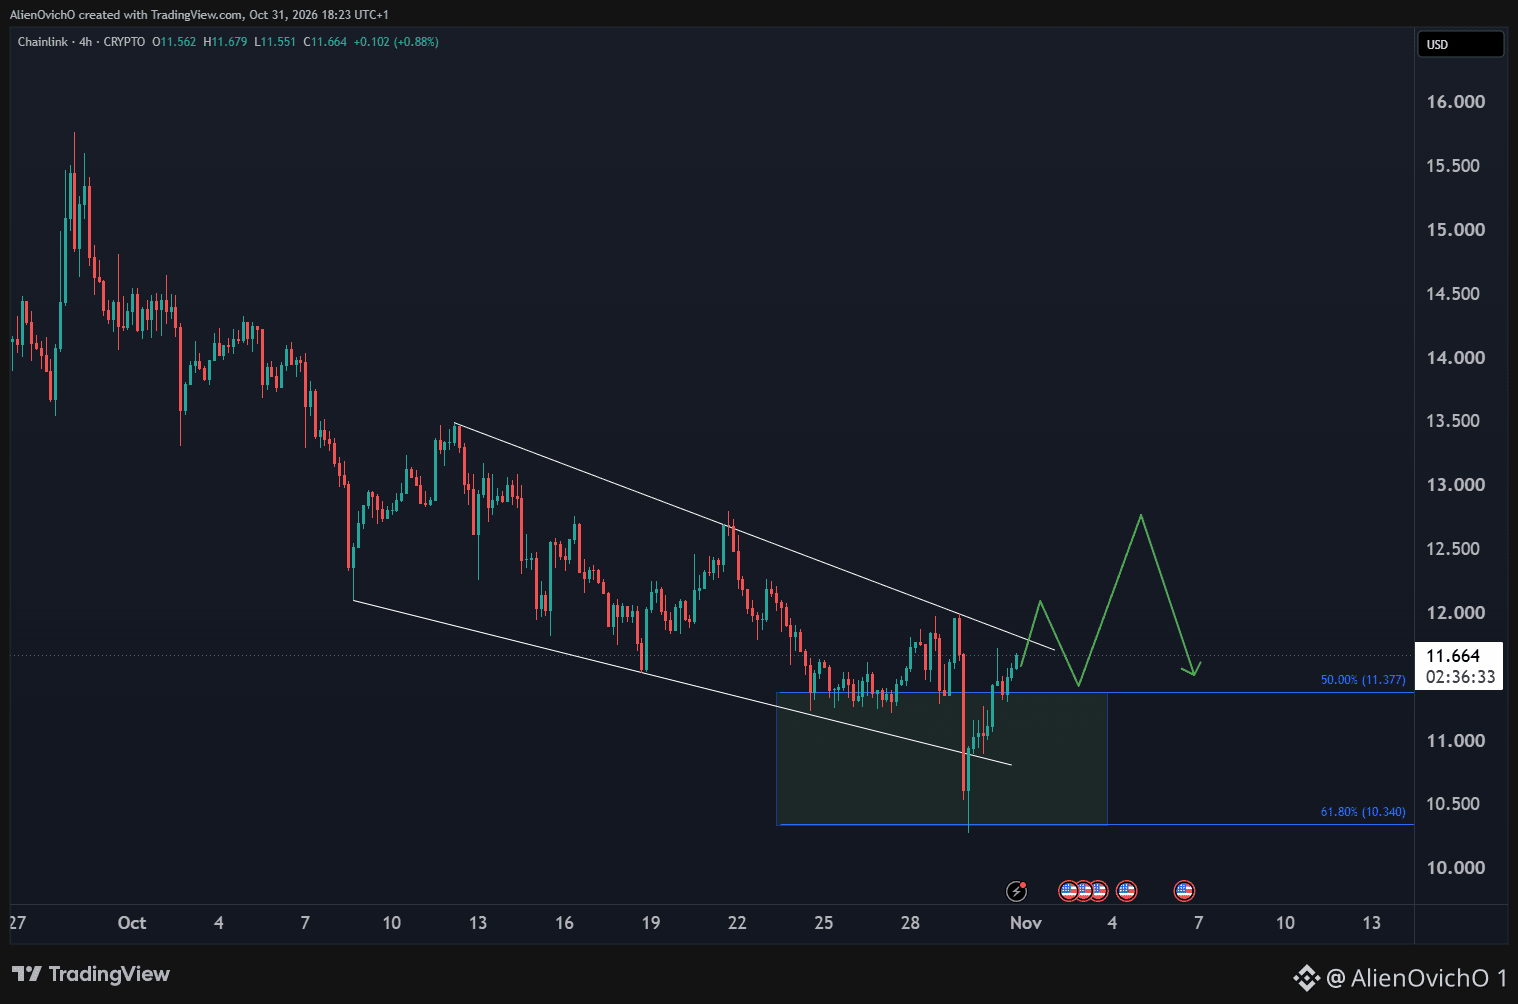
66
$BNB just lost 705 after the Binance hack, and the chart says 601 is next 🧲
That was the Head & Shoulders neckline, sitting right on the 38.2% retracement. The break activates the pattern.
The way down could mirror the way up 🪞
🔹 A slow bounce toward 720–726 to put in another lower high
🔹 Then 641 (61.8%), or a straight drop to 601 (76.4%), right back where the August breakout started
Same steps, same levels, in reverse.
A daily close back above the right shoulder cancels the pattern.
Will the mirror play out over the next few weeks? Two legs down, or a straight drop to 601?
$BNB just lost 705 after the Binance hack, and the chart says 601 is next 🧲
That was the Head & Shoulders neckline, sitting right on the 38.2% retracement. The break activates the pattern.
The way down could mirror the way up 🪞
🔹 A slow bounce toward 720–726 to put in another lower high
🔹 Then 641 (61.8%), or a straight drop to 601 (76.4%), right back where the August breakout started
Same steps, same levels, in reverse.
A daily close back above the right shoulder cancels the pattern.
Will the mirror play out over the next few weeks? Two legs down, or a straight drop to 601?
That was the Head & Shoulders neckline, sitting right on the 38.2% retracement. The break activates the pattern.
The way down could mirror the way up 🪞
🔹 A slow bounce toward 720–726 to put in another lower high
🔹 Then 641 (61.8%), or a straight drop to 601 (76.4%), right back where the August breakout started
Same steps, same levels, in reverse.
A daily close back above the right shoulder cancels the pattern.
Will the mirror play out over the next few weeks? Two legs down, or a straight drop to 601?
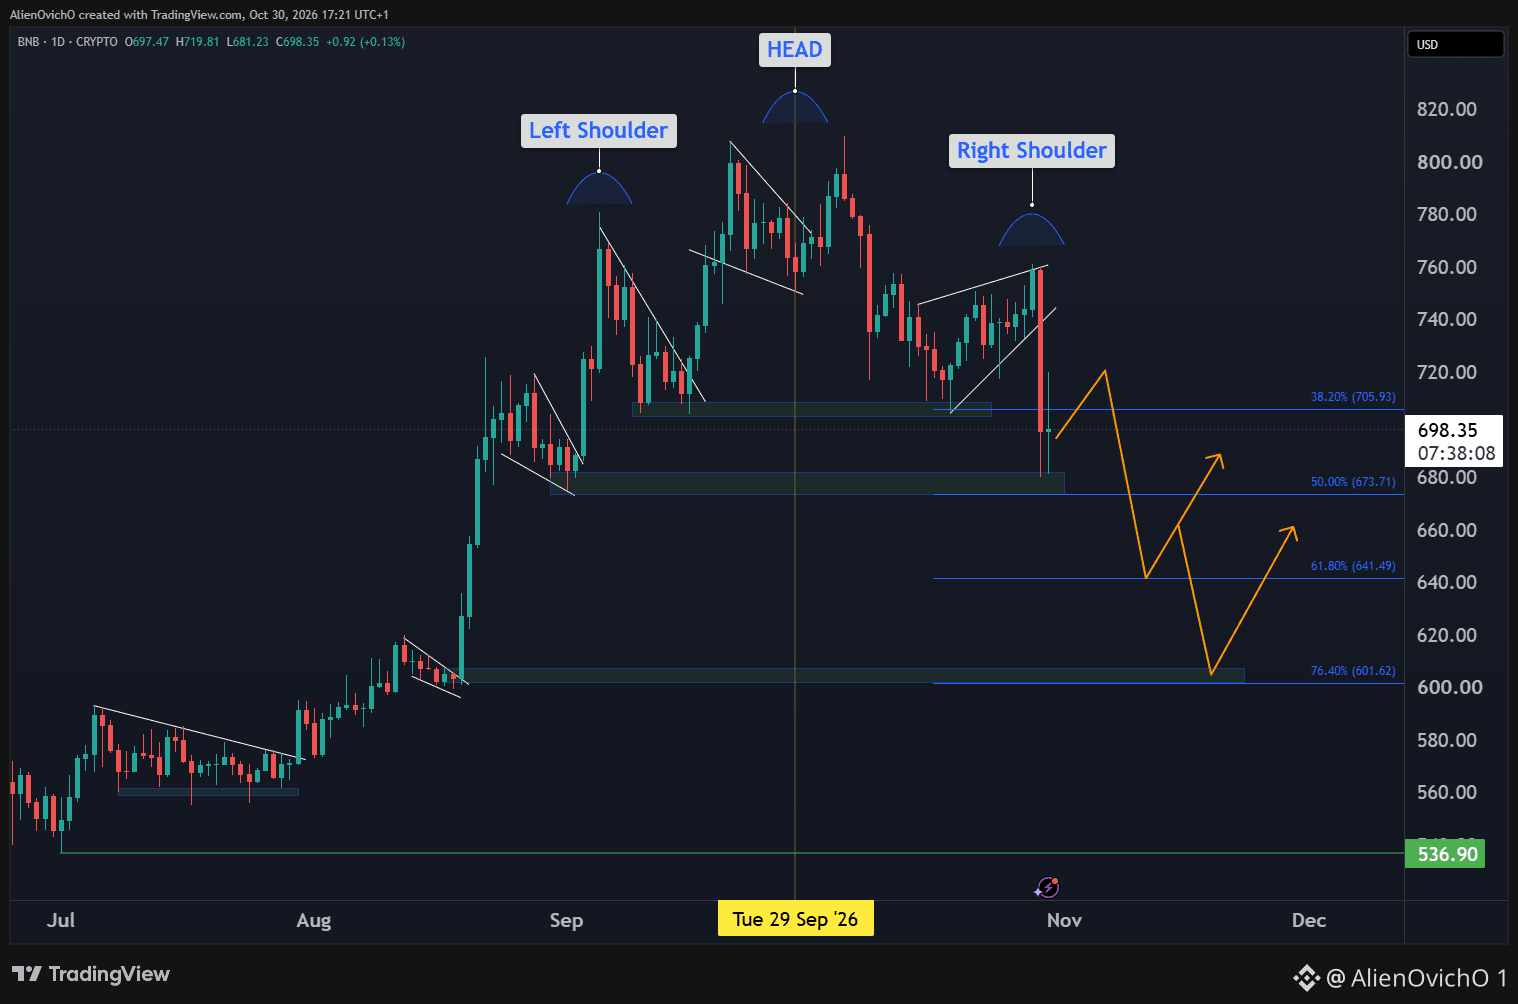
39
⚠️TRON $TRX spiked into its PRZ on the Binance news
Price hit the bearish AB=CD zone at 0.3546–0.3621, and a turn window opens now and runs Oct 30–Nov 3.
Price and time lining up is a spot to be careful, not to chase.
See what's in the zone 👇
przboard.com
⚠️TRON $TRX spiked into its PRZ on the Binance news
Price hit the bearish AB=CD zone at 0.3546–0.3621, and a turn window opens now and runs Oct 30–Nov 3.
Price and time lining up is a spot to be careful, not to chase.
See what's in the zone 👇
przboard.com
Price hit the bearish AB=CD zone at 0.3546–0.3621, and a turn window opens now and runs Oct 30–Nov 3.
Price and time lining up is a spot to be careful, not to chase.
See what's in the zone 👇
przboard.com
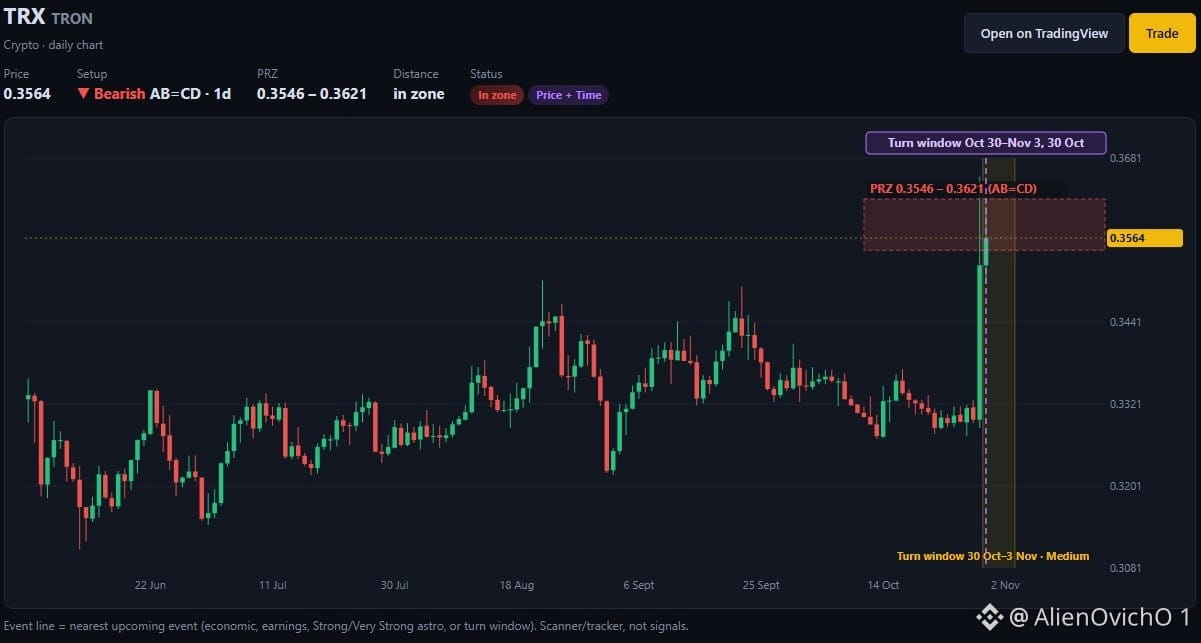
58
Another day in crypto, another Binance headline 🩸
Is this just another dip for $BTC $ETH , or is there more blood to follow?
Another day in crypto, another Binance headline 🩸
Is this just another dip for $BTC $ETH , or is there more blood to follow?
Is this just another dip for $BTC $ETH , or is there more blood to follow?

69
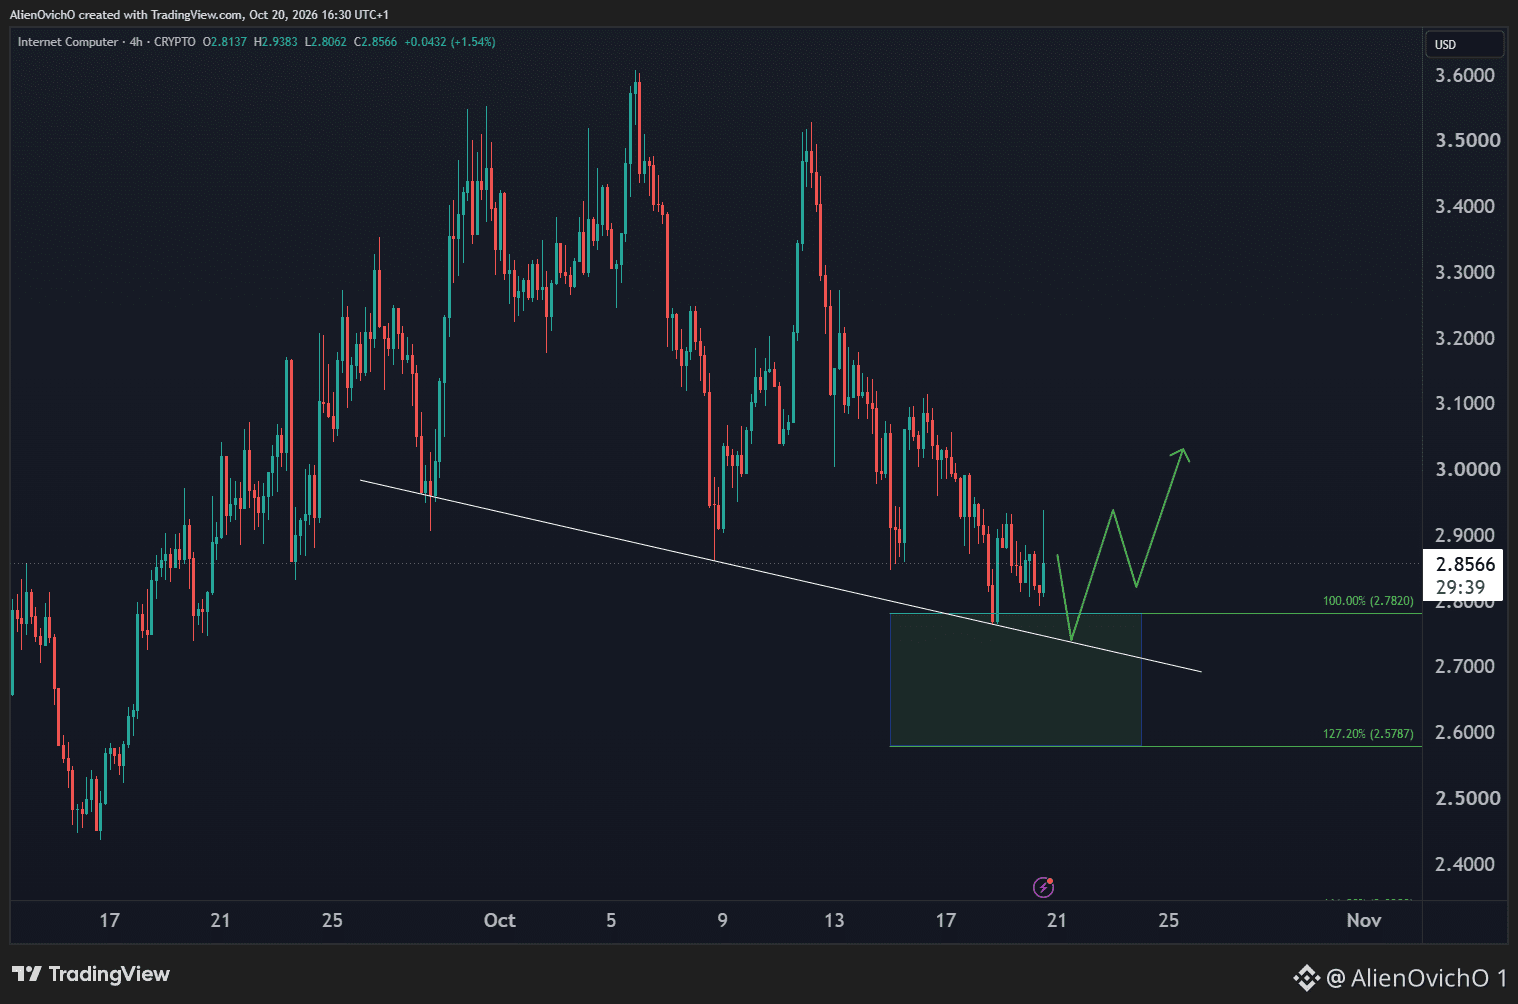
$ICP got an initial reaction into the $2.78 – $2.58 buying area. One more dip into the zone could form the higher low and set up the next leg up to reclaim the $3 mark.
$ICP got an initial reaction into the $2.78 – $2.58 buying area. One more dip into the zone could form the higher low and set up the next leg up to reclaim the $3 mark.
75
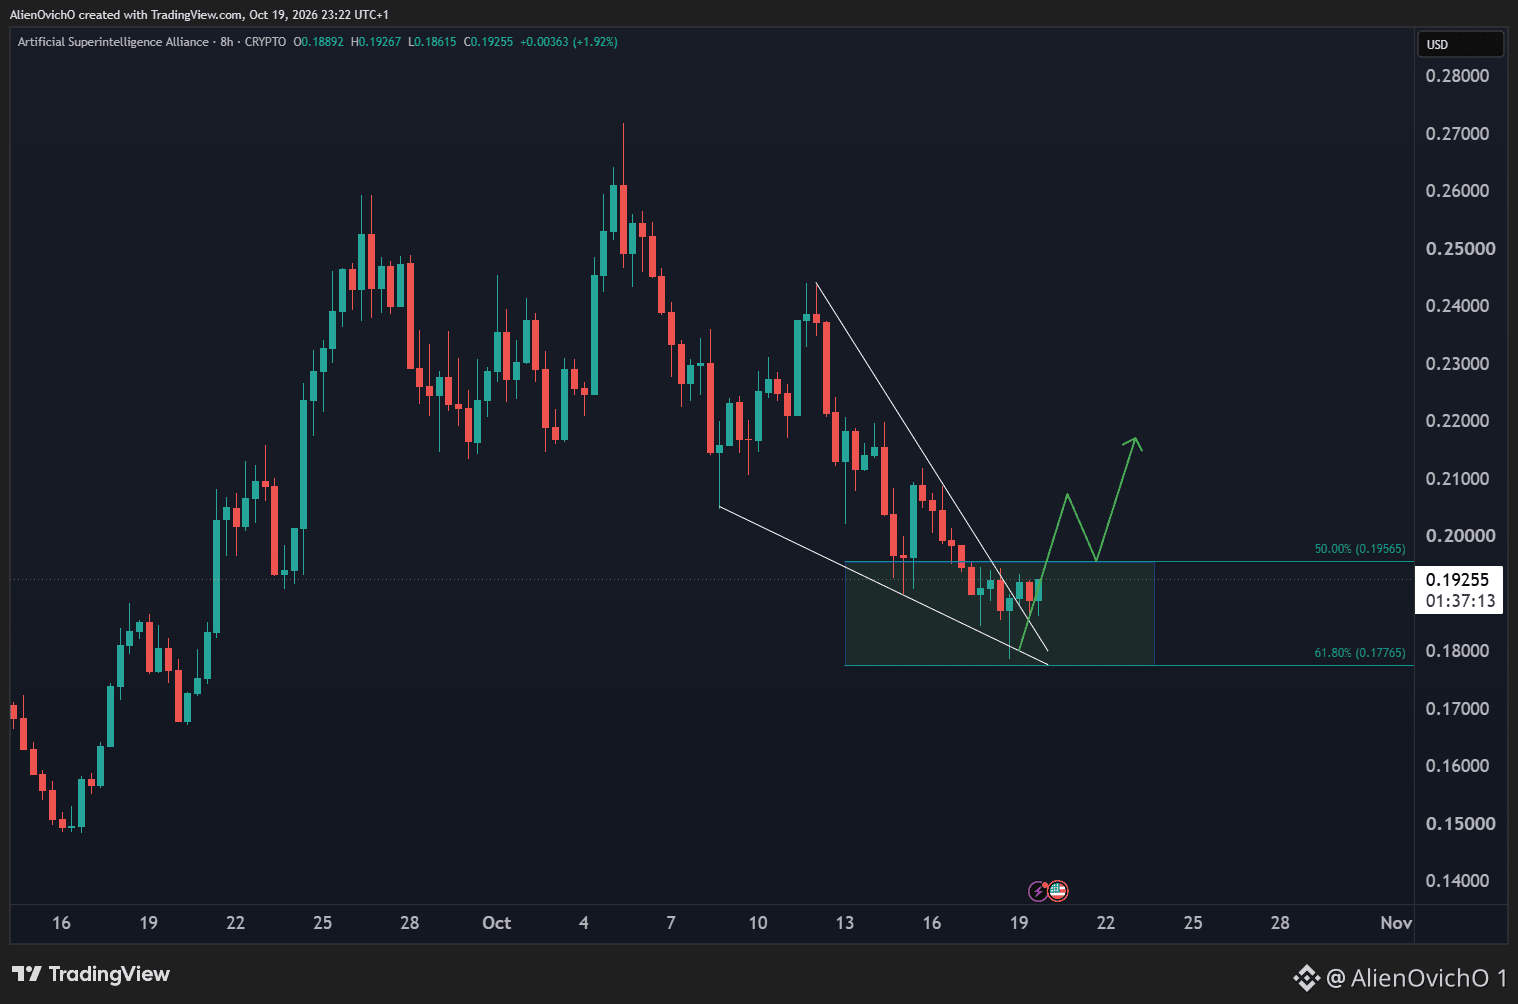
$FET held the 0.196 – 0.178 buying area and is breaking out of the falling wedge.
A retest of the zone from above could set up a 3 waves bounce higher toward 0.22.
Are the AI coins ready to wake up again?
$FET held the 0.196 – 0.178 buying area and is breaking out of the falling wedge.
A retest of the zone from above could set up a 3 waves bounce higher toward 0.22.
Are the AI coins ready to wake up again?
A retest of the zone from above could set up a 3 waves bounce higher toward 0.22.
Are the AI coins ready to wake up again?
66
Войдите, чтобы посмотреть больше материала
Присоединяйтесь к пользователям криптовалют по всему миру на Binance Square
⚡️ Получайте новейшую и полезную информацию о криптоактивах.
💬 Нам доверяет крупнейшая в мире криптобиржа.
👍 Получите достоверные аналитические данные от верифицированных создателей контента.
Эл. почта/номер телефона
В тренде
NvidiaBeatsEstimatesWith$130BQ4Outlook
Просмотров: 1,153
24 обсуждают
Nvidia Beats With $115.8 Billion in Revenue, Guides to $130 Billion and Adds $150 Billion Buyback
Binance News
·Лайков: 21
·Просмотров: 23.2k
AnthropicIPOPriceCouldExceed$80
Просмотров: 1,494
37 обсуждают
CanNvidia’sDataCenterGrowthContinue?
Просмотров: 2,602
83 обсуждают