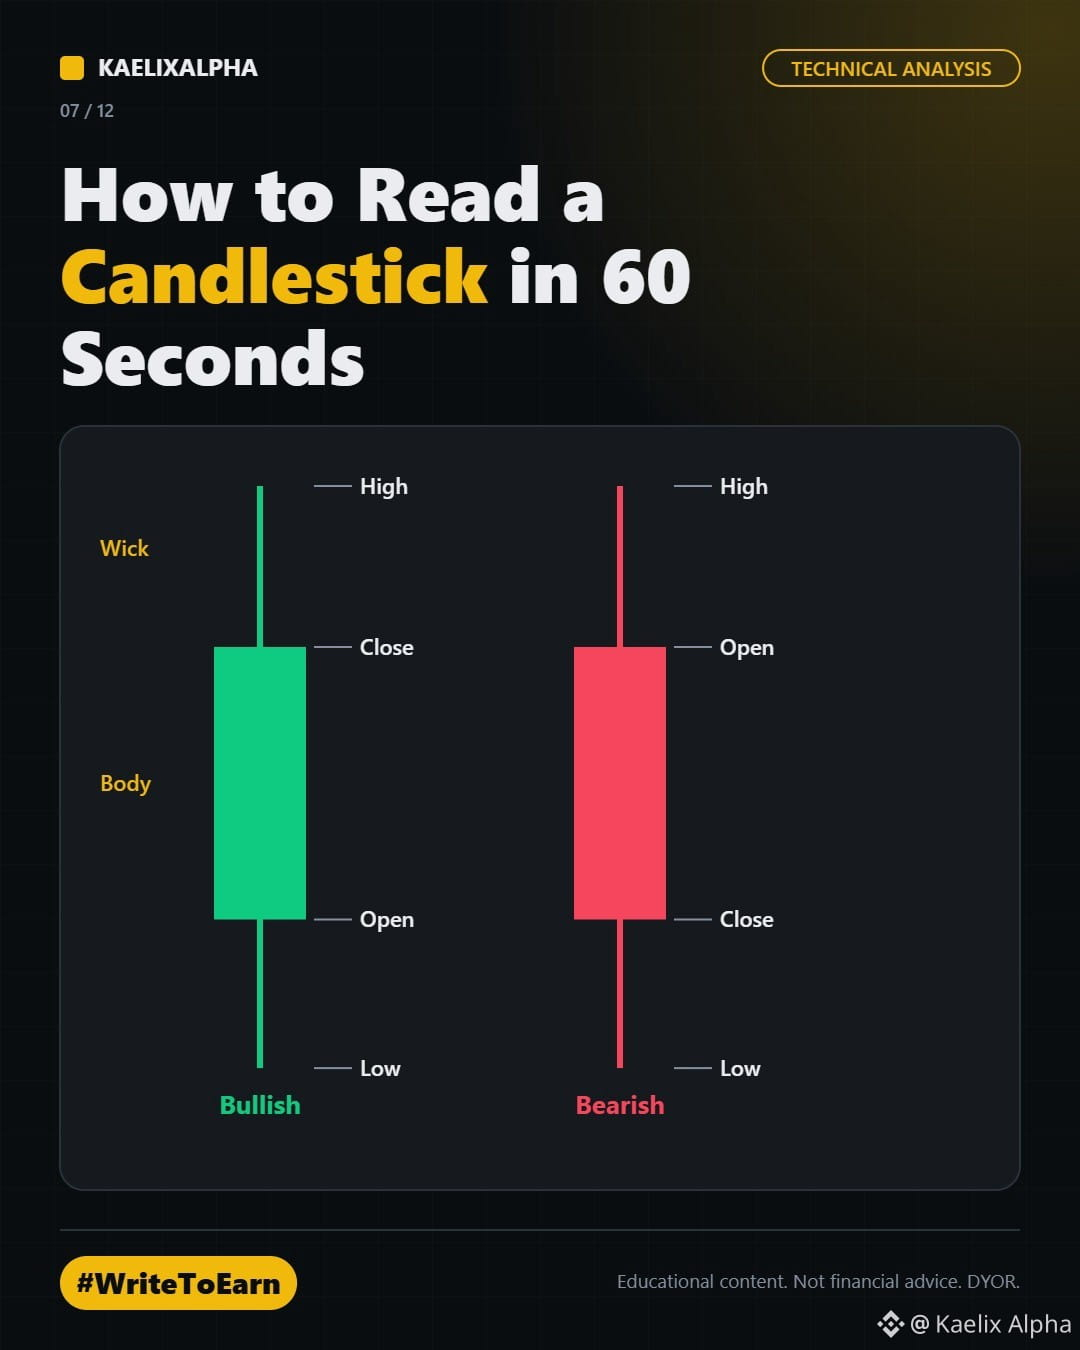

𝗛𝗢𝗪 𝗧𝗢 𝗥𝗘𝗔𝗗 𝗔 𝗖𝗔𝗡𝗗𝗟𝗘𝗦𝗧𝗜𝗖𝗞 𝗜𝗡 𝟲𝟬 𝗦𝗘𝗖𝗢𝗡𝗗𝗦
Every chart you see on Binance is built from candlesticks. Once you understand one candle, you can start reading the story of the market.
𝗧𝗛𝗘 𝟰 𝗣𝗥𝗜𝗖𝗘𝗦 𝗜𝗡 𝗘𝗩𝗘𝗥𝗬 𝗖𝗔𝗡𝗗𝗟𝗘
Open: price at the start of the time period
Close: price at the end of the time period
High: the highest price reached
Low: the lowest price reached
𝗧𝗛𝗘 𝗕𝗢𝗗𝗬
The thick part between open and close.
Green candle: close is higher than open (buyers won).
Red candle: close is lower than open (sellers won).
𝗧𝗛𝗘 𝗪𝗜𝗖𝗞𝗦 (𝗦𝗛𝗔𝗗𝗢𝗪𝗦)
The thin lines above and below the body. They show how far price travelled before being pushed back.
Long upper wick: sellers rejected higher prices.
Long lower wick: buyers defended lower prices.
𝟯 𝗖𝗔𝗡𝗗𝗟𝗘𝗦 𝗘𝗩𝗘𝗥𝗬 𝗕𝗘𝗚𝗜𝗡𝗡𝗘𝗥 𝗦𝗛𝗢𝗨𝗟𝗗 𝗞𝗡𝗢𝗪
Doji: open and close almost equal. The market is undecided.
Hammer: small body, long lower wick, often appearing after a drop. Buyers are stepping in.
Shooting star: small body, long upper wick, often appearing after a rise. Sellers are stepping in.
𝗜𝗠𝗣𝗢𝗥𝗧𝗔𝗡𝗧
One candle is a clue, not a confirmation. Always look at the trend, volume and key levels around it.
Open your $BTC chart now and find the last doji. Drop the timeframe in the comments.
$BTC $ETH
#WriteToEarn #BinanceSquare #TechnicalAnalysis #CryptoEducation
Every chart you see on Binance is built from candlesticks. Once you understand one candle, you can start reading the story of the market.
𝗧𝗛𝗘 𝟰 𝗣𝗥𝗜𝗖𝗘𝗦 𝗜𝗡 𝗘𝗩𝗘𝗥𝗬 𝗖𝗔𝗡𝗗𝗟𝗘
Open: price at the start of the time period
Close: price at the end of the time period
High: the highest price reached
Low: the lowest price reached
𝗧𝗛𝗘 𝗕𝗢𝗗𝗬
The thick part between open and close.
Green candle: close is higher than open (buyers won).
Red candle: close is lower than open (sellers won).
𝗧𝗛𝗘 𝗪𝗜𝗖𝗞𝗦 (𝗦𝗛𝗔𝗗𝗢𝗪𝗦)
The thin lines above and below the body. They show how far price travelled before being pushed back.
Long upper wick: sellers rejected higher prices.
Long lower wick: buyers defended lower prices.
𝟯 𝗖𝗔𝗡𝗗𝗟𝗘𝗦 𝗘𝗩𝗘𝗥𝗬 𝗕𝗘𝗚𝗜𝗡𝗡𝗘𝗥 𝗦𝗛𝗢𝗨𝗟𝗗 𝗞𝗡𝗢𝗪
Doji: open and close almost equal. The market is undecided.
Hammer: small body, long lower wick, often appearing after a drop. Buyers are stepping in.
Shooting star: small body, long upper wick, often appearing after a rise. Sellers are stepping in.
𝗜𝗠𝗣𝗢𝗥𝗧𝗔𝗡𝗧
One candle is a clue, not a confirmation. Always look at the trend, volume and key levels around it.
Open your $BTC chart now and find the last doji. Drop the timeframe in the comments.
$BTC $ETH
#WriteToEarn #BinanceSquare #TechnicalAnalysis #CryptoEducation