$ZIL: The Museum Rope: Why Standing Back Lets You See the Whole Painting
$ZIL: ZIL shows a down hourly direction while volume is not above baseline, prompting a natural question about how we read short‑term moves. When we zoom out from one‑minute pixels, the market can be thought of as a museum visitor stepping back from a detailed painting. Up close, every brushstroke – each tiny price tick – looks decisive, but from a few steps away the broader composition of color, light and texture becomes clearer.
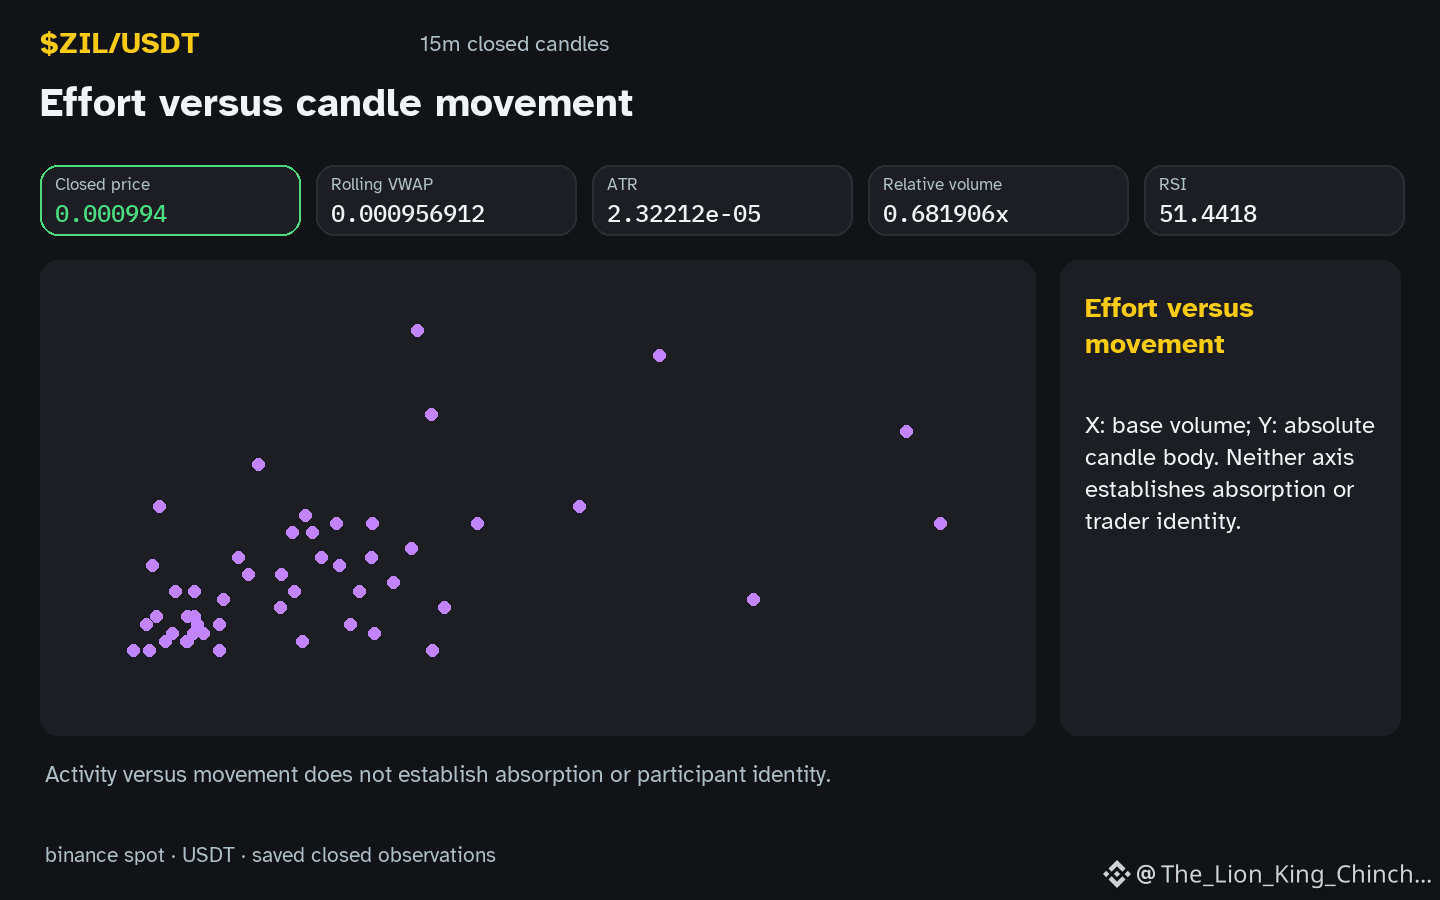
In this analogy, liquidity acts like the canvas texture. A highly liquid market provides a smooth surface where paint spreads evenly, making individual strokes blend without obvious gaps. Conversely, low liquidity is a rough canvas; a single brushstroke can create a noticeable ridge that distorts the overall image. The observed hourly direction downwards may simply be a local ridge rather than a shift in the entire picture. Metrics such as relative volume 0.68x baseline and RSI 51.4 help gauge how smooth that canvas feels, but they do not prove a lasting trend.
A counterexample would be a token with a smooth canvas (high relative volume) that still forms a steep ridge due to a sudden news spike; the analogy breaks because external forces can paint over texture. To reassess, watch the next closed hourly candle: if the price continues to decline while relative volume stays low and RSI remains in oversold territory, the ridge may deepen. If instead volume spikes and RSI climbs, the canvas may be smoothing out, suggesting the initial down move was a temporary detail rather than a new composition.
Probabilistic market research, not a recommendation or guaranteed return.
Where does this analogy help, and where does it break?
#ZIL #CryptoEducation #CryptoLearning
$ZIL: ZIL shows a down hourly direction while volume is not above baseline, prompting a natural question about how we read short‑term moves. When we zoom out from one‑minute pixels, the market can be thought of as a museum visitor stepping back from a detailed painting. Up close, every brushstroke – each tiny price tick – looks decisive, but from a few steps away the broader composition of color, light and texture becomes clearer.
In this analogy, liquidity acts like the canvas texture. A highly liquid market provides a smooth surface where paint spreads evenly, making individual strokes blend without obvious gaps. Conversely, low liquidity is a rough canvas; a single brushstroke can create a noticeable ridge that distorts the overall image. The observed hourly direction downwards may simply be a local ridge rather than a shift in the entire picture. Metrics such as relative volume 0.68x baseline and RSI 51.4 help gauge how smooth that canvas feels, but they do not prove a lasting trend.
A counterexample would be a token with a smooth canvas (high relative volume) that still forms a steep ridge due to a sudden news spike; the analogy breaks because external forces can paint over texture. To reassess, watch the next closed hourly candle: if the price continues to decline while relative volume stays low and RSI remains in oversold territory, the ridge may deepen. If instead volume spikes and RSI climbs, the canvas may be smoothing out, suggesting the initial down move was a temporary detail rather than a new composition.
Probabilistic market research, not a recommendation or guaranteed return.
Where does this analogy help, and where does it break?
#ZIL #CryptoEducation #CryptoLearning