
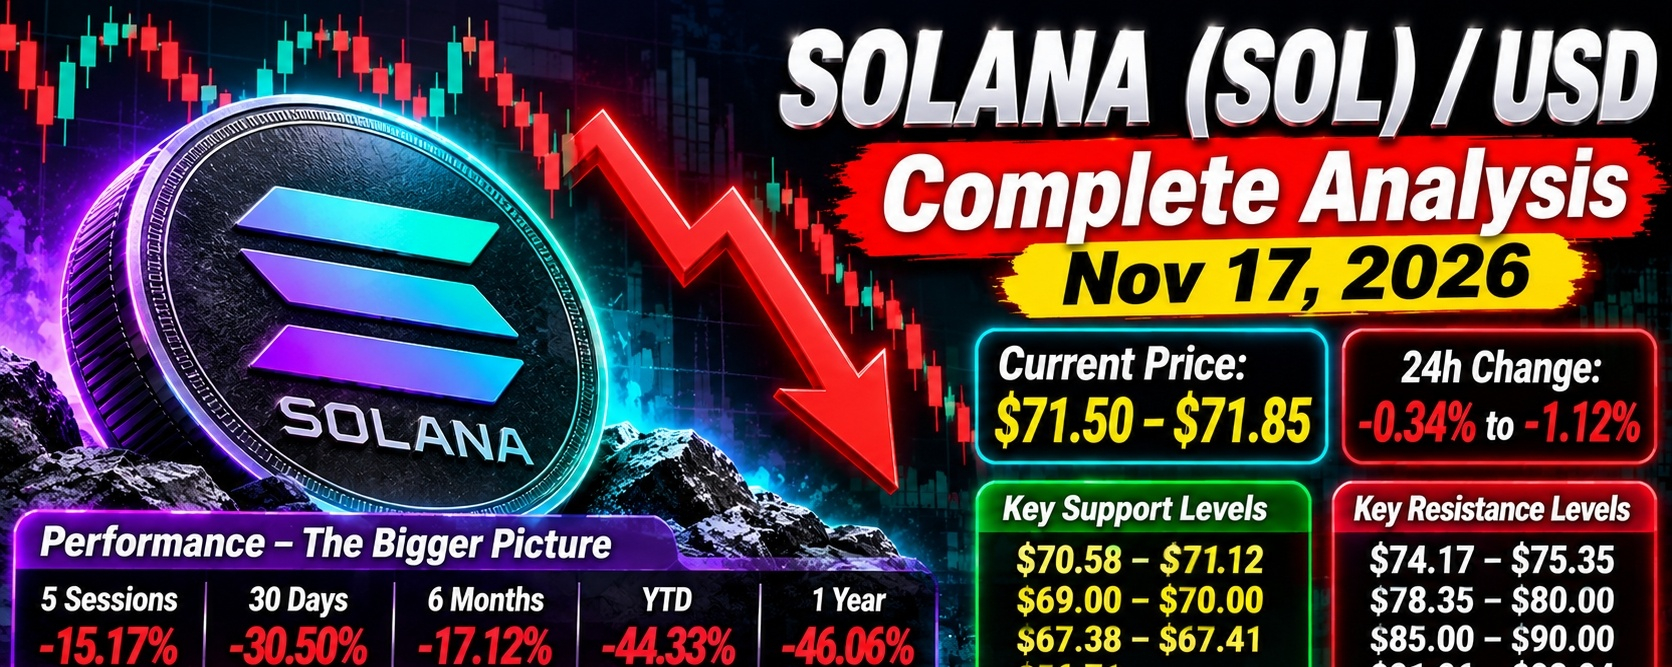

Solana ($SOL ) / USD - Complete Analysis
Nov 17, 2026
1. Live Price Snapshot
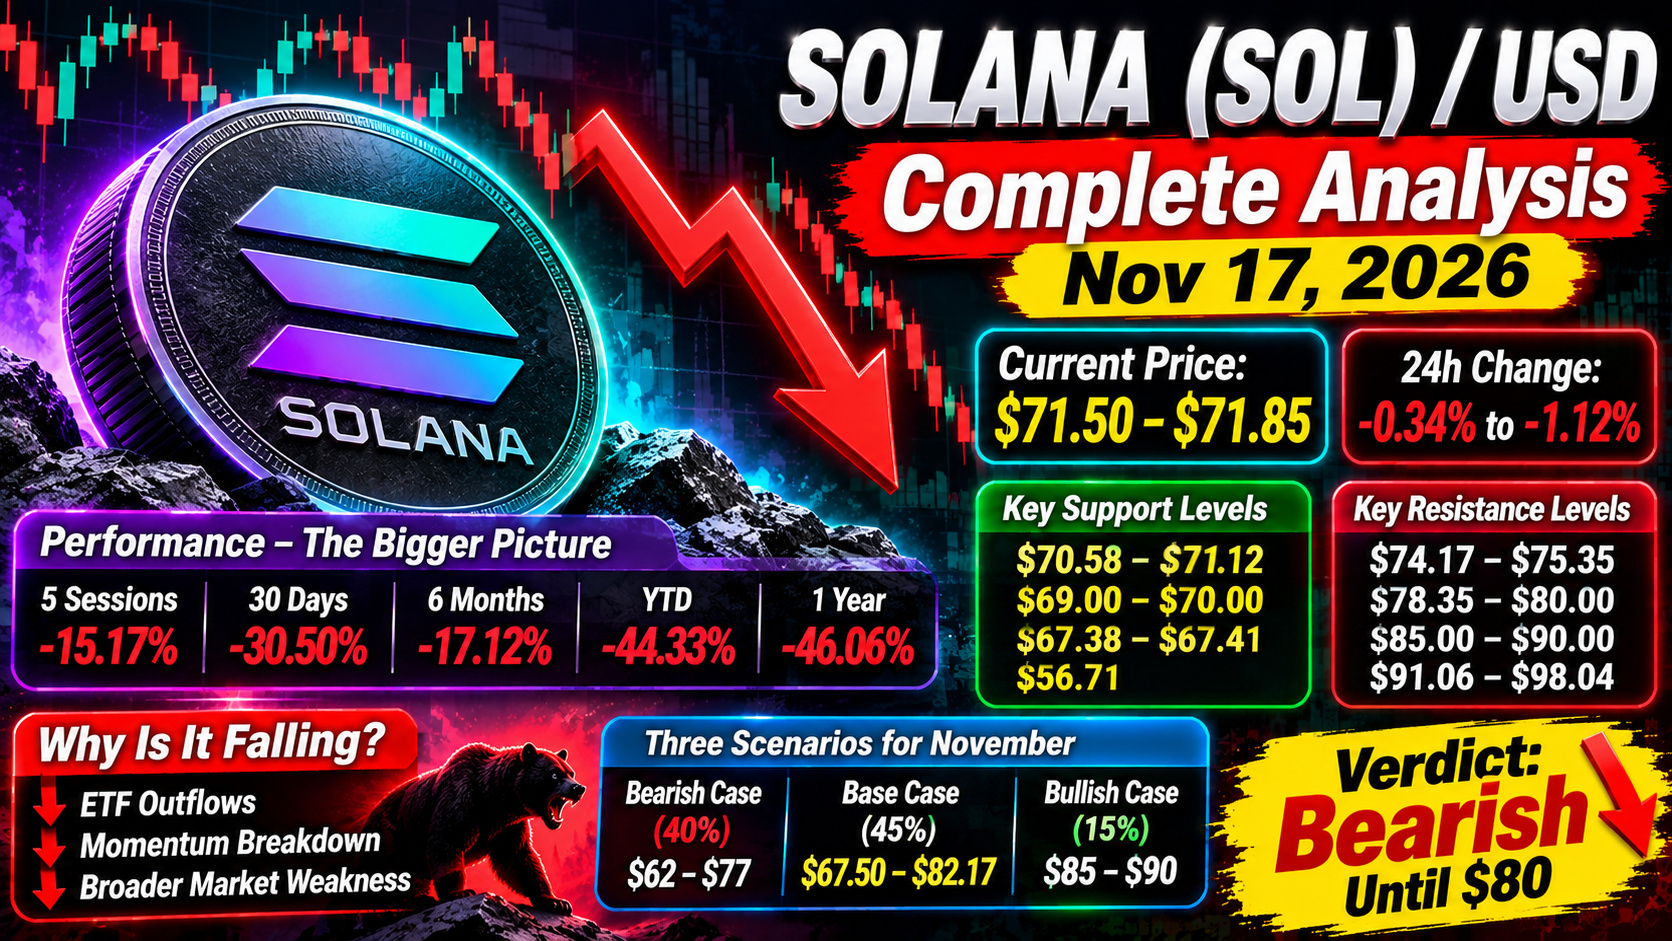
Current Price: ~ $71.50 - $71.85
24h Change: -0.34% to -1.12% (slightly down, consolidating)
24h Range: $69.93 - $72.92
Previous Close: $71.21
Open Today: $71.22

$SOL is currently fighting to hold above the psychologically important $70 level after a sharp sell-off in the last few weeks.
2. Performance - The Bigger Picture
This is where the story is bearish:
| Period | Return |
| --- | --- |
| 5 Sessions | -15.17% |
| 30 Days | -30.5% |
| 6 Months | -17.12% |
| Year-to-Date | -44.33% |
| 1 Year | -46.06% |
Market Cap: ~ $42.23 Billion
Rank: #7 by market cap
Circulating Supply: ∼591.6M SOL / Total Supply: ∼637.6M SOL
$SOL has lost almost half its value this year, and is down over 30% in just the last month.
3. Technical Analysis
Trend: Strongly Bearish
SOL is trading below ALL major moving averages:
20-day MA: ∼$91.95
50-day MA: ∼$103.98
200-day MA: ∼$88.98 - $98.04
Price at $71 is far below all of them. This means every recent buyer is underwater, creating heavy overhead selling pressure.
Key Levels to Watch:
Support (Floor):
S1 - Immediate: $70.58 - $71.12 - This is the battle right now. Holding here is critical.
S2 - Strong: $69.00 - $70.00 - Last defense before breakdown
S3 - Breakdown: $67.38 - $67.41 - 30-day low. If this breaks, next stop is $65, then $62
S4 - Bear Target: $56.71 (if $67 fails)
Resistance (Ceiling):
R1 - Immediate: $74.17 - $75.35 - First hurdle for any bounce
R2 - Key: $78.35 - $80.00 - Old breakdown zone. This was support, now resistance.
R3 - Major: $85.00 - $90.00 - Needs to reclaim this to change trend
R4 - Trend Reversal: $91.06 - $98.04 - Old trendline + 200-day EMA. Only a daily close above $98-$103 confirms a real reversal.
30-Day Range: $67.38 (Low) to $109.22 (High)
4. Why Is It Falling? - Fundamental Drivers
1. ETF Outflows: US spot Solana ETFs saw $58.3M in net outflows over 7 sessions ending Nov 13, led by Fidelity redemptions. Institutional demand is drying up.
2. Momentum Breakdown: SOL broke below a long-term rising trendline and hit a 4-month low. That triggered technical selling.
3. Broader Market Weakness: The whole crypto market has been weak in October-November, and SOL, being a high-beta altcoin, falls harder than Bitcoin.
5. Three Scenarios for November
1. Bearish Case (Most Likely if $70 Breaks) - 40% Probability
Break below $69 -> fall to $67 -> $65 -> $62. November range: $62 - $77
2. Base / Consolidation Case (Most Likely if $70 Holds) - 45% Probability
Chop between $67.50 - $82.17 for the next 5 days. Slow grind back toward $75-$78, but no real rally yet.
3. Bullish Reversal Case - 15% Probability
Daily close above $78.40 -> rally to $85 - $90. Needs ETF inflows to return + Bitcoin stabilizing. Only a close above $103 confirms a full trend reversal.
6. Verdict
Short-term: Bearish / Oversold Bounce Zone
Medium-term: Bearish until $80 is reclaimed
Long-term: Still a top-tier network (#7), but price is in a deep correction
For Traders: Don't chase. $70 is make-or-break. A bounce from $70 to $75 is possible, but $78-$80 is where sellers will likely step in again.
For Holders: The $67 level is your line in the sand. Holding above it keeps the structure alive. Losing it opens a much deeper correction.
This is not financial advice. Crypto is highly volatile - never invest more than you can afford to lose.
Want me to do a deeper dive on:
SOL vs Bitcoin / Ethereum comparison?
Best entry / DCA zones for long-term holding?
SOL ETF flows update?
#solana #SOLUSDT #solanAnalysis #SOLUpdate #TrendingPredictions