
#trendingpredictions
trendingpredictions
Просмотров: 7.2M
7,900 обсуждают
Популярные
Новые

Статья
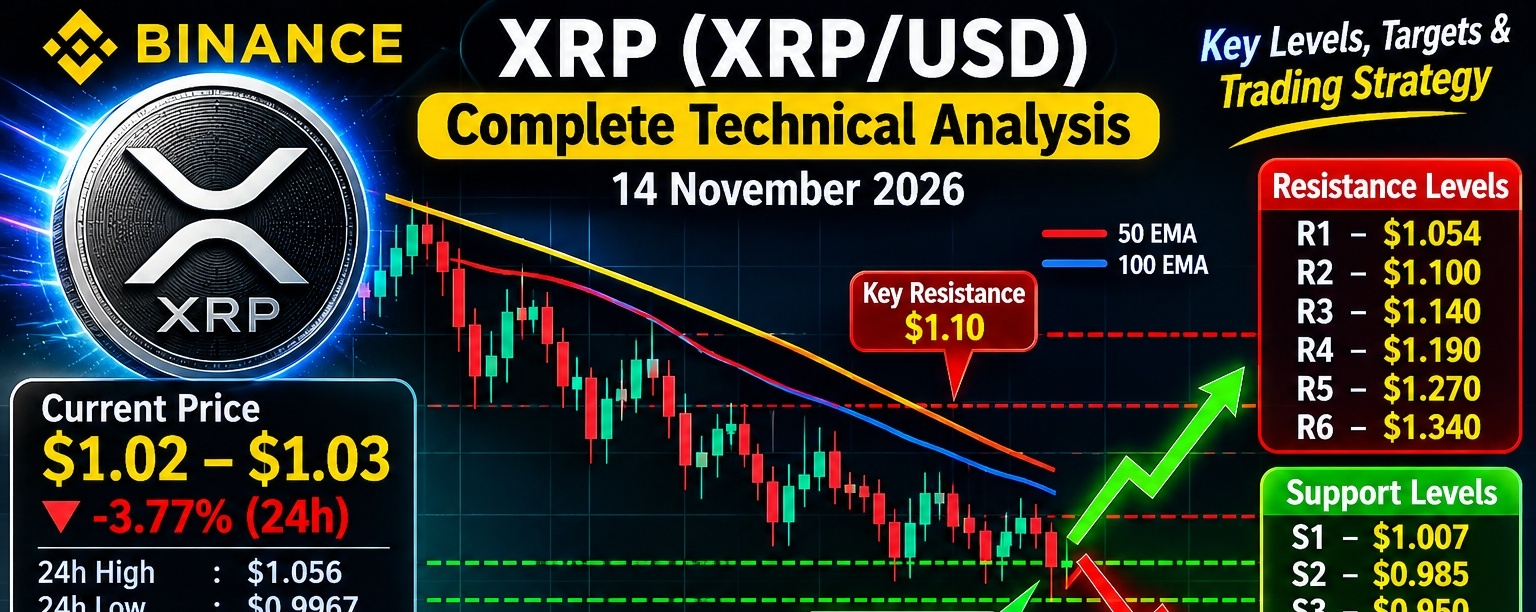
XRP/USD – Complete Technical & Fundamental Analysis 14 November 2026$XRP /USD – Complete Technical & Fundamental Analysis 14 November 2026
Market analysis
XRP is one of the major cryptocurrencies traded on Binance. Its price is influenced by Bitcoin's direction, Ripple ecosystem developments, institutional demand, market liquidity and regulatory developments.
I'll cover technical indicators, support and resistance, bullish and bearish scenarios, and possible trading setups.
{spot}(XRPUSDT)
### 1\. Current $XRP market situation
Strong bearish short-term trend
Latest reported market price · November 13–14
### $1.02–$1.03
Significant selling pressure
Recent 24h low
$0.9967
Recent 24h high
$1.056
Daily RSI
Around 21–22
MACD
Bearish
Reference data from November 13 reports; not a live Binance quote. CoinCentral +2
Market interpretation:
* XRP has fallen below the important $1.10 level.
* Sellers are controlling the short-term trend.
* RSI is deeply oversold.
* A temporary recovery is possible.
* A sustained bullish reversal is not confirmed.
| Indicator | Reading | Signal |
| ----------- | ------------------ | ---------- |
| Daily RSI | 21–22 | Oversold |
| 4-hour RSI | Around 35 | Weak |
| MACD | Negative | Bearish |
| 50-day EMA | $1.26–$1.27 | Resistance |
| 100-day EMA | $1.29 | Resistance |
| 200-day EMA | $1.34 | Resistance |
| SuperTrend | Around $1.19–$1.21 | Bearish |
The price is below important moving averages. This indicates that the overall short-term trend remains bearish. FXStreet +1
### 3\. Important XRP support levels
| Support | Price (USD) | Importance |
| ------- | ----------- | ---------------------- |
| S1 | $1.007 | Immediate support |
| S2 | $0.985 | Major support |
| S3 | $0.950 | Secondary support |
| S4 | $0.900 | Psychological support |
| S5 | $0.800 | Deeper downside target |
My interpretation:
* Holding $1.00 could produce a recovery.
* Breaking $0.985 on a daily closing basis would weaken the market further.
* If $0.90 breaks, $0.80 becomes an important downside level.
CoinCentral +2
### 4\. Important $XRP resistance levels
| Resistance | Price (USD) | Importance |
| ---------- | ------------- | ------------------------ |
| R1 | $1.054 | First resistance |
| R2 | $1.100 | Psychological resistance |
| R3 | $1.140 | Recovery target |
| R4 | $1.190–$1.210 | Major resistance |
| R5 | $1.260–$1.270 | EMA resistance |
| R6 | $1.340 | Stronger resistance |
Bullish confirmation: XRP needs to reclaim $1.10 and then $1.19–$1.21. A move above $1.27 would provide stronger evidence of a trend reversal. FXStreet +2
Ripple payment ecosystem
XRP is designed to support fast digital asset transfers and liquidity in cross-border payment use cases. Real-world adoption remains an important long-term factor.
ETF investment flows
XRP spot ETFs reportedly experienced approximately $18 million in net outflows over two sessions. This indicates weaker recent institutional demand. CoinCentral +1
XRP Ledger activity
The network recorded approximately 4.28 million transactions in 24 hours in the November 13 report. DEX activity also increased during the reported week. CoinCentral
Regulatory developments
Regulatory clarity and institutional access can influence XRP's longer-term adoption, but uncertainty remains a market risk.
### 6\. Three possible XRP price scenarios
Bullish scenario
Recovery
### $1.10 → $1.14 → $1.21
Conditions:
* XRP holds $1.00.
* Buyers reclaim $1.056.
* Daily candle closes above $1.10.
* Trading volume increases.
Bearish scenario
Downside risk
### $0.985 → $0.90 → $0.80
Conditions:
* XRP breaks below $1.00.
* Daily candle closes below $0.985.
* Bitcoin continues declining.
Sideways scenario
Consolidation
### $1.00–$1.10
Buyers and sellers compete while the market searches for direction.
These are possible scenarios, not guaranteed predictions.
### 7\. Binance XRP trading strategy
| Strategy | Entry confirmation | Target |
| --------------- | ----------------------------- | ------------ |
| Support bounce | Bullish reversal around $1.00 | $1.054–$1.10 |
| Breakout long | Daily close above $1.10 | $1.14–$1.21 |
| Breakdown short | Confirmed break below $0.985 | $0.90 |
| Conservative | Wait for $1.21 reclaim | $1.27–$1.34 |
Risk management:
* Avoid high leverage.
* Use stop-loss protection.
* Do not assume oversold means bottom.
* Confirm breakouts with trading volume.
* Keep position sizes small during extreme volatility.
### 8\. Important events to monitor
* Bitcoin BTC/USD price direction.
* XRP ETF inflows and outflows.
* Ripple payment adoption.
* XRP Ledger transaction activity.
* US regulatory developments.
* Binance XRP futures funding rates.
* Large-holder buying and selling.
### 9\. Final XRP/USD prediction
### Short-term outlook: Bearish
Sellers currently control the trend
Immediate support
### $1.00
Major support
### $0.985
First bullish target
### $1.10
Major recovery target
### $1.21–$1.27
Bearish downside target
### $0.90–$0.80
My conclusion: XRP is currently showing a strong bearish structure. However, RSI is deeply oversold, so a relief bounce is possible. I would wait for a confirmed recovery above $1.10 before considering a stronger bullish position.
Disclaimer: This is educational analysis, not financial advice. Prices and technical levels are based on November 13–14 reported data, not a verified live Binance feed.
#Xrp🔥🔥 #XRPAnalysis #TrendingPredictions #XRPRealityCheck
XRP/USD – Complete Technical & Fundamental Analysis 14 November 2026
$XRP /USD – Complete Technical & Fundamental Analysis 14 November 2026
Market analysis
XRP is one of the major cryptocurrencies traded on Binance. Its price is influenced by Bitcoin's direction, Ripple ecosystem developments, institutional demand, market liquidity and regulatory developments.
I'll cover technical indicators, support and resistance, bullish and bearish scenarios, and possible trading setups.
### 1\. Current $XRP market situation
Strong bearish short-term trend
Latest reported market price · November 13–14
### $1.02–$1.03
Significant selling pressure
Recent 24h low
$0.9967
Recent 24h high
$1.056
Daily RSI
Around 21–22
MACD
Bearish
Reference data from November 13 reports; not a live Binance quote. CoinCentral +2
Market interpretation:
* XRP has fallen below the important $1.10 level.
* Sellers are controlling the short-term trend.
* RSI is deeply oversold.
* A temporary recovery is possible.
* A sustained bullish reversal is not confirmed.
| Indicator | Reading | Signal |
| ----------- | ------------------ | ---------- |
| Daily RSI | 21–22 | Oversold |
| 4-hour RSI | Around 35 | Weak |
| MACD | Negative | Bearish |
| 50-day EMA | $1.26–$1.27 | Resistance |
| 100-day EMA | $1.29 | Resistance |
| 200-day EMA | $1.34 | Resistance |
| SuperTrend | Around $1.19–$1.21 | Bearish |
The price is below important moving averages. This indicates that the overall short-term trend remains bearish. FXStreet +1
### 3\. Important XRP support levels
| Support | Price (USD) | Importance |
| ------- | ----------- | ---------------------- |
| S1 | $1.007 | Immediate support |
| S2 | $0.985 | Major support |
| S3 | $0.950 | Secondary support |
| S4 | $0.900 | Psychological support |
| S5 | $0.800 | Deeper downside target |
My interpretation:
* Holding $1.00 could produce a recovery.
* Breaking $0.985 on a daily closing basis would weaken the market further.
* If $0.90 breaks, $0.80 becomes an important downside level.
CoinCentral +2
### 4\. Important $XRP resistance levels
| Resistance | Price (USD) | Importance |
| ---------- | ------------- | ------------------------ |
| R1 | $1.054 | First resistance |
| R2 | $1.100 | Psychological resistance |
| R3 | $1.140 | Recovery target |
| R4 | $1.190–$1.210 | Major resistance |
| R5 | $1.260–$1.270 | EMA resistance |
| R6 | $1.340 | Stronger resistance |
Bullish confirmation: XRP needs to reclaim $1.10 and then $1.19–$1.21. A move above $1.27 would provide stronger evidence of a trend reversal. FXStreet +2
Ripple payment ecosystem
XRP is designed to support fast digital asset transfers and liquidity in cross-border payment use cases. Real-world adoption remains an important long-term factor.
ETF investment flows
XRP spot ETFs reportedly experienced approximately $18 million in net outflows over two sessions. This indicates weaker recent institutional demand. CoinCentral +1
XRP Ledger activity
The network recorded approximately 4.28 million transactions in 24 hours in the November 13 report. DEX activity also increased during the reported week. CoinCentral
Regulatory developments
Regulatory clarity and institutional access can influence XRP's longer-term adoption, but uncertainty remains a market risk.
### 6\. Three possible XRP price scenarios
Bullish scenario
Recovery
### $1.10 → $1.14 → $1.21
Conditions:
* XRP holds $1.00.
* Buyers reclaim $1.056.
* Daily candle closes above $1.10.
* Trading volume increases.
Bearish scenario
Downside risk
### $0.985 → $0.90 → $0.80
Conditions:
* XRP breaks below $1.00.
* Daily candle closes below $0.985.
* Bitcoin continues declining.
Sideways scenario
Consolidation
### $1.00–$1.10
Buyers and sellers compete while the market searches for direction.
These are possible scenarios, not guaranteed predictions.
### 7\. Binance XRP trading strategy
| Strategy | Entry confirmation | Target |
| --------------- | ----------------------------- | ------------ |
| Support bounce | Bullish reversal around $1.00 | $1.054–$1.10 |
| Breakout long | Daily close above $1.10 | $1.14–$1.21 |
| Breakdown short | Confirmed break below $0.985 | $0.90 |
| Conservative | Wait for $1.21 reclaim | $1.27–$1.34 |
Risk management:
* Avoid high leverage.
* Use stop-loss protection.
* Do not assume oversold means bottom.
* Confirm breakouts with trading volume.
* Keep position sizes small during extreme volatility.
### 8\. Important events to monitor
* Bitcoin BTC/USD price direction.
* XRP ETF inflows and outflows.
* Ripple payment adoption.
* XRP Ledger transaction activity.
* US regulatory developments.
* Binance XRP futures funding rates.
* Large-holder buying and selling.
### 9\. Final XRP/USD prediction
### Short-term outlook: Bearish
Sellers currently control the trend
Immediate support
### $1.00
Major support
### $0.985
First bullish target
### $1.10
Major recovery target
### $1.21–$1.27
Bearish downside target
### $0.90–$0.80
My conclusion: XRP is currently showing a strong bearish structure. However, RSI is deeply oversold, so a relief bounce is possible. I would wait for a confirmed recovery above $1.10 before considering a stronger bullish position.
Disclaimer: This is educational analysis, not financial advice. Prices and technical levels are based on November 13–14 reported data, not a verified live Binance feed.
#Xrp🔥🔥 #XRPAnalysis #TrendingPredictions #XRPRealityCheck
Market analysis
XRP is one of the major cryptocurrencies traded on Binance. Its price is influenced by Bitcoin's direction, Ripple ecosystem developments, institutional demand, market liquidity and regulatory developments.
I'll cover technical indicators, support and resistance, bullish and bearish scenarios, and possible trading setups.
### 1\. Current $XRP market situation
Strong bearish short-term trend
Latest reported market price · November 13–14
### $1.02–$1.03
Significant selling pressure
Recent 24h low
$0.9967
Recent 24h high
$1.056
Daily RSI
Around 21–22
MACD
Bearish
Reference data from November 13 reports; not a live Binance quote. CoinCentral +2
Market interpretation:
* XRP has fallen below the important $1.10 level.
* Sellers are controlling the short-term trend.
* RSI is deeply oversold.
* A temporary recovery is possible.
* A sustained bullish reversal is not confirmed.
| Indicator | Reading | Signal |
| ----------- | ------------------ | ---------- |
| Daily RSI | 21–22 | Oversold |
| 4-hour RSI | Around 35 | Weak |
| MACD | Negative | Bearish |
| 50-day EMA | $1.26–$1.27 | Resistance |
| 100-day EMA | $1.29 | Resistance |
| 200-day EMA | $1.34 | Resistance |
| SuperTrend | Around $1.19–$1.21 | Bearish |
The price is below important moving averages. This indicates that the overall short-term trend remains bearish. FXStreet +1
### 3\. Important XRP support levels
| Support | Price (USD) | Importance |
| ------- | ----------- | ---------------------- |
| S1 | $1.007 | Immediate support |
| S2 | $0.985 | Major support |
| S3 | $0.950 | Secondary support |
| S4 | $0.900 | Psychological support |
| S5 | $0.800 | Deeper downside target |
My interpretation:
* Holding $1.00 could produce a recovery.
* Breaking $0.985 on a daily closing basis would weaken the market further.
* If $0.90 breaks, $0.80 becomes an important downside level.
CoinCentral +2
### 4\. Important $XRP resistance levels
| Resistance | Price (USD) | Importance |
| ---------- | ------------- | ------------------------ |
| R1 | $1.054 | First resistance |
| R2 | $1.100 | Psychological resistance |
| R3 | $1.140 | Recovery target |
| R4 | $1.190–$1.210 | Major resistance |
| R5 | $1.260–$1.270 | EMA resistance |
| R6 | $1.340 | Stronger resistance |
Bullish confirmation: XRP needs to reclaim $1.10 and then $1.19–$1.21. A move above $1.27 would provide stronger evidence of a trend reversal. FXStreet +2
Ripple payment ecosystem
XRP is designed to support fast digital asset transfers and liquidity in cross-border payment use cases. Real-world adoption remains an important long-term factor.
ETF investment flows
XRP spot ETFs reportedly experienced approximately $18 million in net outflows over two sessions. This indicates weaker recent institutional demand. CoinCentral +1
XRP Ledger activity
The network recorded approximately 4.28 million transactions in 24 hours in the November 13 report. DEX activity also increased during the reported week. CoinCentral
Regulatory developments
Regulatory clarity and institutional access can influence XRP's longer-term adoption, but uncertainty remains a market risk.
### 6\. Three possible XRP price scenarios
Bullish scenario
Recovery
### $1.10 → $1.14 → $1.21
Conditions:
* XRP holds $1.00.
* Buyers reclaim $1.056.
* Daily candle closes above $1.10.
* Trading volume increases.
Bearish scenario
Downside risk
### $0.985 → $0.90 → $0.80
Conditions:
* XRP breaks below $1.00.
* Daily candle closes below $0.985.
* Bitcoin continues declining.
Sideways scenario
Consolidation
### $1.00–$1.10
Buyers and sellers compete while the market searches for direction.
These are possible scenarios, not guaranteed predictions.
### 7\. Binance XRP trading strategy
| Strategy | Entry confirmation | Target |
| --------------- | ----------------------------- | ------------ |
| Support bounce | Bullish reversal around $1.00 | $1.054–$1.10 |
| Breakout long | Daily close above $1.10 | $1.14–$1.21 |
| Breakdown short | Confirmed break below $0.985 | $0.90 |
| Conservative | Wait for $1.21 reclaim | $1.27–$1.34 |
Risk management:
* Avoid high leverage.
* Use stop-loss protection.
* Do not assume oversold means bottom.
* Confirm breakouts with trading volume.
* Keep position sizes small during extreme volatility.
### 8\. Important events to monitor
* Bitcoin BTC/USD price direction.
* XRP ETF inflows and outflows.
* Ripple payment adoption.
* XRP Ledger transaction activity.
* US regulatory developments.
* Binance XRP futures funding rates.
* Large-holder buying and selling.
### 9\. Final XRP/USD prediction
### Short-term outlook: Bearish
Sellers currently control the trend
Immediate support
### $1.00
Major support
### $0.985
First bullish target
### $1.10
Major recovery target
### $1.21–$1.27
Bearish downside target
### $0.90–$0.80
My conclusion: XRP is currently showing a strong bearish structure. However, RSI is deeply oversold, so a relief bounce is possible. I would wait for a confirmed recovery above $1.10 before considering a stronger bullish position.
Disclaimer: This is educational analysis, not financial advice. Prices and technical levels are based on November 13–14 reported data, not a verified live Binance feed.
#Xrp🔥🔥 #XRPAnalysis #TrendingPredictions #XRPRealityCheck
181

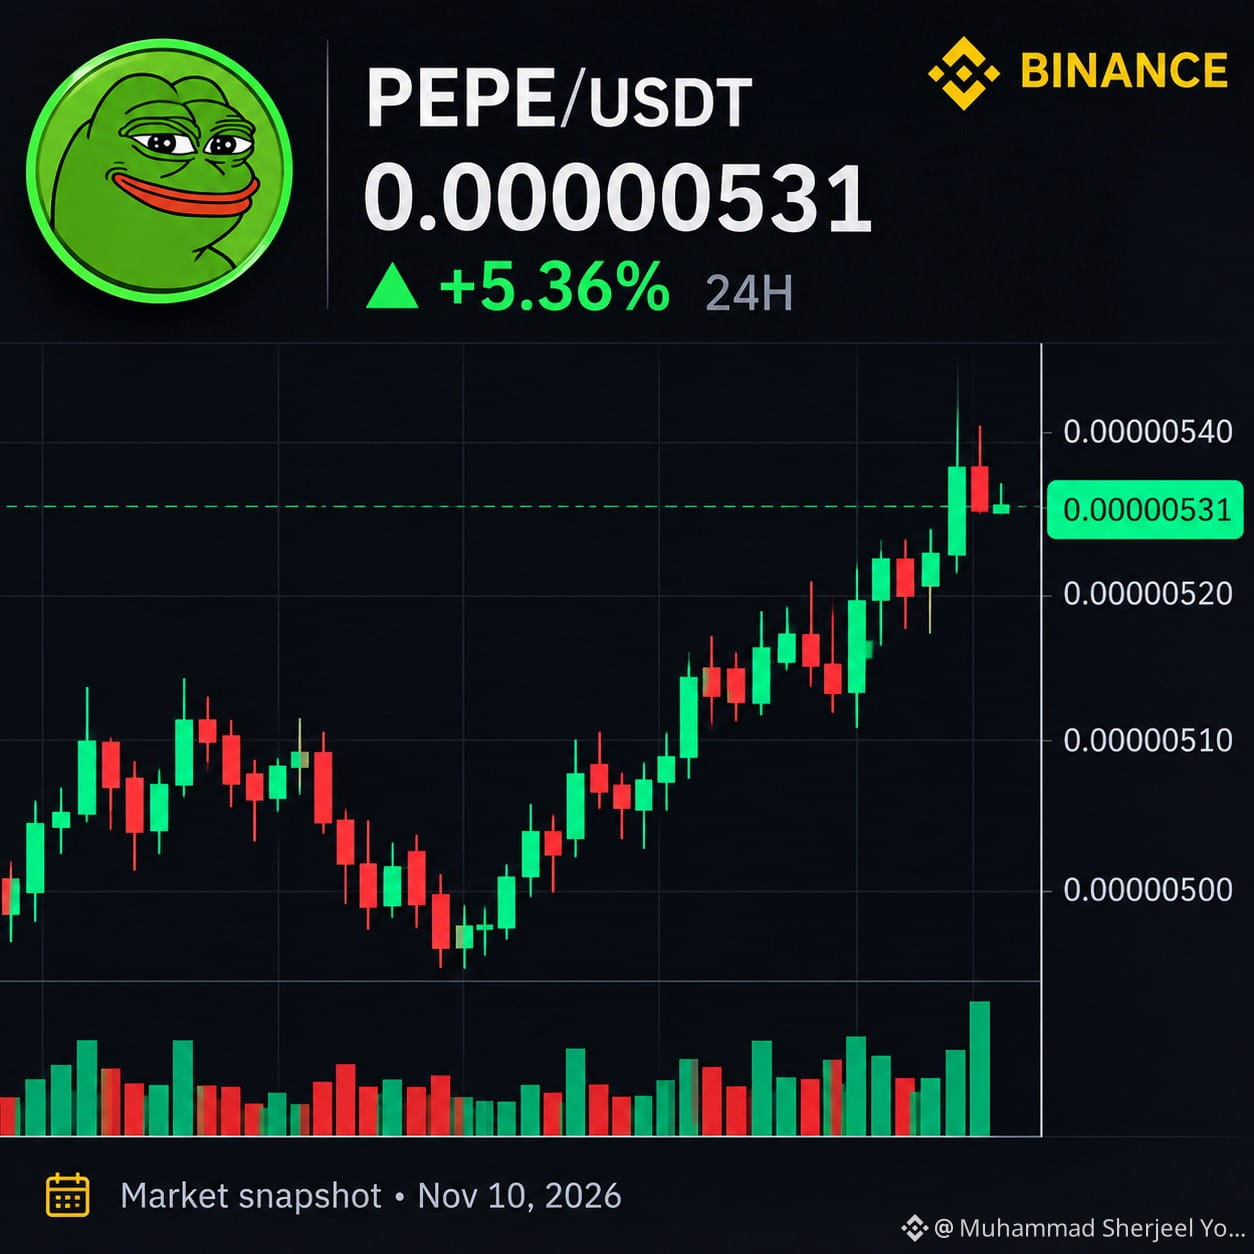
🐸🚀 **$PEPE is looking ready for a big move!**
📈 A strong inverse head and shoulders pattern is forming on the weekly chart.
{spot}(PEPEUSDT)
🔥 If PEPE holds above the neckline, the next bullish wave could bring a powerful rally.
💎 All eyes on the breakout confirmation!
#PEPE #trendingcoin #TrendingPredictions #memecoin🚀🚀🚀 #bullish
🐸🚀 **$PEPE is looking ready for a big move!**
📈 A strong inverse head and shoulders pattern is forming on the weekly chart.
🔥 If PEPE holds above the neckline, the next bullish wave could bring a powerful rally.
💎 All eyes on the breakout confirmation!
#PEPE #trendingcoin #TrendingPredictions #memecoin🚀🚀🚀 #bullish
📈 A strong inverse head and shoulders pattern is forming on the weekly chart.
🔥 If PEPE holds above the neckline, the next bullish wave could bring a powerful rally.
💎 All eyes on the breakout confirmation!
#PEPE #trendingcoin #TrendingPredictions #memecoin🚀🚀🚀 #bullish

56

🟢 Finance Noticias:
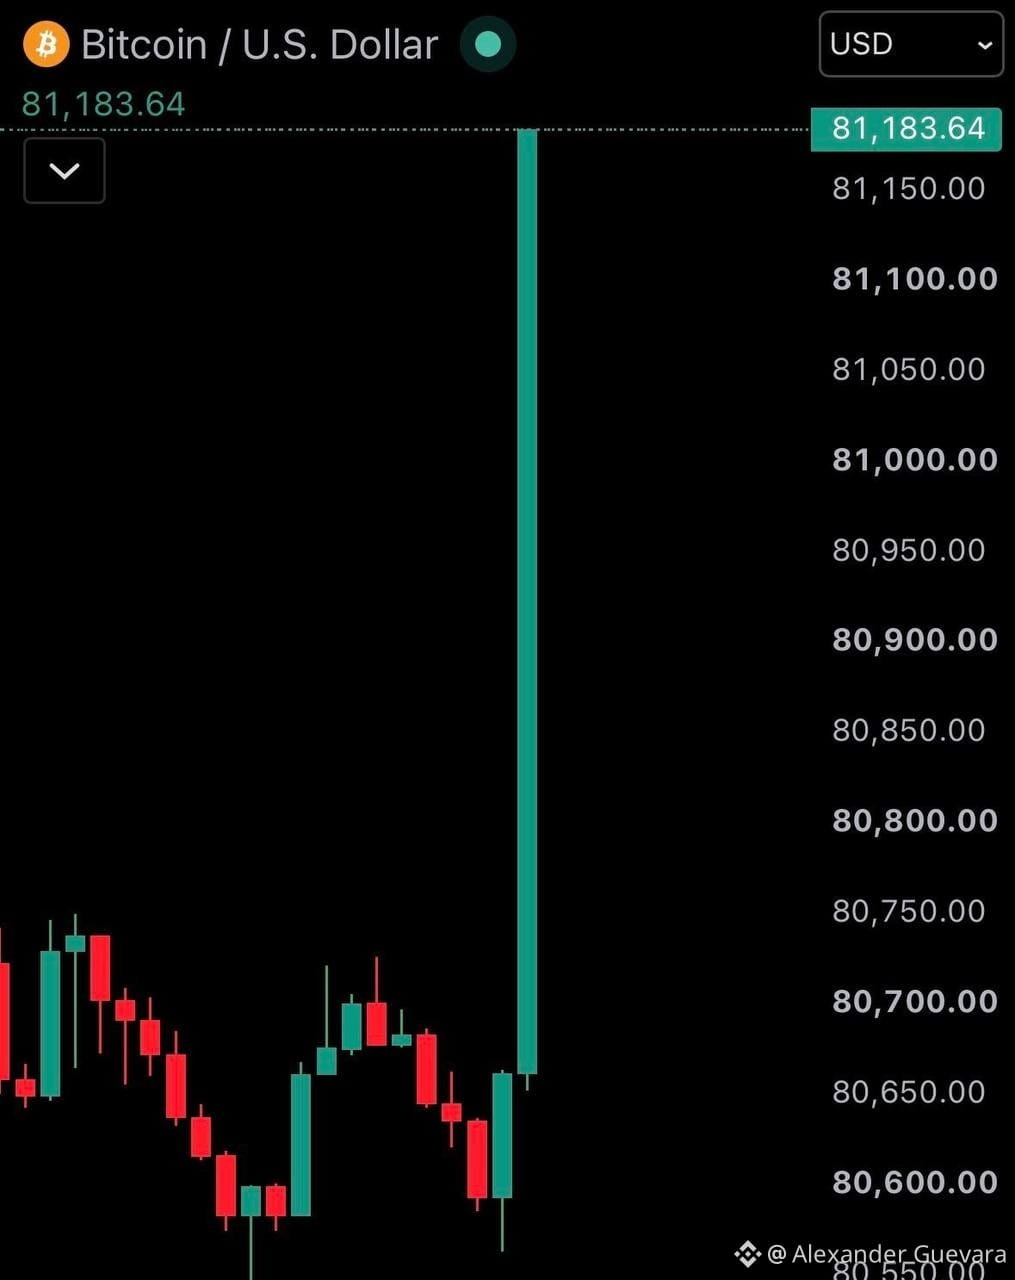
✅ÚLTIMA HORA: Bitcoin recupera los $81,000
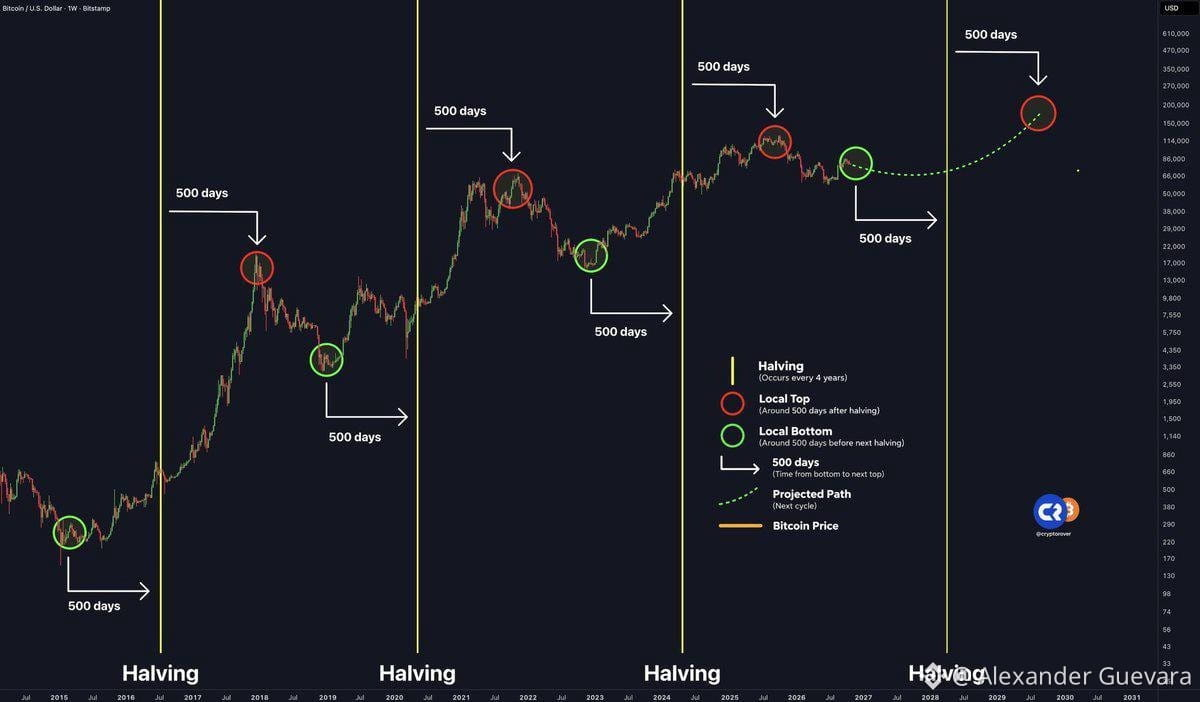
✅Bitcoin lleva tres ciclos siguiendo el mismo calendario, y según ese calendario estamos entrando en la zona de suelo.
Cada cuatro años hay un halving. En los tres últimos ciclos, Bitcoin hizo máximo año y medio después y tocó suelo alrededor de un año más tarde.
El último halving fue en abril de 2024 y el máximo llegó en octubre de 2025, en $126,000. Ya ha pasado un año.
Si el patrón se repite, el próximo máximo llegaría en 2029. Cada ciclo ha subido menos que el anterior, así que este gráfico apunta a unos $200,000, una subida más moderada que las de otros ciclos.
Pero la zona de suelo no es un día concreto. En los ciclos anteriores fueron varios meses con el precio moviéndose de lado.
Por eso nosotros hacemos DCA. Compramos poco a poco y de forma periódica durante esta fase, sin intentar acertar el día exacto, para que la próxima subida nos pille ya dentro.
#TradingCommunity #TrendingPredictions #TradingSignals #BTC #operaciones $BTC
🟢 Finance Noticias:
✅ÚLTIMA HORA: Bitcoin recupera los $81,000
✅Bitcoin lleva tres ciclos siguiendo el mismo calendario, y según ese calendario estamos entrando en la zona de suelo.
Cada cuatro años hay un halving. En los tres últimos ciclos, Bitcoin hizo máximo año y medio después y tocó suelo alrededor de un año más tarde.
El último halving fue en abril de 2024 y el máximo llegó en octubre de 2025, en $126,000. Ya ha pasado un año.
Si el patrón se repite, el próximo máximo llegaría en 2029. Cada ciclo ha subido menos que el anterior, así que este gráfico apunta a unos $200,000, una subida más moderada que las de otros ciclos.
Pero la zona de suelo no es un día concreto. En los ciclos anteriores fueron varios meses con el precio moviéndose de lado.
Por eso nosotros hacemos DCA. Compramos poco a poco y de forma periódica durante esta fase, sin intentar acertar el día exacto, para que la próxima subida nos pille ya dentro.
#TradingCommunity #TrendingPredictions #TradingSignals #BTC #operaciones $BTC
✅ÚLTIMA HORA: Bitcoin recupera los $81,000
✅Bitcoin lleva tres ciclos siguiendo el mismo calendario, y según ese calendario estamos entrando en la zona de suelo.
Cada cuatro años hay un halving. En los tres últimos ciclos, Bitcoin hizo máximo año y medio después y tocó suelo alrededor de un año más tarde.
El último halving fue en abril de 2024 y el máximo llegó en octubre de 2025, en $126,000. Ya ha pasado un año.
Si el patrón se repite, el próximo máximo llegaría en 2029. Cada ciclo ha subido menos que el anterior, así que este gráfico apunta a unos $200,000, una subida más moderada que las de otros ciclos.
Pero la zona de suelo no es un día concreto. En los ciclos anteriores fueron varios meses con el precio moviéndose de lado.
Por eso nosotros hacemos DCA. Compramos poco a poco y de forma periódica durante esta fase, sin intentar acertar el día exacto, para que la próxima subida nos pille ya dentro.
#TradingCommunity #TrendingPredictions #TradingSignals #BTC #operaciones $BTC
1
1k
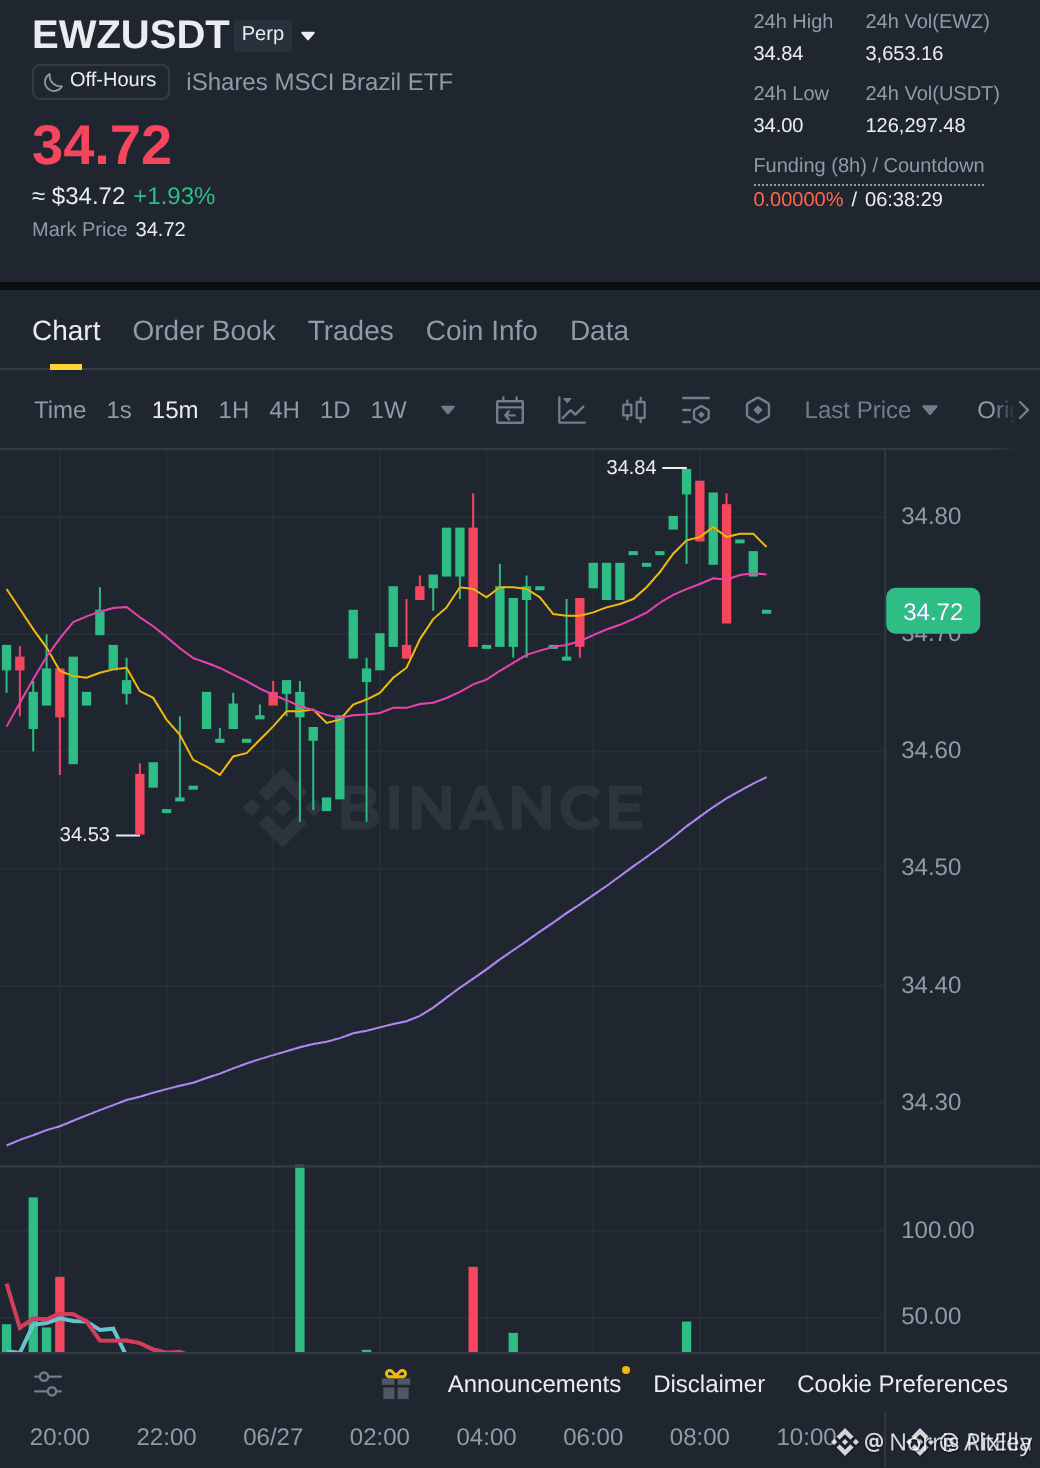
Here's a cleaner and more engaging version with a few lines changed to make it sound more natural and professional:
🚀 New Listing — Now Live: $EWZ
$EWZ is showing signs of strength after bouncing from the EMA20 support, keeping the bullish trend intact. If buyers maintain momentum, the next major level to watch is the EMA50 and beyond.
🔄 Trend: Bullish Reversal | 📈 Buy Bias
💰 Current Price: $34.5985
📊 24h Range: $34.0000 – $34.8400
📦 24h Volume: $126.2K
📐 Technical Snapshot:
• RSI (14): 57.9 — Neutral with room to move higher
• EMA20: $34.6360
• EMA50: $34.4252 ✅ Golden Cross Confirmed
📈 Entry Zone: $34.6158 – $34.8242
🛑 Stop Loss: $33.9133
🎯 Targets:
• Target 1: $36.0277
• Target 2: $37.6077
• Target 3: $39.6002
💡 Price continues to respect this key support zone, suggesting buyers remain in control. A sustained hold above support could open the door for the next leg higher.
⚠️ Always manage your risk and do your own research before trading.#EWZ #TrendingPredictions
{future}(EWZUSDT)
Here's a cleaner and more engaging version with a few lines changed to make it sound more natural and professional:
🚀 New Listing — Now Live: $EWZ
$EWZ is showing signs of strength after bouncing from the EMA20 support, keeping the bullish trend intact. If buyers maintain momentum, the next major level to watch is the EMA50 and beyond.
🔄 Trend: Bullish Reversal | 📈 Buy Bias
💰 Current Price: $34.5985
📊 24h Range: $34.0000 – $34.8400
📦 24h Volume: $126.2K
📐 Technical Snapshot:
• RSI (14): 57.9 — Neutral with room to move higher
• EMA20: $34.6360
• EMA50: $34.4252 ✅ Golden Cross Confirmed
📈 Entry Zone: $34.6158 – $34.8242
🛑 Stop Loss: $33.9133
🎯 Targets:
• Target 1: $36.0277
• Target 2: $37.6077
• Target 3: $39.6002
💡 Price continues to respect this key support zone, suggesting buyers remain in control. A sustained hold above support could open the door for the next leg higher.
⚠️ Always manage your risk and do your own research before trading.#EWZ #TrendingPredictions
🚀 New Listing — Now Live: $EWZ
$EWZ is showing signs of strength after bouncing from the EMA20 support, keeping the bullish trend intact. If buyers maintain momentum, the next major level to watch is the EMA50 and beyond.
🔄 Trend: Bullish Reversal | 📈 Buy Bias
💰 Current Price: $34.5985
📊 24h Range: $34.0000 – $34.8400
📦 24h Volume: $126.2K
📐 Technical Snapshot:
• RSI (14): 57.9 — Neutral with room to move higher
• EMA20: $34.6360
• EMA50: $34.4252 ✅ Golden Cross Confirmed
📈 Entry Zone: $34.6158 – $34.8242
🛑 Stop Loss: $33.9133
🎯 Targets:
• Target 1: $36.0277
• Target 2: $37.6077
• Target 3: $39.6002
💡 Price continues to respect this key support zone, suggesting buyers remain in control. A sustained hold above support could open the door for the next leg higher.
⚠️ Always manage your risk and do your own research before trading.#EWZ #TrendingPredictions
EWZETF+0,93%
160

·
--
Рост
Сомнительно
BIG WHALE BUYS ARE HERE! BTC WILL FLY, BUY NOW! 🚀🐳
Bitcoin $83.960.
While retail investors are waiting in hesitation, big institutions and spot funds continue to accumulate quietly at current levels. Here are the updated technical targets for short-term traders:
🎯 TP 1: $84,200
🎯 TP 2: $84,300
🎯 TP 3: $84,600
#writetoearn #Write2Earn #TrendingPredictions #binance2026 #BinanceSquareFamily $BTC
{future}(BTCUSDT)
BIG WHALE BUYS ARE HERE! BTC WILL FLY, BUY NOW! 🚀🐳
Bitcoin $83.960.
While retail investors are waiting in hesitation, big institutions and spot funds continue to accumulate quietly at current levels. Here are the updated technical targets for short-term traders:
🎯 TP 1: $84,200
🎯 TP 2: $84,300
🎯 TP 3: $84,600
#writetoearn #Write2Earn #TrendingPredictions #binance2026 #BinanceSquareFamily $BTC
Bitcoin $83.960.
While retail investors are waiting in hesitation, big institutions and spot funds continue to accumulate quietly at current levels. Here are the updated technical targets for short-term traders:
🎯 TP 1: $84,200
🎯 TP 2: $84,300
🎯 TP 3: $84,600
#writetoearn #Write2Earn #TrendingPredictions #binance2026 #BinanceSquareFamily $BTC

1
179

·
--
$RIF
{future}(RIFUSDT)
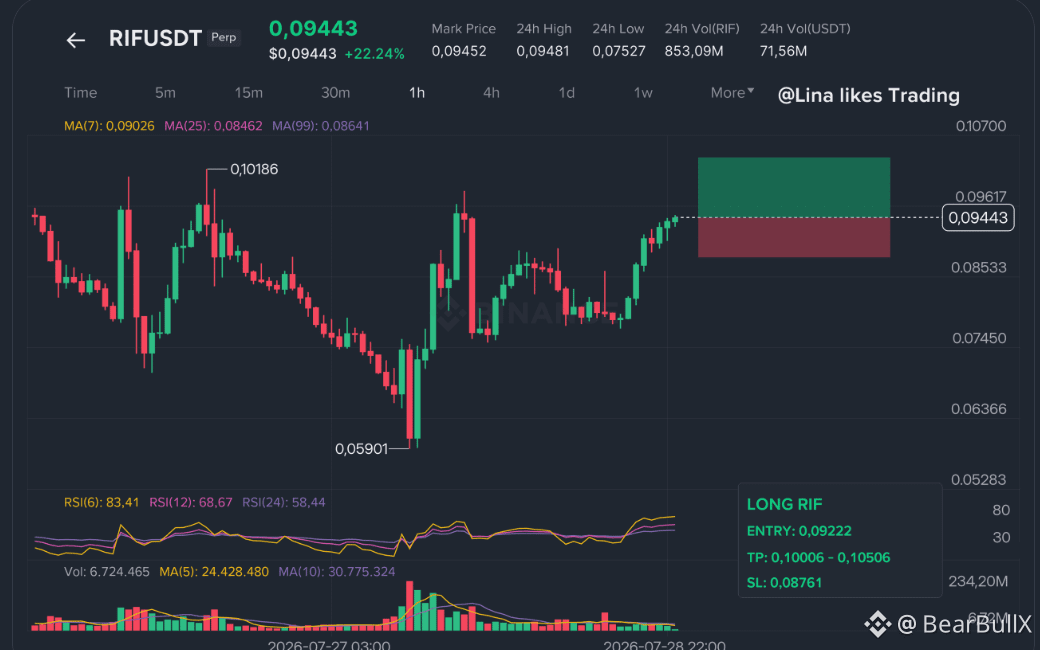
IS RIPPING — BUT RETAIL CAN GET LIQUIDATED FAST.
Miss the breakout confirmation, and chasing gets dangerous.
🚨 Momentum is turning parabolic.
📈 Taking the long side on $RIF.
🔥 Entry: 0.09222 – 0.09458
🎯 Take Profit 1: 0.10006
🎯 Take Profit 2: 0.10539
🛑 Stop Loss: 0.08761
⚠️ Don't ignore the 1h RSI.
RSI is heavily overextended right now.
A liquidity grab could happen first.
Then continuation could send $RIF higher.
🚀 Watch the 24h high breakout.
That's the confirmation I want.
Never go all-in, fam.
Use a position size fitting your account.
👀 Keeping both charts open:
$ON
$SKHYNIX
{future}(SKHYNIXUSDT)
Looking for the push. 👇👇👇
Would you chase the breakout or wait?#write2earn🌐💹 #TrendingPredictions #Alticoins
$RIF
IS RIPPING — BUT RETAIL CAN GET LIQUIDATED FAST.
Miss the breakout confirmation, and chasing gets dangerous.
🚨 Momentum is turning parabolic.
📈 Taking the long side on $RIF .
🔥 Entry: 0.09222 – 0.09458
🎯 Take Profit 1: 0.10006
🎯 Take Profit 2: 0.10539
🛑 Stop Loss: 0.08761
⚠️ Don't ignore the 1h RSI.
RSI is heavily overextended right now.
A liquidity grab could happen first.
Then continuation could send $RIF higher.
🚀 Watch the 24h high breakout.
That's the confirmation I want.
Never go all-in, fam.
Use a position size fitting your account.
👀 Keeping both charts open:
$ON
$SKHYNIX
Looking for the push. 👇👇👇
Would you chase the breakout or wait?#write2earn🌐💹 #TrendingPredictions #Alticoins
IS RIPPING — BUT RETAIL CAN GET LIQUIDATED FAST.
Miss the breakout confirmation, and chasing gets dangerous.
🚨 Momentum is turning parabolic.
📈 Taking the long side on $RIF .
🔥 Entry: 0.09222 – 0.09458
🎯 Take Profit 1: 0.10006
🎯 Take Profit 2: 0.10539
🛑 Stop Loss: 0.08761
⚠️ Don't ignore the 1h RSI.
RSI is heavily overextended right now.
A liquidity grab could happen first.
Then continuation could send $RIF higher.
🚀 Watch the 24h high breakout.
That's the confirmation I want.
Never go all-in, fam.
Use a position size fitting your account.
👀 Keeping both charts open:
$ON
$SKHYNIX
Looking for the push. 👇👇👇
Would you chase the breakout or wait?#write2earn🌐💹 #TrendingPredictions #Alticoins
1
333

·
--

Статья
BUSDT Coin next 7 days forecast$B
{future}(BUSDT)
BUSDT Coin Price Prediction: Next 7 Days Outlook (Educational Analysis)
BUSDT is a high-risk crypto trading pair, so its price can change quickly depending on market sentiment, Bitcoin's trend, trading volume, and major crypto news. No one can accurately predict future prices, but the following is a possible scenario, not a guarantee.
7-Day Forecast
DayExpected TrendOutlookDay 1🟢 Slight BullishBuyers may push the price higher.Day 2🟢 BullishPositive momentum could continue if volume increases.Day 3🟡 SidewaysConsolidation is possible after gains.Day 4🟢 Mild BullishA breakout could occur if resistance is cleared.Day 5🔴 Minor PullbackShort-term profit-taking may cause a dip.Day 6🟢 RecoveryBuyers could return after the correction.Day 7🟢 Neutral to BullishThe trend may remain positive if the overall market stays strong.
Key Factors to Watch
Bitcoin (BTC) price movementOverall crypto market sentimentTrading volume on BinanceProject-related announcementsSupport and resistance levels
Trading Outlook
Short-term Bias: Moderately BullishRisk Level: HighVolatility: Medium to High
Conclusion:
BUSDT may experience moderate upward momentum over the next seven days if the broader cryptocurrency market remains positive. However, traders should be prepared for volatility and use proper risk management, including stop-loss orders. This forecast is for educational purposes only and should not be considered financial advice.
#TrendingTopic #TrendingPredictions #TradingCommunity
BUSDT Coin next 7 days forecast
$B
BUSDT Coin Price Prediction: Next 7 Days Outlook (Educational Analysis)
BUSDT is a high-risk crypto trading pair, so its price can change quickly depending on market sentiment, Bitcoin's trend, trading volume, and major crypto news. No one can accurately predict future prices, but the following is a possible scenario, not a guarantee.
7-Day Forecast
DayExpected TrendOutlookDay 1🟢 Slight BullishBuyers may push the price higher.Day 2🟢 BullishPositive momentum could continue if volume increases.Day 3🟡 SidewaysConsolidation is possible after gains.Day 4🟢 Mild BullishA breakout could occur if resistance is cleared.Day 5🔴 Minor PullbackShort-term profit-taking may cause a dip.Day 6🟢 RecoveryBuyers could return after the correction.Day 7🟢 Neutral to BullishThe trend may remain positive if the overall market stays strong.
Key Factors to Watch
Bitcoin (BTC) price movementOverall crypto market sentimentTrading volume on BinanceProject-related announcementsSupport and resistance levels
Trading Outlook
Short-term Bias: Moderately BullishRisk Level: HighVolatility: Medium to High
Conclusion:
BUSDT may experience moderate upward momentum over the next seven days if the broader cryptocurrency market remains positive. However, traders should be prepared for volatility and use proper risk management, including stop-loss orders. This forecast is for educational purposes only and should not be considered financial advice.
#TrendingTopic #TrendingPredictions #TradingCommunity
BUSDT Coin Price Prediction: Next 7 Days Outlook (Educational Analysis)
BUSDT is a high-risk crypto trading pair, so its price can change quickly depending on market sentiment, Bitcoin's trend, trading volume, and major crypto news. No one can accurately predict future prices, but the following is a possible scenario, not a guarantee.
7-Day Forecast
DayExpected TrendOutlookDay 1🟢 Slight BullishBuyers may push the price higher.Day 2🟢 BullishPositive momentum could continue if volume increases.Day 3🟡 SidewaysConsolidation is possible after gains.Day 4🟢 Mild BullishA breakout could occur if resistance is cleared.Day 5🔴 Minor PullbackShort-term profit-taking may cause a dip.Day 6🟢 RecoveryBuyers could return after the correction.Day 7🟢 Neutral to BullishThe trend may remain positive if the overall market stays strong.
Key Factors to Watch
Bitcoin (BTC) price movementOverall crypto market sentimentTrading volume on BinanceProject-related announcementsSupport and resistance levels
Trading Outlook
Short-term Bias: Moderately BullishRisk Level: HighVolatility: Medium to High
Conclusion:
BUSDT may experience moderate upward momentum over the next seven days if the broader cryptocurrency market remains positive. However, traders should be prepared for volatility and use proper risk management, including stop-loss orders. This forecast is for educational purposes only and should not be considered financial advice.
#TrendingTopic #TrendingPredictions #TradingCommunity
113

·
--
Рост
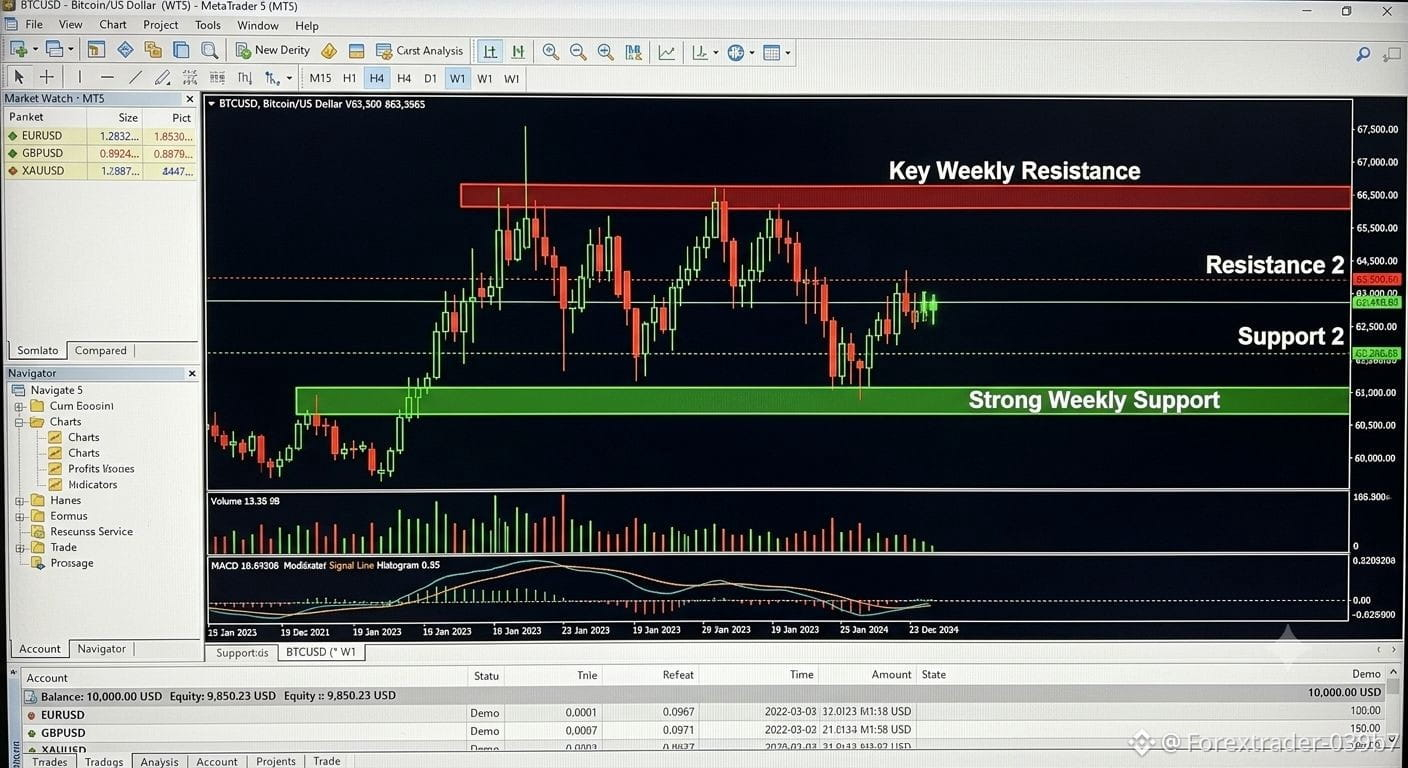
$BTC Weekly Open Update: Make or Break Situation! 🚨
Bitcoin is currently trading around $62,740 right at the weekly opening. The market is showing slight compression, and a big volatile move is heavily loading for both Crypto and Forex traders this week! 📊
💡 Key Levels to Watch:
Bullish Scenario: If BTC breaks and holds above $63,500, we are easily targeting $64,800 - $65,500 very soon.
Bearish Scenario: If it fails to hold this zone and drops below $62,200, expect a quick retest down to the $60,500 liquidity pool.
Manage your risk wisely. Weekly openings are always tricky! ⚔️
What are your thoughts? Are you Bullish 🐂 or Bearish 🐻 for this week? Comment below! 👇$
$DOGE
$BTC
{spot}(BNBUSDT)
{spot}(ETHUSDT)
{spot}(BTCUSDT)
#bitcoin #TrendingPredictions #cryptouniverseofficial #CryptoNewss #cryptotrade
$BTC Weekly Open Update: Make or Break Situation! 🚨
Bitcoin is currently trading around $62,740 right at the weekly opening. The market is showing slight compression, and a big volatile move is heavily loading for both Crypto and Forex traders this week! 📊
💡 Key Levels to Watch:
Bullish Scenario: If BTC breaks and holds above $63,500, we are easily targeting $64,800 - $65,500 very soon.
Bearish Scenario: If it fails to hold this zone and drops below $62,200, expect a quick retest down to the $60,500 liquidity pool.
Manage your risk wisely. Weekly openings are always tricky! ⚔️
What are your thoughts? Are you Bullish 🐂 or Bearish 🐻 for this week? Comment below! 👇$
$DOGE
$BTC
#bitcoin #TrendingPredictions #cryptouniverseofficial #CryptoNewss #cryptotrade
Bitcoin is currently trading around $62,740 right at the weekly opening. The market is showing slight compression, and a big volatile move is heavily loading for both Crypto and Forex traders this week! 📊
💡 Key Levels to Watch:
Bullish Scenario: If BTC breaks and holds above $63,500, we are easily targeting $64,800 - $65,500 very soon.
Bearish Scenario: If it fails to hold this zone and drops below $62,200, expect a quick retest down to the $60,500 liquidity pool.
Manage your risk wisely. Weekly openings are always tricky! ⚔️
What are your thoughts? Are you Bullish 🐂 or Bearish 🐻 for this week? Comment below! 👇$
$DOGE
$BTC
#bitcoin #TrendingPredictions #cryptouniverseofficial #CryptoNewss #cryptotrade
1
178

·
--
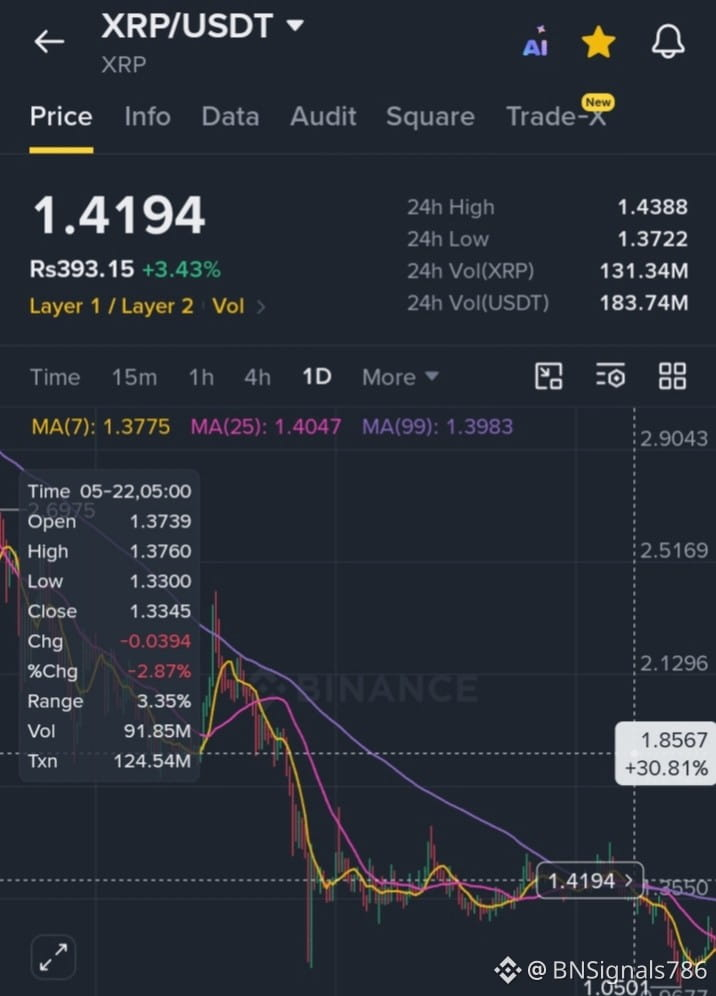
🚨 BINANCE SIGNALS — BULLISH 💚😱🔥
📈 XRP + SOL BULLISH SETUPS
🟢 $XRP
{spot}(XRPUSDT)
/ USDT (Perp)
💰 Current: 1.4194
🎯 BUY ENTRY: 1.40 – 1.45
🚀 TP1: 1.5500
🚀 TP2: 1.8550
🚀 TP3: 2.1296
🚀 TP4: 2.5169
🛑 SL: 1.33
📊 Bullish above 1.40 — reclaiming 1.55 can open the way toward your higher drawn levels.
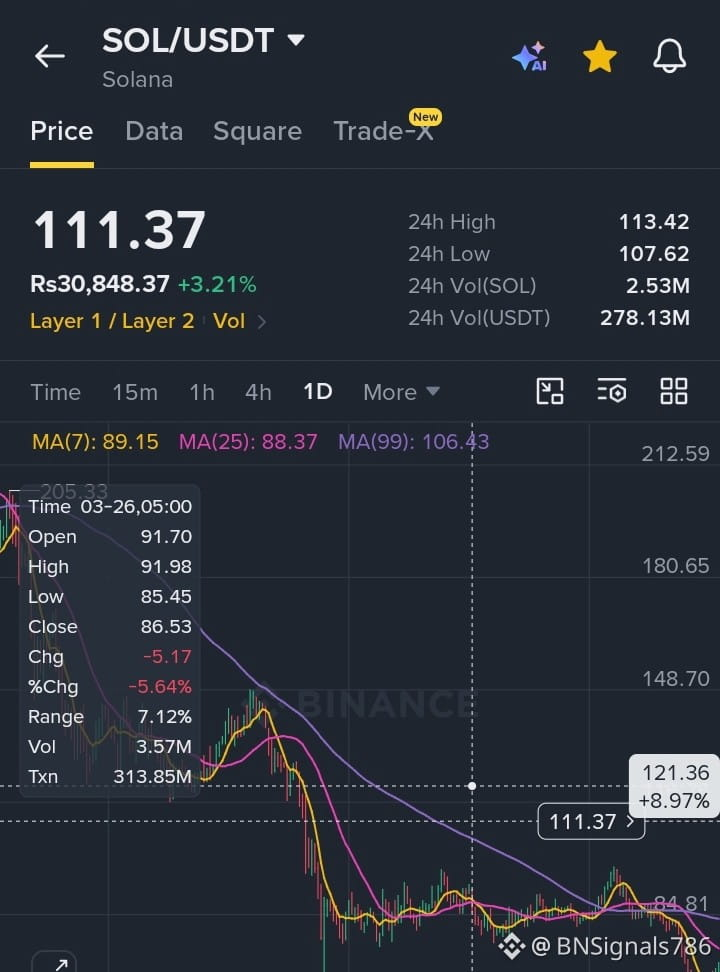
🟢 $SOL
{spot}(SOLUSDT)
/ USDT (Perp)
💰 Current: 111.32
🎯 BUY ENTRY: 108 – 113
🚀 TP1: 120.79
🚀 TP2: 148.70
🚀 TP3: 180.65
🚀 TP4: 205.33
🛑 SL: 103
📊 Bullish above 111–113 — a confirmed break of 120.79 would target your next drawn levels.
🔥 BINANCE SIGNALS BULLISH 💚😱😱🔥
📈 Smart Entries | High Reward Potential
👍 Like | 🔁 Share | ✅ Follow
💚 Market Momentum Building | Smart Entries Ahead
#Binance #BitcoinDunyamiz #HoldOnTight #Hotternds #TrendingPredictions
🚨 BINANCE SIGNALS — BULLISH 💚😱🔥
📈 XRP + SOL BULLISH SETUPS
🟢 $XRP
/ USDT (Perp)
💰 Current: 1.4194
🎯 BUY ENTRY: 1.40 – 1.45
🚀 TP1: 1.5500
🚀 TP2: 1.8550
🚀 TP3: 2.1296
🚀 TP4: 2.5169
🛑 SL: 1.33
📊 Bullish above 1.40 — reclaiming 1.55 can open the way toward your higher drawn levels.
🟢 $SOL
/ USDT (Perp)
💰 Current: 111.32
🎯 BUY ENTRY: 108 – 113
🚀 TP1: 120.79
🚀 TP2: 148.70
🚀 TP3: 180.65
🚀 TP4: 205.33
🛑 SL: 103
📊 Bullish above 111–113 — a confirmed break of 120.79 would target your next drawn levels.
🔥 BINANCE SIGNALS BULLISH 💚😱😱🔥
📈 Smart Entries | High Reward Potential
👍 Like | 🔁 Share | ✅ Follow
💚 Market Momentum Building | Smart Entries Ahead
#Binance #BitcoinDunyamiz #HoldOnTight #Hotternds #TrendingPredictions
📈 XRP + SOL BULLISH SETUPS
🟢 $XRP
/ USDT (Perp)
💰 Current: 1.4194
🎯 BUY ENTRY: 1.40 – 1.45
🚀 TP1: 1.5500
🚀 TP2: 1.8550
🚀 TP3: 2.1296
🚀 TP4: 2.5169
🛑 SL: 1.33
📊 Bullish above 1.40 — reclaiming 1.55 can open the way toward your higher drawn levels.
🟢 $SOL
/ USDT (Perp)
💰 Current: 111.32
🎯 BUY ENTRY: 108 – 113
🚀 TP1: 120.79
🚀 TP2: 148.70
🚀 TP3: 180.65
🚀 TP4: 205.33
🛑 SL: 103
📊 Bullish above 111–113 — a confirmed break of 120.79 would target your next drawn levels.
🔥 BINANCE SIGNALS BULLISH 💚😱😱🔥
📈 Smart Entries | High Reward Potential
👍 Like | 🔁 Share | ✅ Follow
💚 Market Momentum Building | Smart Entries Ahead
#Binance #BitcoinDunyamiz #HoldOnTight #Hotternds #TrendingPredictions
247

·
--
Рост
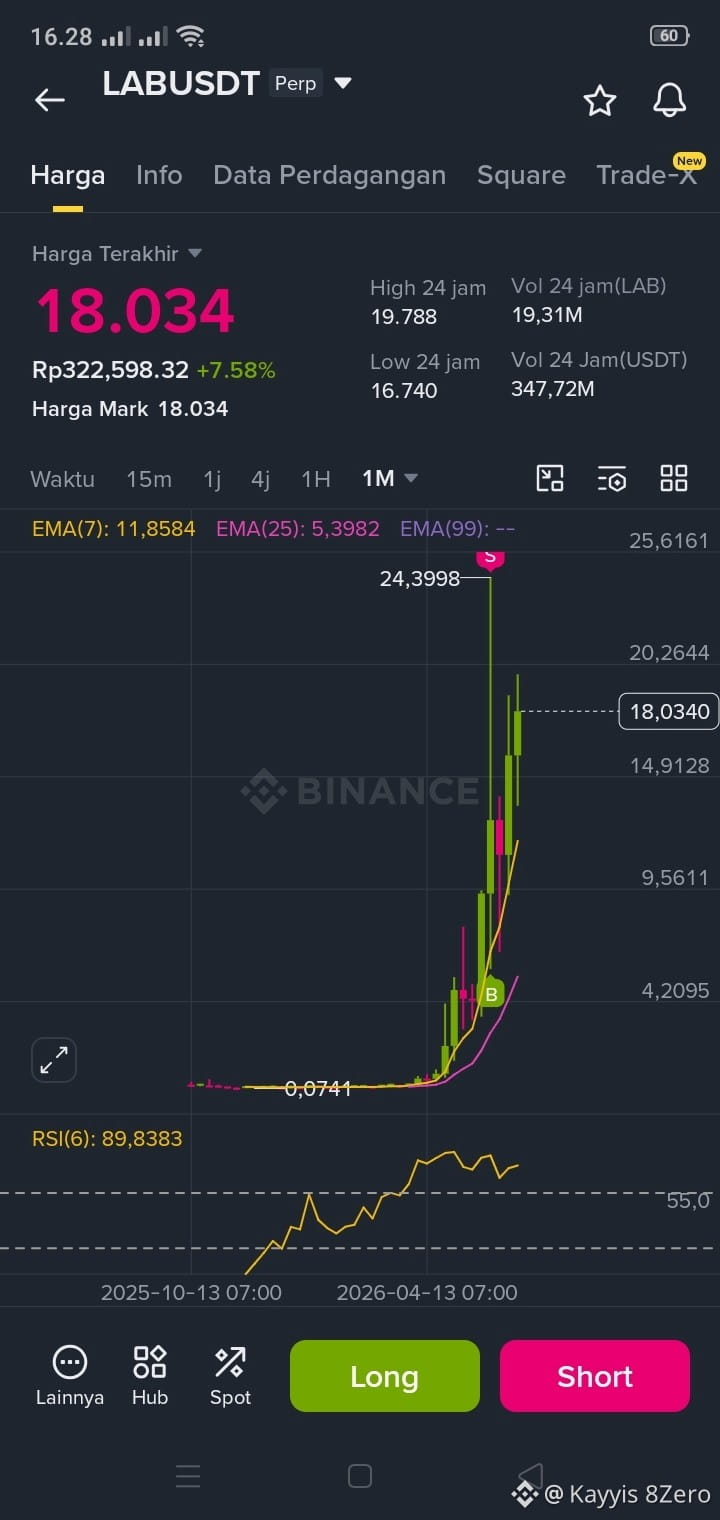
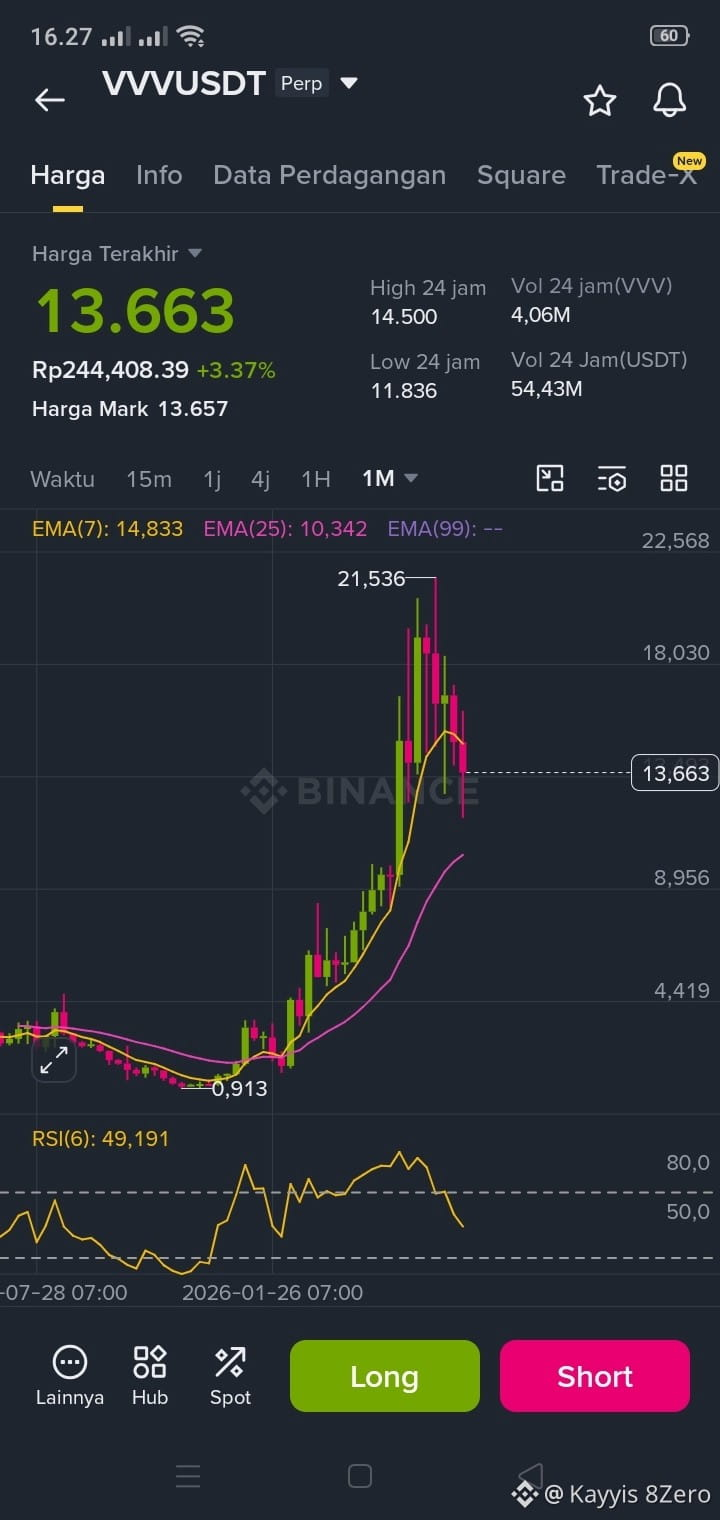
2 Coin Alpha Terbaik 2026 $LAB & $VVV bertahan di atas 10$ selama periode 2 bulan terakhir dan akan terus naik prediksi saya untuk buat ATH baru #TrendingPredictions #2026
{future}(LABUSDT)
{future}(VVVUSDT)
2 Coin Alpha Terbaik 2026 $LAB & $VVV bertahan di atas 10$ selama periode 2 bulan terakhir dan akan terus naik prediksi saya untuk buat ATH baru #TrendingPredictions #2026
1
342

·
--
$ROBO playing with heart
I think it's next move on bullish point
Because in previous point ROBO marketing crash but again in bull point.
And now it's time to Bullish. But how to treat this and clear between Bullish and bearish in robo market and what's your next move drop your prediction
#TrendingTopic #TrendingPredictions
{spot}(ROBOUSDT)
$ROBO playing with heart
I think it's next move on bullish point
Because in previous point ROBO marketing crash but again in bull point.
And now it's time to Bullish. But how to treat this and clear between Bullish and bearish in robo market and what's your next move drop your prediction
#TrendingTopic #TrendingPredictions
I think it's next move on bullish point
Because in previous point ROBO marketing crash but again in bull point.
And now it's time to Bullish. But how to treat this and clear between Bullish and bearish in robo market and what's your next move drop your prediction
#TrendingTopic #TrendingPredictions
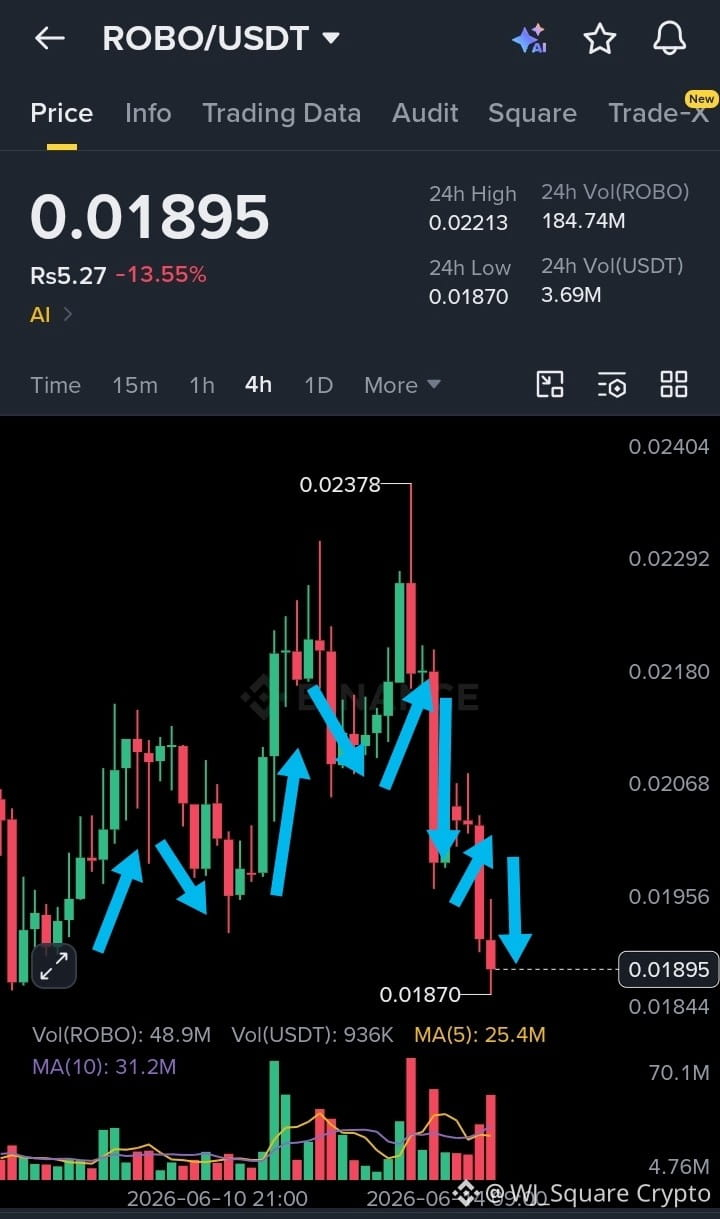
1
341


·
--
Рост
Maiga Trending Markets is LIVE. 🚨
Trade what's happening right now. Real events. Real outcomes. Real money.
Trade across:
🌍 World events
📈 Crypto pre-market
🎉 Crypto events
🏦 Macro & finance
🎭 Pop culture & tech
Fresh markets dropping everyday! Your next call is always right around the corner.
You've had opinions on these. Now put your prediction where your mouth is.
👉 predict.maiga.markets
#MaigaMarkets #TrendingPredictions
Maiga Trending Markets is LIVE. 🚨
Trade what's happening right now. Real events. Real outcomes. Real money.
Trade across:
🌍 World events
📈 Crypto pre-market
🎉 Crypto events
🏦 Macro & finance
🎭 Pop culture & tech
Fresh markets dropping everyday! Your next call is always right around the corner.
You've had opinions on these. Now put your prediction where your mouth is.
👉 predict.maiga.markets
#MaigaMarkets #TrendingPredictions
Trade what's happening right now. Real events. Real outcomes. Real money.
Trade across:
🌍 World events
📈 Crypto pre-market
🎉 Crypto events
🏦 Macro & finance
🎭 Pop culture & tech
Fresh markets dropping everyday! Your next call is always right around the corner.
You've had opinions on these. Now put your prediction where your mouth is.
👉 predict.maiga.markets
#MaigaMarkets #TrendingPredictions

350

$BTC @BTC- #BTC走势分析
{spot}(BTCUSDT)
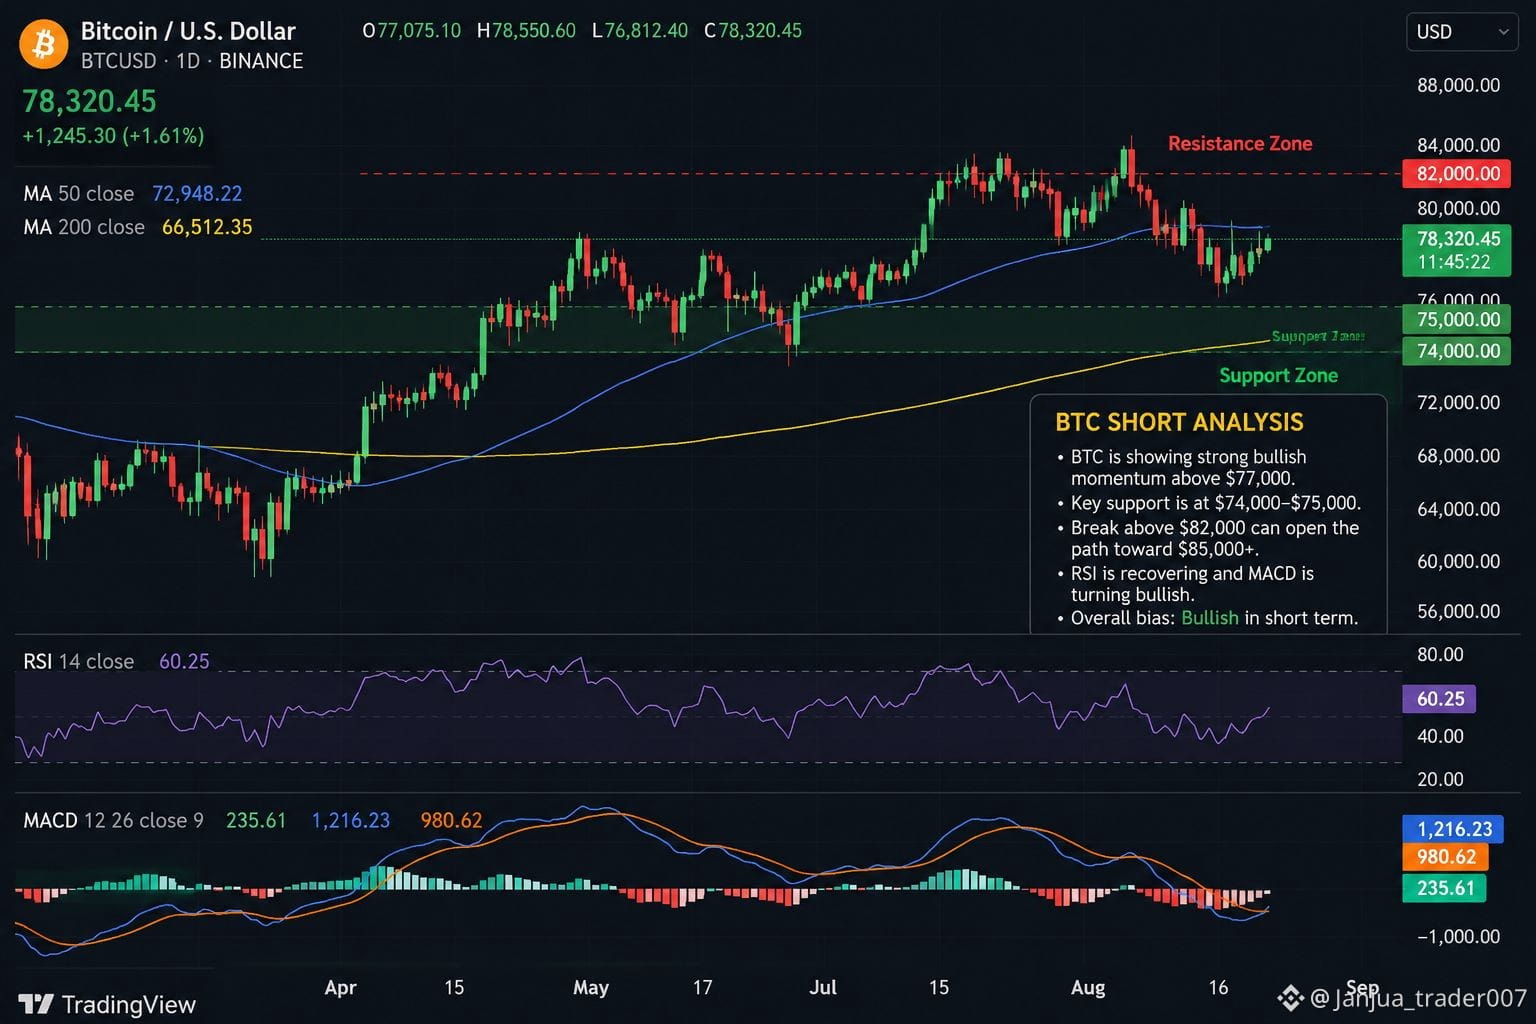
$BTC Bitcoin is showing strong bullish momentum after a sharp weekly rally of around 20%, recently trading near the $77,000–$78,000 area.
The key support zone is around **$70,000–$72,000**, while **$80,000** is an important psychological resistance. Strong spot Bitcoin ETF inflows are supporting the current recovery.
Overall, @Square-Creator-9bbccc9d5548 BTC looks **bullish in the short term**, but after such a rapid rally, a pullback or consolidation is possible. Traders should watch volume, ETF flows, and the $70K support closely. This is market analysis, not financial advice.
#btc70k #1000PEPEUSDT
#TrendingPredictions
$BTC @BTC - #BTC走势分析
$BTC Bitcoin is showing strong bullish momentum after a sharp weekly rally of around 20%, recently trading near the $77,000–$78,000 area.
The key support zone is around **$70,000–$72,000**, while **$80,000** is an important psychological resistance. Strong spot Bitcoin ETF inflows are supporting the current recovery.
Overall, @BTC____ BTC looks **bullish in the short term**, but after such a rapid rally, a pullback or consolidation is possible. Traders should watch volume, ETF flows, and the $70K support closely. This is market analysis, not financial advice.
#btc70k #1000PEPEUSDT
#TrendingPredictions
$BTC Bitcoin is showing strong bullish momentum after a sharp weekly rally of around 20%, recently trading near the $77,000–$78,000 area.
The key support zone is around **$70,000–$72,000**, while **$80,000** is an important psychological resistance. Strong spot Bitcoin ETF inflows are supporting the current recovery.
Overall, @BTC____ BTC looks **bullish in the short term**, but after such a rapid rally, a pullback or consolidation is possible. Traders should watch volume, ETF flows, and the $70K support closely. This is market analysis, not financial advice.
#btc70k #1000PEPEUSDT
#TrendingPredictions
85

🚨 $RE Analysis
📈 Trend: Recovery Mode
🎯 Target 1: 1.05
🎯 Target 2: 1.10
🛑 Stop Loss: 0.95
💡 Buyers are defending support. A breakout above resistance could trigger further upside momentum.
❓ What’s your opinion?
🟢 Bullish
🔴 Bearish
?
#RE #Reusdt #crypto #TradingSignals #TrendingPredictions
🚨 $RE Analysis
📈 Trend: Recovery Mode
🎯 Target 1: 1.05
🎯 Target 2: 1.10
🛑 Stop Loss: 0.95
💡 Buyers are defending support. A breakout above resistance could trigger further upside momentum.
❓ What’s your opinion?
🟢 Bullish
🔴 Bearish
?
#RE #Reusdt #crypto #TradingSignals #TrendingPredictions
📈 Trend: Recovery Mode
🎯 Target 1: 1.05
🎯 Target 2: 1.10
🛑 Stop Loss: 0.95
💡 Buyers are defending support. A breakout above resistance could trigger further upside momentum.
❓ What’s your opinion?
🟢 Bullish
🔴 Bearish
?
#RE #Reusdt #crypto #TradingSignals #TrendingPredictions
1
273

·
--
TOP 20 TRENDING COINS THIS WEEK 👀
16-22 May
The market is speaking. Here's what everyone's watching👇
🔥 Top 5 That Matter:
🥇 $HYPE — $13.8B | ATH just hit. Institutions loading. 🚀
🥈 $PENGU — $603.8M | NFT culture meets DeFi
🥉 $ZEC — $10.9B | Privacy narrative back?
4️⃣ BTC — $1.5T | Still the king 👑
5️⃣ ONDO — $2B | RWA tokenization leader 💎
💡 Hidden Gems On This List:
🔵 SUI — $4.4B | Quietly building momentum
🟡 TAO — $2.7B | AI narrative unstoppable
🟣 SOL — $50.1B | Still my favorite spot hold
My Take:
HYPE at #1 with $13.8B market cap and still in price discovery mode — most underrated coin of 2026. 🔥
"Trending lists don't create moves — they confirm them." 💡
⚠️ NFA | DYOR
💬 Which coin from this list are you watching? 👇🔥
{future}(HYPEUSDT)
{spot}(ZECUSDT)
{spot}(PENGUUSDT)
#TrendingPredictions #HYPE #BinanceSquareFamily #KevinWarshLeadsFederalReserve #CryptoMarketCapNears2.6T
TOP 20 TRENDING COINS THIS WEEK 👀
16-22 May
The market is speaking. Here's what everyone's watching👇
🔥 Top 5 That Matter:
🥇 $HYPE — $13.8B | ATH just hit. Institutions loading. 🚀
🥈 $PENGU — $603.8M | NFT culture meets DeFi
🥉 $ZEC — $10.9B | Privacy narrative back?
4️⃣ BTC — $1.5T | Still the king 👑
5️⃣ ONDO — $2B | RWA tokenization leader 💎
💡 Hidden Gems On This List:
🔵 SUI — $4.4B | Quietly building momentum
🟡 TAO — $2.7B | AI narrative unstoppable
🟣 SOL — $50.1B | Still my favorite spot hold
My Take:
HYPE at #1 with $13.8B market cap and still in price discovery mode — most underrated coin of 2026. 🔥
"Trending lists don't create moves — they confirm them." 💡
⚠️ NFA | DYOR
💬 Which coin from this list are you watching? 👇🔥
#TrendingPredictions #HYPE #BinanceSquareFamily #KevinWarshLeadsFederalReserve #CryptoMarketCapNears2.6T
16-22 May
The market is speaking. Here's what everyone's watching👇
🔥 Top 5 That Matter:
🥇 $HYPE — $13.8B | ATH just hit. Institutions loading. 🚀
🥈 $PENGU — $603.8M | NFT culture meets DeFi
🥉 $ZEC — $10.9B | Privacy narrative back?
4️⃣ BTC — $1.5T | Still the king 👑
5️⃣ ONDO — $2B | RWA tokenization leader 💎
💡 Hidden Gems On This List:
🔵 SUI — $4.4B | Quietly building momentum
🟡 TAO — $2.7B | AI narrative unstoppable
🟣 SOL — $50.1B | Still my favorite spot hold
My Take:
HYPE at #1 with $13.8B market cap and still in price discovery mode — most underrated coin of 2026. 🔥
"Trending lists don't create moves — they confirm them." 💡
⚠️ NFA | DYOR
💬 Which coin from this list are you watching? 👇🔥
#TrendingPredictions #HYPE #BinanceSquareFamily #KevinWarshLeadsFederalReserve #CryptoMarketCapNears2.6T
1
477
·
--
Статья
ONUSDT Coin next 7 days forecast$ON
{future}(ONUSDT)
ONUSDT Next 7 Days Forecast
ONUSDT is attracting increasing attention from Binance traders due to its rising trading volume and improving market sentiment. While cryptocurrency markets remain highly volatile, technical indicators currently suggest a cautiously bullish outlook if Bitcoin and the broader crypto market remain stable.
7-Day Price Prediction
DayExpected TrendPredictionDay 1🟢 Slight Bullish+1% to +2%Day 2🟢 Bullish+2% to +4%Day 3🟡 Sideways0% to +1%Day 4🟢 Bullish+3%Day 5🔴 Minor Pullback-1% to -2%Day 6🟢 Recovery+2%Day 7🟢 Bullish+2% to +5%
Technical Analysis
Trend: Mild BullishMomentum: PositiveSupport Zone: Current short-term support levelResistance Zone: Previous weekly highRisk Level: Medium
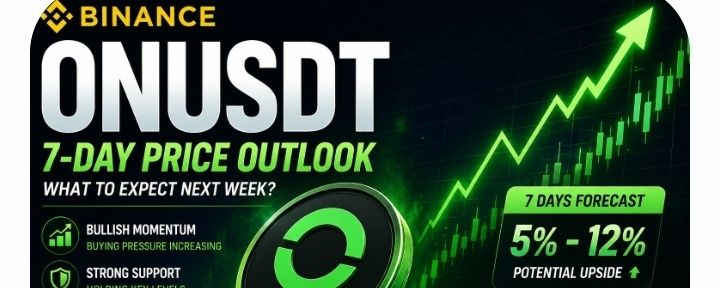
If buying pressure continues and the overall crypto market remains positive, ONUSDT could gain approximately 5%–12% over the next seven days. However, a break below key support may trigger a short-term correction.
Trading Strategy
Short-term traders: Look for pullbacks before entering positions.Swing traders: Consider holding while the price stays above support.Risk Management: Always use a stop-loss and avoid risking more than you can afford to lose.
Final Verdict
The overall outlook for ONUSDT over the next seven days is moderately bullish. Continued market strength could push the price higher, but traders should monitor Bitcoin's movement, trading volume, and key resistance levels before making trading decisions.
Disclaimer: This forecast is for informational purposes only and is not financial advice. Cryptocurrency prices are highly volatile, and past performance does not guarantee future results.
#TrendingTopic #TradingCommunity #TrendingPredictions
ONUSDT Coin next 7 days forecast
$ON
ONUSDT Next 7 Days Forecast
ONUSDT is attracting increasing attention from Binance traders due to its rising trading volume and improving market sentiment. While cryptocurrency markets remain highly volatile, technical indicators currently suggest a cautiously bullish outlook if Bitcoin and the broader crypto market remain stable.
7-Day Price Prediction
DayExpected TrendPredictionDay 1🟢 Slight Bullish+1% to +2%Day 2🟢 Bullish+2% to +4%Day 3🟡 Sideways0% to +1%Day 4🟢 Bullish+3%Day 5🔴 Minor Pullback-1% to -2%Day 6🟢 Recovery+2%Day 7🟢 Bullish+2% to +5%
Technical Analysis
Trend: Mild BullishMomentum: PositiveSupport Zone: Current short-term support levelResistance Zone: Previous weekly highRisk Level: Medium
If buying pressure continues and the overall crypto market remains positive, ONUSDT could gain approximately 5%–12% over the next seven days. However, a break below key support may trigger a short-term correction.
Trading Strategy
Short-term traders: Look for pullbacks before entering positions.Swing traders: Consider holding while the price stays above support.Risk Management: Always use a stop-loss and avoid risking more than you can afford to lose.
Final Verdict
The overall outlook for ONUSDT over the next seven days is moderately bullish. Continued market strength could push the price higher, but traders should monitor Bitcoin's movement, trading volume, and key resistance levels before making trading decisions.
Disclaimer: This forecast is for informational purposes only and is not financial advice. Cryptocurrency prices are highly volatile, and past performance does not guarantee future results.
#TrendingTopic #TradingCommunity #TrendingPredictions
ONUSDT Next 7 Days Forecast
ONUSDT is attracting increasing attention from Binance traders due to its rising trading volume and improving market sentiment. While cryptocurrency markets remain highly volatile, technical indicators currently suggest a cautiously bullish outlook if Bitcoin and the broader crypto market remain stable.
7-Day Price Prediction
DayExpected TrendPredictionDay 1🟢 Slight Bullish+1% to +2%Day 2🟢 Bullish+2% to +4%Day 3🟡 Sideways0% to +1%Day 4🟢 Bullish+3%Day 5🔴 Minor Pullback-1% to -2%Day 6🟢 Recovery+2%Day 7🟢 Bullish+2% to +5%
Technical Analysis
Trend: Mild BullishMomentum: PositiveSupport Zone: Current short-term support levelResistance Zone: Previous weekly highRisk Level: Medium
If buying pressure continues and the overall crypto market remains positive, ONUSDT could gain approximately 5%–12% over the next seven days. However, a break below key support may trigger a short-term correction.
Trading Strategy
Short-term traders: Look for pullbacks before entering positions.Swing traders: Consider holding while the price stays above support.Risk Management: Always use a stop-loss and avoid risking more than you can afford to lose.
Final Verdict
The overall outlook for ONUSDT over the next seven days is moderately bullish. Continued market strength could push the price higher, but traders should monitor Bitcoin's movement, trading volume, and key resistance levels before making trading decisions.
Disclaimer: This forecast is for informational purposes only and is not financial advice. Cryptocurrency prices are highly volatile, and past performance does not guarantee future results.
#TrendingTopic #TradingCommunity #TrendingPredictions
151
·
--
Падение
📊🔴 BEARISH SIGNALS POST — TAO / DOGE / BNB
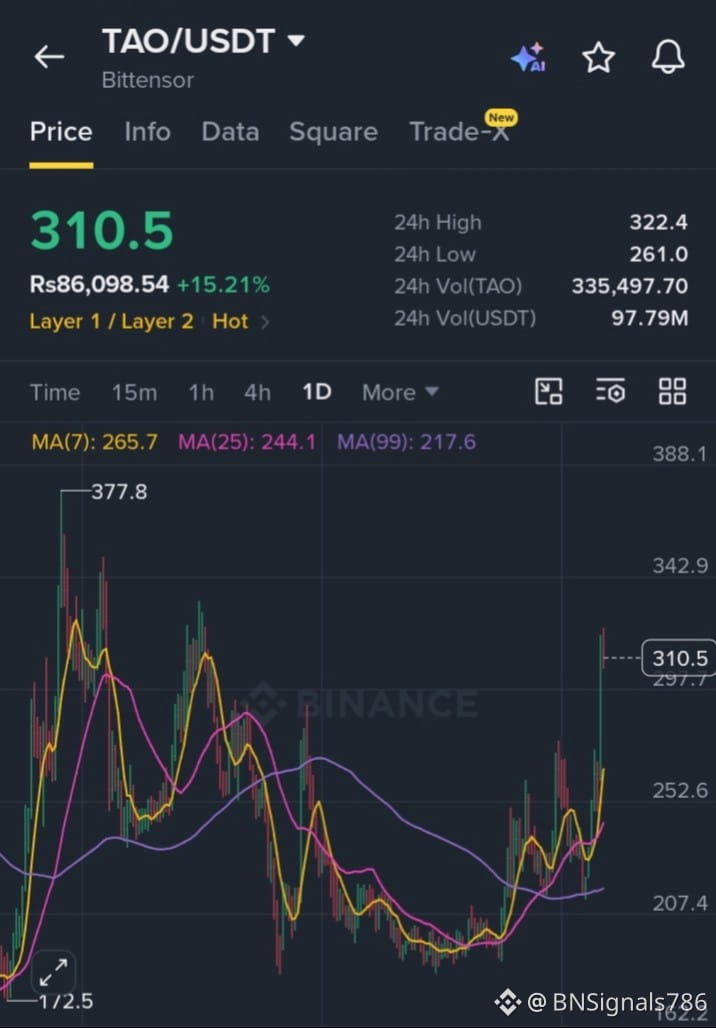
🔻 $TAO
{spot}(TAOUSDT)
/USDT
Price: 310.5
Rejection risk near 322.4 resistance.
Strong rally has pushed price well above MA7 265.7.
Bearish trigger: rejection from 322.4 followed by a break below 297.7.
Downside levels: 265.7 → 244.1
Stronger bearish confirmation: daily close below 265.7.
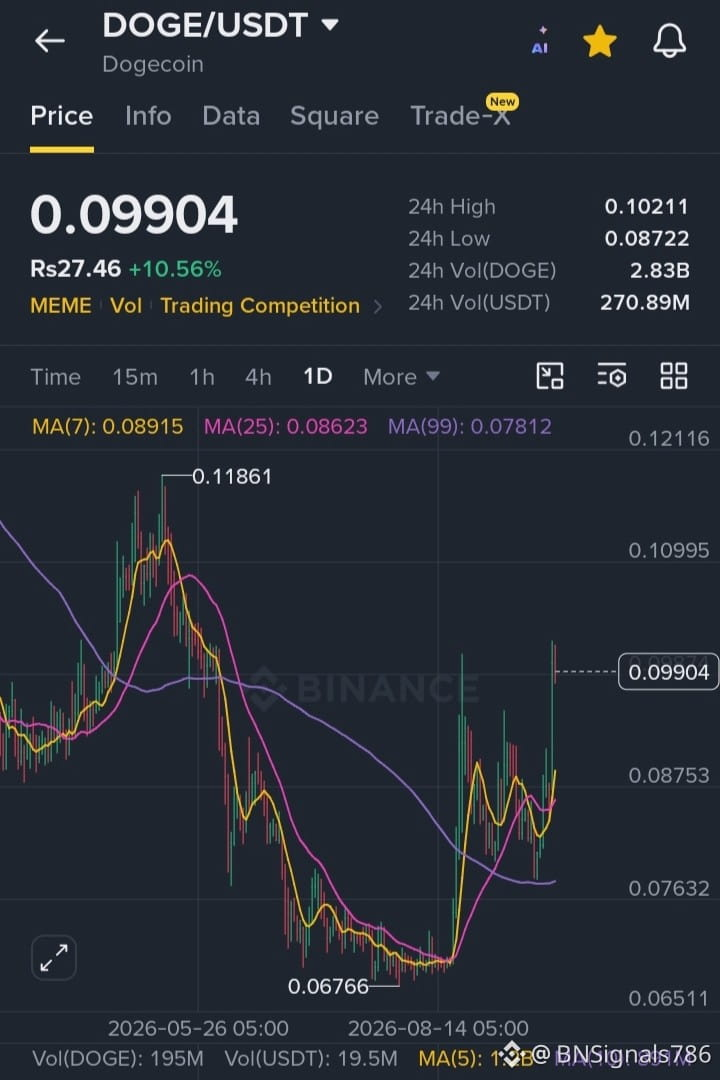
🔻 $DOGE
{spot}(DOGEUSDT)
/USDT
Price: 0.09904
Price is testing the 0.1021 resistance area.
A failed breakout could produce a pullback toward 0.0875.
Bearish trigger: rejection around 0.1021–0.1100 + break below 0.0875.
Downside levels: 0.0875 → 0.0781
Stronger confirmation: daily close below 0.0862.
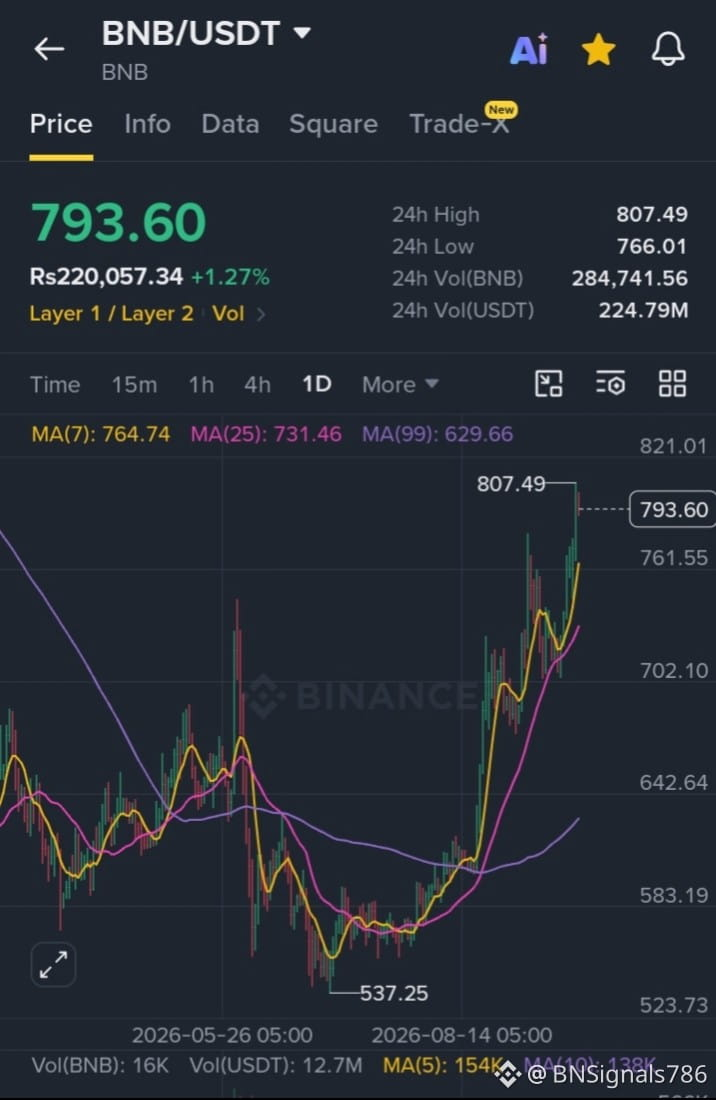
🔻 $BNB
{spot}(BNBUSDT)
/USDT
Price: 793.60
Trading just below the 807.49 recent high.
Rejection around 807–821 could create a short-term correction.
Bearish trigger: rejection + break below 761.55.
Downside levels: 731.46 → 702.10
Stronger confirmation: daily close below 731.46.
⚠️ BEARISH CONFIRMATION
Resistance rejection → lower high → support breakdown → rising sell volume.
These charts are still showing bullish moving-average structures, so a bearish setup is conditional on confirmation, rather than a confirmed reversal.
Watch:
🔴 TAO: 297.7
🔴 DOGE: 0.0875
🔴 BNB: 761.55
Levels are taken from your screenshots and are not guaranteed future targets.
#Binance #HotTrends #TrendingPredictions #trendtopic #altcoins
📊🔴 BEARISH SIGNALS POST — TAO / DOGE / BNB
🔻 $TAO
/USDT
Price: 310.5
Rejection risk near 322.4 resistance.
Strong rally has pushed price well above MA7 265.7.
Bearish trigger: rejection from 322.4 followed by a break below 297.7.
Downside levels: 265.7 → 244.1
Stronger bearish confirmation: daily close below 265.7.
🔻 $DOGE
/USDT
Price: 0.09904
Price is testing the 0.1021 resistance area.
A failed breakout could produce a pullback toward 0.0875.
Bearish trigger: rejection around 0.1021–0.1100 + break below 0.0875.
Downside levels: 0.0875 → 0.0781
Stronger confirmation: daily close below 0.0862.
🔻 $BNB
/USDT
Price: 793.60
Trading just below the 807.49 recent high.
Rejection around 807–821 could create a short-term correction.
Bearish trigger: rejection + break below 761.55.
Downside levels: 731.46 → 702.10
Stronger confirmation: daily close below 731.46.
⚠️ BEARISH CONFIRMATION
Resistance rejection → lower high → support breakdown → rising sell volume.
These charts are still showing bullish moving-average structures, so a bearish setup is conditional on confirmation, rather than a confirmed reversal.
Watch:
🔴 TAO: 297.7
🔴 DOGE: 0.0875
🔴 BNB: 761.55
Levels are taken from your screenshots and are not guaranteed future targets.
#Binance #HotTrends #TrendingPredictions #trendtopic #altcoins
🔻 $TAO
/USDT
Price: 310.5
Rejection risk near 322.4 resistance.
Strong rally has pushed price well above MA7 265.7.
Bearish trigger: rejection from 322.4 followed by a break below 297.7.
Downside levels: 265.7 → 244.1
Stronger bearish confirmation: daily close below 265.7.
🔻 $DOGE
/USDT
Price: 0.09904
Price is testing the 0.1021 resistance area.
A failed breakout could produce a pullback toward 0.0875.
Bearish trigger: rejection around 0.1021–0.1100 + break below 0.0875.
Downside levels: 0.0875 → 0.0781
Stronger confirmation: daily close below 0.0862.
🔻 $BNB
/USDT
Price: 793.60
Trading just below the 807.49 recent high.
Rejection around 807–821 could create a short-term correction.
Bearish trigger: rejection + break below 761.55.
Downside levels: 731.46 → 702.10
Stronger confirmation: daily close below 731.46.
⚠️ BEARISH CONFIRMATION
Resistance rejection → lower high → support breakdown → rising sell volume.
These charts are still showing bullish moving-average structures, so a bearish setup is conditional on confirmation, rather than a confirmed reversal.
Watch:
🔴 TAO: 297.7
🔴 DOGE: 0.0875
🔴 BNB: 761.55
Levels are taken from your screenshots and are not guaranteed future targets.
#Binance #HotTrends #TrendingPredictions #trendtopic #altcoins
1
373
·
--

Статья
COLLECT Coin next 7 days forecast$COLLECT
{future}(COLLECTUSDT)
COLLECTUSDT Coin: 7-Day Outlook Can COLLECT Continue Its Momentum?
COLLECTUSDT (Collect on Fanable) is attracting attention after a strong recent move. Current market data shows COLLECT trading around the $0.06–$0.08 zone, with recent data indicating strong short-term momentum and elevated trading activity. Binance currently lists the COLLECTUSDT perpetual contract.
7-Day Price Outlook
My base-case view for the next 7 days is moderately bullish but highly volatile.
DayPossible Price ZoneOutlookDay 1$0.064–$0.073 ConsolidationDay 2$0.066–$0.076 BullishDay 3$0.068–$0.079 BullishDay 4$0.065–$0.075 Pullback possibleDay 5$0.070–$0.082 RecoveryDay 6$0.073–$0.086 BullishDay 7$0.075–$0.090 Bullish scenario
Potential 7-day target: $0.085–$0.090
Important resistance: around $0.080, followed by $0.090–$0.100.
Important support: around $0.060–$0.065.
Recent market data has shown strong momentum: one data source reported a 7-day gain of about 17.7%, while another showed roughly 16.8%, although prices can change rapidly.
🔥 What Could Push COLLECT Higher?
COLLECT is linked to Fanable, a blockchain-based collectibles marketplace focused on digital/physical collectibles. Its real-world-assets and collectibles narrative could attract speculative interest if trading volume remains strong.
The biggest bullish signal for the coming week would be a clean breakout above $0.080 with strong volume. If that happens, $0.090 and potentially $0.100 could become the next psychological targets.
Major Risk
COLLECT remains a high-volatility token. Its token distribution is also a risk: recent analysis reports that only around 18% of the maximum supply is circulating, while the top 10 wallets control a very large share of the supply. Future supply releases could therefore create selling pressure.
There has also been recent hype around COLLECT on Binance Square, but some of that discussion was reportedly speculative rather than driven by a fundamental news event. Traders should therefore avoid chasing sudden pumps.
Bullish vs. Bearish Scenarios
Bullish scenario:
If COLLECT holds $0.065–$0.070 and breaks $0.080, the next targets could be $0.090 → $0.100.
Neutral scenario:
COLLECT could remain range-bound between approximately $0.060 and $0.080 while the market decides its next direction.
Bearish scenario:
A decisive break below $0.060 could weaken momentum and expose the token to approximately $0.052–$0.055.
Final 7-Day Prediction
Overall outlook: Moderately Bullish / High Risk
COLLECTUSDT has the potential to continue higher over the next 7 days if volume stays elevated and the $0.080 resistance is broken convincingly. My estimated end-of-week range is $0.075–$0.090, with $0.100 possible in a strong breakout.
This is a market scenario, not a guaranteed prediction or financial advice. COLLECT's low circulating supply and concentrated ownership make sharp moves in either direction possible.
#TrendingTopic #TradingCommunity #TrendingPredictions
COLLECT Coin next 7 days forecast
$COLLECT
COLLECTUSDT Coin: 7-Day Outlook Can COLLECT Continue Its Momentum?
COLLECTUSDT (Collect on Fanable) is attracting attention after a strong recent move. Current market data shows COLLECT trading around the $0.06–$0.08 zone, with recent data indicating strong short-term momentum and elevated trading activity. Binance currently lists the COLLECTUSDT perpetual contract.
7-Day Price Outlook
My base-case view for the next 7 days is moderately bullish but highly volatile.
DayPossible Price ZoneOutlookDay 1$0.064–$0.073 ConsolidationDay 2$0.066–$0.076 BullishDay 3$0.068–$0.079 BullishDay 4$0.065–$0.075 Pullback possibleDay 5$0.070–$0.082 RecoveryDay 6$0.073–$0.086 BullishDay 7$0.075–$0.090 Bullish scenario
Potential 7-day target: $0.085–$0.090
Important resistance: around $0.080, followed by $0.090–$0.100.
Important support: around $0.060–$0.065.
Recent market data has shown strong momentum: one data source reported a 7-day gain of about 17.7%, while another showed roughly 16.8%, although prices can change rapidly.
🔥 What Could Push COLLECT Higher?
COLLECT is linked to Fanable, a blockchain-based collectibles marketplace focused on digital/physical collectibles. Its real-world-assets and collectibles narrative could attract speculative interest if trading volume remains strong.
The biggest bullish signal for the coming week would be a clean breakout above $0.080 with strong volume. If that happens, $0.090 and potentially $0.100 could become the next psychological targets.
Major Risk
COLLECT remains a high-volatility token. Its token distribution is also a risk: recent analysis reports that only around 18% of the maximum supply is circulating, while the top 10 wallets control a very large share of the supply. Future supply releases could therefore create selling pressure.
There has also been recent hype around COLLECT on Binance Square, but some of that discussion was reportedly speculative rather than driven by a fundamental news event. Traders should therefore avoid chasing sudden pumps.
Bullish vs. Bearish Scenarios
Bullish scenario:
If COLLECT holds $0.065–$0.070 and breaks $0.080, the next targets could be $0.090 → $0.100.
Neutral scenario:
COLLECT could remain range-bound between approximately $0.060 and $0.080 while the market decides its next direction.
Bearish scenario:
A decisive break below $0.060 could weaken momentum and expose the token to approximately $0.052–$0.055.
Final 7-Day Prediction
Overall outlook: Moderately Bullish / High Risk
COLLECTUSDT has the potential to continue higher over the next 7 days if volume stays elevated and the $0.080 resistance is broken convincingly. My estimated end-of-week range is $0.075–$0.090, with $0.100 possible in a strong breakout.
This is a market scenario, not a guaranteed prediction or financial advice. COLLECT's low circulating supply and concentrated ownership make sharp moves in either direction possible.
#TrendingTopic #TradingCommunity #TrendingPredictions
COLLECTUSDT Coin: 7-Day Outlook Can COLLECT Continue Its Momentum?
COLLECTUSDT (Collect on Fanable) is attracting attention after a strong recent move. Current market data shows COLLECT trading around the $0.06–$0.08 zone, with recent data indicating strong short-term momentum and elevated trading activity. Binance currently lists the COLLECTUSDT perpetual contract.
7-Day Price Outlook
My base-case view for the next 7 days is moderately bullish but highly volatile.
DayPossible Price ZoneOutlookDay 1$0.064–$0.073 ConsolidationDay 2$0.066–$0.076 BullishDay 3$0.068–$0.079 BullishDay 4$0.065–$0.075 Pullback possibleDay 5$0.070–$0.082 RecoveryDay 6$0.073–$0.086 BullishDay 7$0.075–$0.090 Bullish scenario
Potential 7-day target: $0.085–$0.090
Important resistance: around $0.080, followed by $0.090–$0.100.
Important support: around $0.060–$0.065.
Recent market data has shown strong momentum: one data source reported a 7-day gain of about 17.7%, while another showed roughly 16.8%, although prices can change rapidly.
🔥 What Could Push COLLECT Higher?
COLLECT is linked to Fanable, a blockchain-based collectibles marketplace focused on digital/physical collectibles. Its real-world-assets and collectibles narrative could attract speculative interest if trading volume remains strong.
The biggest bullish signal for the coming week would be a clean breakout above $0.080 with strong volume. If that happens, $0.090 and potentially $0.100 could become the next psychological targets.
Major Risk
COLLECT remains a high-volatility token. Its token distribution is also a risk: recent analysis reports that only around 18% of the maximum supply is circulating, while the top 10 wallets control a very large share of the supply. Future supply releases could therefore create selling pressure.
There has also been recent hype around COLLECT on Binance Square, but some of that discussion was reportedly speculative rather than driven by a fundamental news event. Traders should therefore avoid chasing sudden pumps.
Bullish vs. Bearish Scenarios
Bullish scenario:
If COLLECT holds $0.065–$0.070 and breaks $0.080, the next targets could be $0.090 → $0.100.
Neutral scenario:
COLLECT could remain range-bound between approximately $0.060 and $0.080 while the market decides its next direction.
Bearish scenario:
A decisive break below $0.060 could weaken momentum and expose the token to approximately $0.052–$0.055.
Final 7-Day Prediction
Overall outlook: Moderately Bullish / High Risk
COLLECTUSDT has the potential to continue higher over the next 7 days if volume stays elevated and the $0.080 resistance is broken convincingly. My estimated end-of-week range is $0.075–$0.090, with $0.100 possible in a strong breakout.
This is a market scenario, not a guaranteed prediction or financial advice. COLLECT's low circulating supply and concentrated ownership make sharp moves in either direction possible.
#TrendingTopic #TradingCommunity #TrendingPredictions
140
·
--
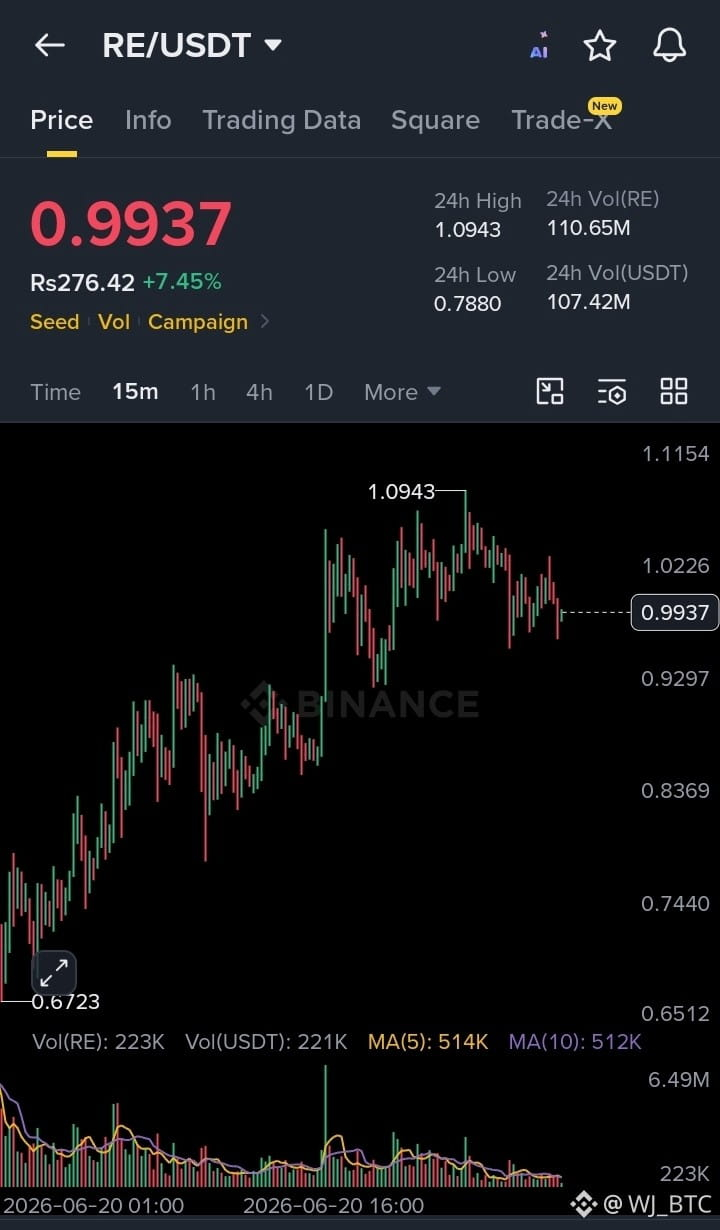
🚨 Be honest... how many of you sold $RE before it reached $1? 👀
Today, RE has already touched $1.09 and is still holding near the $1 zone.
My prediction:
🎯 $1 holds strong 🎯 $1.20 comes next 🎯 $1.50+ becomes a realistic target
#TrendingPredictions
🚨 Be honest... how many of you sold $RE before it reached $1? 👀
Today, RE has already touched $1.09 and is still holding near the $1 zone.
My prediction:
🎯 $1 holds strong 🎯 $1.20 comes next 🎯 $1.50+ becomes a realistic target
#TrendingPredictions
Today, RE has already touched $1.09 and is still holding near the $1 zone.
My prediction:
🎯 $1 holds strong 🎯 $1.20 comes next 🎯 $1.50+ becomes a realistic target
#TrendingPredictions
1
302

·
--
Рост
$XPL LONG
Entry : 0.0911
Targets:
0.0945
0.0970
0.1006
0.1048
SL: 0.0803
good news #TrendingTopic #TrendingPredictions #BullishMomentum #newscrypto #CryptoAnalysis
$XPL LONG
Entry : 0.0911
Targets:
0.0945
0.0970
0.1006
0.1048
SL: 0.0803
good news #TrendingTopic #TrendingPredictions #BullishMomentum #newscrypto #CryptoAnalysis
Entry : 0.0911
Targets:
0.0945
0.0970
0.1006
0.1048
SL: 0.0803
good news #TrendingTopic #TrendingPredictions #BullishMomentum #newscrypto #CryptoAnalysis
237
Войдите, чтобы посмотреть больше материала
Присоединяйтесь к пользователям криптовалют по всему миру на Binance Square
⚡️ Получайте новейшую и полезную информацию о криптоактивах.
💬 Нам доверяет крупнейшая в мире криптобиржа.
👍 Получите достоверные аналитические данные от верифицированных создателей контента.
Эл. почта/номер телефона
В тренде
1
#WhoWillSucceedJensenHuangatNvidia?
Просмотров: 5,301
127 обсуждают
2
#WhatWillDriveCryptoandStocks’NextRebound?
Просмотров: 270,820
2,076 обсуждают
3
#USPPIMissMayEaseBTCPressure
Просмотров: 119,399
1,419 обсуждают
4
#TradFiForBeginners
Просмотров: 644,765
4,146 обсуждают
5
#MANTRAPausesUnstakingFor7DaysAfterKeplrSecurityIncident
Просмотров: 1,616
29 обсуждают
6
#BitcoinCoreDisclosesTorTrafficVulnerability
Просмотров: 56,914
839 обсуждают
7
#BitcoinBreaksBelow200WeekMovingAverage
Просмотров: 116,052
846 обсуждают
8
#SpaceXTeslaMergerTalksWouldCombine30220BTC
Просмотров: 33,760
471 обсуждают
9
#Anthropic’s6xIPODemandSignalsPotentialRecordRaise
Просмотров: 103,882
920 обсуждают
10
#USCryptoETFsLose$1.48BInFiveDays
Просмотров: 4,431
66 обсуждают