
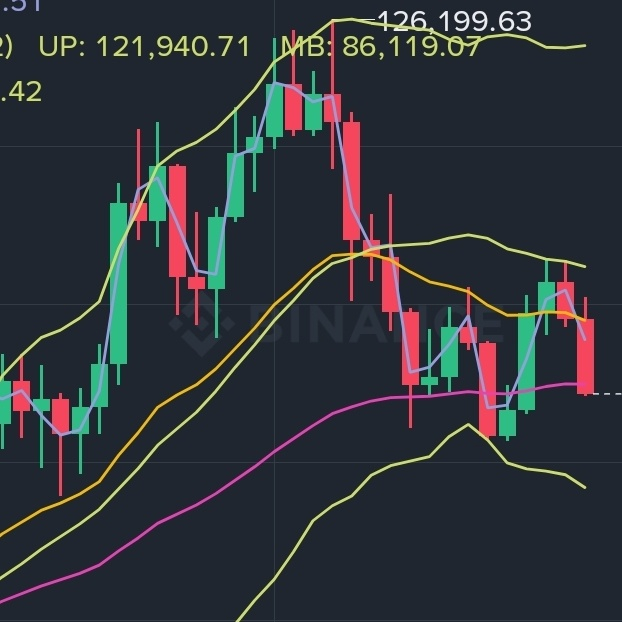
As we analyze the recent BTCUSDT price movements, it's essential to consider the interplay of key indicators.
Currently, the 1-hour chart shows a close of 64882.87, with the EMA20 at 64907.192, indicating a slight bearish trend as the price hovers below the EMA. The RSI is at 49.5, suggesting a neutral momentum, while the MACD histogram is positive, hinting at potential upward movement.
On the 4-hour chart, the situation appears more concerning with an RSI of 34.8, indicating oversold conditions.
Given these insights, what strategies do you think are most effective in navigating such mixed signals in spot trading?
#BTC #CryptoEducation #TradingInsights #Binance #SpotTrading
Currently, the 1-hour chart shows a close of 64882.87, with the EMA20 at 64907.192, indicating a slight bearish trend as the price hovers below the EMA. The RSI is at 49.5, suggesting a neutral momentum, while the MACD histogram is positive, hinting at potential upward movement.
On the 4-hour chart, the situation appears more concerning with an RSI of 34.8, indicating oversold conditions.
Given these insights, what strategies do you think are most effective in navigating such mixed signals in spot trading?
#BTC #CryptoEducation #TradingInsights #Binance #SpotTrading