

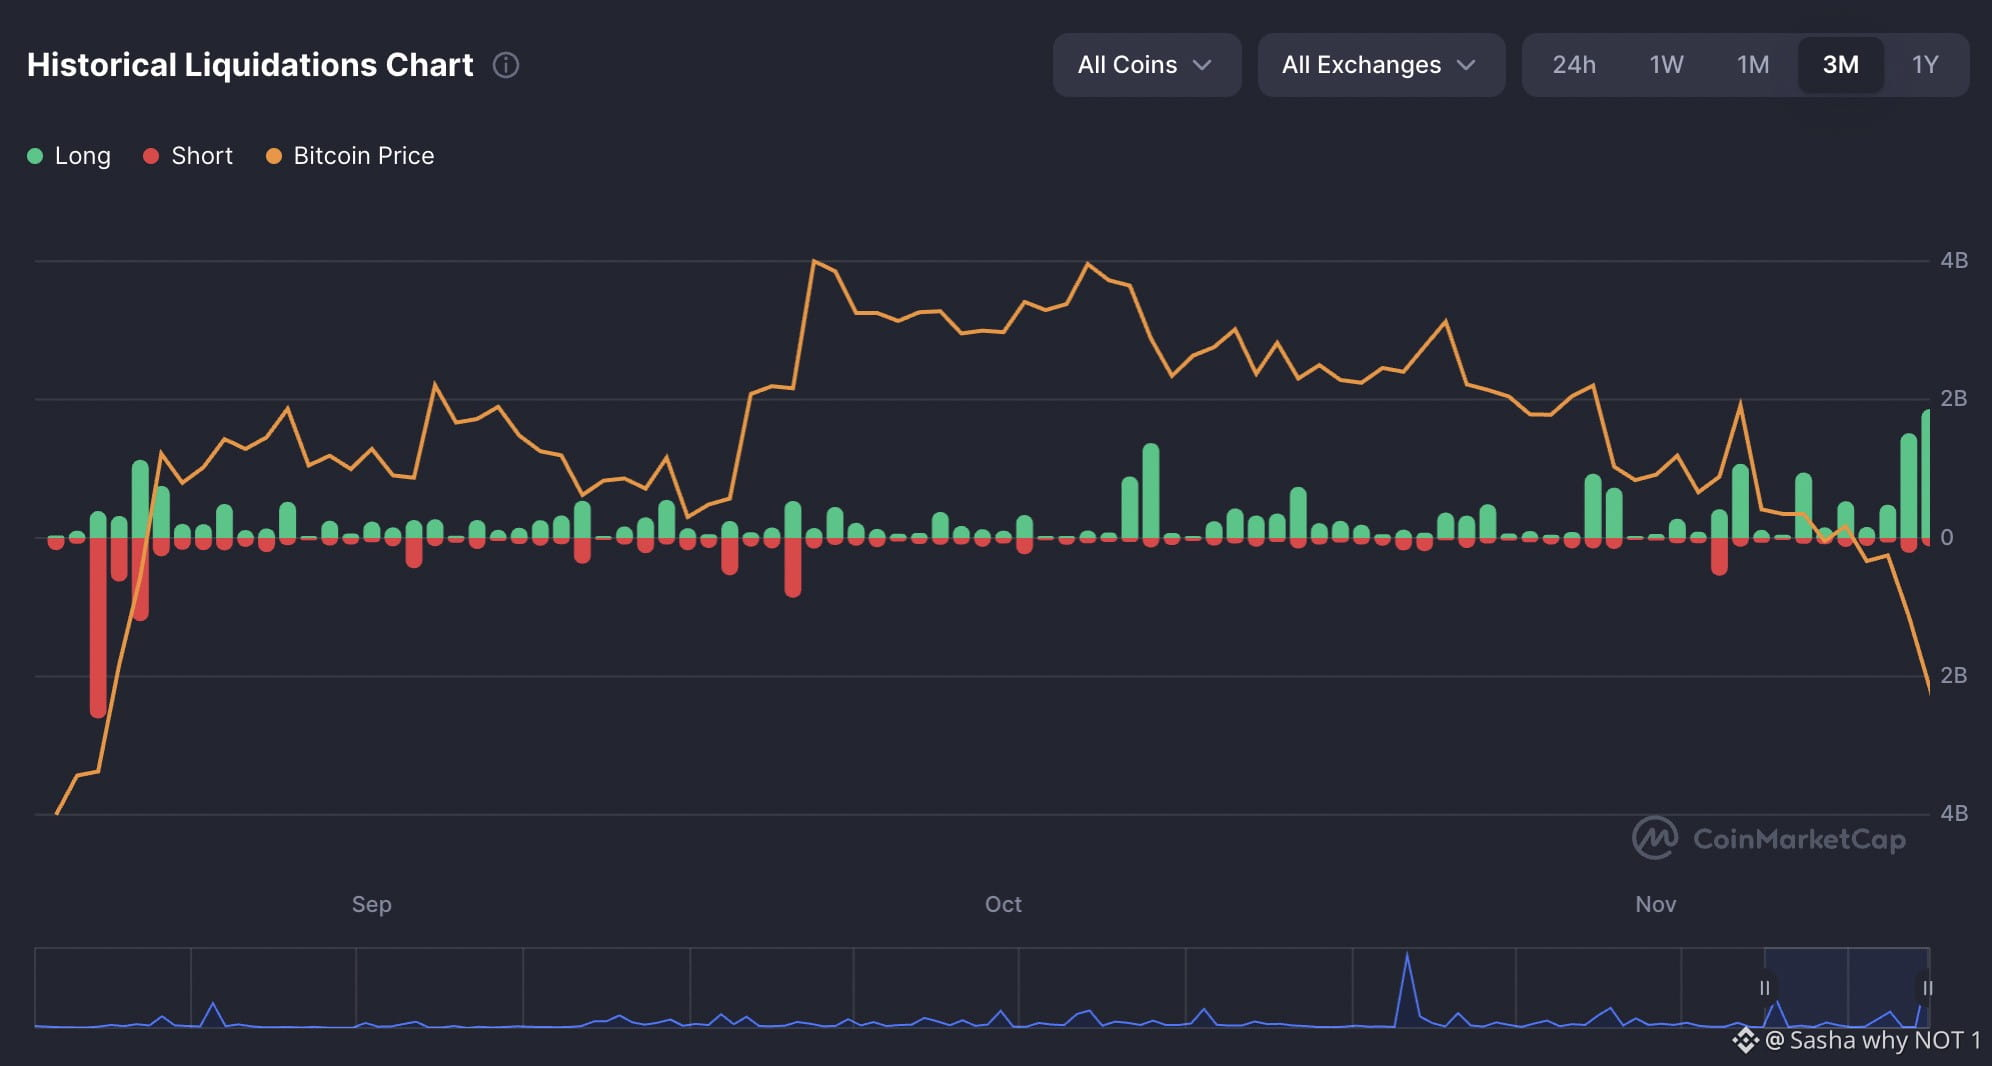
$1.55B liquidated. Leveraged buyers are becoming forced sellers. 🟢 Longs: $1.26B 🔴 Shorts: $288.78M Long positions accounted for roughly 81% of liquidations about 4.4 times the short total. On the right side of the three-month chart, Bitcoin’s decline coincides with repeated spikes in long liquidations. Those green bars represent bullish positions being forcibly closed. The feedback loop is painful: prices fall → margin becomes insufficient → exchanges close longs → forced selling can deepen the decline. Does that mean the leverage flush is over and a recovery comes next? This chart records positions already liquidated. It cannot tell us how much vulnerable leverage remains or whether spot demand can absorb another wave of selling. My reading: the market is experiencing a significant leverage shakeout. That can set up a rebound, but it does not establish a durable bottom. Here is what I would watch next: ▪️ Open interest: Is it falling alongside price, supporting the deleveraging thesis? ▪️ Funding rates: Is the premium for holding longs cooling? ▪️ Spot demand: Can buyers defend the lows once forced selling fades? If liquidations slow but prices keep falling, “just a leverage flush” becomes a weaker explanation. Also, $1.55B is the value of liquidated positions it does not mean $1.55B in cash left crypto. The next move depends on who steps in to buy after the forced sellers are done. https://coinmarketcap.com/charts/liquidations/ $BTC #Bitcoin #BTC Price Analysis#
Присоединяйтесь к пользователям криптовалют по всему миру на Binance Square
⚡️ Получайте новейшую и полезную информацию о криптоактивах.
💬 Нам доверяет крупнейшая в мире криптобиржа.
👍 Получите достоверные аналитические данные от верифицированных создателей контента.
Эл. почта/номер телефона