$ZAMA: Sifting Derivatives Noise From Spot Volume
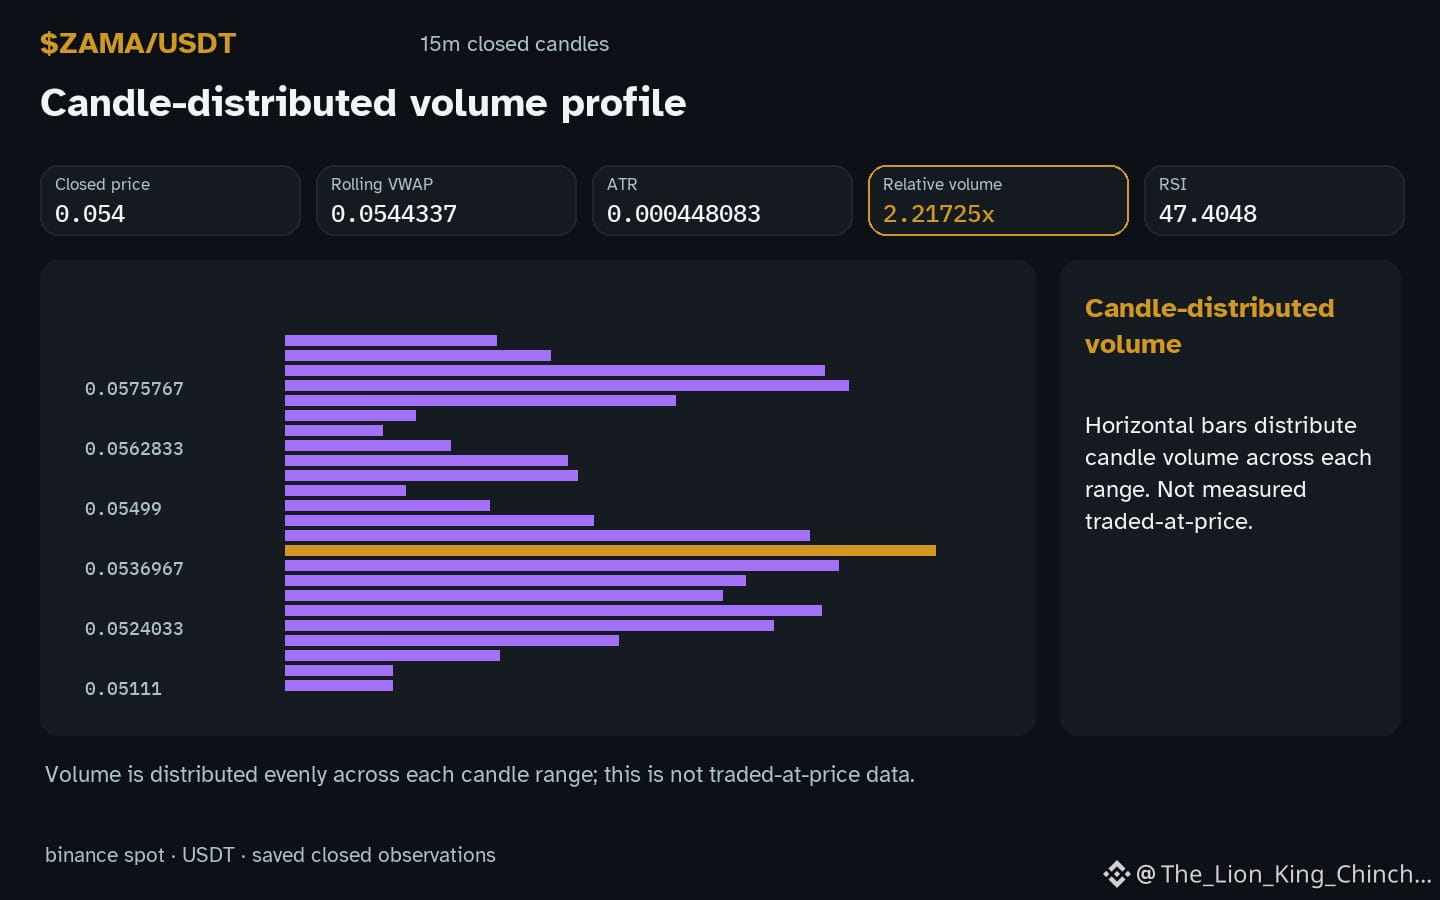
$ZAMA: Can an observer distinguish between spot demand and leverage-driven positioning when volume rises while price drifts? The current chart for $ZAMA shows a down hourly direction while volume sits 2.22x baseline.
In a hypothetical mechanism, high relative volume accompanied by a narrow price range might suggest that derivatives activity is expanding. If perpetual open interest grows without a corresponding move in spot prices, it could indicate that participants are using leverage to express a directional bias rather than buying the underlying asset directly. This creates a scenario where the price remains heavy because no real spot accumulation is occurring to remove available supply from the market.
An alternative reading is that high volume during a down hourly move reflects simple distribution where sellers are more active than buyers. This interpretation relies on the idea that every trade is a spot transaction. To check these ideas, a researcher could look at the relationship between the daily change -8.16327% and the RSI 47.4. If the RSI remains neutral despite the volume surge, it may weaken the distribution theory.
Conversely, if a future closed candle moves sharply above resistance 0.05517 on lower volume, the idea of a leverage-driven bottleneck would be weakened. This would suggest the prior volume was not a buildup of complex positions but a temporary increase in standard trading activity that has since resolved. Monitoring the local support 0.0521 provides a concrete way to reassess whether the current price direction is a brief pause or a more significant trend.
Probabilistic market research, not a recommendation or guaranteed return.
#ZAMA #MarketAnalysis #CryptoLearning
$ZAMA: Can an observer distinguish between spot demand and leverage-driven positioning when volume rises while price drifts? The current chart for $ZAMA shows a down hourly direction while volume sits 2.22x baseline.
In a hypothetical mechanism, high relative volume accompanied by a narrow price range might suggest that derivatives activity is expanding. If perpetual open interest grows without a corresponding move in spot prices, it could indicate that participants are using leverage to express a directional bias rather than buying the underlying asset directly. This creates a scenario where the price remains heavy because no real spot accumulation is occurring to remove available supply from the market.
An alternative reading is that high volume during a down hourly move reflects simple distribution where sellers are more active than buyers. This interpretation relies on the idea that every trade is a spot transaction. To check these ideas, a researcher could look at the relationship between the daily change -8.16327% and the RSI 47.4. If the RSI remains neutral despite the volume surge, it may weaken the distribution theory.
Conversely, if a future closed candle moves sharply above resistance 0.05517 on lower volume, the idea of a leverage-driven bottleneck would be weakened. This would suggest the prior volume was not a buildup of complex positions but a temporary increase in standard trading activity that has since resolved. Monitoring the local support 0.0521 provides a concrete way to reassess whether the current price direction is a brief pause or a more significant trend.
Probabilistic market research, not a recommendation or guaranteed return.
#ZAMA #MarketAnalysis #CryptoLearning