
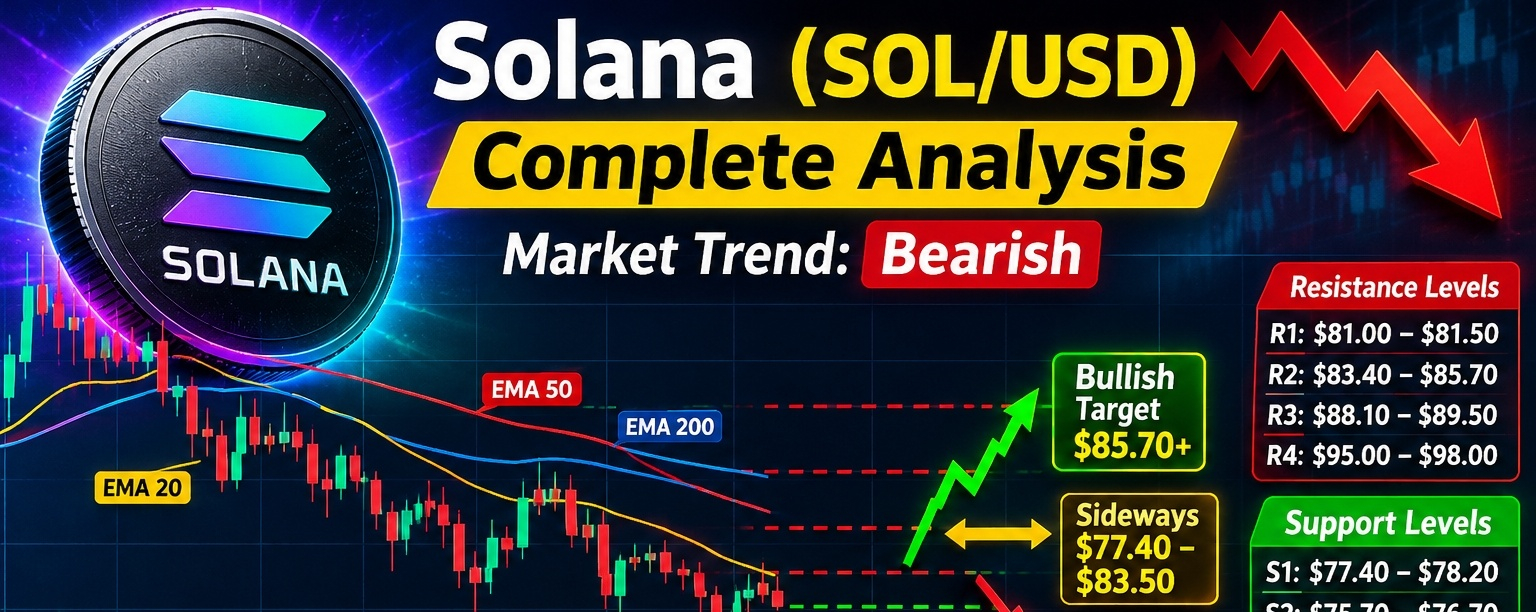

Solana ($SOL /USD) – Complete Technical & Market Analysis November 13, 2026
Solana is a major high-performance blockchain cryptocurrency. For $SOL /USD, the most important things to monitor are Bitcoin's direction, market liquidity, trading volume, support and resistance, and momentum.

I’ll distinguish confirmed market data from technical scenarios rather than inventing live prices or trading signals.
### 1\. Current market overview
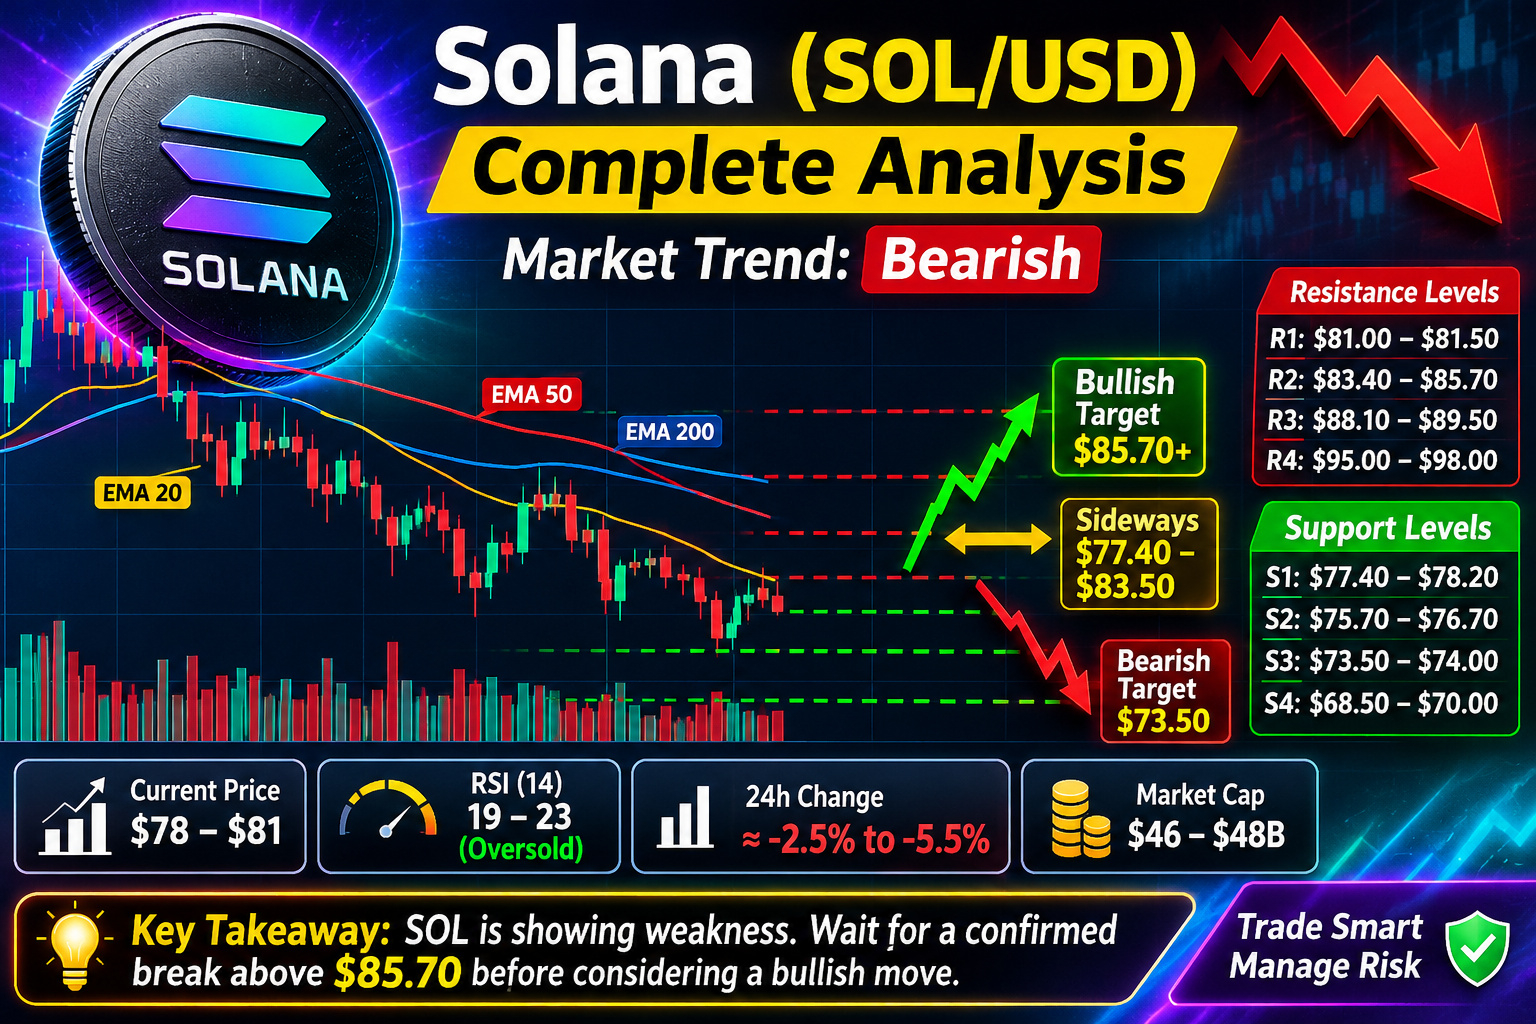
Latest reported price range
### $78–$81
USD, different market snapshots
24-hour direction
### Down
Approximately −2.5% to −5.5%
Market capitalization
### $46–48B
Reported estimates
Daily RSI
### 19–23
Oversold territory
These are reported snapshots, not a synchronized live Binance quote. InvestingCube +2
Market interpretation: Sellers currently have control. However, the oversold RSI means a temporary relief rally is possible. Oversold does not automatically mean the bottom is in.
### 2\. Technical trend analysis
| Timeframe | Trend | Assessment |
| --------- | ------------ | --------------------------- |
| 5-minute | Volatile | Short-term trading |
| 15-minute | Weak | Selling pressure |
| 1-hour | Bearish | Recovery attempts |
| 4-hour | Bearish | Sellers in control |
| Daily | Bearish | Lower highs and lows |
| Weekly | Weak / mixed | Needs recovery confirmation |
The daily chart shows a price below its 50 EMA near $98.34. The broader moving-average structure remains weak. Chart Radars +1
Overall trend: Bearish
### 3\. Important support levels
These are the prices where buyers may attempt to defend SOL.
| Support | Price (USD) | Importance |
| ------- | ------------- | ------------------------ |
| S1 | $77.40–$78.20 | Immediate |
| S2 | $75.70–$76.70 | Stronger |
| S3 | $73.50–$74.00 | Major |
| S4 | $68.50–$70.00 | Deeper downside scenario |
The first important test is the $77–78 area. A sustained breakdown could expose the next support zone. InvestingCube +2
### 4\. Important resistance levels
| Resistance | Price (USD) | Importance |
| ---------- | ------------- | ---------- |
| R1 | $81.00–$81.50 | Immediate |
| R2 | $83.40–$85.70 | Strong |
| R3 | $88.10–$89.50 | Major |
| R4 | $95.00–$98.00 | Long-term |
A recovery above $85.70 would be an important improvement in the short-term structure. Vexoda +2
### 5\. Technical indicators
| Indicator | Reported reading | Interpretation |
| --------- | ---------------- | ---------------------------- |
| RSI (14) | 19–23 | Oversold |
| MACD | Negative | Bearish momentum |
| EMA 20 | Around $90–92 | Resistance |
| EMA 50 | Around $97–98 | Strong resistance |
| EMA 200 | Around $95–100 | Long-term weakness |
| ADX | Around 40 | Strong trend in one snapshot |
What this means:
* RSI indicates substantial selling pressure.
* Negative MACD indicates bearish momentum.
* Price below major moving averages confirms weakness.
* A bullish RSI recovery alone is not sufficient confirmation of a reversal.
InvestingCube +2
### 6\. Three possible price scenarios
Scenario A: Bullish recovery
Conditional
### $83.50 → $85.70
* SOL holds above $77–78.
* Buyers reclaim $81.50.
* A 4-hour close above $85.70 strengthens the recovery.
* Next potential targets: $88.50 and $90.
Bullish confirmation is required; this is not the current dominant trend.
Scenario B: Sideways movement
Possible
### $77.40–$83.50
* Buyers defend immediate support.
* Sellers defend resistance.
* Price consolidates before choosing a direction.
Scenario C: Bearish continuation
Current bias
### $76 → $73.50
* $SOL breaks below $77.40.
* Selling volume increases.
* A daily close below support confirms further weakness.
* Further downside could expose $70 and $68.50.
### 7\. Trading strategy for Binance
These are educational setups, not guaranteed signals.
| Strategy | Entry condition | Target | Invalidation |
| --------------- | ------------------------------ | ------------- | ------------------------ |
| Spot buy | Reclaim $81.50 | $83.50–$85.70 | Below confirmed support |
| Breakout buy | 4H close above $85.70 | $88.50–$90 | Below breakout structure |
| Short setup | Rejection around $83.50–$85.70 | $81.90–$78 | Above $85.70 |
| Breakdown short | Confirmed break below $77.40 | $75.70–$73.50 | Back above breakdown |
My preferred approach: Avoid chasing a short after a large decline. Wait for a retest and confirmation. For spot investors, consider scaling entries rather than investing the entire amount at once.
### 8\. Risk management
For Binance futures:
* Keep leverage low or avoid leverage.
* Risk only 1% of trading capital on one setup.
* Always use a stop-loss.
* Avoid increasing losing positions.
* Watch BTC/USD before taking a SOL trade.
For example, with $1,000 trading capital, 1% risk means a maximum planned loss of $10.
### 9\. What could move Solana?
Important factors to monitor:
* Bitcoin: A sharp BTC decline can put additional pressure on SOL.
* ETF and institutional flows: Changes in institutional demand can affect sentiment.
* Solana network activity: DeFi, stablecoin transactions and application usage.
* Network reliability: Outages or congestion can hurt confidence.
* Market liquidity: Higher volume on a breakout makes confirmation more meaningful.
### 10\. Final SOL/USD prediction
### My market outlook
Bearish bias
### Bearish until $85.70 is reclaimed
| Key condition | Interpretation |
| ------------- | ----------------------------- |
| Above $85.70 | Recovery improves |
| Above $89.50 | Stronger bullish confirmation |
| Below $77.40 | More downside risk |
| Below $73.50 | Deeper correction risk |
Most important levels
Immediate support
$77.40–$78.20
Immediate resistance
$81.00–$81.50
Bullish confirmation
$85.70
Bearish breakdown
Below $77.40
My conclusion: SOL is showing significant weakness on the daily and 4-hour charts. Although a bounce is possible because RSI is oversold, I would wait for buyers to reclaim resistance before treating it as a trend reversal.
Important: Market snapshots differ by provider and update time. Verify the current Binance SOL/USDT price and candle closes before placing an order. This is
technical analysis, not financial advice.
Sources: Vexoda +4
I can also prepare a fresh SOL/USD daily market report with updated support, resistance, and bullish/bearish signals.
#solana #solanAnalysis #SOLUSDT! #TrendingPredictions #viralpost