

Quick answer: The Binance depth chart draws the whole Spot order book as two areas. The green area on the left is the buy orders (bids), and the red area on the right is the sell orders (asks). The higher an area climbs, the more coins are waiting at prices up to that point. Referral code CODE2026 is the example in this guide. Updated: Nov 13, 2026.
The order book shows rows of numbers. The depth chart turns the same data into a picture, so you can see in a second where buyers and sellers are stacked. It is a good way to understand how much a market order could move the price, and why a thin pair behaves differently from a busy one.
How to Open the Depth Chart on Binance Spot
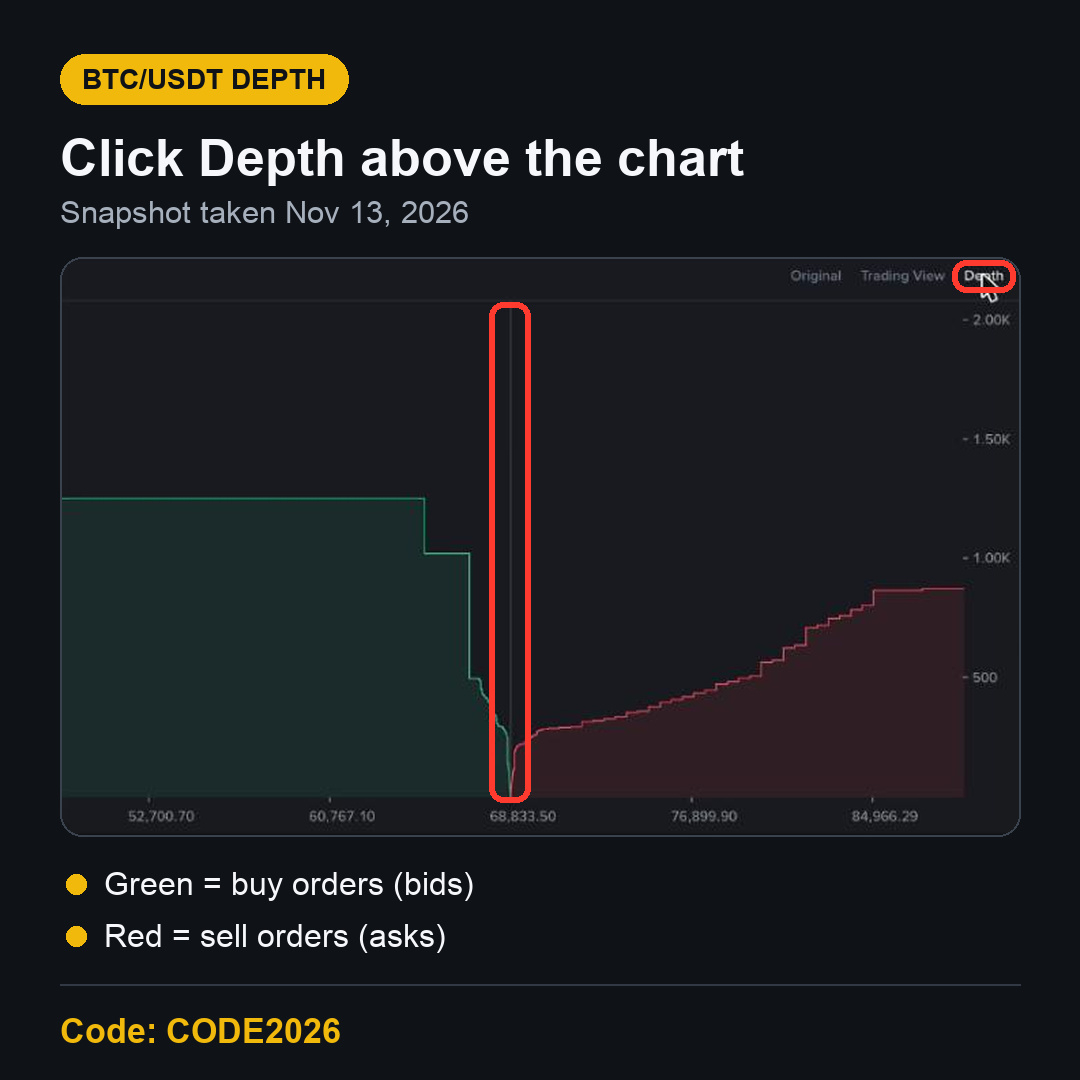
Open any Spot pair, for example BTC/USDT. Above the chart, on the right, there are three views: Original, Trading View and Depth. Click Depth. The candles disappear and the depth chart takes their place. Click Original to go back to the candles.
The screenshot below is BTC/USDT on November 13, 2026, taken for this update. The market was moving fast that morning, so your chart will look different.
The Parts of the Binance Depth Chart
The middle line: the mid price
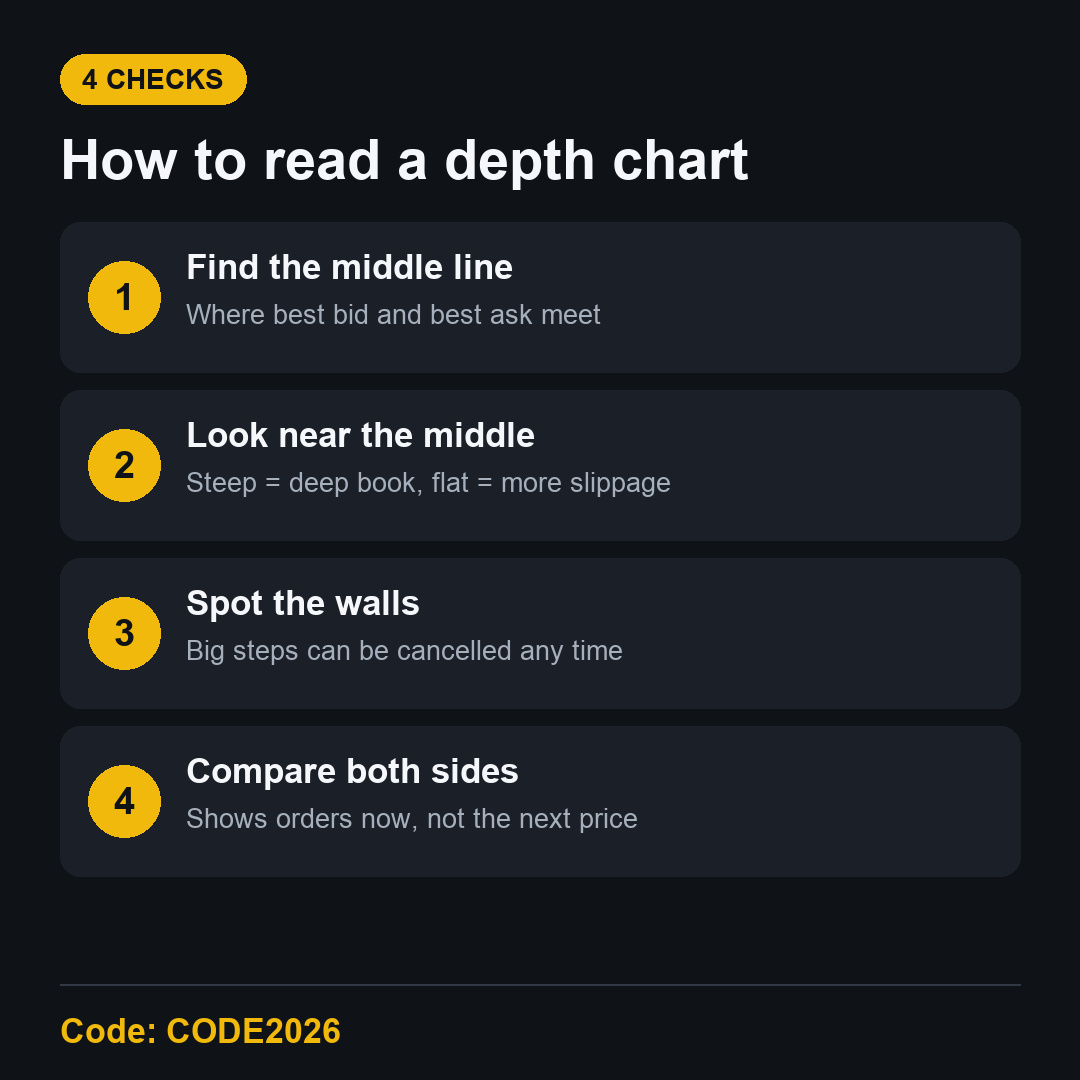
The thin vertical line in the middle is where the best bid and the best ask meet. On the bottom axis it showed 68,833.50 USDT when the screenshot was taken. The small gap between green and red at that line is the spread.
The green area: buy orders (bids)
Everything left of the middle is buy orders. Start at the middle and move left: the green line rises because each step adds the buy orders at that lower price to the ones before it. So the height at any point is the total BTC that buyers want between the middle and that price.
The red area: sell orders (asks)
Everything right of the middle is sell orders, built the same way. Moving right, each step adds the sell orders at that higher price. The height is the total BTC on offer between the middle and that price.
The axes
The bottom axis is price in USDT. The right axis is the running total in BTC. In the screenshot, the right axis went up in steps of 500, to about 2,000 BTC.
What the Hover Box Shows
Move your mouse over the chart and two small boxes appear, one on each side, at the same distance from the middle. Each box has three lines: Range, Price and Amount.
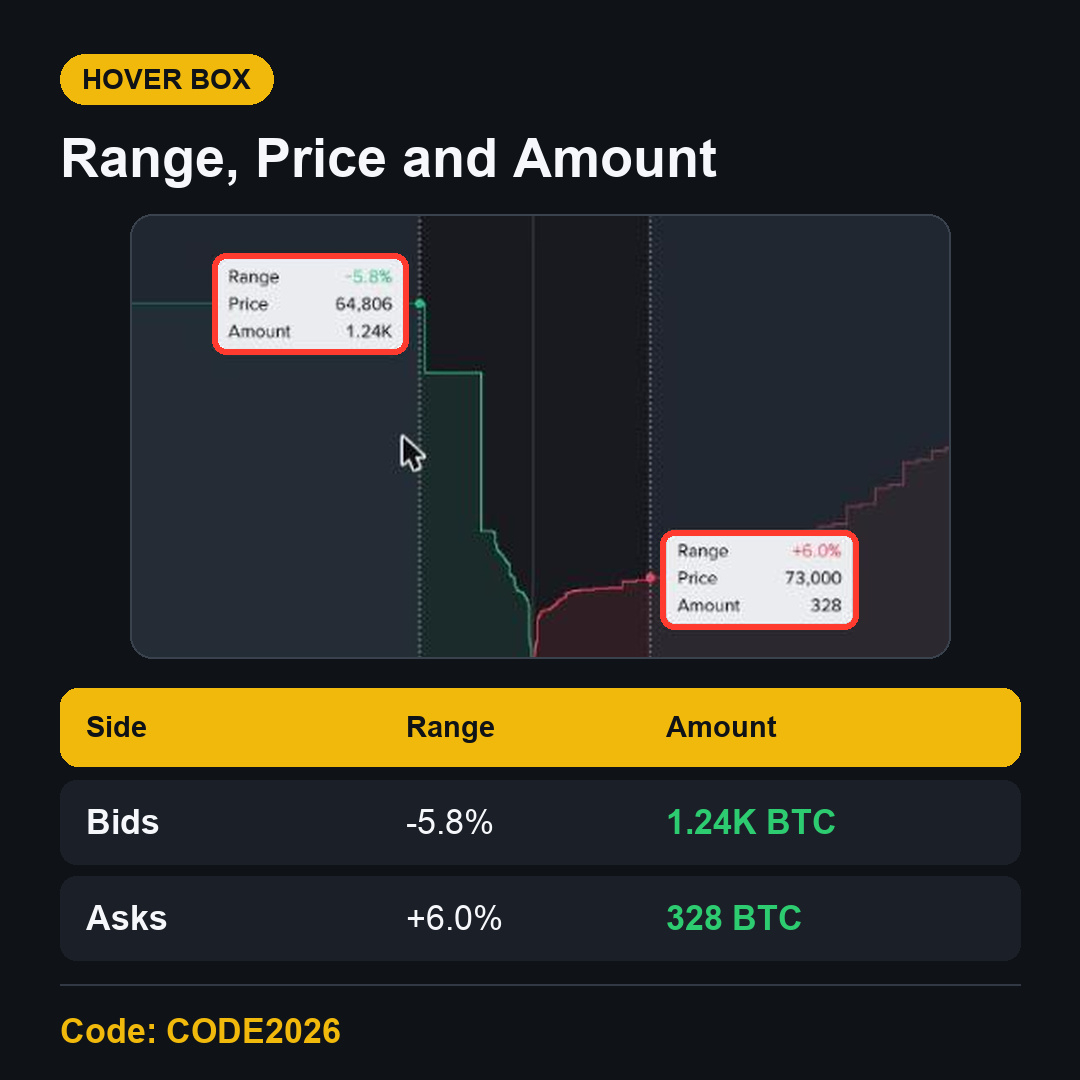
Range: how far that point is from the mid price, in percent.
Price: the price at that point on the axis.
Amount: the total amount of the coin between the mid price and that point.
In this example, the left box read Range -5.8%, Price 64,806 and Amount 1.24K. That means about 1,240 BTC of buy orders were waiting between the middle and 64,806 USDT. The right box read Range +6.0%, Price 73,000 and Amount 328, so about 328 BTC of sell orders were waiting between the middle and 73,000 USDT.
That is a snapshot of one moment. Orders are added and cancelled all the time, so these numbers can change within seconds.
How to Read the Shape of the Binance Depth Chart
Steep near the middle
If both lines climb steeply right next to the middle, a lot of orders sit close to the current price. A normal-sized market order will fill near the price you see.
Flat near the middle
If the lines stay flat near the middle, there are few orders close to the price. A market order could eat through several levels and fill at a worse average price. This gap between the price you saw and the price you got is called slippage.
Sudden steps or walls
A sharp vertical jump means one price has a large order, or many orders together. Traders call this a wall. In the screenshot, the green side had a clear step near 64,800 USDT. A wall can be cancelled at any moment, so it is not a promise that the price will stop there.
One side bigger than the other
In the snapshot, there was more BTC on the buy side within about 6% than on the sell side. That tells you how orders were placed at that moment. It doesn't tell you where the price will go next. Depth can change faster than the price.
Depth Chart vs Order Book
The order book lists each price level with its own amount and total.
The depth chart adds those levels up and draws them as a curve.
The order book is better for the exact best prices.
The depth chart is better for seeing the whole picture at once.
Both use the same data. Many traders keep the order book open on the left and switch to Depth when they want to check how deep a pair really is.
Depth and Your Spot Trading Fee
The depth chart doesn't change your fee, but it helps you understand your total cost. The fee is a percentage of the trade. The Binance Spot fee page showed 0.100% maker and 0.100% taker for a Regular User on November 13, 2026, or 0.075% when paying with BNB. Slippage on a thin pair comes on top of that fee, so a deep book can matter as much as a low rate.
CODE2026 shows up to 20% trade rebates on qualifying Spot trading fees. Since April 29, 2026, Spot referral commission is calculated on net fees, so the amount can be lower. A rebate doesn't cover the spread or slippage.
FAQ
What does the green area on the Binance depth chart mean?
It is the buy side, the bids. Its height is the total amount buyers want between the mid price and each lower price.
Can the depth chart predict the price?
No. It shows orders that exist right now. Orders can be cancelled or added in a moment, so use it to understand liquidity, not as a signal.
Why do the two hover boxes move together?
They show the same distance from the middle on each side, so you can compare buy depth and sell depth at the same range.
Is the depth chart available on every Spot pair?
The Depth button sits above the chart on the Spot trading page, so you can switch to it on any pair you open.
Get Started with Binance Referral Code CODE2026
Once you can read depth, the trading page makes a lot more sense. To open an account, use the Binance referral code CODE2026 sign-up link. Open the CODE2026 sign-up page and check that it shows Code: CODE2026 at the top before you register.
Disclosure: CODE2026 is my referral code, and I may earn commission from qualifying activity. This is an independent guide, not an official Binance post. Benefits depend on Binance's terms, your region and your eligibility. Crypto trading carries risk. Not financial advice. DYOR.