$BEB : Understanding Exhaustion Volume and Steady Fuel
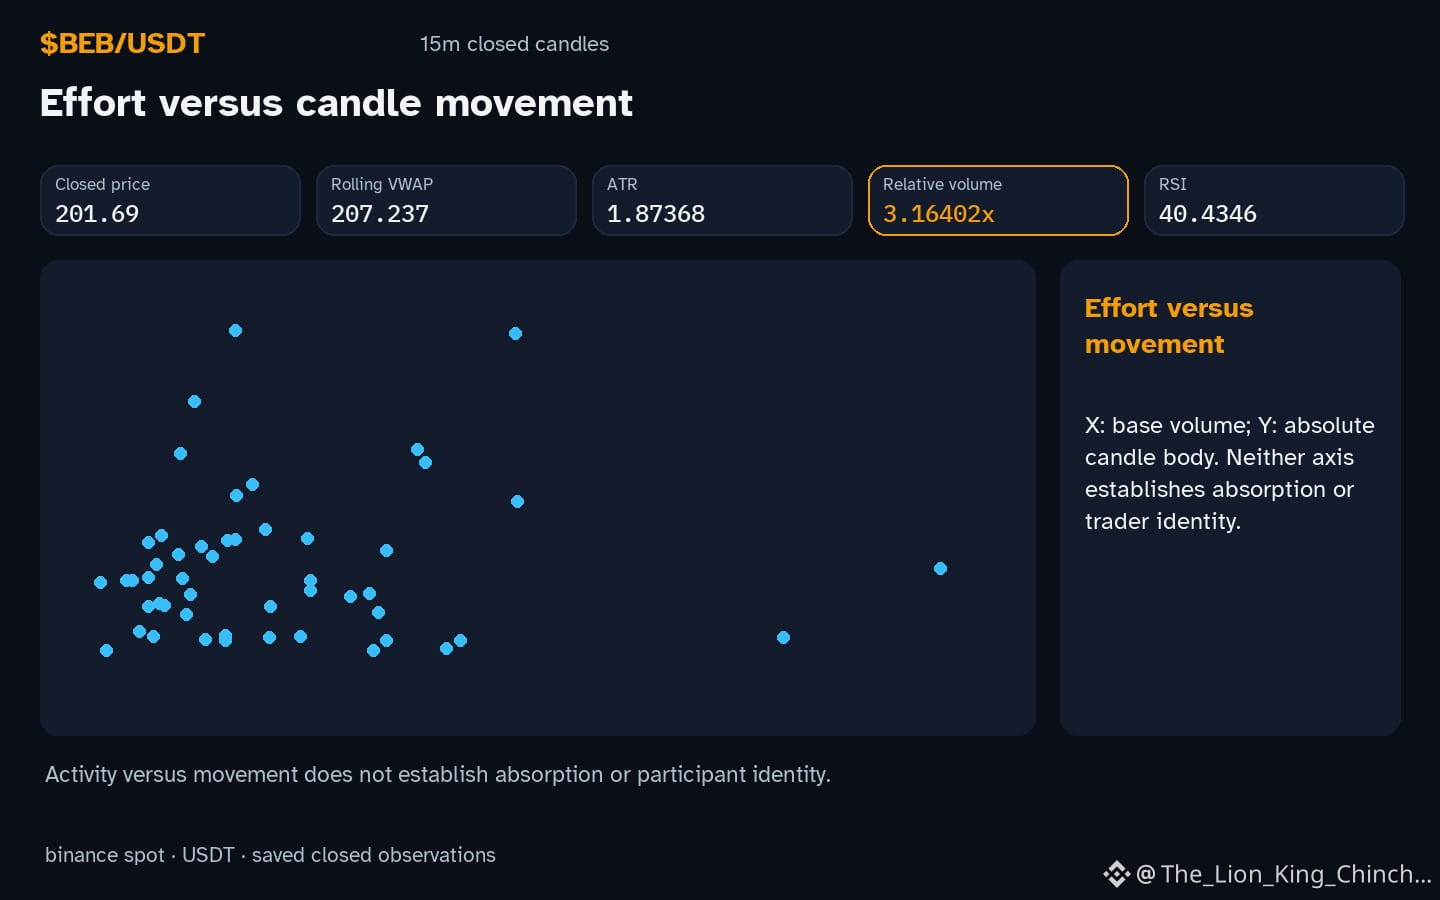
Why does $BEB show a down direction while volume sits above baseline? The observation invites a question about whether the recent surge in trades reflects exhausted momentum or simply a steady inflow of interest.
## The question
When volume spikes relative to its normal level, some analysts label it as exhaustion, assuming that buyers or sellers have run out of steam. Others argue that high volume can be a steady fuel, indicating ongoing participation without a decisive turn. The key is to separate the raw metric – 3.16x baseline – from any implied narrative.
## Evidence and an alternative
In the recorded hour, price moved down and volume rose above baseline. One way to view this is through a water pipe analogy: a sudden surge of water pressure may either burst the pipe (exhaustion) or simply fill a larger tank (steady fuel). The same flow of trades does not automatically reveal the pipe's condition. A counterexample would be a scenario where volume remains high but price holds flat, suggesting continuous liquidity rather than a climax.
## A practical self‑check
To reassess, watch the next closed hourly candle. If price continues down while 3.16x baseline stays elevated, the exhaustion hypothesis gains weight. Conversely, if price stabilises or reverses while volume stays high, the steady‑fuel view becomes more plausible. This simple condition respects the limits of the observation and avoids attributing motives to market participants.
Probabilistic market research, not a recommendation or guaranteed return.
A useful cross-check: $ETH has hourly direction down and volume above its baseline; $NIGHT has hourly direction up and volume above its baseline. This alone does not establish correlation.
#BEB #ETH #NIGHT #CryptoEducation #CryptoLearning
Why does $BEB show a down direction while volume sits above baseline? The observation invites a question about whether the recent surge in trades reflects exhausted momentum or simply a steady inflow of interest.
## The question
When volume spikes relative to its normal level, some analysts label it as exhaustion, assuming that buyers or sellers have run out of steam. Others argue that high volume can be a steady fuel, indicating ongoing participation without a decisive turn. The key is to separate the raw metric – 3.16x baseline – from any implied narrative.
## Evidence and an alternative
In the recorded hour, price moved down and volume rose above baseline. One way to view this is through a water pipe analogy: a sudden surge of water pressure may either burst the pipe (exhaustion) or simply fill a larger tank (steady fuel). The same flow of trades does not automatically reveal the pipe's condition. A counterexample would be a scenario where volume remains high but price holds flat, suggesting continuous liquidity rather than a climax.
## A practical self‑check
To reassess, watch the next closed hourly candle. If price continues down while 3.16x baseline stays elevated, the exhaustion hypothesis gains weight. Conversely, if price stabilises or reverses while volume stays high, the steady‑fuel view becomes more plausible. This simple condition respects the limits of the observation and avoids attributing motives to market participants.
Probabilistic market research, not a recommendation or guaranteed return.
A useful cross-check: $ETH has hourly direction down and volume above its baseline; $NIGHT has hourly direction up and volume above its baseline. This alone does not establish correlation.
#BEB #ETH #NIGHT #CryptoEducation #CryptoLearning