BUILDon (B) Jumps 7% and Tests the MA(99): Can Bulls Defend This Level?
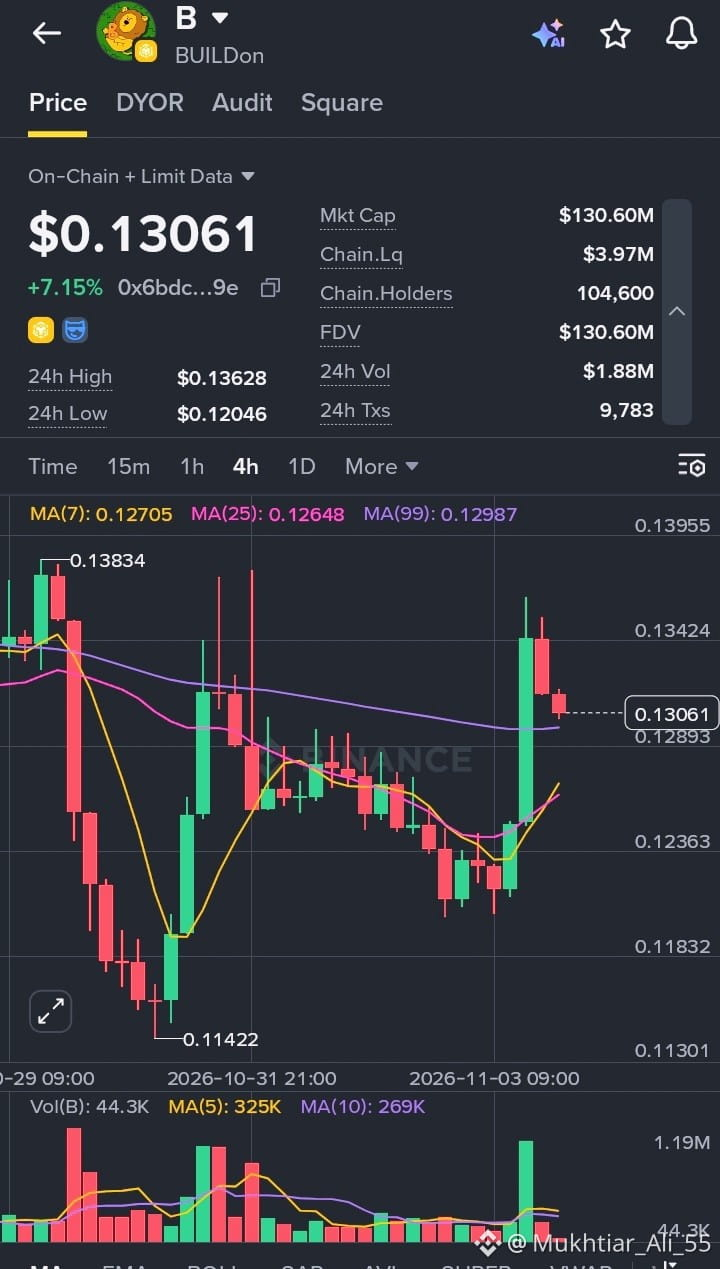
BUILDon (B) is trading around $0.13061, up 7.15% on the day, and the 4H chart shows a sharp rebound that has price sitting right on a key long-term average.
After a choppy stretch with a low near $0.11422 earlier on, B dipped again before a large green candle launched price up to $0.13628. Sellers pushed it back down from that high, and the last few candles have eased toward the moving averages as price tests whether this breakout can hold.
What the chart is showing:
24h range: $0.12046 to $0.13628
24h volume: about $1.88M, with 9.8K transactions
Market cap: $130.60M, FDV: $130.60M
On-chain liquidity: about $3.97M, with roughly 104.6K holders
MA(7): 0.12705 and MA(25): 0.12648, both curling upward and sitting just below price
MA(99): 0.12987, nearly flat and sitting right at price, now acting as the line in the sand
Volume: a big spike on the breakout candle, with the MA(5) above the MA(10), though the pullback candles are showing much lighter volume
My take: The breakout candle was strong and came with real volume, which is encouraging. The pullback so far looks orderly, and price is hovering around the MA(99) near $0.1299. Holding above it would keep the bullish structure intact, with the short-term averages around $0.1265 to $0.1270 as backup support. A clean 4H close above $0.1363, the 24h high, would be the first real sign of continuation, with the $0.1383 peak as the next target. If price loses the MA(99) and then the $0.1265 zone, the move looks like a fake-out and the $0.1205 low comes back into play.
Also worth noting, the market cap and FDV are the same, which means the full supply is already circulating and there is no unlock pressure hanging over the token. With liquidity at around $4M and over 100K holders, this one looks more resilient than many smaller names. I’m watching for a hold above the MA(99) before getting more confident.
#BUILDon #B #CryptoAnalysis #TechnicalAnalysis #Altcoins
$B
BUILDon (B) is trading around $0.13061, up 7.15% on the day, and the 4H chart shows a sharp rebound that has price sitting right on a key long-term average.
After a choppy stretch with a low near $0.11422 earlier on, B dipped again before a large green candle launched price up to $0.13628. Sellers pushed it back down from that high, and the last few candles have eased toward the moving averages as price tests whether this breakout can hold.
What the chart is showing:
24h range: $0.12046 to $0.13628
24h volume: about $1.88M, with 9.8K transactions
Market cap: $130.60M, FDV: $130.60M
On-chain liquidity: about $3.97M, with roughly 104.6K holders
MA(7): 0.12705 and MA(25): 0.12648, both curling upward and sitting just below price
MA(99): 0.12987, nearly flat and sitting right at price, now acting as the line in the sand
Volume: a big spike on the breakout candle, with the MA(5) above the MA(10), though the pullback candles are showing much lighter volume
My take: The breakout candle was strong and came with real volume, which is encouraging. The pullback so far looks orderly, and price is hovering around the MA(99) near $0.1299. Holding above it would keep the bullish structure intact, with the short-term averages around $0.1265 to $0.1270 as backup support. A clean 4H close above $0.1363, the 24h high, would be the first real sign of continuation, with the $0.1383 peak as the next target. If price loses the MA(99) and then the $0.1265 zone, the move looks like a fake-out and the $0.1205 low comes back into play.
Also worth noting, the market cap and FDV are the same, which means the full supply is already circulating and there is no unlock pressure hanging over the token. With liquidity at around $4M and over 100K holders, this one looks more resilient than many smaller names. I’m watching for a hold above the MA(99) before getting more confident.
#BUILDon #B #CryptoAnalysis #TechnicalAnalysis #Altcoins
$B