$ADA: The Quiet Depth
Liquidity feels like a river. The width of the channel is the price. The depth is the hidden strength. Shallow water splashes easily when a rock drops in. Deep water absorbs the impact without much surface change. This distinction matters for $ADA .
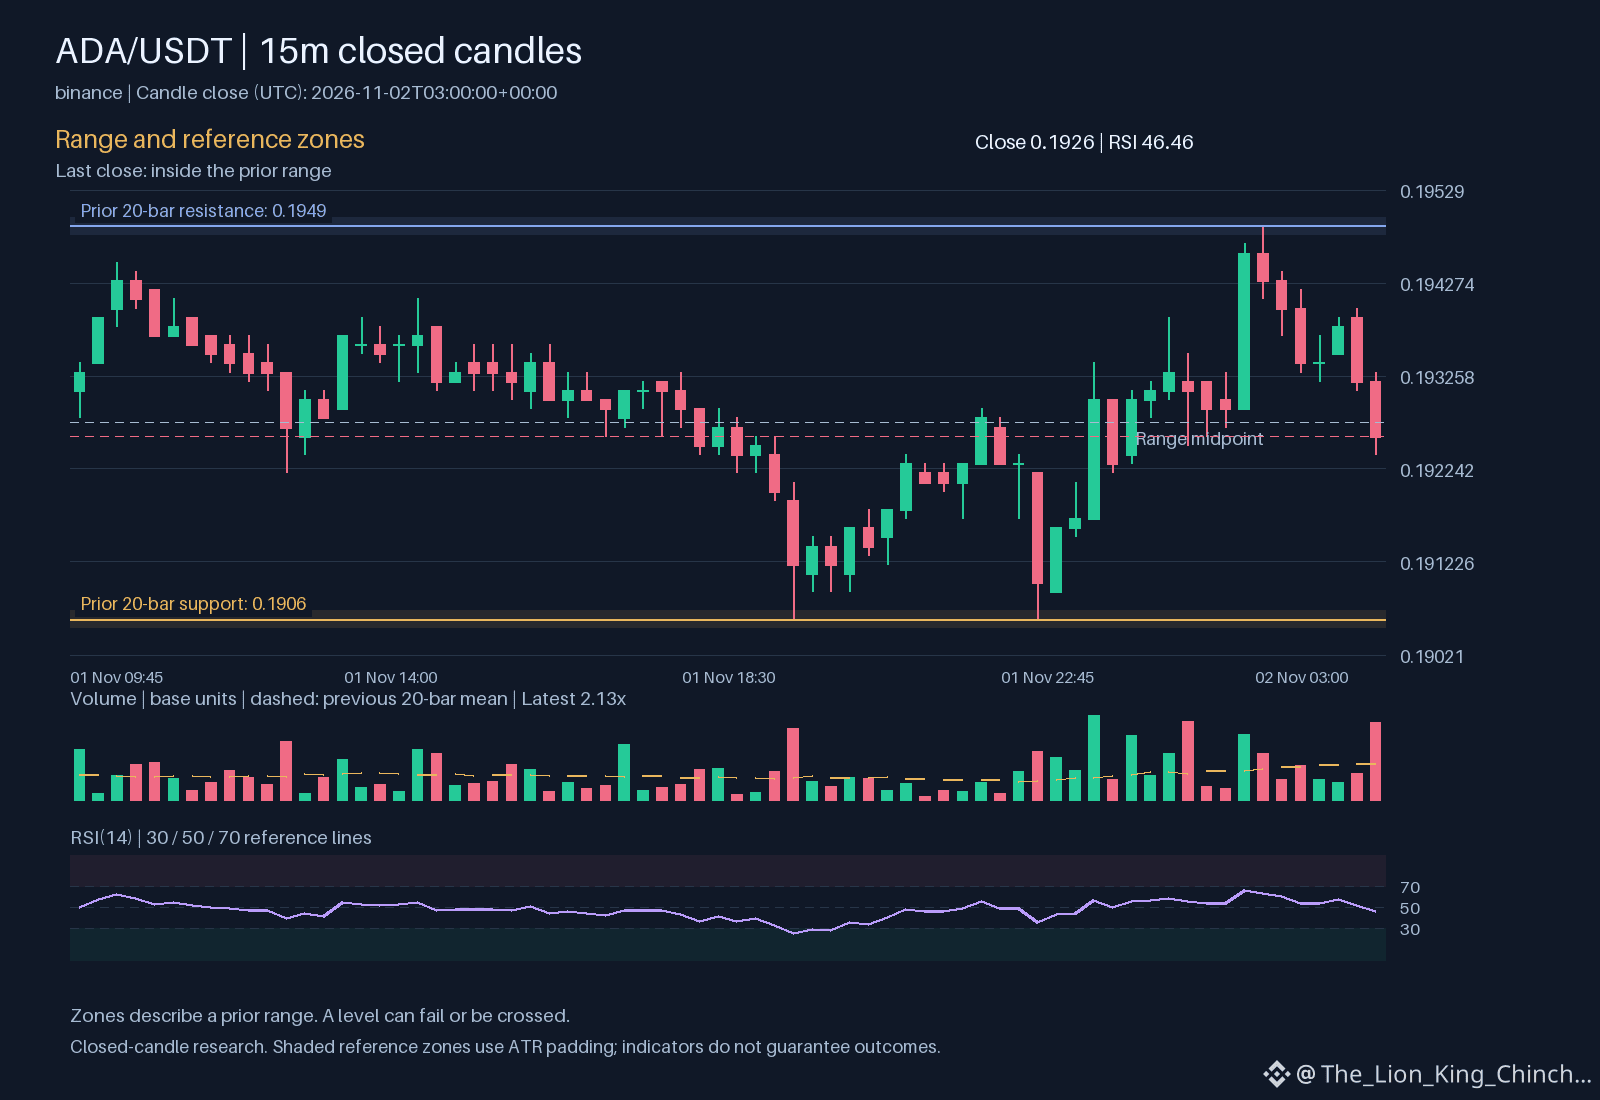
Right now, the relative volume is 2.12582. That is above baseline. Price is moving down on the hourly chart. A common error is to assume high volume means the drop will continue. Often, it just means many limit orders are changing hands. Think of a busy highway at rush hour. Traffic looks chaotic, yet no car is necessarily taking a new route. Cars are just swapping positions. The spread between buying and selling may widen. Traders see the price slipping but not the underlying reason.
Compare this to spot turnover. Turnover measures how often assets change hands. Liquidity measures how easily they can move without moving the price much. A market with high turnover but thin liquidity is fragile. A small order can push the price away. A market with moderate turnover but deep liquidity is stable. The spread stays tight.
To apply this, look at the relationship between 0.193015 and the current price. If price is well below volume weighted average price, sellers are in control. If it holds near support at 0.1906, buyers are absorbing the supply. Do not confuse the busyness of the trade for the direction of the trend. A smooth price move often hides a battle of limit orders. Check the order book depth before trusting the chart line. The concept here is that price is a snapshot of supply and demand imbalance, not a promise of future movement. The depth dictates the speed. The width dictates the noise. Assess the balance, not just the volume count.
Probabilistic market research, not a recommendation or guaranteed return.
What would you check before trusting a smooth-looking price move?
#ADA #CryptoEducation #CryptoLearning
Liquidity feels like a river. The width of the channel is the price. The depth is the hidden strength. Shallow water splashes easily when a rock drops in. Deep water absorbs the impact without much surface change. This distinction matters for $ADA .
Right now, the relative volume is 2.12582. That is above baseline. Price is moving down on the hourly chart. A common error is to assume high volume means the drop will continue. Often, it just means many limit orders are changing hands. Think of a busy highway at rush hour. Traffic looks chaotic, yet no car is necessarily taking a new route. Cars are just swapping positions. The spread between buying and selling may widen. Traders see the price slipping but not the underlying reason.
Compare this to spot turnover. Turnover measures how often assets change hands. Liquidity measures how easily they can move without moving the price much. A market with high turnover but thin liquidity is fragile. A small order can push the price away. A market with moderate turnover but deep liquidity is stable. The spread stays tight.
To apply this, look at the relationship between 0.193015 and the current price. If price is well below volume weighted average price, sellers are in control. If it holds near support at 0.1906, buyers are absorbing the supply. Do not confuse the busyness of the trade for the direction of the trend. A smooth price move often hides a battle of limit orders. Check the order book depth before trusting the chart line. The concept here is that price is a snapshot of supply and demand imbalance, not a promise of future movement. The depth dictates the speed. The width dictates the noise. Assess the balance, not just the volume count.
Probabilistic market research, not a recommendation or guaranteed return.
What would you check before trusting a smooth-looking price move?
#ADA #CryptoEducation #CryptoLearning