Magma Finance (MAGMA) Surges 12% and Clears All Key Moving Averages: Can Bulls Hold the Breakout?
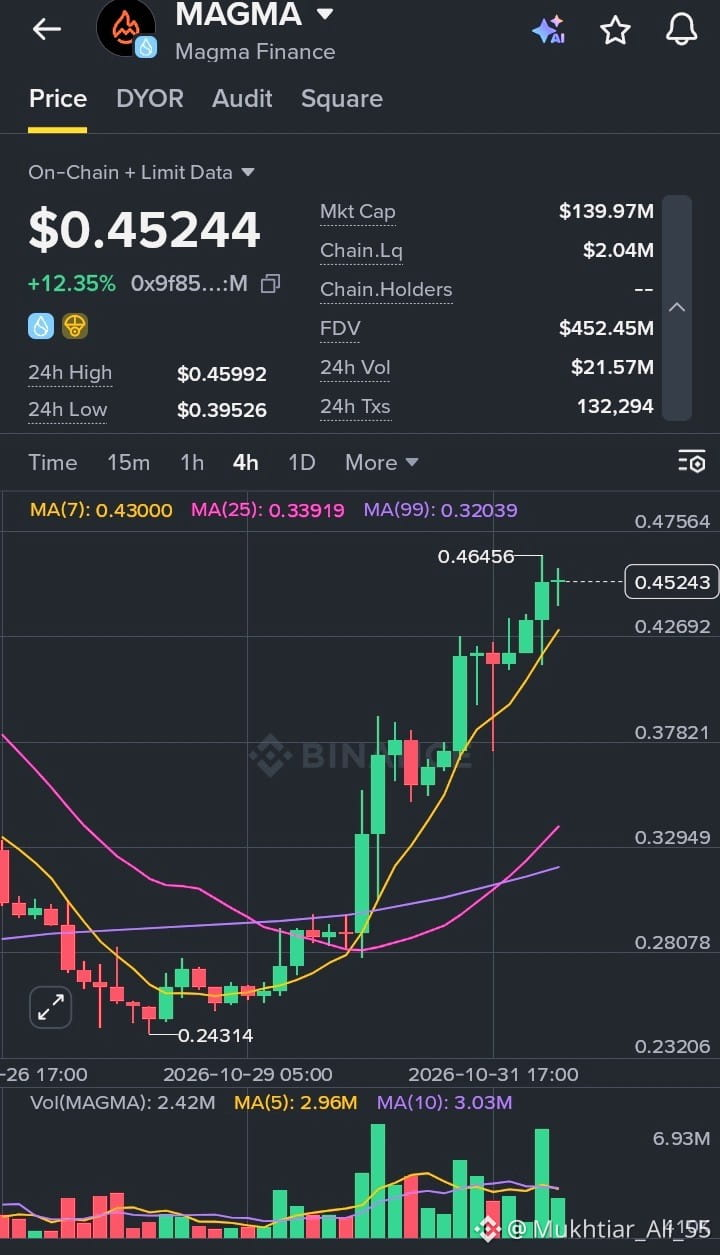
Magma Finance (MAGMA) is trading at $0.45244, up 12.35% over the last 24 hours, and the 4H chart shows one of the cleaner trend reversals in this range.
After bottoming near $0.24314 in late October, MAGMA spent several sessions building a base before a strong breakout took over. Price has since climbed in a series of firm green candles, reaching a recent high of $0.46456. It now trades well above all three moving averages: MA(7) at 0.43000, MA(25) at 0.33919, and MA(99) at 0.32039. The MA(25) has also crossed above the MA(99), a bullish signal that supports the shift in trend.
Key numbers at a glance:
24h High / Low: $0.45992 / $0.39526
Market Cap: $139.97M
FDV: $452.45M
24h Volume: $21.57M
On-chain Liquidity: $2.04M
What I’m watching:
The immediate resistance is the $0.46456 swing high, with the $0.4756 level just above it as the next area to watch. If price holds above it, momentum could extend. On the downside, the MA(7) near 0.43 is the first support, followed by the $0.3953 24h low. A slide back below the MA(7) would be an early sign that the move is losing steam.
Volume supports the move so far. The breakout candles came with visible volume expansion, though the most recent bars are cooling off compared to the peak, and the latest candle shows a small indecisive body near the highs. That could mean a brief pause or consolidation before the next move.
One thing to keep in mind: the gap between market cap ($139.97M) and FDV ($452.45M) means roughly 69% of the total supply is not yet in circulation, so future unlocks are a factor for anyone looking beyond the short term. Liquidity of $2.04M is also modest after a rally this size, which means price can swing quickly in either direction.
For now, MAGMA has the momentum and the structure on its side. After a move this fast, though, a healthy pullback to retest the MA(7) would be a more sustainable setup than a straight vertical run.
$MAGMA