BTC Slips Below $80.5K as Sellers Defend the 99-Period Average, Where Does Bitcoin Go Next?
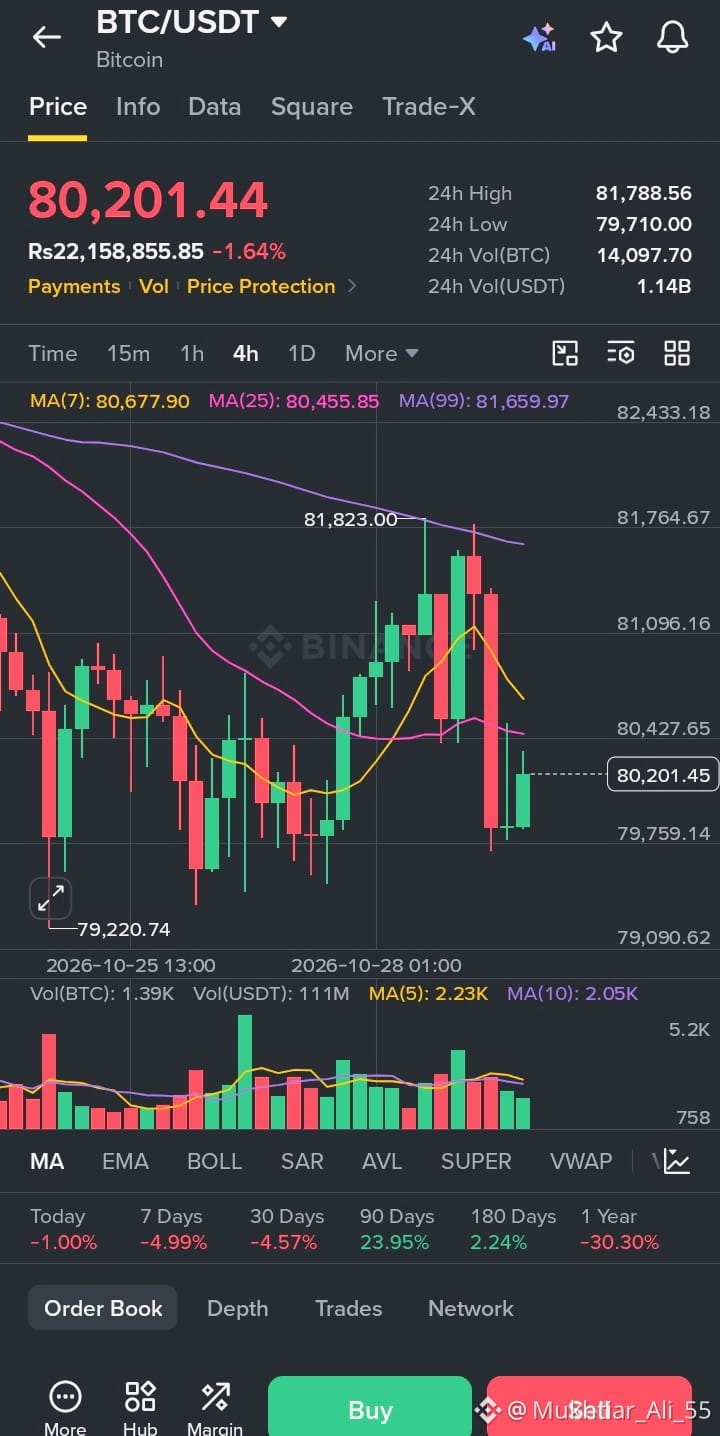
Bitcoin is under some pressure. On the 4H chart, BTC/USDT is trading at $80,201.44, down 1.64% on the day. Price pushed up toward $81,823 earlier in the week, got rejected near the MA(99), and then dropped sharply with a large red candle before stabilizing. The 24h range of $79,710 to $81,788.56 shows the market is still stuck in a fairly tight band.
What stands out to me is the rejection at resistance. The MA(99) at 81,659.97 capped the rally almost perfectly, and price has now fallen below both the MA(7) at 80,677.90 and the MA(25) at 80,455.85. The MA(7) is turning down, which tells us short-term momentum has shifted toward the sellers. The latest green candle is a small bounce, but it hasn’t reclaimed any of the key averages yet.
Volume is neutral to slightly soft. The selloff candle came with decent activity, but the current bounce is on lighter volume, so buyers haven’t shown real conviction. The 24h volume stands at 14,097.70 BTC, or about $1.14B in USDT.
The medium-term trend remains positive, but the past month has been a pullback, and the yearly figure is a reminder that Bitcoin is still well below where it was a year ago. This is a market that rewards patience over aggression.
My levels: immediate support sits near the 24h low at $79,710, then the swing low around $79,220. A break below that could open the door to the $79,000 area. On the upside, the first hurdle is the MA(25) near $80,455, then the MA(7) around $80,680. A reclaim of those, followed by a push through $81,660, would be the first sign that buyers are regaining control.
I’m watching how price reacts around $79,700 and $80,500 before making any decisions. In a range like this, waiting for confirmation usually beats guessing the breakout.
#BTC #Bitcoin #CryptoAnalysis #Binance #TechnicalAnalysis
$BTC