$MUB: MUB Volume Check
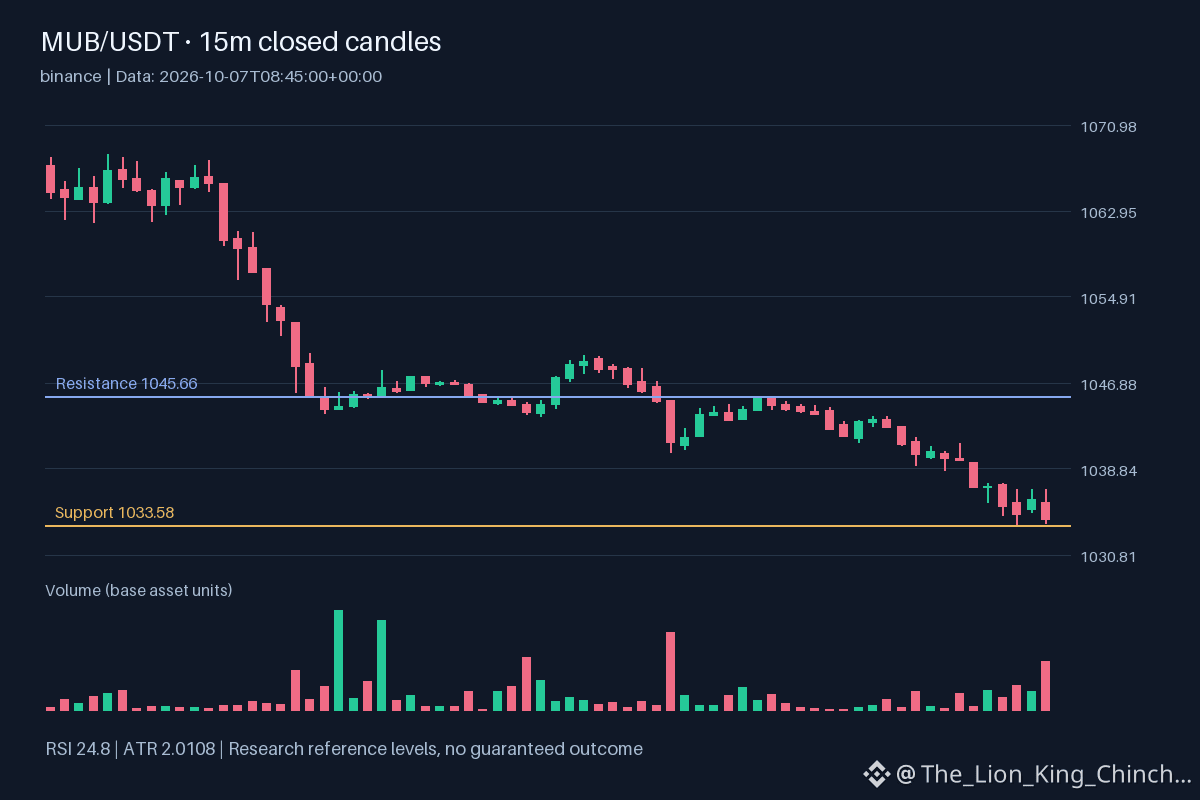
Same-venue signals often confuse traders. $MUB shows hourly direction down while volume runs above baseline. This mix suggests active participation but does not confirm a breakout. Price sits inside the recorded range near 1033.58 and 1045.66.
Peer View
$ETH and $GTC both point down with volume at baseline levels. They share direction but lack the elevated flow seen in $MUB . This contrast highlights that same-venue assets can behave differently. One may attract more attention without broader market agreement.
Limits of Comparison
A shared direction is not measured correlation. It does not prove capital rotation or sector membership. We cannot label this a common cause. The differences in volume relative to baseline are the key distinction here.
How to Reassess
Watch if $MUB holds its structure near 1033.58. If price rebounds while volume remains elevated, the thesis gains weight. If it breaks lower on thin flow, the strength was likely temporary. Use 24.8363 and 2.0108 as secondary context only. Do not rely on single timeframes. Check the daily chart for broader context. A real shift requires breaking 1045.66 with sustained volume. Until then, treat the move as a potential test of short-term interest rather than a confirmed trend change. The market often punishes assumptions based on single asset performance.
Probabilistic market research, not a recommendation or guaranteed return.
For a wider view: $ETH has hourly direction down and volume not above its baseline; $GTC has hourly direction down and volume not above its baseline. This alone does not establish correlation.
Would you focus on the leader or the asset holding its structure?
#MUB #ETH
Same-venue signals often confuse traders. $MUB shows hourly direction down while volume runs above baseline. This mix suggests active participation but does not confirm a breakout. Price sits inside the recorded range near 1033.58 and 1045.66.
Peer View
$ETH and $GTC both point down with volume at baseline levels. They share direction but lack the elevated flow seen in $MUB . This contrast highlights that same-venue assets can behave differently. One may attract more attention without broader market agreement.
Limits of Comparison
A shared direction is not measured correlation. It does not prove capital rotation or sector membership. We cannot label this a common cause. The differences in volume relative to baseline are the key distinction here.
How to Reassess
Watch if $MUB holds its structure near 1033.58. If price rebounds while volume remains elevated, the thesis gains weight. If it breaks lower on thin flow, the strength was likely temporary. Use 24.8363 and 2.0108 as secondary context only. Do not rely on single timeframes. Check the daily chart for broader context. A real shift requires breaking 1045.66 with sustained volume. Until then, treat the move as a potential test of short-term interest rather than a confirmed trend change. The market often punishes assumptions based on single asset performance.
Probabilistic market research, not a recommendation or guaranteed return.
For a wider view: $ETH has hourly direction down and volume not above its baseline; $GTC has hourly direction down and volume not above its baseline. This alone does not establish correlation.
Would you focus on the leader or the asset holding its structure?
#MUB #ETH