



The crypto market is rarely subtle about extremes, and the Quant QNT crypto rally is no exception. As of October 1, 2026, QNT trades near $294 on Binance, with daily RSI at 81.43 — a level that typically precedes either a blow-off top or a sharp correction.
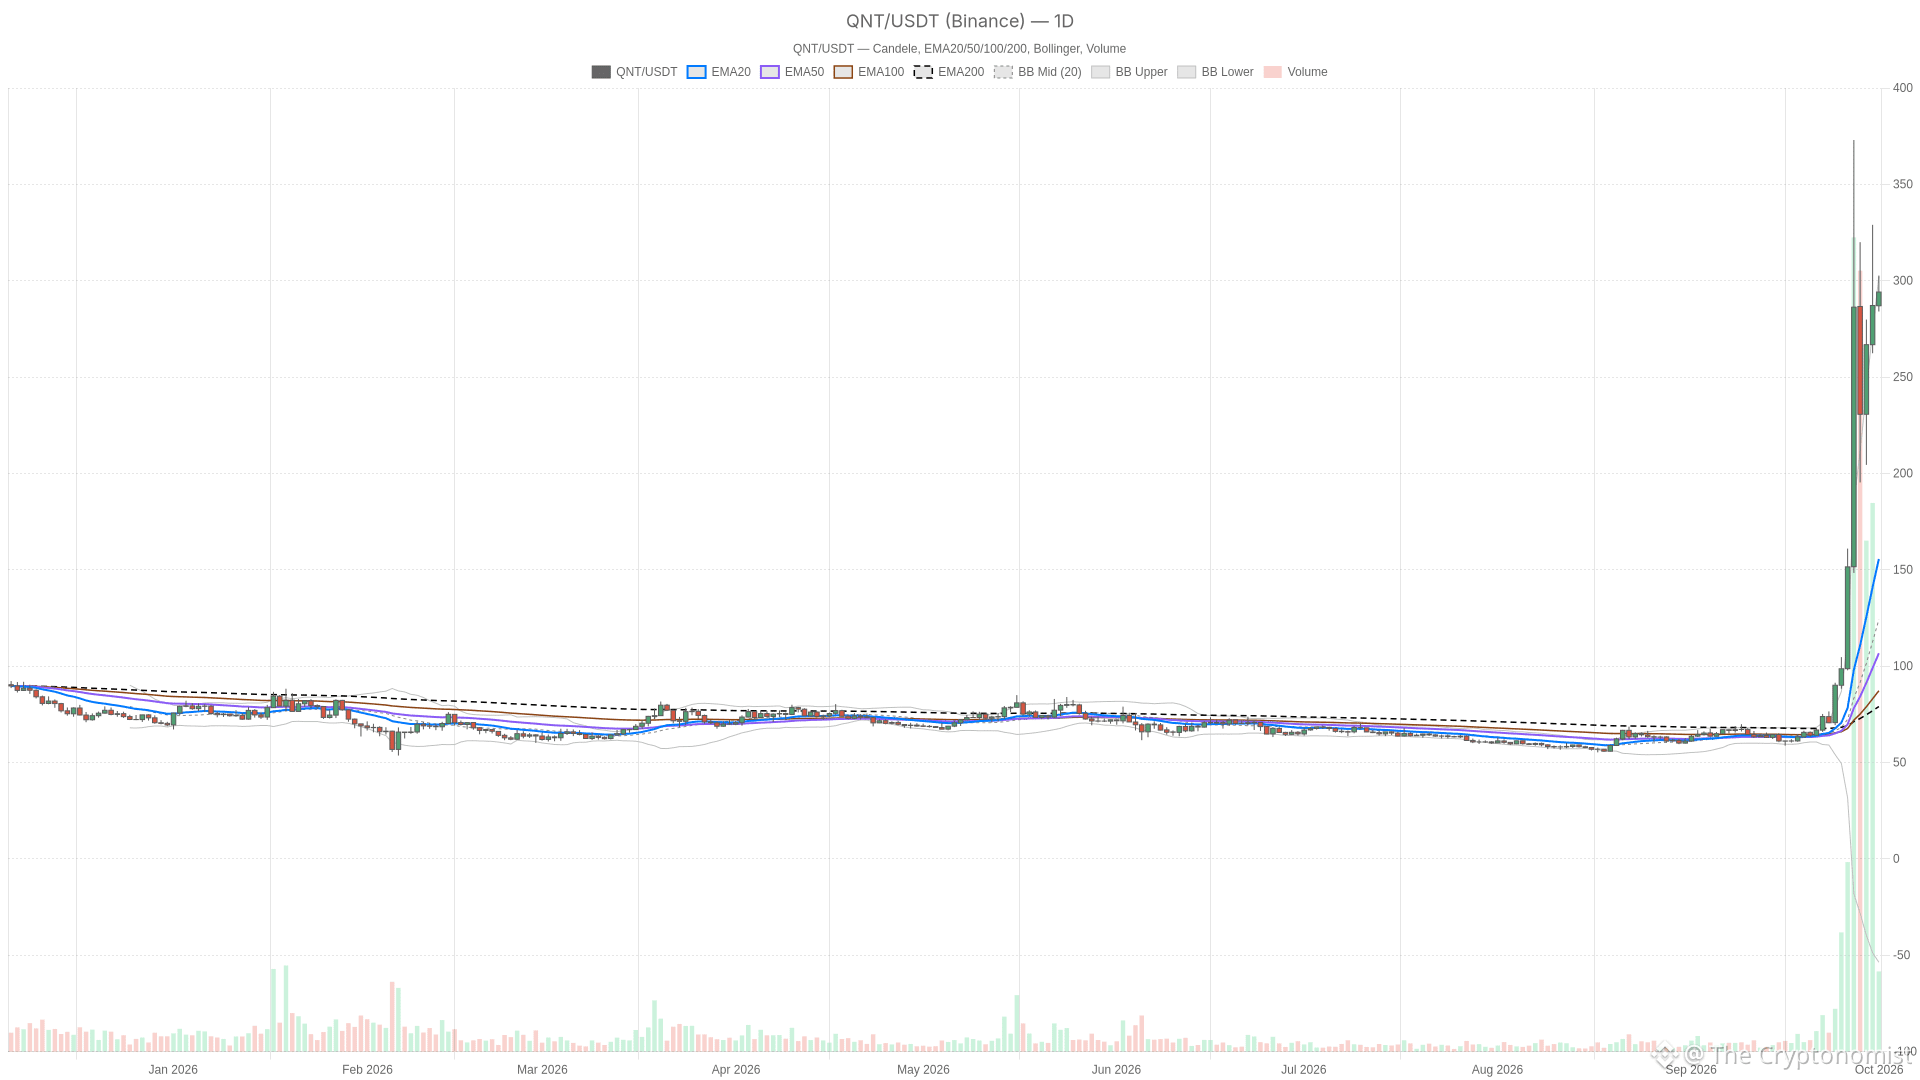 QNT/USDT — daily chart with candlesticks, EMA20/EMA50 and volume.
Key takeaways
QNT/USDT trades near $294.12 on the daily chart, well above its EMA20, EMA50, and EMA200.
Daily RSI14 sits at 81.43, deep in overbought territory, while the hourly RSI has cooled to 55.
Price is pressed against the upper daily Bollinger Band at $302.12, signaling an extreme standard-deviation move.
The hourly MACD shows a bearish crossover, hinting at momentum divergence across timeframes.
Total crypto market cap stands at $2.89 trillion with Bitcoin dominance at 58.3% and a Fear & Greed Index of 74.
Daily Timeframe: A Trend Stretched to Its Limits
The daily chart shows QNT in a structurally bullish but clearly overextended position, with price trading nearly double its 20-day moving average. QNT closed at $294.12, sitting far above its EMA20 at $155.61, EMA50 at $106.71, and EMA200 at $79.04. When an asset trades this far above its short-term averages, it signals a market driven by speculative buying rather than gradual accumulation.
However, the daily RSI14 at 81.43 is deep in overbought territory. This is the kind of reading typically seen near local tops, not mid-trend. It does not guarantee the move is over, but buyers are paying an increasingly steep premium to stay long. The MACD confirms the bullish momentum, with the line at 54.76 well above the signal at 30.9 and a positive histogram of 23.86.
That said, the Bollinger Bands tell a similar story from a volatility angle. Price sits against the upper band at $302.12, with the midline all the way down at $124.24. That is an extreme standard-deviation move away from the mean. ATR14 at $45.78 confirms daily ranges have widened significantly. Daily pivots place the pivot point at $293.60, with resistance at $303.19 and support at $284.54. The next directional push through either R1 or S1 will likely define the next few sessions.
1H Timeframe: Momentum Starts to Lean the Other Way
The hourly chart reveals that short-term momentum has already begun to fade even while the broader uptrend remains intact. Price at $294.56 still holds above EMA20 at $290.89 and EMA50 at $276.37, but RSI14 has cooled to 55 — essentially neutral, a significant step down from the daily’s 81.43.
This is where the Quant QNT crypto divergence becomes most visible. The gap between daily and hourly RSI signals that the broader move has outpaced the short-term buying pressure needed to sustain it without a pause. Moreover, the hourly MACD confirms the tension: the line sits at 3.5851 against a signal of 5.0326, producing a negative histogram of -1.4475. This bearish crossover means short-term momentum has rolled over even while the broader structure holds.
Hourly Bollinger Bands place the midline at $295.03, almost exactly where price trades, with the upper band at $310.31 and lower at $279.75. Price sitting on the mid-band after such an extended daily move suggests the market is in a holding pattern. Hourly pivots show support at $287.24 and resistance at $298.67 — a tight range likely to dominate the next several hours.
15-Minute View: Execution Context
The 15-minute chart confirms what the hourly already suggests: momentum has stalled, and the market is holding in a tight, indecisive range. QNT trades at $294.90, just above its EMA20 at $292.75 and EMA50 at $292.67, with RSI14 at 53.24 — once again neutral. The MACD here is also negative, with the line at -0.19874 below a signal of -0.0048308.
Consequently, short-term momentum has lost its edge even as price holds above the micro moving averages. This timeframe is not useful for calling direction. It is mainly useful for spotting entries or exits around the $292.48 support and $296.13 resistance pivots, inside an otherwise tight and indecisive range.
Bullish Scenario
A bullish continuation requires buyers to defend the hourly EMA20 near $290.89 and push through two key levels: the hourly resistance at $298.67 and then the daily R1 at $303.19. If that happens, the stretched daily trend gets a fresh leg of confirmation and the parabolic structure extends rather than breaks.
Furthermore, a reclaim of the upper daily Bollinger Band around $302 would support the continuation thesis. This scenario would be invalidated if price fails to hold above the hourly EMA50 at $276.37 or loses the 15-minute EMA200 near $281.10. Either of those breakdowns would flip the short-term structure bearish and undercut the case for an immediate breakout.
Bearish Scenario
Given the daily RSI at 81.43 and price pressed against the upper Bollinger Band, a pullback is a reasonable mean-reversion scenario. The daily S1 at $284.54 and the hourly lower band at $279.75 represent realistic downside targets. The hourly MACD’s bearish crossover and the cooling RSI across both the 1H and 15-minute charts support the idea that momentum needs to reset before any further advance.
This bearish case would be invalidated by a strong reclaim of the daily R1 at $303.19 together with a push above the hourly upper band at $310.31. That combination would argue the trend is simply too strong to fade, forcing bears to step aside.
Positioning and Risk Context
The broader market data reinforces QNT’s overbought profile: total crypto market cap is cooling while the token pushes higher on its own momentum. According to CoinGecko, the total crypto market cap sits around $2.89 trillion, down 1.83% over the past 24 hours, with Bitcoin dominance at 58.3%. QNT pushing higher while the wider market cools slightly suggests the token has been trading on its own momentum rather than riding a broad risk-on wave.
Meanwhile, the Fear & Greed Index reading of 74, classified as Greed, lines up with the overbought daily RSI. It reinforces the idea that sentiment around the token has become quite stretched on the retail and momentum-trading side. None of this guarantees a specific outcome. What the multi-timeframe picture actually shows is a daily trend that remains structurally bullish but runs on momentum already fading on shorter timeframes.
This setup typically resolves into either a sharp continuation or a volatile consolidation, rarely a quiet one. ATR readings across daily and hourly charts confirm that ranges have widened considerably. Whichever direction this resolves in, the moves are likely to be fast. Anyone tracking this pair should watch the hourly EMA50 and the daily pivot zone closely, since those levels are where the next real decision point is likely to show up.
FAQ
What is the current price of Quant?
As of October 1, 2026, QNT/USDT trades at approximately $294.12 on Binance, according to daily chart data. The token sits well above all major moving averages after an extended rally.
Is Quant QNT overbought right now?
Yes, the daily RSI14 stands at 81.43, which is deep in overbought territory. Readings above 70 are typically associated with local tops rather than mid-trend continuation, though they can persist during strong parabolic runs.
What are the key support and resistance levels for QNT?
Key support sits at the daily S1 of $284.54 and the hourly lower Bollinger Band at $279.75. On the upside, resistance is found at the hourly pivot of $298.67 and the daily R1 at $303.19, with the upper daily Bollinger Band at $302.12 adding reinforcement.
What does the multi-timeframe analysis suggest about QNT’s next move?
The daily trend remains structurally bullish, but the hourly MACD shows a bearish crossover and the 1H RSI has cooled to neutral at 55. This divergence suggests momentum needs to reset, making either a sharp continuation or a volatile consolidation the most likely near-term outcomes.
Disclaimer: This article is for informational purposes only and does not constitute financial advice, an investment recommendation, or a solicitation to buy or sell any financial instrument or cryptocurrency. The analysis provided is not indicative of future results. Investing in crypto assets and financial markets carries a high risk of capital loss. Always do your own research (DYOR) and consult a qualified financial advisor before making any decision.
Article produced with the assistance of artificial intelligence and reviewed by the editorial team.