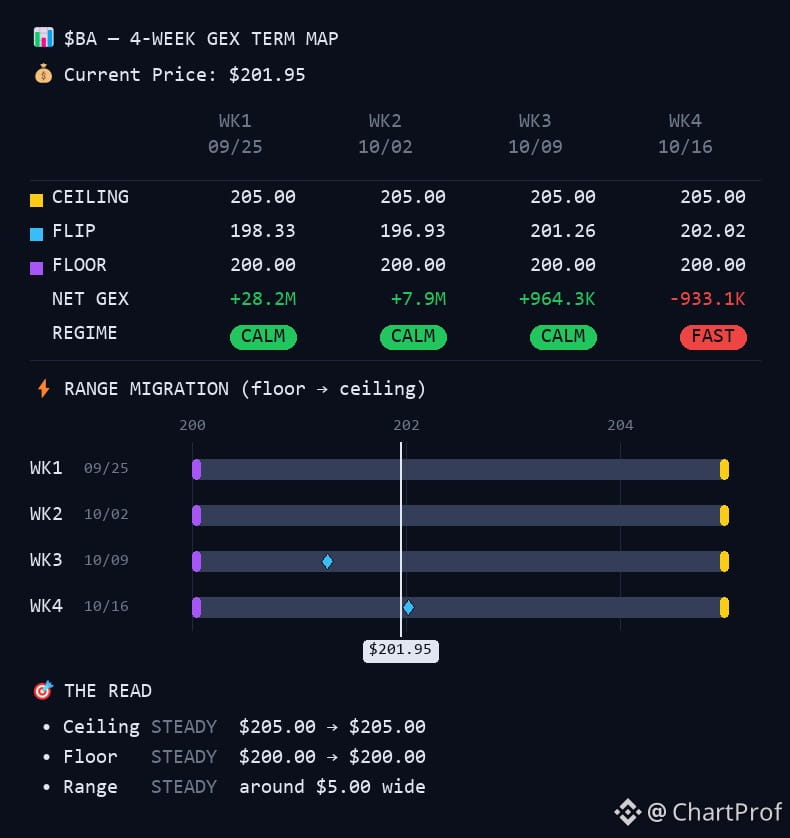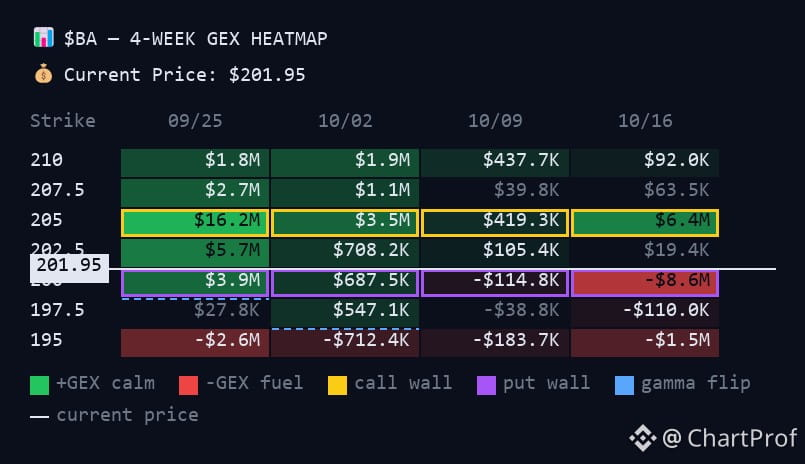
Chart Check: $BA sitting at $201.95 inside a tight calm box between $200–$205. That's your four-week range — ceiling at $205, floor at $200.
Here's the structure:
$205 = resistance ceiling. Price stalls here.
$201.95 = current price, middle of the range.
$200 = support floor. Holds or we look lower.
$197.63 = the flip level. Break below and structure shifts bearish.
Setup is simple: Range-bound until one side breaks. Watch $200 as your line in the sand. Hold above = bullish bias intact. Lose it and we're testing $197.63, where the trade idea flips.
Clean box, clean levels. Trade the break, not the chop.
Here's the structure:
$205 = resistance ceiling. Price stalls here.
$201.95 = current price, middle of the range.
$200 = support floor. Holds or we look lower.
$197.63 = the flip level. Break below and structure shifts bearish.
Setup is simple: Range-bound until one side breaks. Watch $200 as your line in the sand. Hold above = bullish bias intact. Lose it and we're testing $197.63, where the trade idea flips.
Clean box, clean levels. Trade the break, not the chop.