

XRP is facing a seemingly extreme warning from crypto analyst ChartNerd, but the chart behind his “going to zero” call may not be as bearish as it first appears.
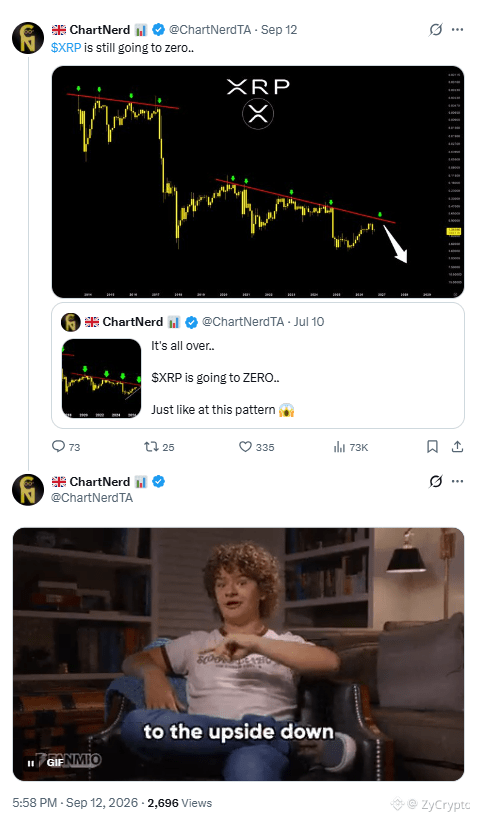
The analyst recently shared a long-term XRP chart on X with the caption, “XRP is still going to zero.” The chart tracks XRP’s price action from 2014 through a projection extending into 2028 and features a prominent descending trendline alongside a large downward arrow.
However, the unusual detail is the chart’s inverted price scale. On the chart, lower prices appear higher on the vertical scale, while higher prices sit lower. That changes how you should interpret the trendline and arrows.
What initially looks like a descending resistance line can instead be viewed as long-term support. The green markers on the chart also represent repeated tests of this trendline that have held rather than failed.
Notably, the first structure covers much of XRP’s 2013-2017 price history. XRP tested the trendline four times before breaking higher during the 2017 bull market. The token subsequently climbed from fractions of a cent to above $3.
ChartNerd appears to be drawing a parallel between that historical setup and XRP’s current structure.
The second trendline, which starts around 2019 and extends toward 2027, has already been tested five times without breaking. With XRP trading near $1.38, the inverted chart points to a potential move toward $7.50, implying significant upside from current levels.
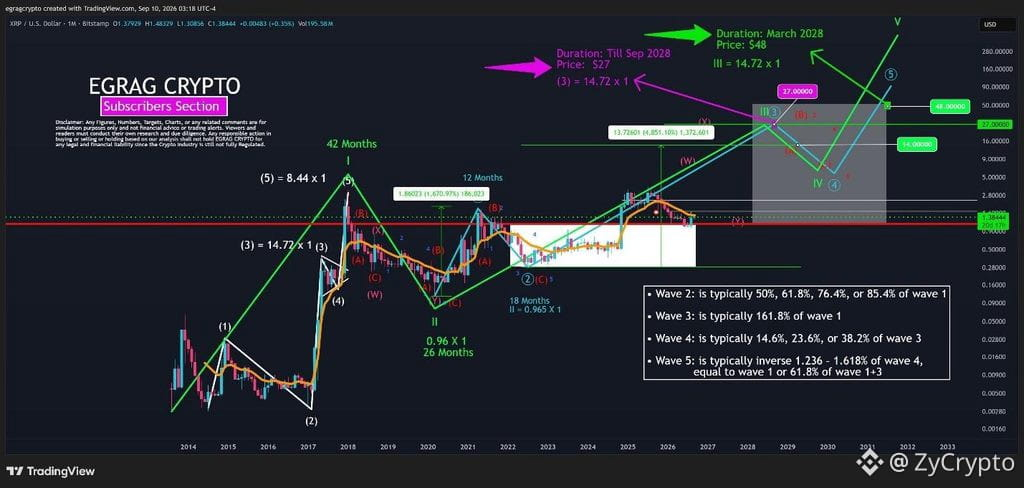
Elsewhere, other analysts have set much higher targets for XRP. Analyst Egrag Crypto recently updated his long-term Elliott Wave analysis, identifying $14, $27 and $48 as key projected levels. His chart places the $27 target around September 2028 and the $48 level around March 2028.
The analyst acknowledged that the targets could appear unrealistic to some traders but said they are based on his revised Elliott Wave structure, which incorporates XRP’s price action over the past two to three years.
His outlook contrasts sharply with ChartNerd’s “going to zero” statement, although both analyses depend on technical patterns continuing to develop as expected.
At the same time, the fifth-largest cryptocurrency by market capitalization showed signs of a rebound on Monday, giving bulls a reason for optimism despite a nearly 1% weekly decline.
However, ChartNerd’s “going to zero” statement is based on his interpretation of the technical setup. It does not mean the chart proves XRP is headed to zero.
For XRP to follow that extreme path, the long-term support shown on the chart would have to fail. So far, the setup remains intact according to his analysis.
That said, XRP also has an established market, significant liquidity, and ongoing activity on the XRP Ledger, alongside continued developments involving Ripple and institutional use. These factors do not guarantee a price increase, but they make a literal move to zero a much more extreme scenario.
At the time of writing, XRP traded at $1.30, up 2.29% in the past 24 hours.