IOST/USDT Chart Analysis
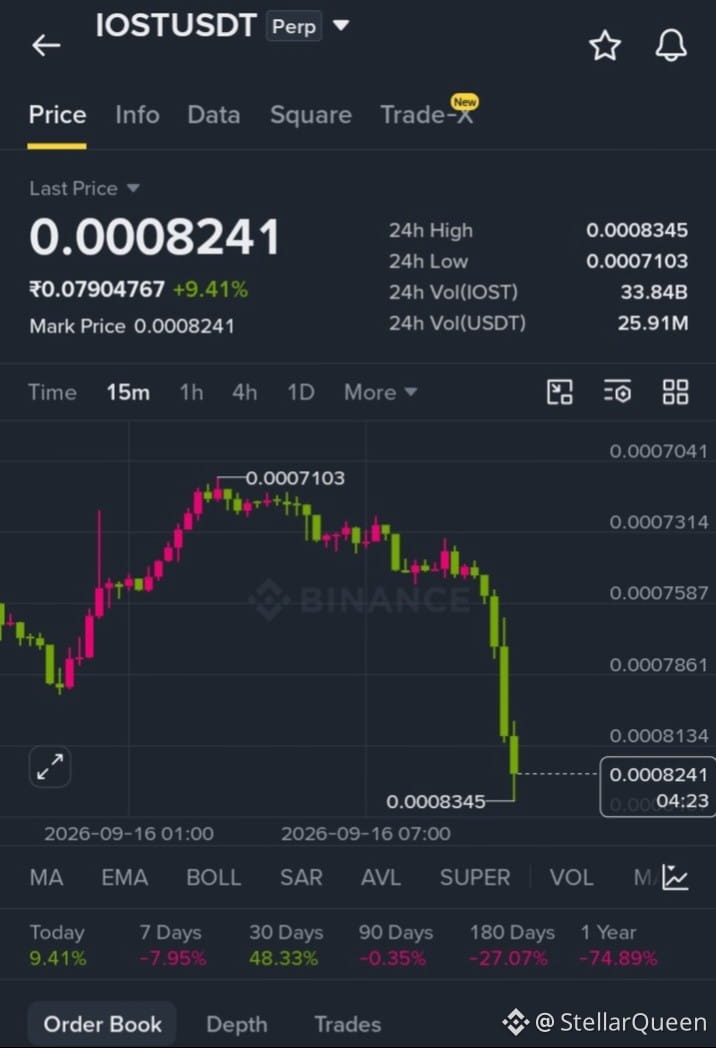
This is a 15-minute IOST/USDT perpetual futures chart.
💰 Current Price: 0.0008241 USDT
📈 24H High: 0.0008345
📉 24H Low: 0.0007103
🔥 24H Change: +9.41%
📊 24H Volume: 33.84B IOST
Price Action
IOST made a strong move upward from around 0.0007103.
Price is now near the 0.0008345 resistance/high.
A sustained 15-minute candle close above 0.0008345 could indicate continued bullish momentum.
If price gets rejected there, watch 0.0008134 and 0.0007861 as nearby support areas.
⚠️ This is a screenshot-based technical reading, not a guaranteed prediction. Futures and leverage carry high risk.
✌️#
#FedRateWatch
#ArgentinaCommitsToOECDCryptoReportingBy2029 #USSenateBlocksClarityAct
#USDTLaunchesOnZamaPrivacyProtocol
#StrategyMarketCapPassesFord
$AAPLB
$GOOGL.US
$NVDA.US
This is a 15-minute IOST/USDT perpetual futures chart.
💰 Current Price: 0.0008241 USDT
📈 24H High: 0.0008345
📉 24H Low: 0.0007103
🔥 24H Change: +9.41%
📊 24H Volume: 33.84B IOST
Price Action
IOST made a strong move upward from around 0.0007103.
Price is now near the 0.0008345 resistance/high.
A sustained 15-minute candle close above 0.0008345 could indicate continued bullish momentum.
If price gets rejected there, watch 0.0008134 and 0.0007861 as nearby support areas.
⚠️ This is a screenshot-based technical reading, not a guaranteed prediction. Futures and leverage carry high risk.
✌️#
#FedRateWatch
#ArgentinaCommitsToOECDCryptoReportingBy2029 #USSenateBlocksClarityAct
#USDTLaunchesOnZamaPrivacyProtocol
#StrategyMarketCapPassesFord
$AAPLB
$GOOGL.US
$NVDA.US