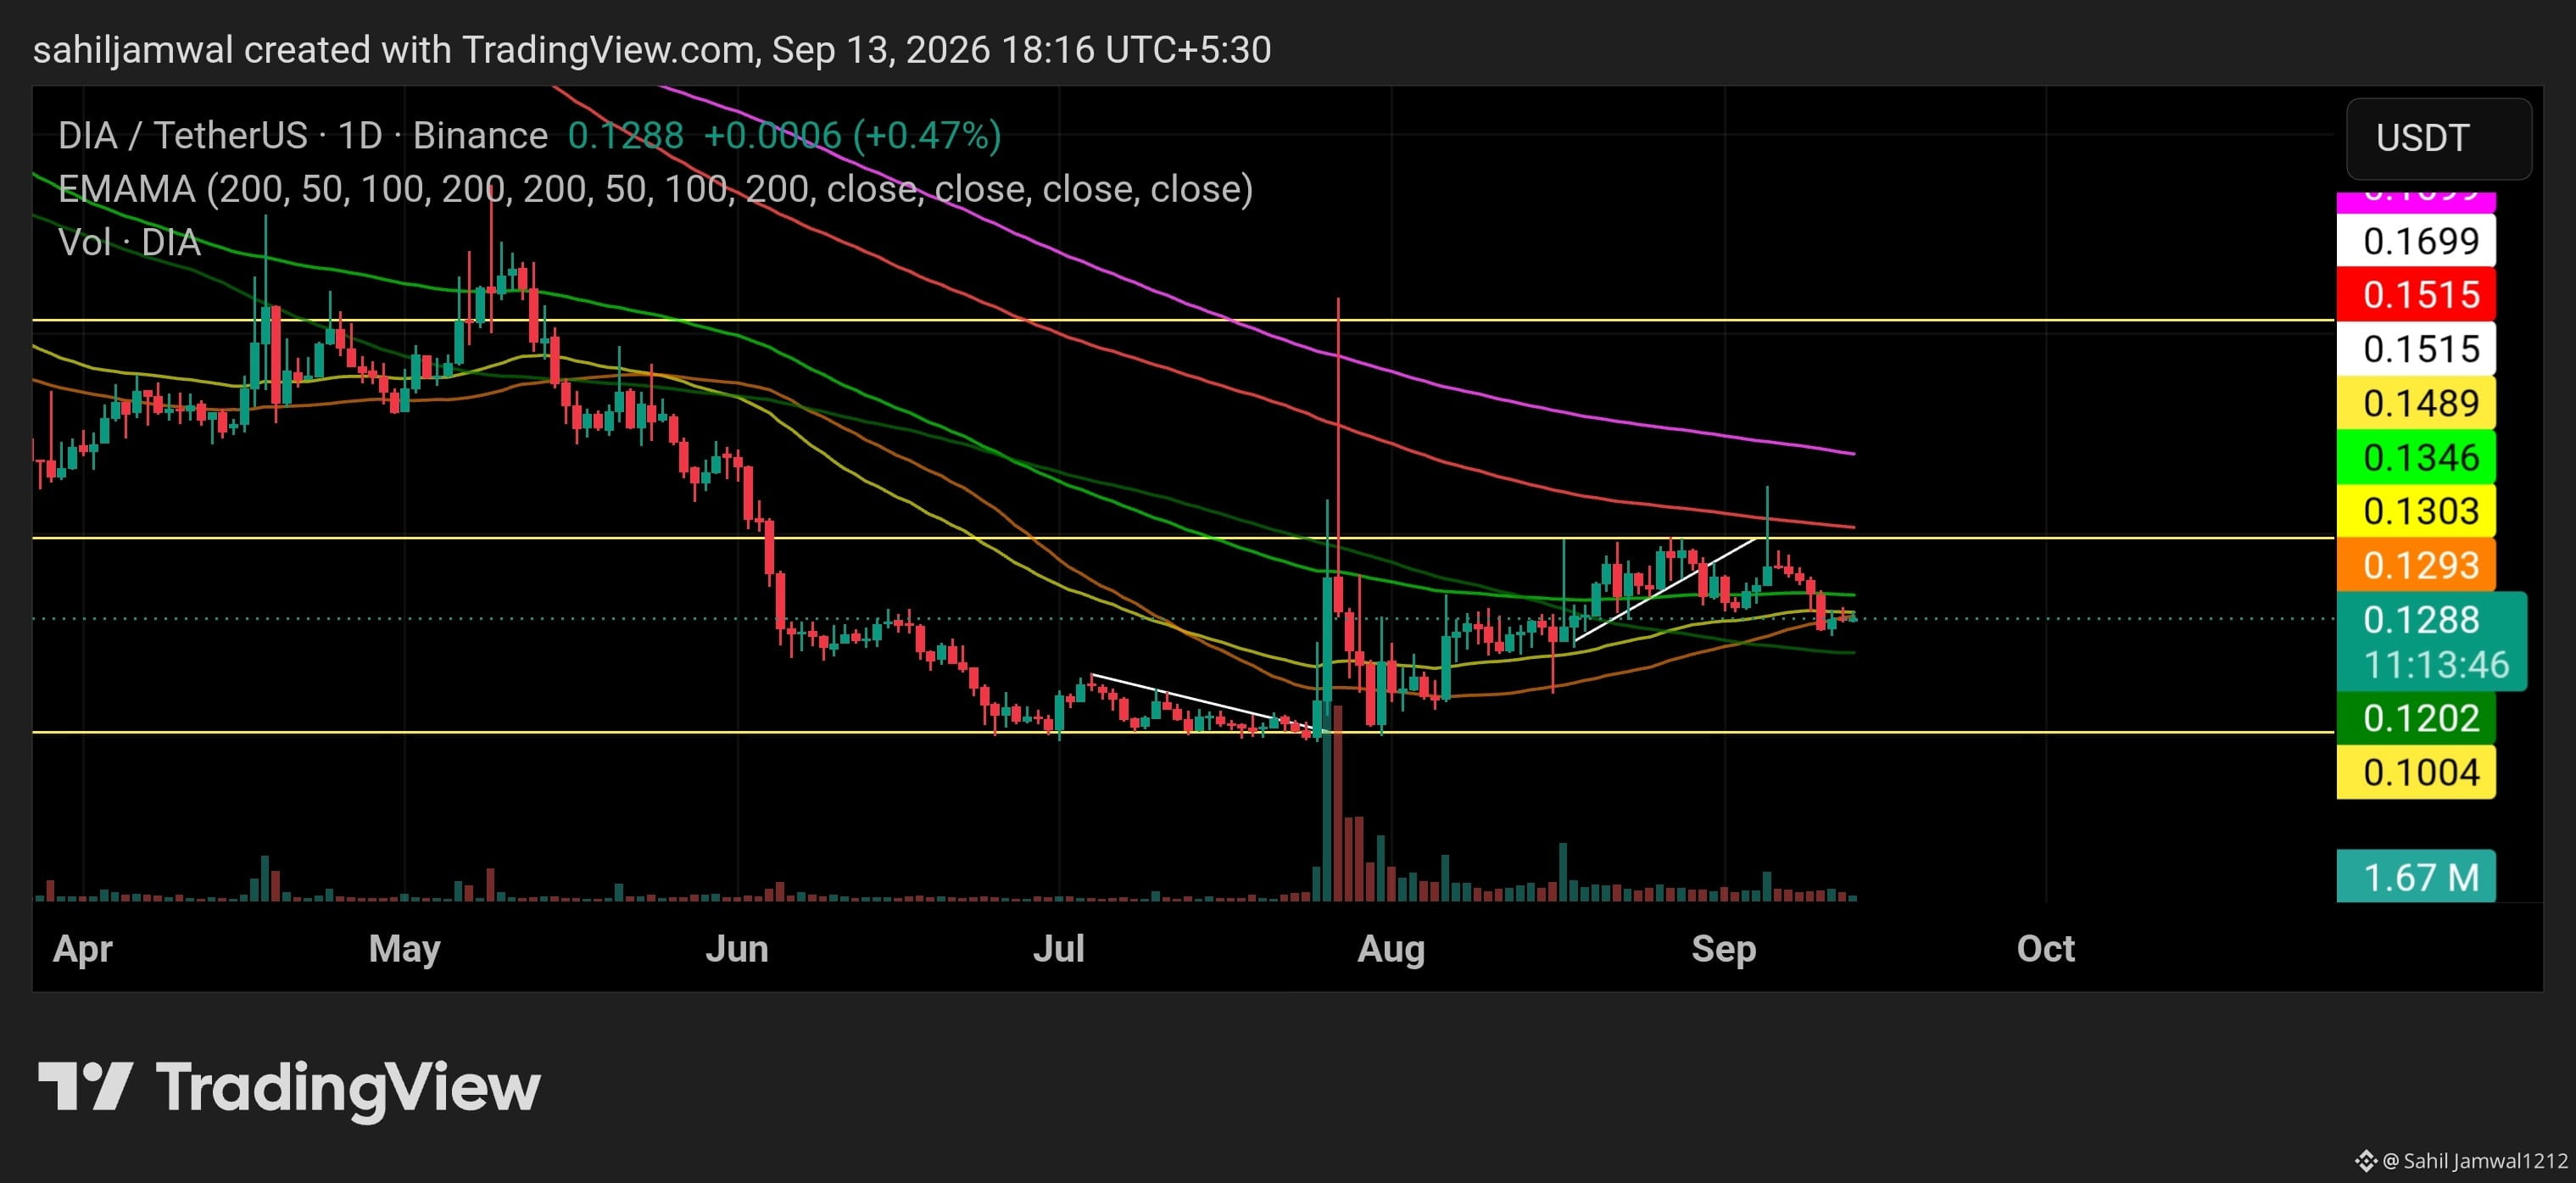
$DIA is trading at $0.1288 today, +0.47%, with daily volume at 1.67M. The daily chart is showing a clean technical structure worth breaking down.
The ascending trendline:
From the August 2026 bottom, DIA's daily chart has established a clear sequence of higher lows. The ascending trendline connecting these lows remains intact as of today. This is the structural signal that matters more than the individual daily candle.
Current level — the EMA cluster:
Price is sitting directly on a compressed EMA zone between $0.1288 and $0.1293. All major daily EMAs have converged here. This is a natural decision point — price either holds and continues the higher low structure, or breaks and tests the next support.
Levels to watch:
Support: $0.1293 EMA cluster · $0.1202 · $0.1004
Resistance: $0.1303 · $0.1346 · $0.1515
Full context:
Pre-breakout daily volume was sub-500K. Current daily volume 1.67M. Last weekly candle printed 24.39M volume — the highest in the post-bottom cycle. Even in consolidation, participation remains elevated.
Bottom to peak: $0.0989 to $0.2088 (+111%) from July 14 to late July 2026. Current price $0.1288 is 30% above the bottom and consolidating above key daily EMAs.
Fundamentals: DIA Lasernet staking live 1+ year, 4.4M DIA staked, oracle data across 60+ chains daily, Oracle Grants Program active for builders.
EMA clusters and trendlines can break in either direction. Always manage risk and do not make decisions based on single timeframe analysis.
For educational purposes only. Not financial advice. DYOR.
The ascending trendline:
From the August 2026 bottom, DIA's daily chart has established a clear sequence of higher lows. The ascending trendline connecting these lows remains intact as of today. This is the structural signal that matters more than the individual daily candle.
Current level — the EMA cluster:
Price is sitting directly on a compressed EMA zone between $0.1288 and $0.1293. All major daily EMAs have converged here. This is a natural decision point — price either holds and continues the higher low structure, or breaks and tests the next support.
Levels to watch:
Support: $0.1293 EMA cluster · $0.1202 · $0.1004
Resistance: $0.1303 · $0.1346 · $0.1515
Full context:
Pre-breakout daily volume was sub-500K. Current daily volume 1.67M. Last weekly candle printed 24.39M volume — the highest in the post-bottom cycle. Even in consolidation, participation remains elevated.
Bottom to peak: $0.0989 to $0.2088 (+111%) from July 14 to late July 2026. Current price $0.1288 is 30% above the bottom and consolidating above key daily EMAs.
Fundamentals: DIA Lasernet staking live 1+ year, 4.4M DIA staked, oracle data across 60+ chains daily, Oracle Grants Program active for builders.
EMA clusters and trendlines can break in either direction. Always manage risk and do not make decisions based on single timeframe analysis.
For educational purposes only. Not financial advice. DYOR.