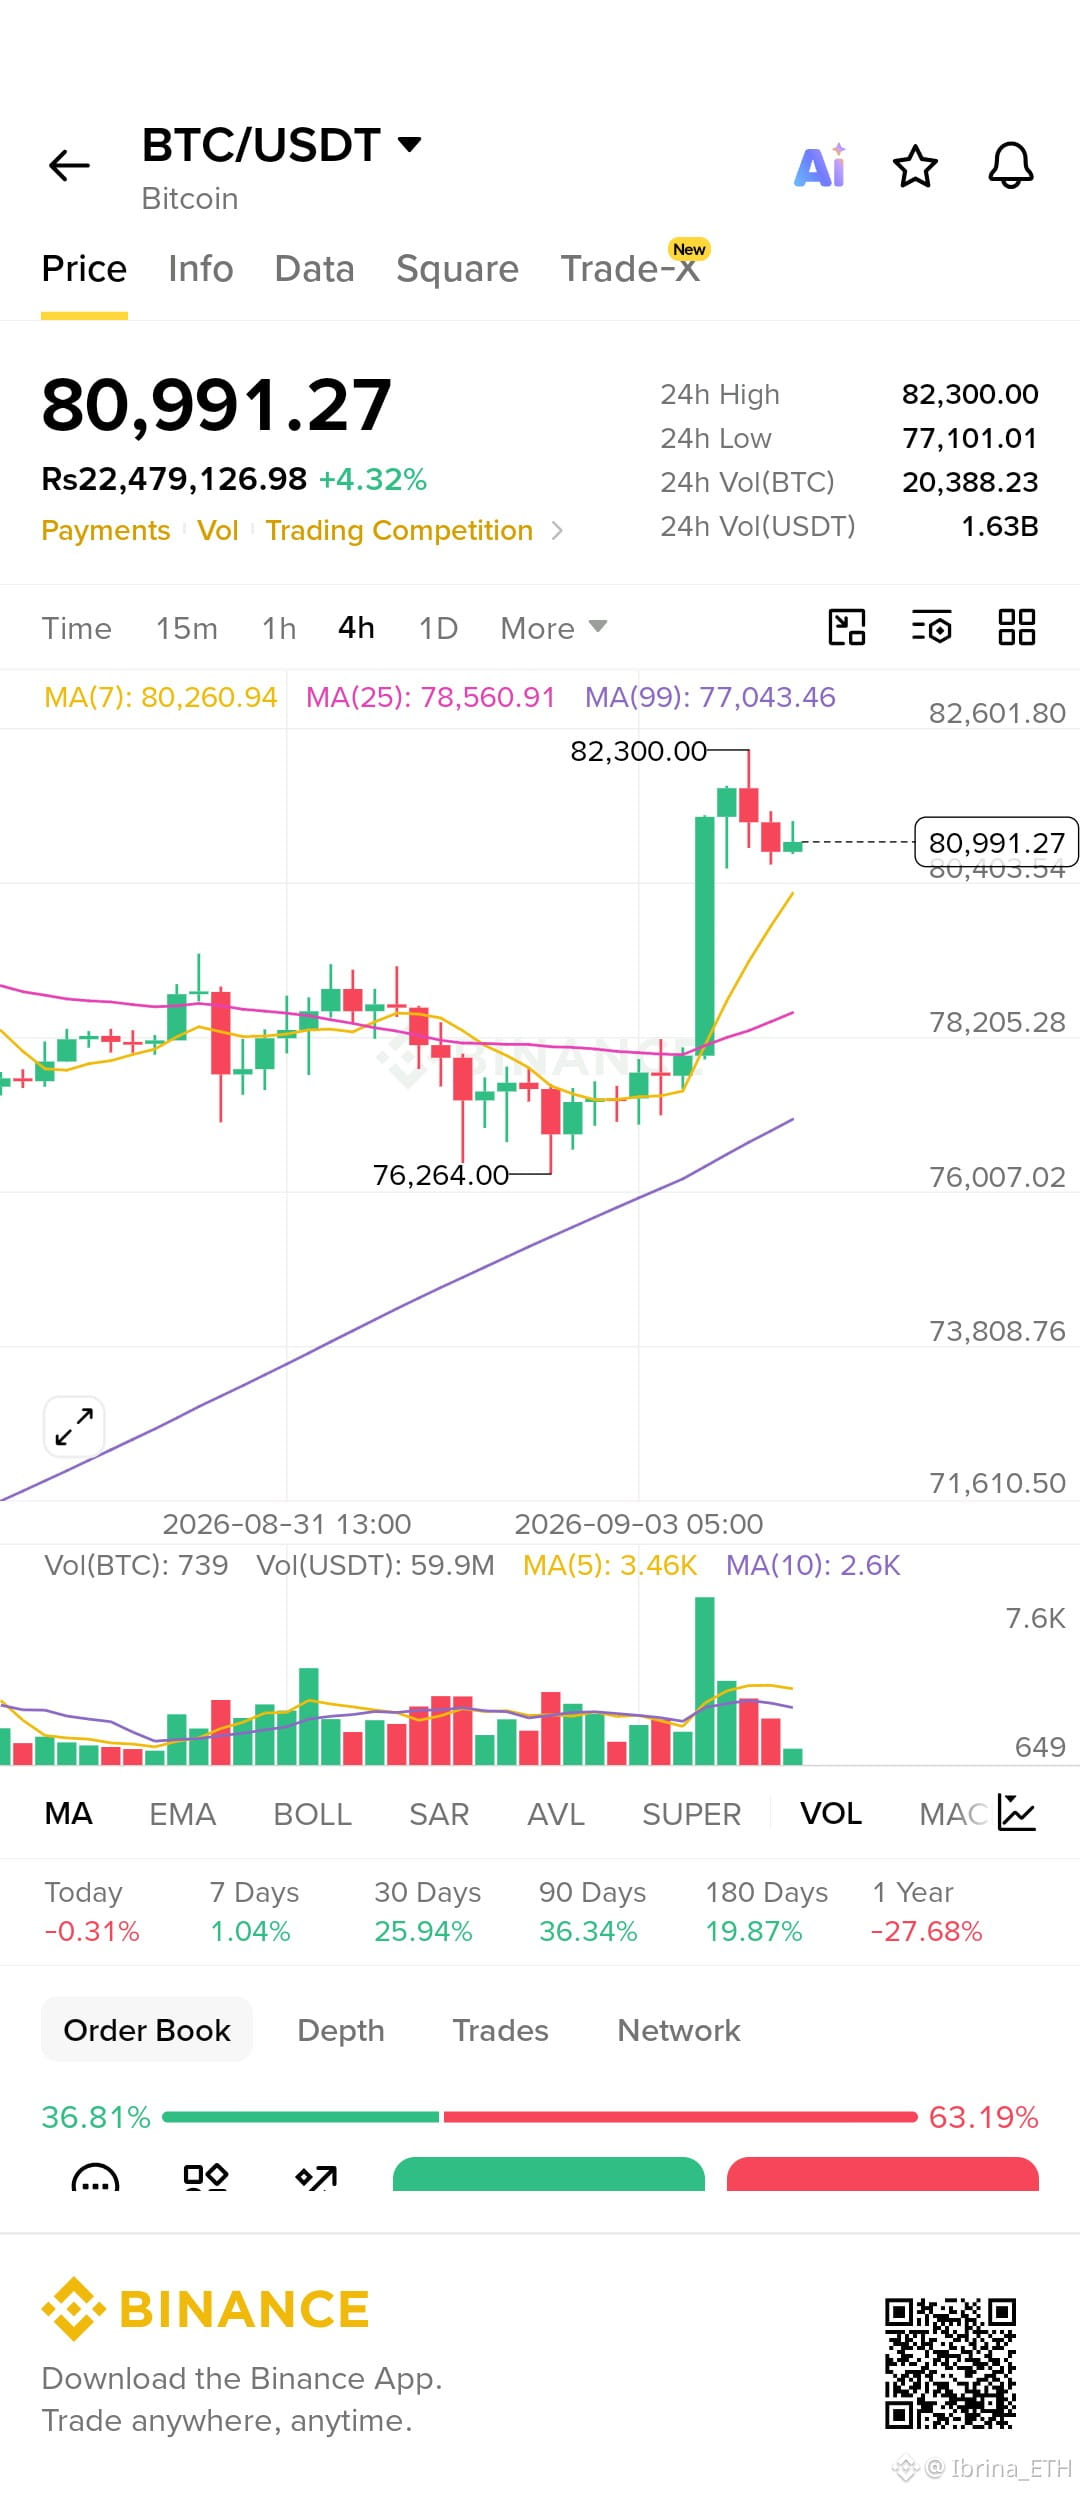

$BNB BNB Is Sitting At A Pretty Important Spot Right Now
I’ve been watching BNB on the 15m, and honestly, this chart looks a lot more interesting around 725 than it did during the earlier spike.
Price pushed up to 729.90, got rejected, then pulled back pretty quickly. Nothing unusual after a move like that. What I’m watching now is whether buyers can actually hold the area they just reclaimed.
Right now $BNB is sitting around 725.2, basically right on the MA(7) at 725.48 and just above the MA(25) at 724.12.
That little MA cluster is doing a lot of work here.
If price stays above 724–725 and starts building again, I’d like that structure. We’ve already seen buyers defend 718.22, and from there the chart started making higher lows and climbing back toward the upper range.
The 729.90 high is obviously the level everyone will be watching next.
But I’m not expecting it to just break because the chart looks green. The latest push came with a noticeable volume increase, then the follow-through started cooling. That tells me buyers are still around, but they haven't exactly overwhelmed the sellers yet.
The order-book snapshot is actually leaning more toward buyers too, around 61% buy vs 39% sell. I wouldn’t treat that alone as confirmation, but it’s at least another small positive for the current setup.
What I really want to see is simple:
724–725 holds → buyers regain momentum → 729.90 gets tested again.
If BNB can clear 729.90 with proper volume, that would be a much cleaner continuation signal.
But if 724 starts failing and price slips back toward 718.2, then I’d stop treating this as a healthy little consolidation and start questioning the recovery.
For now, I’m not chasing the move.
$BNB already showed it can jump.
Now I’m more interested in whether buyers can keep it above the level they just fought their way back to.
Not any financial advice... This is not for trading signal this is just my personal chart view.
I’ve been watching BNB on the 15m, and honestly, this chart looks a lot more interesting around 725 than it did during the earlier spike.
Price pushed up to 729.90, got rejected, then pulled back pretty quickly. Nothing unusual after a move like that. What I’m watching now is whether buyers can actually hold the area they just reclaimed.
Right now $BNB is sitting around 725.2, basically right on the MA(7) at 725.48 and just above the MA(25) at 724.12.
That little MA cluster is doing a lot of work here.
If price stays above 724–725 and starts building again, I’d like that structure. We’ve already seen buyers defend 718.22, and from there the chart started making higher lows and climbing back toward the upper range.
The 729.90 high is obviously the level everyone will be watching next.
But I’m not expecting it to just break because the chart looks green. The latest push came with a noticeable volume increase, then the follow-through started cooling. That tells me buyers are still around, but they haven't exactly overwhelmed the sellers yet.
The order-book snapshot is actually leaning more toward buyers too, around 61% buy vs 39% sell. I wouldn’t treat that alone as confirmation, but it’s at least another small positive for the current setup.
What I really want to see is simple:
724–725 holds → buyers regain momentum → 729.90 gets tested again.
If BNB can clear 729.90 with proper volume, that would be a much cleaner continuation signal.
But if 724 starts failing and price slips back toward 718.2, then I’d stop treating this as a healthy little consolidation and start questioning the recovery.
For now, I’m not chasing the move.
$BNB already showed it can jump.
Now I’m more interested in whether buyers can keep it above the level they just fought their way back to.
Not any financial advice... This is not for trading signal this is just my personal chart view.