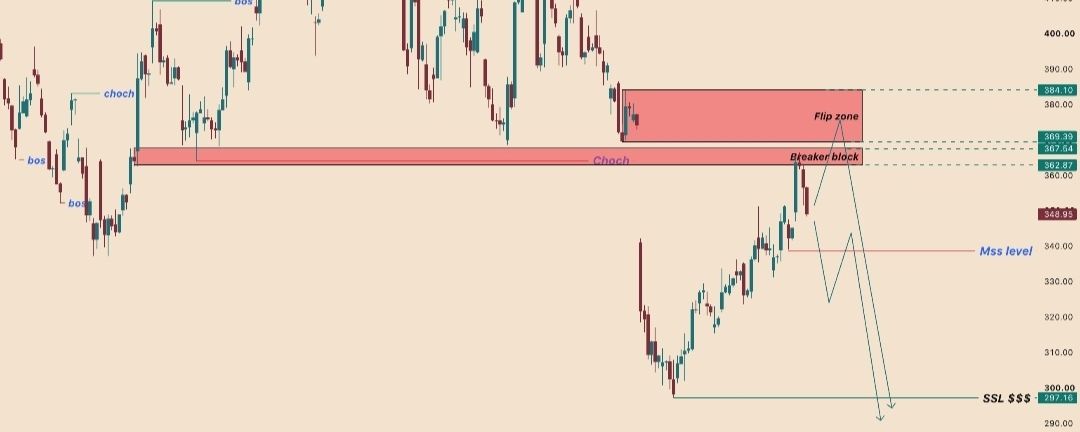


💥💥 By analyzing the #TSLA (Tesla) chart on the 4H timeframe, we can see a market that has already changed hands. The uptrend that carried price through spring broke down in a single violent move, and what looks like a recovery right now is price returning to the scene of that break rather than repairing it.
4H Timeframe
The context matters here. Through April and May, TSLA was in a clean bullish sequence - a CHoCH to the upside, then repeated BOS confirming buyers were setting the terms, carrying price up toward the $445 - $452 region. Even after the first rollover, the market held together with an internal CHoCH and internal BOS keeping the structure intact.
That ended abruptly. Price broke down through the range with a large gap lower, printing a bearish CHoCH that took out the structure underneath rather than testing it. That is the move that changed the trend on this timeframe, and nothing since has undone it.
From the low at $297.16, price has been climbing steadily. What matters is where that climb is heading: straight back into the region it broke from. The Breaker block sits at $362.87 - $369.39, and price is currently trading around $348.95, working directly into it.
Above the breaker sits the Flip zone at $369.39 - $384.10 - the area that was support on the way up and should now act as supply on the way back.
The liquidity map is heavily weighted to one side. Overhead, buy-side liquidity rests at $432.85, $445.18 and $452.00, but those sit far above and behind a wall of broken structure. Beneath, the sell-side liquidity at $297.16 is untouched, and the MSS level at $340.00 is the line that governs the near-term path.
The Bias
Two paths, and both of them end in the same place - the difference is how much upside price takes first.
Scenario A - the base case.
Price is retracing into the Breaker block at $362.87 - $369.39, and my expectation is rejection from it. That block is where sellers took control, and it should defend on the first return. The confirmation I want is a break of the MSS level at $340.00 - a decisive close beneath it confirms the retracement is finished and puts the sell-side liquidity at $297.16 back in play as the objective.
The reasoning is straightforward. The trend on this timeframe is bearish, the break was impulsive rather than gradual, and price is now returning into broken structure from below. That is retracement behaviour, not reversal behaviour.
Scenario B - the deeper retrace.
If price pushes through the Breaker block instead of rejecting from it, the next region is the Flip zone at $369.39 $384.10. That is still supply, and a rejection from there produces the same destination - the sell-side liquidity below - just from a higher starting point.
What separates the two is not direction but patience. Either the breaker holds and the move begins from $362 - $369, or the flip zone holds and it begins from $369 - $384. In both cases the draw is the liquidity resting beneath.
Invalidation is clean and worth stating plainly: a decisive close above $384.10 reclaims the entire flip zone and puts the bearish structure back in question. Above that level the sequence of broken highs starts to matter again, and the buy-side pools at $432.85 and higher come back onto the table.
And the rule that governs all of it: a break is a candle close, not a wick. Breaker blocks and flip zones are precisely where the market spikes through, catches positions on the wrong side, and reverses without ever having actually broken.