



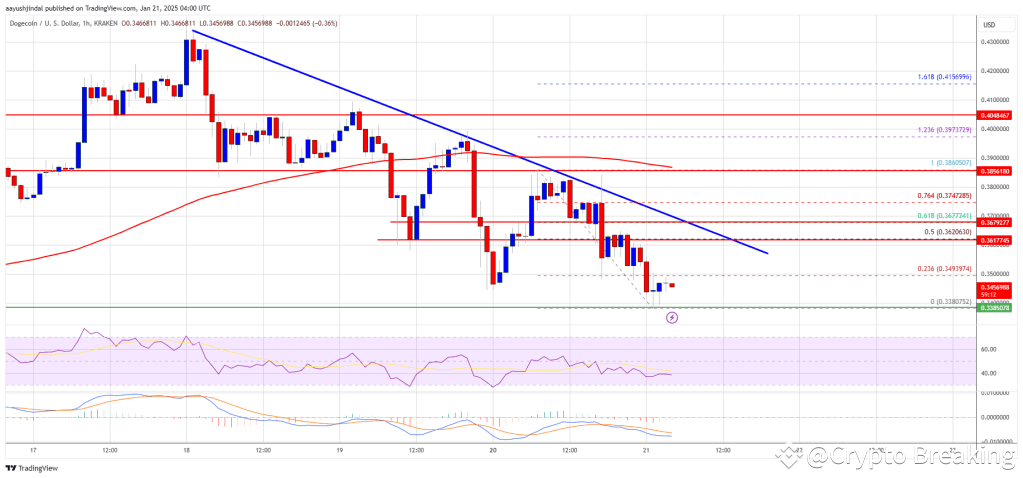
After reaching a peak at $0.4050, Dogecoin experienced a downward correction against the US Dollar. Currently, DOGE is in a consolidation phase and could potentially see a recovery if it surpasses the $0.3680 resistance level.
DOGE’s price recently dropped below both $0.4050 and $0.380.
It is currently trading under the $0.3750 mark and the 100-hourly simple moving average.
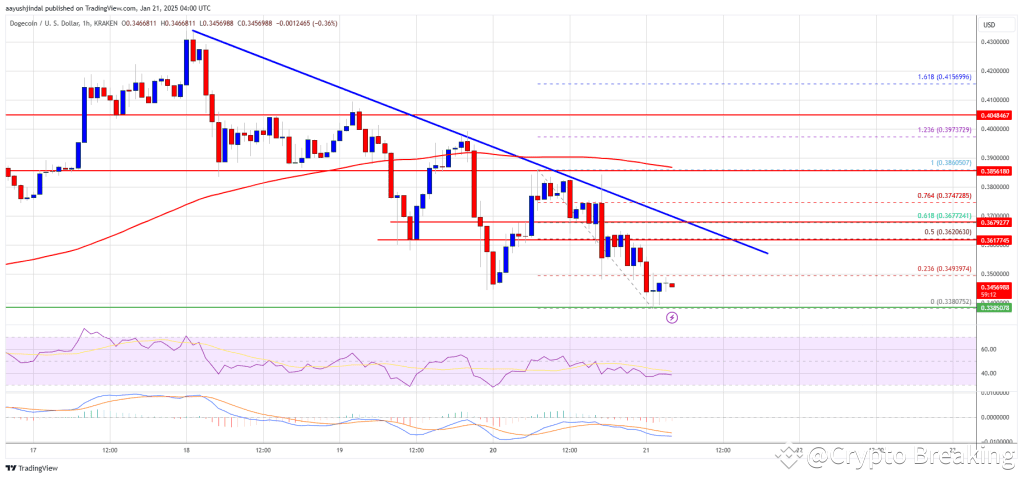
An important bearish trend line is emerging with a resistance barrier at $0.3650 on the hourly chart of the DOGE/USD pair (data sourced from Kraken).
If the price manages to break through the $0.3650 and $0.3680 resistances, a new upside movement may begin.
Dogecoin’s Price Retracts Towards Support
Following a decline from the $0.4050 resistance level, Dogecoin’s price took a different path compared to Bitcoin and Ethereum. The downward spiral led to a drop below the $0.400 and $0.380 support levels, briefly dipping under $0.350.
A low point was established at $0.3380, and the price is currently consolidating below the 23.6% Fibonacci retracement level from the recent swing. Additionally, a significant bearish trend line is visible with a hurdle at $0.3650 on the hourly DOGE/USD chart.
Presently, Dogecoin’s price is situated below $0.3750 and the 100-hourly simple moving average. Resistance is anticipated near the $0.3650 level and the trend line.
If the bulls manage to break through $0.3680 or the 61.8% Fibonacci retracement level, the next obstacles will be at $0.3750 and potentially beyond. A closE above $0.3750 could propel the price towards $0.3860 and potentially $0.40, with a major target at $0.420.
Potential Decline in DOGE Value
If Dogecoin’s price fails to rise above $0.3750, another downtrend could ensue. Initial support lies at around $0.340, followed by a stronger support level at $0.3380.
The critical support level is at $0.3250. A breach below this point may lead to further declination towards $0.3020 or potentially $0.300 in the immediate future.
Technical Analysis
Hourly MACD – The MACD for DOGE/USD is indicating a bearish trend.
Hourly RSI (Relative Strength Index) – The RSI for DOGE/USD is currently below the 50 mark.
Key Support Levels – $0.3380 and $0.3250.
Key Resistance Levels – $0.3650 and $0.3750.
The post Is Dogecoin (DOGE) Taking a Dip Before the Next Meme-Coin Rally? appeared first on Crypto Breaking News.