
#weeklyoutlook
weeklyoutlook
Просмотров: 13,655
57 обсуждают
Популярные
Новые

·
--
Статья
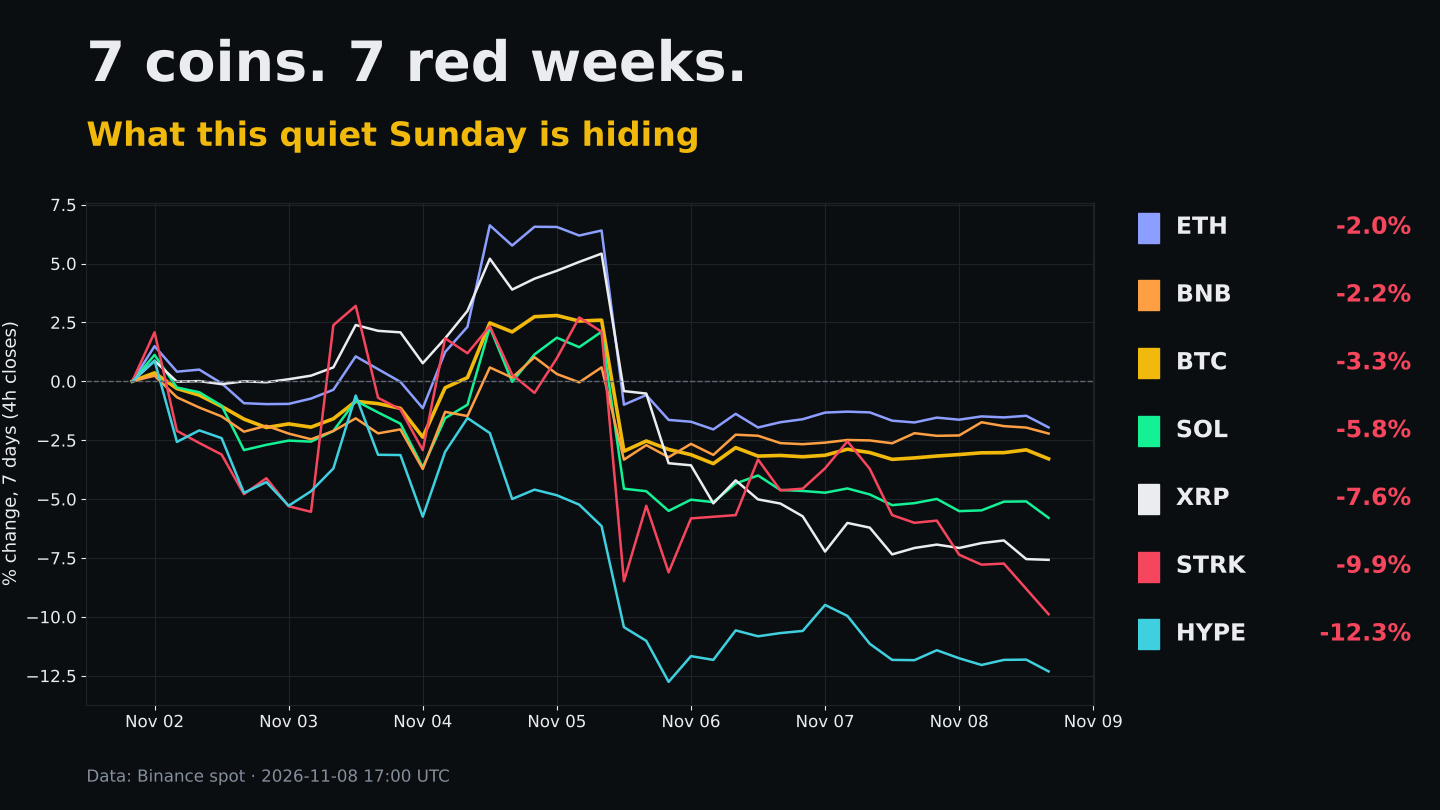
7 Coins, 7 Red Weeks: What This Quiet Sunday Is HidingSeven coins on my watchlist, and not one of them closed the week green. $BTC is the anchor at -3.3% over seven days, ETH and BNB held up best at roughly -2%, and the bottom of the table belongs to $STRK (-9.9%) and $HYPE (-12.3%). That spread says a lot about where risk appetite stands going into Monday.
What actually happened
The week had one real event, and it was Nov 4–5. BTC pushed to a weekly high of 81,196 and closed Nov 4 at 80,504. The very next day it printed a 75,208 low and closed at 76,088, giving back the whole move in one session. Everything else followed: ETH tagged 2,450 before sliding back to the 2,230 area, XRP dropped from 1.34 to 1.15.
Since then, nothing. BTC's last two daily ranges have been tiny: the past 24h ran from 75,571 to 76,200, a band of less than 1%. Price sits at 75,776, near the bottom of its 7-day range (74,888 to 81,196).
The quiet is the story
Volume tells you how little conviction is left. Yesterday BTC traded about 35% of its 7-day average daily volume, and today is tracking similarly thin. ETH, SOL and HYPE show the same picture. Weekend volume is always lighter, but this is low even by Sunday standards.
Why that matters: compression after a failed breakout usually doesn't last. When ranges this tight finally break, the first move tends to be fast because few orders sit in between. The direction is the open question, and the chart doesn't answer it yet.
Where each coin sits right now
Measured against its own 7-day high/low range:
• BNB is the strongest, about 38% of the way up its range at 696.9
• BTC around 14%, ETH around 10%
• SOL near 8% at 89.06
• HYPE around 6% at 77.03
• XRP and STRK basically on their weekly lows (XRP 1.156 vs a 1.15 low, STRK 0.0386 vs 0.03844)
Coins sitting on their lows into a low-volume weekend are the ones most exposed if Monday opens weak. STRK is also down about 47% over 30 days and lost 4.1% in the last 24h alone, so treat it as high risk. HYPE took the hardest hit this week; small and mid caps tend to fall faster than BTC when sentiment cools.
What I'm watching this week
1. BTC 74,888, the weekly low. A clean daily close below it would turn the Nov 5 dump from a "shakeout" into a trend.
2. BTC 78,000–78,900, where the Nov 1–3 candles spent most of their time. Reclaiming that zone would suggest the dip got bought.
3. ETH 2,206, its weekly low, only about 1% below current price.
4. Relative strength. If BNB and ETH keep outperforming while HYPE and STRK keep sliding, the market is rotating toward safety, not getting ready to rip.
5. Monday volume. A break from this range on volume above the 7-day average means more than any intraday wick on a thin Sunday.
Bottom line
It was a red week for all seven, with a failed push above 80k in the middle and almost no activity since. The market is coiled. I'd rather wait for the break and the volume confirming it than guess the direction inside a 1% box.
Which side do you think breaks first: 74.9k or 78k?
Not financial advice.
#WeeklyOutlook #CryptoMarket #Bitcoin
7 Coins, 7 Red Weeks: What This Quiet Sunday Is Hiding
Seven coins on my watchlist, and not one of them closed the week green. $BTC is the anchor at -3.3% over seven days, ETH and BNB held up best at roughly -2%, and the bottom of the table belongs to $STRK (-9.9%) and $HYPE (-12.3%). That spread says a lot about where risk appetite stands going into Monday.
What actually happened
The week had one real event, and it was Nov 4–5. BTC pushed to a weekly high of 81,196 and closed Nov 4 at 80,504. The very next day it printed a 75,208 low and closed at 76,088, giving back the whole move in one session. Everything else followed: ETH tagged 2,450 before sliding back to the 2,230 area, XRP dropped from 1.34 to 1.15.
Since then, nothing. BTC's last two daily ranges have been tiny: the past 24h ran from 75,571 to 76,200, a band of less than 1%. Price sits at 75,776, near the bottom of its 7-day range (74,888 to 81,196).
The quiet is the story
Volume tells you how little conviction is left. Yesterday BTC traded about 35% of its 7-day average daily volume, and today is tracking similarly thin. ETH, SOL and HYPE show the same picture. Weekend volume is always lighter, but this is low even by Sunday standards.
Why that matters: compression after a failed breakout usually doesn't last. When ranges this tight finally break, the first move tends to be fast because few orders sit in between. The direction is the open question, and the chart doesn't answer it yet.
Where each coin sits right now
Measured against its own 7-day high/low range:
• BNB is the strongest, about 38% of the way up its range at 696.9
• BTC around 14%, ETH around 10%
• SOL near 8% at 89.06
• HYPE around 6% at 77.03
• XRP and STRK basically on their weekly lows (XRP 1.156 vs a 1.15 low, STRK 0.0386 vs 0.03844)
Coins sitting on their lows into a low-volume weekend are the ones most exposed if Monday opens weak. STRK is also down about 47% over 30 days and lost 4.1% in the last 24h alone, so treat it as high risk. HYPE took the hardest hit this week; small and mid caps tend to fall faster than BTC when sentiment cools.
What I'm watching this week
1. BTC 74,888, the weekly low. A clean daily close below it would turn the Nov 5 dump from a "shakeout" into a trend.
2. BTC 78,000–78,900, where the Nov 1–3 candles spent most of their time. Reclaiming that zone would suggest the dip got bought.
3. ETH 2,206, its weekly low, only about 1% below current price.
4. Relative strength. If BNB and ETH keep outperforming while HYPE and STRK keep sliding, the market is rotating toward safety, not getting ready to rip.
5. Monday volume. A break from this range on volume above the 7-day average means more than any intraday wick on a thin Sunday.
Bottom line
It was a red week for all seven, with a failed push above 80k in the middle and almost no activity since. The market is coiled. I'd rather wait for the break and the volume confirming it than guess the direction inside a 1% box.
Which side do you think breaks first: 74.9k or 78k?
Not financial advice.
#WeeklyOutlook #CryptoMarket #Bitcoin
What actually happened
The week had one real event, and it was Nov 4–5. BTC pushed to a weekly high of 81,196 and closed Nov 4 at 80,504. The very next day it printed a 75,208 low and closed at 76,088, giving back the whole move in one session. Everything else followed: ETH tagged 2,450 before sliding back to the 2,230 area, XRP dropped from 1.34 to 1.15.
Since then, nothing. BTC's last two daily ranges have been tiny: the past 24h ran from 75,571 to 76,200, a band of less than 1%. Price sits at 75,776, near the bottom of its 7-day range (74,888 to 81,196).
The quiet is the story
Volume tells you how little conviction is left. Yesterday BTC traded about 35% of its 7-day average daily volume, and today is tracking similarly thin. ETH, SOL and HYPE show the same picture. Weekend volume is always lighter, but this is low even by Sunday standards.
Why that matters: compression after a failed breakout usually doesn't last. When ranges this tight finally break, the first move tends to be fast because few orders sit in between. The direction is the open question, and the chart doesn't answer it yet.
Where each coin sits right now
Measured against its own 7-day high/low range:
• BNB is the strongest, about 38% of the way up its range at 696.9
• BTC around 14%, ETH around 10%
• SOL near 8% at 89.06
• HYPE around 6% at 77.03
• XRP and STRK basically on their weekly lows (XRP 1.156 vs a 1.15 low, STRK 0.0386 vs 0.03844)
Coins sitting on their lows into a low-volume weekend are the ones most exposed if Monday opens weak. STRK is also down about 47% over 30 days and lost 4.1% in the last 24h alone, so treat it as high risk. HYPE took the hardest hit this week; small and mid caps tend to fall faster than BTC when sentiment cools.
What I'm watching this week
1. BTC 74,888, the weekly low. A clean daily close below it would turn the Nov 5 dump from a "shakeout" into a trend.
2. BTC 78,000–78,900, where the Nov 1–3 candles spent most of their time. Reclaiming that zone would suggest the dip got bought.
3. ETH 2,206, its weekly low, only about 1% below current price.
4. Relative strength. If BNB and ETH keep outperforming while HYPE and STRK keep sliding, the market is rotating toward safety, not getting ready to rip.
5. Monday volume. A break from this range on volume above the 7-day average means more than any intraday wick on a thin Sunday.
Bottom line
It was a red week for all seven, with a failed push above 80k in the middle and almost no activity since. The market is coiled. I'd rather wait for the break and the volume confirming it than guess the direction inside a 1% box.
Which side do you think breaks first: 74.9k or 78k?
Not financial advice.
#WeeklyOutlook #CryptoMarket #Bitcoin
·
--
Статья
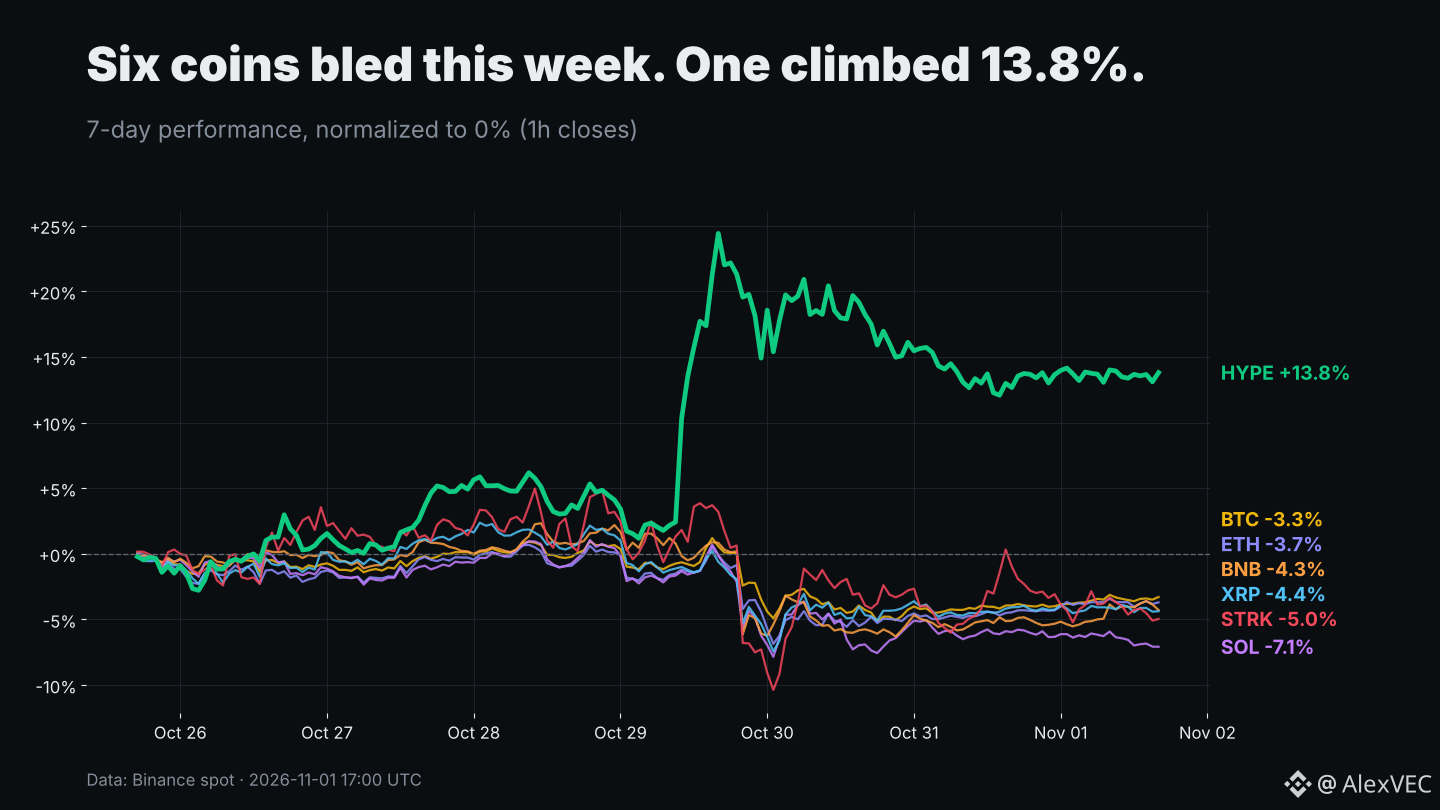
Six coins bled this week. One climbed 13.8%: the November outlookSix of the seven majors I track closed the week in the red. The seventh, $HYPE, is up 13.8% over the same 168 hours. If you only watched the big caps this week, you missed the most interesting chart on the board.
Here's the weekly outlook going into November, built only on Binance spot data pulled today (Nov 1, ~17:00 UTC).
The scoreboard (7 days)
HYPE +13.8%
BTC -3.3%
ETH -3.7%
BNB -4.3%
XRP -4.4%
STRK -5.0%
SOL -7.1%
What actually happened
The whole week turned on one day. On Oct 29 the market got hit hard: on daily closes $BTC went from 81,343 to 77,992 (-4.1%), BNB dropped from 759.85 to 698.46 (-8.1%), SOL from 102.44 to 95.64 (-6.6%). Since then nothing has reclaimed those levels. BTC's 7-day high is 81,971 and it's now sitting at 78,150, closer to the 76,326 weekly low than to the top.
HYPE did the opposite. It ripped from the 80s to a weekly high of 97.74 on Oct 29, then gave back part of it and is now holding around 88.20. Even after that pullback, it's the only line on the chart above zero.
The detail I find most useful: on hourly returns over the past week, HYPE's correlation with BTC was just 0.42. ETH sat at 0.90, SOL at 0.89, XRP at 0.86. In plain words, most of the board is moving as one trade on BTC, while HYPE has been trading its own story. That cuts both ways: it didn't follow the dump, but it won't necessarily follow a recovery either.
The 30-day view is harsher
Zoom out and the picture gets worse for the alts. Over 30 daily candles: BTC -7.5%, BNB -7.4%, ETH -14.9%, XRP -15.8%, SOL -20.1%. Two outliers again: STRK is roughly flat (+0.9%) and HYPE -1.0%. ETH/BTC barely moved on the week (0.0292 to 0.0290), so there is no rotation signal into ETH yet.
The weekend is quiet, maybe too quiet
Volume in the last 24h is thin everywhere: BTC traded about 0.42x its average daily volume of the week, ETH 0.36x, SOL 0.32x, XRP 0.30x. Ranges are tight too: BTC's 24h range is 77,450 to 78,285, barely 1%. Low-volume weekends after a sharp drop often resolve with a bigger move once Monday liquidity shows up. Direction is the open question.
What I'm watching this week
1. BTC: 76,326 (weekly low) below, 81,343 to 81,971 (pre-dump close and weekly high) above. A daily close outside that box probably sets the tone for the whole board, given how tightly everything is correlated.
2. SOL: the weakest major on both 7d and 30d. The weekly low of 92.34 is less than 3% away from today's 94.77. If it breaks, the laggard may keep lagging.
3. HYPE: 97.74 is the level that matters on the upside, the high-70s base (weekly low 74.99) on the downside. Hourly volatility here is roughly 2.7x BTC's, so position size should reflect that.
4. STRK: down 4.1% today on just $2.2M of 24h spot volume. Thin books mean sharp wicks both ways.
5. Macro: US midterm elections fall on Tuesday, Nov 3. Event weeks tend to bring headline-driven volatility, so I'd expect the weekend calm not to last.
Bottom line
The market is in a "prove it" week. BTC has to defend the 76k area, and most alts are just leveraged versions of whatever BTC does. HYPE is the exception worth studying, not because it's guaranteed to keep going (it isn't), but because it shows what decorrelated strength looks like when everything else is red.
Which side of the BTC box breaks first, 76k or 82k?
Not financial advice.
#WeeklyOutlook #CryptoMarket #Hyperliquid
Six coins bled this week. One climbed 13.8%: the November outlook
Six of the seven majors I track closed the week in the red. The seventh, $HYPE , is up 13.8% over the same 168 hours. If you only watched the big caps this week, you missed the most interesting chart on the board.
Here's the weekly outlook going into November, built only on Binance spot data pulled today (Nov 1, ~17:00 UTC).
The scoreboard (7 days)
HYPE +13.8%
BTC -3.3%
ETH -3.7%
BNB -4.3%
XRP -4.4%
STRK -5.0%
SOL -7.1%
What actually happened
The whole week turned on one day. On Oct 29 the market got hit hard: on daily closes $BTC went from 81,343 to 77,992 (-4.1%), BNB dropped from 759.85 to 698.46 (-8.1%), SOL from 102.44 to 95.64 (-6.6%). Since then nothing has reclaimed those levels. BTC's 7-day high is 81,971 and it's now sitting at 78,150, closer to the 76,326 weekly low than to the top.
HYPE did the opposite. It ripped from the 80s to a weekly high of 97.74 on Oct 29, then gave back part of it and is now holding around 88.20. Even after that pullback, it's the only line on the chart above zero.
The detail I find most useful: on hourly returns over the past week, HYPE's correlation with BTC was just 0.42. ETH sat at 0.90, SOL at 0.89, XRP at 0.86. In plain words, most of the board is moving as one trade on BTC, while HYPE has been trading its own story. That cuts both ways: it didn't follow the dump, but it won't necessarily follow a recovery either.
The 30-day view is harsher
Zoom out and the picture gets worse for the alts. Over 30 daily candles: BTC -7.5%, BNB -7.4%, ETH -14.9%, XRP -15.8%, SOL -20.1%. Two outliers again: STRK is roughly flat (+0.9%) and HYPE -1.0%. ETH/BTC barely moved on the week (0.0292 to 0.0290), so there is no rotation signal into ETH yet.
The weekend is quiet, maybe too quiet
Volume in the last 24h is thin everywhere: BTC traded about 0.42x its average daily volume of the week, ETH 0.36x, SOL 0.32x, XRP 0.30x. Ranges are tight too: BTC's 24h range is 77,450 to 78,285, barely 1%. Low-volume weekends after a sharp drop often resolve with a bigger move once Monday liquidity shows up. Direction is the open question.
What I'm watching this week
1. BTC: 76,326 (weekly low) below, 81,343 to 81,971 (pre-dump close and weekly high) above. A daily close outside that box probably sets the tone for the whole board, given how tightly everything is correlated.
2. SOL: the weakest major on both 7d and 30d. The weekly low of 92.34 is less than 3% away from today's 94.77. If it breaks, the laggard may keep lagging.
3. HYPE: 97.74 is the level that matters on the upside, the high-70s base (weekly low 74.99) on the downside. Hourly volatility here is roughly 2.7x BTC's, so position size should reflect that.
4. STRK: down 4.1% today on just $2.2M of 24h spot volume. Thin books mean sharp wicks both ways.
5. Macro: US midterm elections fall on Tuesday, Nov 3. Event weeks tend to bring headline-driven volatility, so I'd expect the weekend calm not to last.
Bottom line
The market is in a "prove it" week. BTC has to defend the 76k area, and most alts are just leveraged versions of whatever BTC does. HYPE is the exception worth studying, not because it's guaranteed to keep going (it isn't), but because it shows what decorrelated strength looks like when everything else is red.
Which side of the BTC box breaks first, 76k or 82k?
Not financial advice.
#WeeklyOutlook #CryptoMarket #Hyperliquid
Here's the weekly outlook going into November, built only on Binance spot data pulled today (Nov 1, ~17:00 UTC).
The scoreboard (7 days)
HYPE +13.8%
BTC -3.3%
ETH -3.7%
BNB -4.3%
XRP -4.4%
STRK -5.0%
SOL -7.1%
What actually happened
The whole week turned on one day. On Oct 29 the market got hit hard: on daily closes $BTC went from 81,343 to 77,992 (-4.1%), BNB dropped from 759.85 to 698.46 (-8.1%), SOL from 102.44 to 95.64 (-6.6%). Since then nothing has reclaimed those levels. BTC's 7-day high is 81,971 and it's now sitting at 78,150, closer to the 76,326 weekly low than to the top.
HYPE did the opposite. It ripped from the 80s to a weekly high of 97.74 on Oct 29, then gave back part of it and is now holding around 88.20. Even after that pullback, it's the only line on the chart above zero.
The detail I find most useful: on hourly returns over the past week, HYPE's correlation with BTC was just 0.42. ETH sat at 0.90, SOL at 0.89, XRP at 0.86. In plain words, most of the board is moving as one trade on BTC, while HYPE has been trading its own story. That cuts both ways: it didn't follow the dump, but it won't necessarily follow a recovery either.
The 30-day view is harsher
Zoom out and the picture gets worse for the alts. Over 30 daily candles: BTC -7.5%, BNB -7.4%, ETH -14.9%, XRP -15.8%, SOL -20.1%. Two outliers again: STRK is roughly flat (+0.9%) and HYPE -1.0%. ETH/BTC barely moved on the week (0.0292 to 0.0290), so there is no rotation signal into ETH yet.
The weekend is quiet, maybe too quiet
Volume in the last 24h is thin everywhere: BTC traded about 0.42x its average daily volume of the week, ETH 0.36x, SOL 0.32x, XRP 0.30x. Ranges are tight too: BTC's 24h range is 77,450 to 78,285, barely 1%. Low-volume weekends after a sharp drop often resolve with a bigger move once Monday liquidity shows up. Direction is the open question.
What I'm watching this week
1. BTC: 76,326 (weekly low) below, 81,343 to 81,971 (pre-dump close and weekly high) above. A daily close outside that box probably sets the tone for the whole board, given how tightly everything is correlated.
2. SOL: the weakest major on both 7d and 30d. The weekly low of 92.34 is less than 3% away from today's 94.77. If it breaks, the laggard may keep lagging.
3. HYPE: 97.74 is the level that matters on the upside, the high-70s base (weekly low 74.99) on the downside. Hourly volatility here is roughly 2.7x BTC's, so position size should reflect that.
4. STRK: down 4.1% today on just $2.2M of 24h spot volume. Thin books mean sharp wicks both ways.
5. Macro: US midterm elections fall on Tuesday, Nov 3. Event weeks tend to bring headline-driven volatility, so I'd expect the weekend calm not to last.
Bottom line
The market is in a "prove it" week. BTC has to defend the 76k area, and most alts are just leveraged versions of whatever BTC does. HYPE is the exception worth studying, not because it's guaranteed to keep going (it isn't), but because it shows what decorrelated strength looks like when everything else is red.
Which side of the BTC box breaks first, 76k or 82k?
Not financial advice.
#WeeklyOutlook #CryptoMarket #Hyperliquid
6

·
--
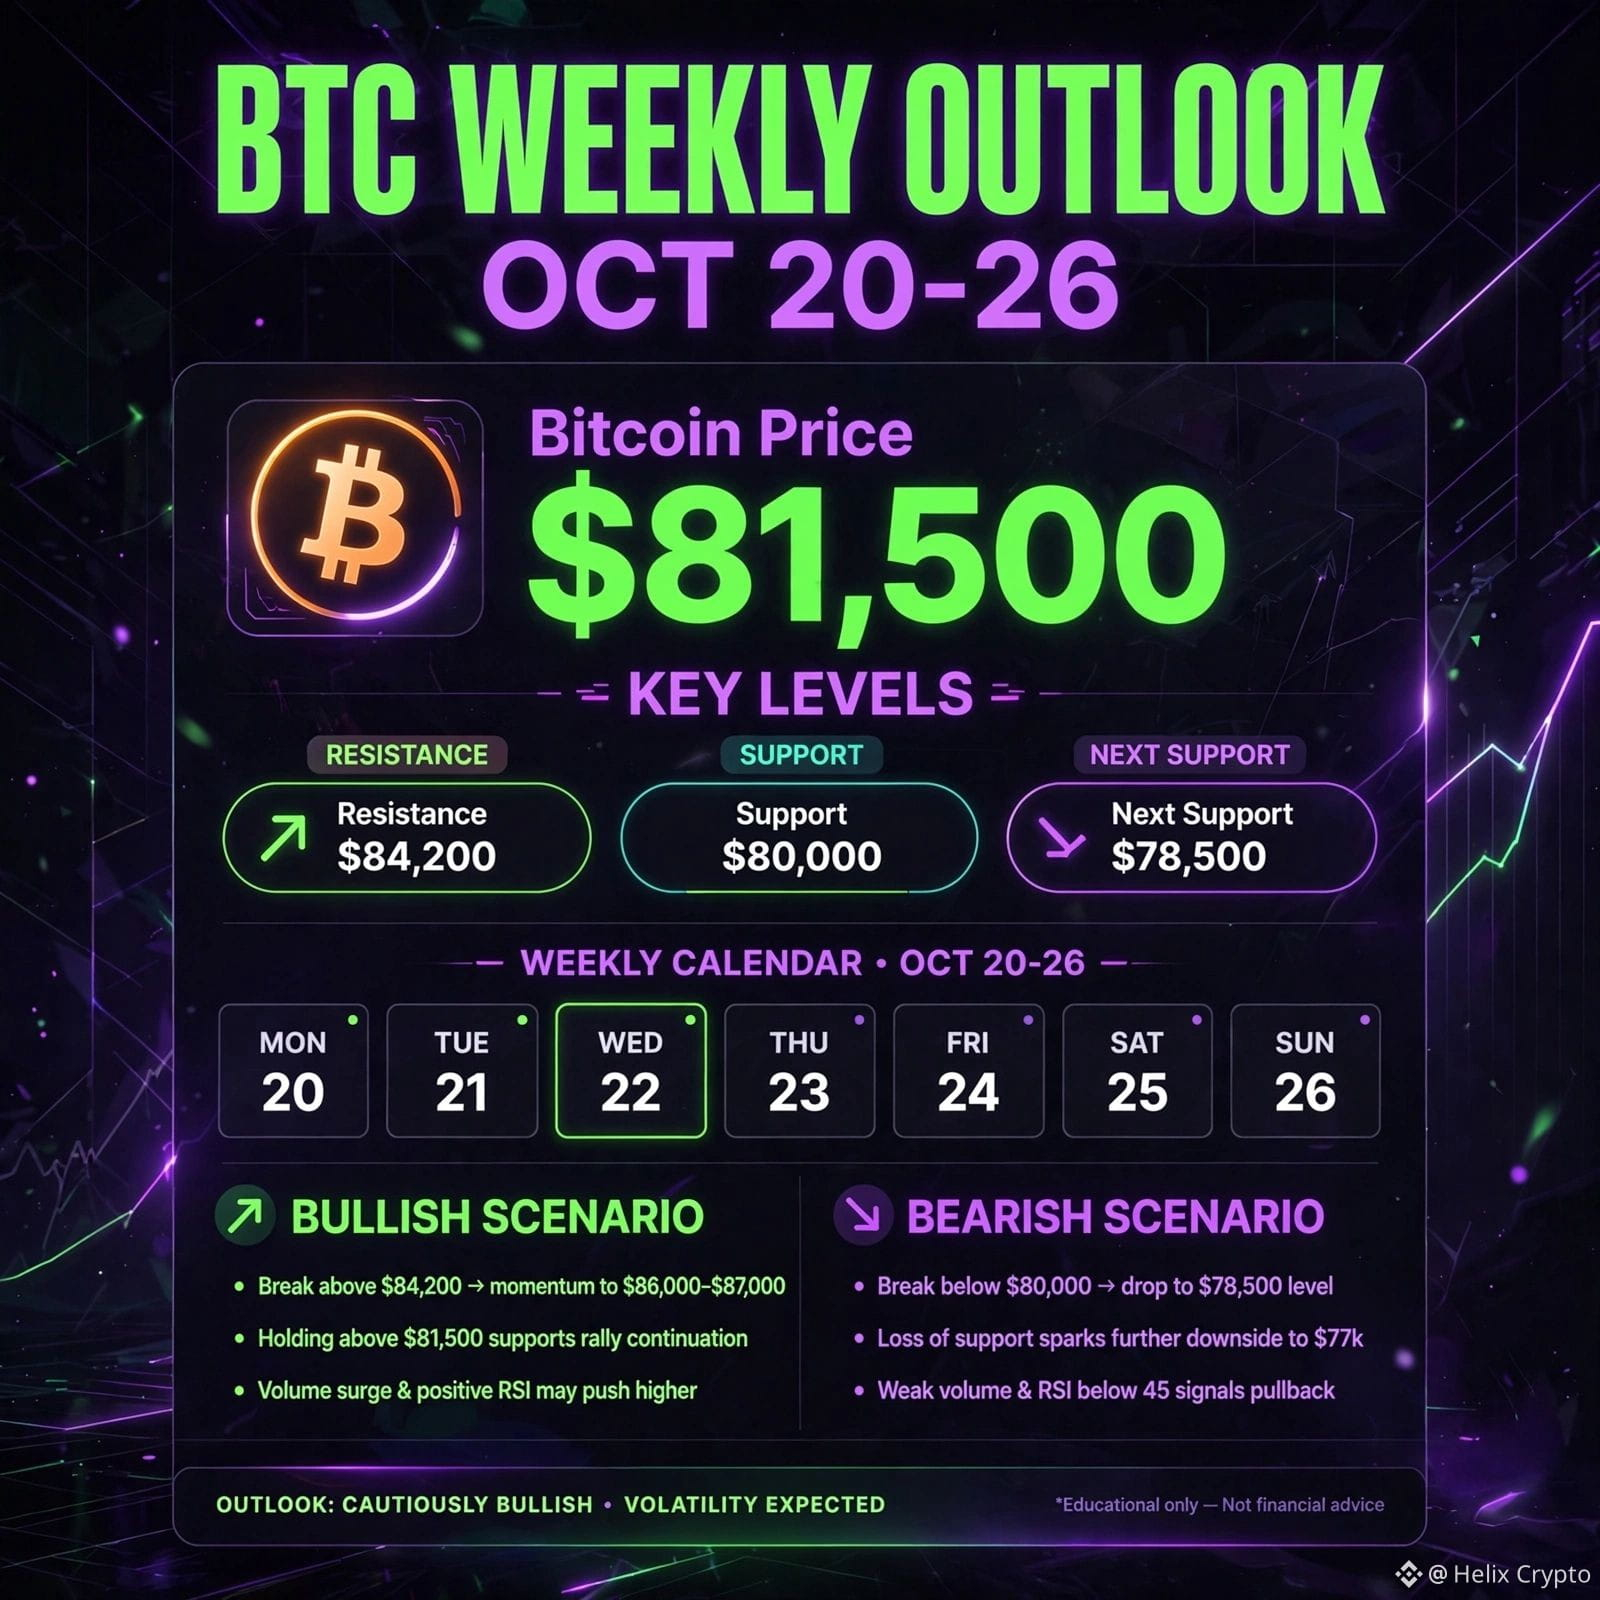
$BTC $ETH BTC WEEKLY OUTLOOK - Oct 20-26 📊
Bitcoin is holding above $80K. This week will decide the next big move.
📍 KEY LEVELS:
Resistance: $84,200
Support: $80,000
Next Support: $78,500
🟢 BULLISH SCENARIO:
Break above $84,200 = Momentum to $86K - $87K
Holding above $81,500 supports rally continuation
🔴 BEARISH SCENARIO:
Break below $80,000 = Drop to $78,500
Loss of support could push to $77K
✅ My Outlook: Cautiously Bullish
- No FOMO buying in the middle
- Buy near support, take profit near resistance
- Keep risk low before FOMC on Oct 28
What is your bias for this week? Bullish or Bearish? Comment 👇
#BTC #bitcoin #WeeklyOutlook #cryptotrading
{spot}(ETHUSDT)
$BTC $ETH BTC WEEKLY OUTLOOK - Oct 20-26 📊
Bitcoin is holding above $80K. This week will decide the next big move.
📍 KEY LEVELS:
Resistance: $84,200
Support: $80,000
Next Support: $78,500
🟢 BULLISH SCENARIO:
Break above $84,200 = Momentum to $86K - $87K
Holding above $81,500 supports rally continuation
🔴 BEARISH SCENARIO:
Break below $80,000 = Drop to $78,500
Loss of support could push to $77K
✅ My Outlook: Cautiously Bullish
- No FOMO buying in the middle
- Buy near support, take profit near resistance
- Keep risk low before FOMC on Oct 28
What is your bias for this week? Bullish or Bearish? Comment 👇
#BTC #bitcoin #WeeklyOutlook #cryptotrading
Bitcoin is holding above $80K. This week will decide the next big move.
📍 KEY LEVELS:
Resistance: $84,200
Support: $80,000
Next Support: $78,500
🟢 BULLISH SCENARIO:
Break above $84,200 = Momentum to $86K - $87K
Holding above $81,500 supports rally continuation
🔴 BEARISH SCENARIO:
Break below $80,000 = Drop to $78,500
Loss of support could push to $77K
✅ My Outlook: Cautiously Bullish
- No FOMO buying in the middle
- Buy near support, take profit near resistance
- Keep risk low before FOMC on Oct 28
What is your bias for this week? Bullish or Bearish? Comment 👇
#BTC #bitcoin #WeeklyOutlook #cryptotrading
76

$BTC — Dead or Alive? The Week Ahead 👀📊
Bitcoin is at a critical decision point right now. This week could determine the next major direction.
The Big Question:
📈 Does BTC bounce toward $90,000?
📉 Or does BTC fall toward $70,000?
Both scenarios are on the table. Here is what the data says.
Bullish Case — $90,000:
✅ Key support levels holding so far
✅ Whale accumulation signals appearing
✅ ETF inflows still positive
✅ Fear and greed index at extreme fear = historically bullish
🎯 Break above $82,800 = bullish structure confirmed
Bearish Case — $70,000:
⚠️ Macro uncertainty with new Fed Chair
⚠️ Rate hike odds above 70% for year end
⚠️ Consumer sentiment at all time low
⚠️ Bearish structure still intact on daily chart
🔴 Lose $74,000 support = $70,000 zone opens
Key levels this week:
🟢 Must hold: $74,000 — $75,000
🔴 Resistance: $78,500 — $81,000
✅ Bullish confirmation: clean break above $82,800
📉 Bearish confirmation: daily close below $74,000
The honest truth:
Nobody knows which way BTC goes this week. But understanding both scenarios and having a plan for each is what separates prepared traders from reactive ones. 🧠
Watch Monday open closely. 👀
DYOR — Not financial advice! 🙏
#Bitcoin #BTC #CryptoAnalysis #WeeklyOutlook #dyor
$BTC — Dead or Alive? The Week Ahead 👀📊
Bitcoin is at a critical decision point right now. This week could determine the next major direction.
The Big Question:
📈 Does BTC bounce toward $90,000?
📉 Or does BTC fall toward $70,000?
Both scenarios are on the table. Here is what the data says.
Bullish Case — $90,000:
✅ Key support levels holding so far
✅ Whale accumulation signals appearing
✅ ETF inflows still positive
✅ Fear and greed index at extreme fear = historically bullish
🎯 Break above $82,800 = bullish structure confirmed
Bearish Case — $70,000:
⚠️ Macro uncertainty with new Fed Chair
⚠️ Rate hike odds above 70% for year end
⚠️ Consumer sentiment at all time low
⚠️ Bearish structure still intact on daily chart
🔴 Lose $74,000 support = $70,000 zone opens
Key levels this week:
🟢 Must hold: $74,000 — $75,000
🔴 Resistance: $78,500 — $81,000
✅ Bullish confirmation: clean break above $82,800
📉 Bearish confirmation: daily close below $74,000
The honest truth:
Nobody knows which way BTC goes this week. But understanding both scenarios and having a plan for each is what separates prepared traders from reactive ones. 🧠
Watch Monday open closely. 👀
DYOR — Not financial advice! 🙏
#Bitcoin #BTC #CryptoAnalysis #WeeklyOutlook #dyor
Bitcoin is at a critical decision point right now. This week could determine the next major direction.
The Big Question:
📈 Does BTC bounce toward $90,000?
📉 Or does BTC fall toward $70,000?
Both scenarios are on the table. Here is what the data says.
Bullish Case — $90,000:
✅ Key support levels holding so far
✅ Whale accumulation signals appearing
✅ ETF inflows still positive
✅ Fear and greed index at extreme fear = historically bullish
🎯 Break above $82,800 = bullish structure confirmed
Bearish Case — $70,000:
⚠️ Macro uncertainty with new Fed Chair
⚠️ Rate hike odds above 70% for year end
⚠️ Consumer sentiment at all time low
⚠️ Bearish structure still intact on daily chart
🔴 Lose $74,000 support = $70,000 zone opens
Key levels this week:
🟢 Must hold: $74,000 — $75,000
🔴 Resistance: $78,500 — $81,000
✅ Bullish confirmation: clean break above $82,800
📉 Bearish confirmation: daily close below $74,000
The honest truth:
Nobody knows which way BTC goes this week. But understanding both scenarios and having a plan for each is what separates prepared traders from reactive ones. 🧠
Watch Monday open closely. 👀
DYOR — Not financial advice! 🙏
#Bitcoin #BTC #CryptoAnalysis #WeeklyOutlook #dyor

35

Сомнительно
Another weekly candle is about to close… and it’s time to check the market sentiment 👀
Looking at the weekly chart, Bitcoin is still holding above the MA20 — a positive sign for the bigger picture. 📈
However, if we focus on the EMAs, the next major support zone could be around $69K.
So far, bulls are still defending the structure, but volatility is increasing as the weekly close approaches.
Now the real question is:
Do you think next week will be green or red? 🟢🔴
$BTC
{spot}(BTCUSDT)
$BNB
{spot}(BNBUSDT)
$GENIUS
{spot}(GENIUSUSDT)
#btc #weeklyoutlook #BitcoinRisesOnIranPeaceDeal
Another weekly candle is about to close… and it’s time to check the market sentiment 👀
Looking at the weekly chart, Bitcoin is still holding above the MA20 — a positive sign for the bigger picture. 📈
However, if we focus on the EMAs, the next major support zone could be around $69K.
So far, bulls are still defending the structure, but volatility is increasing as the weekly close approaches.
Now the real question is:
Do you think next week will be green or red? 🟢🔴
$BTC
$BNB
$GENIUS
#btc #weeklyoutlook #BitcoinRisesOnIranPeaceDeal
Looking at the weekly chart, Bitcoin is still holding above the MA20 — a positive sign for the bigger picture. 📈
However, if we focus on the EMAs, the next major support zone could be around $69K.
So far, bulls are still defending the structure, but volatility is increasing as the weekly close approaches.
Now the real question is:
Do you think next week will be green or red? 🟢🔴
$BTC
$BNB
$GENIUS
#btc #weeklyoutlook #BitcoinRisesOnIranPeaceDeal
Green Week 🟩
62%
Red Week 🟥
38%
52 проголосовали • Голосование закрыто
1
1
1.3k

$BTC closed the week above $105,000 — and the market is not done yet.
Most people spent this week watching the charts.
Smart traders were watching the structure.
Here's what actually happened this week:
📊 Bitcoin held its key support zone around $100K after a brief dip mid-week.
📊 Buyers stepped in fast — which tells you demand is still strong at these levels.
📊 $ETH followed with relative strength, consolidating above its own major support.
What to watch next week 👇
If $BTC reclaims and holds above $107K — next target opens up. If it fails to break higher — expect another test of the $100K support. Macro calendar is light, which means price action will be driven by crypto-native flows.
The trend is still bullish. Volatility is low, which usually means a big move is building. Direction? That depends on this week's close.
Stay patient. Trade the levels, not the emotions.
What's your $BTC outlook this week — up, down, or sideways? Drop it below 👇
#BTC #CryptoAnalysis #WeeklyOutlook #BinanceSquare
$BTC closed the week above $105,000 — and the market is not done yet.
Most people spent this week watching the charts.
Smart traders were watching the structure.
Here's what actually happened this week:
📊 Bitcoin held its key support zone around $100K after a brief dip mid-week.
📊 Buyers stepped in fast — which tells you demand is still strong at these levels.
📊 $ETH followed with relative strength, consolidating above its own major support.
What to watch next week 👇
If $BTC reclaims and holds above $107K — next target opens up. If it fails to break higher — expect another test of the $100K support. Macro calendar is light, which means price action will be driven by crypto-native flows.
The trend is still bullish. Volatility is low, which usually means a big move is building. Direction? That depends on this week's close.
Stay patient. Trade the levels, not the emotions.
What's your $BTC outlook this week — up, down, or sideways? Drop it below 👇
#BTC #CryptoAnalysis #WeeklyOutlook #BinanceSquare
Most people spent this week watching the charts.
Smart traders were watching the structure.
Here's what actually happened this week:
📊 Bitcoin held its key support zone around $100K after a brief dip mid-week.
📊 Buyers stepped in fast — which tells you demand is still strong at these levels.
📊 $ETH followed with relative strength, consolidating above its own major support.
What to watch next week 👇
If $BTC reclaims and holds above $107K — next target opens up. If it fails to break higher — expect another test of the $100K support. Macro calendar is light, which means price action will be driven by crypto-native flows.
The trend is still bullish. Volatility is low, which usually means a big move is building. Direction? That depends on this week's close.
Stay patient. Trade the levels, not the emotions.
What's your $BTC outlook this week — up, down, or sideways? Drop it below 👇
#BTC #CryptoAnalysis #WeeklyOutlook #BinanceSquare
110

·
--
📊 Weekly Crypto Market Recap + Next Week Outlook 🚀
The crypto market wrapped up the week with mixed momentum. Bitcoin continued to hold key support levels, while Ethereum showed resilience despite short-term volatility. Several altcoins outperformed the broader market, signalling that investors are selectively rotating capital into high-potential projects rather than chasing every rally.
🔍 This Week's Highlights
✅ Bitcoin remained relatively stable above major support.
✅ Ethereum maintained bullish structure.
✅ AI and DeFi tokens attracted renewed attention.
✅ Market sentiment improved as buying pressure increased.
👀 What to Watch Next Week
🔸 Bitcoin's reaction around key resistance levels.
🔸 Ethereum's ability to sustain upward momentum.
🔸 Macroeconomic news and liquidity updates. 🔸 Potential breakout opportunities in quality altcoins.
📌 Reminder: Markets reward discipline, not emotions. Stick to your trading plan, manage risk, and avoid FOMO during sudden price moves.
💬 What are you expecting next week? Bullish 📈 or Bearish 📉? Share your thoughts below!
#Bitcoin #MarketRecap #WeeklyOutlook #Investing #trending
📊 Weekly Crypto Market Recap + Next Week Outlook 🚀
The crypto market wrapped up the week with mixed momentum. Bitcoin continued to hold key support levels, while Ethereum showed resilience despite short-term volatility. Several altcoins outperformed the broader market, signalling that investors are selectively rotating capital into high-potential projects rather than chasing every rally.
🔍 This Week's Highlights
✅ Bitcoin remained relatively stable above major support.
✅ Ethereum maintained bullish structure.
✅ AI and DeFi tokens attracted renewed attention.
✅ Market sentiment improved as buying pressure increased.
👀 What to Watch Next Week
🔸 Bitcoin's reaction around key resistance levels.
🔸 Ethereum's ability to sustain upward momentum.
🔸 Macroeconomic news and liquidity updates. 🔸 Potential breakout opportunities in quality altcoins.
📌 Reminder: Markets reward discipline, not emotions. Stick to your trading plan, manage risk, and avoid FOMO during sudden price moves.
💬 What are you expecting next week? Bullish 📈 or Bearish 📉? Share your thoughts below!
#Bitcoin #MarketRecap #WeeklyOutlook #Investing #trending
The crypto market wrapped up the week with mixed momentum. Bitcoin continued to hold key support levels, while Ethereum showed resilience despite short-term volatility. Several altcoins outperformed the broader market, signalling that investors are selectively rotating capital into high-potential projects rather than chasing every rally.
🔍 This Week's Highlights
✅ Bitcoin remained relatively stable above major support.
✅ Ethereum maintained bullish structure.
✅ AI and DeFi tokens attracted renewed attention.
✅ Market sentiment improved as buying pressure increased.
👀 What to Watch Next Week
🔸 Bitcoin's reaction around key resistance levels.
🔸 Ethereum's ability to sustain upward momentum.
🔸 Macroeconomic news and liquidity updates. 🔸 Potential breakout opportunities in quality altcoins.
📌 Reminder: Markets reward discipline, not emotions. Stick to your trading plan, manage risk, and avoid FOMO during sudden price moves.
💬 What are you expecting next week? Bullish 📈 or Bearish 📉? Share your thoughts below!
#Bitcoin #MarketRecap #WeeklyOutlook #Investing #trending
1
73

·
--
📅 NIVEAUX CLÉS À SURVEILLER CETTE SEMAINE 📅
Point de contrôle de lundi soir ! Voici ce qui compte CETTE SEMAINE :
🔴 BTC - 62 904$
━━━━━━━━━━━━━━━━━
📈 Bullish au-dessus de : 63 500$
📉 Baissier en dessous de : 62 000$
🎯 Objectif hebdomadaire : 65 000$
⚠️ Support hebdomadaire : 60 000$
💡 STRATÉGIE : Acheter les replis vers 62K, vendre les hausses vers 65K
━━━━━━━━━━━━━━━━━
━━━━━━━━━━━━━━━━━
🔥 3 COINS À SURVEILLER CETTE SEMAINE :
1️⃣ $BNB - 581$
→ Rupture de 585 = Rally vers 600$
→ Fondamentaux solides, pump régulier
2️⃣ $SOL - 80$
→ Maintien du support à 78$
→ Rupture de 82 = Retour à 88$
3️⃣ $ETH - 1 767$
→ Consolidation qui se passe bien
→ Rupture de 1 800 = 1 900 en approche
━━━━━━━━━━━━━━━━━
⚠️ RISQUES CETTE SEMAINE :
- Données économiques US mercredi
- Volatilité du BTC autour de 63K
- Ne pas FOMO lors des pumps
✅ MON PLAN HEBDOMADAIRE :
- Scalps longs sur replis
- Prendre les profits sur résistance
- Garder le SL serré (5%)
📌 Enregistre ce post pour la semaine !
C’EST QUOI TON PLUS GROS TRADE CETTE SEMAINE ? Réponds en commentaire ! 👇
#bitcoin.” #CryptoTrends2024 #WeeklyOutlook
📅 NIVEAUX CLÉS À SURVEILLER CETTE SEMAINE 📅
Point de contrôle de lundi soir ! Voici ce qui compte CETTE SEMAINE :
🔴 BTC - 62 904$
━━━━━━━━━━━━━━━━━
📈 Bullish au-dessus de : 63 500$
📉 Baissier en dessous de : 62 000$
🎯 Objectif hebdomadaire : 65 000$
⚠️ Support hebdomadaire : 60 000$
💡 STRATÉGIE : Acheter les replis vers 62K, vendre les hausses vers 65K
━━━━━━━━━━━━━━━━━
━━━━━━━━━━━━━━━━━
🔥 3 COINS À SURVEILLER CETTE SEMAINE :
1️⃣ $BNB - 581$
→ Rupture de 585 = Rally vers 600$
→ Fondamentaux solides, pump régulier
2️⃣ $SOL - 80$
→ Maintien du support à 78$
→ Rupture de 82 = Retour à 88$
3️⃣ $ETH - 1 767$
→ Consolidation qui se passe bien
→ Rupture de 1 800 = 1 900 en approche
━━━━━━━━━━━━━━━━━
⚠️ RISQUES CETTE SEMAINE :
- Données économiques US mercredi
- Volatilité du BTC autour de 63K
- Ne pas FOMO lors des pumps
✅ MON PLAN HEBDOMADAIRE :
- Scalps longs sur replis
- Prendre les profits sur résistance
- Garder le SL serré (5%)
📌 Enregistre ce post pour la semaine !
C’EST QUOI TON PLUS GROS TRADE CETTE SEMAINE ? Réponds en commentaire ! 👇
#bitcoin.” #CryptoTrends2024 #WeeklyOutlook
Point de contrôle de lundi soir ! Voici ce qui compte CETTE SEMAINE :
🔴 BTC - 62 904$
━━━━━━━━━━━━━━━━━
📈 Bullish au-dessus de : 63 500$
📉 Baissier en dessous de : 62 000$
🎯 Objectif hebdomadaire : 65 000$
⚠️ Support hebdomadaire : 60 000$
💡 STRATÉGIE : Acheter les replis vers 62K, vendre les hausses vers 65K
━━━━━━━━━━━━━━━━━
━━━━━━━━━━━━━━━━━
🔥 3 COINS À SURVEILLER CETTE SEMAINE :
1️⃣ $BNB - 581$
→ Rupture de 585 = Rally vers 600$
→ Fondamentaux solides, pump régulier
2️⃣ $SOL - 80$
→ Maintien du support à 78$
→ Rupture de 82 = Retour à 88$
3️⃣ $ETH - 1 767$
→ Consolidation qui se passe bien
→ Rupture de 1 800 = 1 900 en approche
━━━━━━━━━━━━━━━━━
⚠️ RISQUES CETTE SEMAINE :
- Données économiques US mercredi
- Volatilité du BTC autour de 63K
- Ne pas FOMO lors des pumps
✅ MON PLAN HEBDOMADAIRE :
- Scalps longs sur replis
- Prendre les profits sur résistance
- Garder le SL serré (5%)
📌 Enregistre ce post pour la semaine !
C’EST QUOI TON PLUS GROS TRADE CETTE SEMAINE ? Réponds en commentaire ! 👇
#bitcoin.” #CryptoTrends2024 #WeeklyOutlook

39

·
--
Рост
📅 THIS WEEK'S KEY LEVELS TO WATCH 📅
Monday evening check-in! Here's what matters THIS WEEK:
🔴 BTC - $62,904
━━━━━━━━━━━━━━━━━
📈 Bullish above: $63,500
📉 Bearish below: $62,000
🎯 Weekly target: $65,000
⚠️ Weekly support: $60,000
💡 STRATEGY: Buy dips to $62K, sell rallies to $65K
━━━━━━━━━━━━━━━━━
🔥 3 COINS TO WATCH THIS WEEK:
1️⃣ $BNB - $581
→ Breaking $585 = Rally to $600
→ Strong fundamentals, steady pump
2️⃣ $SOL - $80
→ Holding $78 support
→ Break $82 = Back to $88
3️⃣ $ETH - $1,767
→ Consolidating nicely
→ Break $1,800 = $1,900 incoming
━━━━━━━━━━━━━━━━━
⚠️ THIS WEEK'S RISKS:
- US economic data Wednesday
- BTC volatility around $63K
- Don't FOMO into pumps
✅ MY WEEKLY PLAN:
- Scalp longs on dips
- Take profits at resistance
- Keep SL tight (5%)
📌 SAVE this post for the week!
What's YOUR biggest trade this week? Comment below! 👇
#Bitcoin #crypto #WeeklyOutlook #trading
📅 THIS WEEK'S KEY LEVELS TO WATCH 📅
Monday evening check-in! Here's what matters THIS WEEK:
🔴 BTC - $62,904
━━━━━━━━━━━━━━━━━
📈 Bullish above: $63,500
📉 Bearish below: $62,000
🎯 Weekly target: $65,000
⚠️ Weekly support: $60,000
💡 STRATEGY: Buy dips to $62K, sell rallies to $65K
━━━━━━━━━━━━━━━━━
🔥 3 COINS TO WATCH THIS WEEK:
1️⃣ $BNB - $581
→ Breaking $585 = Rally to $600
→ Strong fundamentals, steady pump
2️⃣ $SOL - $80
→ Holding $78 support
→ Break $82 = Back to $88
3️⃣ $ETH - $1,767
→ Consolidating nicely
→ Break $1,800 = $1,900 incoming
━━━━━━━━━━━━━━━━━
⚠️ THIS WEEK'S RISKS:
- US economic data Wednesday
- BTC volatility around $63K
- Don't FOMO into pumps
✅ MY WEEKLY PLAN:
- Scalp longs on dips
- Take profits at resistance
- Keep SL tight (5%)
📌 SAVE this post for the week!
What's YOUR biggest trade this week? Comment below! 👇
#Bitcoin #crypto #WeeklyOutlook #trading
Monday evening check-in! Here's what matters THIS WEEK:
🔴 BTC - $62,904
━━━━━━━━━━━━━━━━━
📈 Bullish above: $63,500
📉 Bearish below: $62,000
🎯 Weekly target: $65,000
⚠️ Weekly support: $60,000
💡 STRATEGY: Buy dips to $62K, sell rallies to $65K
━━━━━━━━━━━━━━━━━
🔥 3 COINS TO WATCH THIS WEEK:
1️⃣ $BNB - $581
→ Breaking $585 = Rally to $600
→ Strong fundamentals, steady pump
2️⃣ $SOL - $80
→ Holding $78 support
→ Break $82 = Back to $88
3️⃣ $ETH - $1,767
→ Consolidating nicely
→ Break $1,800 = $1,900 incoming
━━━━━━━━━━━━━━━━━
⚠️ THIS WEEK'S RISKS:
- US economic data Wednesday
- BTC volatility around $63K
- Don't FOMO into pumps
✅ MY WEEKLY PLAN:
- Scalp longs on dips
- Take profits at resistance
- Keep SL tight (5%)
📌 SAVE this post for the week!
What's YOUR biggest trade this week? Comment below! 👇
#Bitcoin #crypto #WeeklyOutlook #trading

3
2.5k

·
--
Рост
🔥 WEEKLY OUTLOOK: $UTK Rockets +16%! Is The Giant Awakening? 🚀
$UTK just delivered a stellar +16% pump today, breaking through key resistance like butter. This is exactly the kind of momentum we love to see in altseason! 🌊
🟢 WEEKLY BIAS: BULLISH 📈
Three reasons I'm staying long on $UTK:
⚡ Clean breakout above $0.0075 resistance with solid volume confirmation.
💪 Strong bounce from the $0.0068 low shows eager buyers stepping in.
🌍 Macro tailwinds as payment tokens are starting to gain serious traction.
🎯 KEY LEVELS TO WATCH
🛑 Resistance: $0.0095 (Next major hurdle to cross)
🛡️ Support: $0.0070 (Critical zone that bulls must hold)
👀 ALTCOINS ON MY RADAR
💜 MATIC — coiling tightly for another potential leg up.
💙 $LRC — the zkRollup narrative is heating up again.
⚠️ Reminder: We are still navigating volatile waters. Risk management is everything. Size your positions accordingly and never chase the green candles. 🛑
🕯️ The weekly close will be crucial for UTK's next macro move. Bulls need to defend current levels at all costs.
👇 Follow for daily crypto insights and premium trade setups! ✨
#CryptoTrading #AltcoinSeason #TechnicalAnalysis #Weeklyoutlook
🔥 WEEKLY OUTLOOK: $UTK Rockets +16%! Is The Giant Awakening? 🚀
$UTK just delivered a stellar +16% pump today, breaking through key resistance like butter. This is exactly the kind of momentum we love to see in altseason! 🌊
🟢 WEEKLY BIAS: BULLISH 📈
Three reasons I'm staying long on $UTK:
⚡ Clean breakout above $0.0075 resistance with solid volume confirmation.
💪 Strong bounce from the $0.0068 low shows eager buyers stepping in.
🌍 Macro tailwinds as payment tokens are starting to gain serious traction.
🎯 KEY LEVELS TO WATCH
🛑 Resistance: $0.0095 (Next major hurdle to cross)
🛡️ Support: $0.0070 (Critical zone that bulls must hold)
👀 ALTCOINS ON MY RADAR
💜 MATIC — coiling tightly for another potential leg up.
💙 $LRC — the zkRollup narrative is heating up again.
⚠️ Reminder: We are still navigating volatile waters. Risk management is everything. Size your positions accordingly and never chase the green candles. 🛑
🕯️ The weekly close will be crucial for UTK's next macro move. Bulls need to defend current levels at all costs.
👇 Follow for daily crypto insights and premium trade setups! ✨
#CryptoTrading #AltcoinSeason #TechnicalAnalysis #Weeklyoutlook
$UTK just delivered a stellar +16% pump today, breaking through key resistance like butter. This is exactly the kind of momentum we love to see in altseason! 🌊
🟢 WEEKLY BIAS: BULLISH 📈
Three reasons I'm staying long on $UTK:
⚡ Clean breakout above $0.0075 resistance with solid volume confirmation.
💪 Strong bounce from the $0.0068 low shows eager buyers stepping in.
🌍 Macro tailwinds as payment tokens are starting to gain serious traction.
🎯 KEY LEVELS TO WATCH
🛑 Resistance: $0.0095 (Next major hurdle to cross)
🛡️ Support: $0.0070 (Critical zone that bulls must hold)
👀 ALTCOINS ON MY RADAR
💜 MATIC — coiling tightly for another potential leg up.
💙 $LRC — the zkRollup narrative is heating up again.
⚠️ Reminder: We are still navigating volatile waters. Risk management is everything. Size your positions accordingly and never chase the green candles. 🛑
🕯️ The weekly close will be crucial for UTK's next macro move. Bulls need to defend current levels at all costs.
👇 Follow for daily crypto insights and premium trade setups! ✨
#CryptoTrading #AltcoinSeason #TechnicalAnalysis #Weeklyoutlook

1
99

💡 Monday Session Signals: Correction Day Often Sets Weekly Tone
On July 13, 2026, Bitcoin -2.02% to $62,665 sets a bearish Monday tone. Monday direction often correlates with the weekly close.
If $BTC bounces from $62,600 support, the week could see a recovery toward $64K.
Watch for the Tuesday Asia session — it often confirms or reverses Monday direction.
📌 Key Takeaway:
Monday Bitcoin correction sets a cautious weekly tone — a $62.6K hold could still lead to a weekly recovery.
#Trading #WeeklyOutlook
#BinanceAlphaAlert
💡 Monday Session Signals: Correction Day Often Sets Weekly Tone
On July 13, 2026, Bitcoin -2.02% to $62,665 sets a bearish Monday tone. Monday direction often correlates with the weekly close.
If $BTC bounces from $62,600 support, the week could see a recovery toward $64K.
Watch for the Tuesday Asia session — it often confirms or reverses Monday direction.
📌 Key Takeaway:
Monday Bitcoin correction sets a cautious weekly tone — a $62.6K hold could still lead to a weekly recovery.
#Trading #WeeklyOutlook
#BinanceAlphaAlert
On July 13, 2026, Bitcoin -2.02% to $62,665 sets a bearish Monday tone. Monday direction often correlates with the weekly close.
If $BTC bounces from $62,600 support, the week could see a recovery toward $64K.
Watch for the Tuesday Asia session — it often confirms or reverses Monday direction.
📌 Key Takeaway:
Monday Bitcoin correction sets a cautious weekly tone — a $62.6K hold could still lead to a weekly recovery.
#Trading #WeeklyOutlook
#BinanceAlphaAlert
1
20

Проверено
Статья
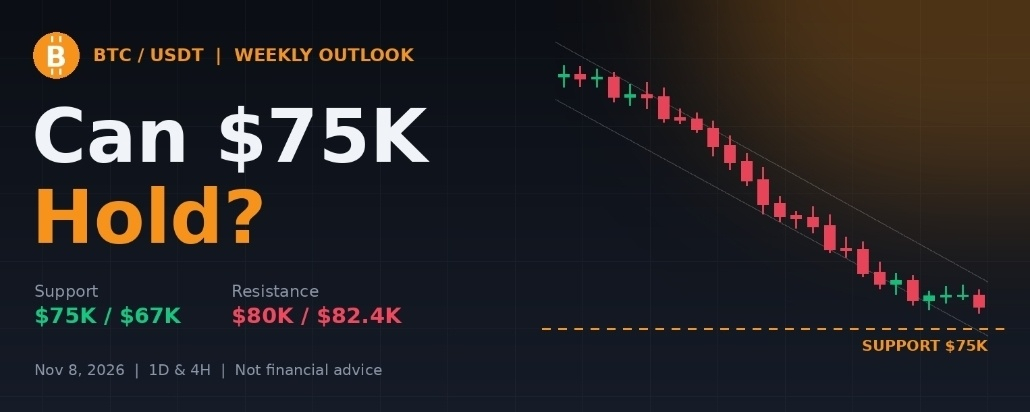
$BTC Weekly Outlook: Can $75K Hold Into a Heavy News Week? 08 November 2026📊Weekly analysis | November 8, 2026 | BTC/USDT, 1D and 4H charts
Market Overview
$BTC is trading near $75,900 after a difficult month. October closed about 7.3% lower, near $77,500, as credit conditions tightened and a record $6.3B hack hit Binance in the last days of the month. This week price dipped under $76K on Nov 5, bounced from around $75,200, and is down about 2% on the week. Despite heavy headlines, price has held the $75K zone.
Daily Chart (1D)
- 🟢 Support: $75K zone, tested again this week. Analysts also point to a cluster of long-term averages around $75.8K–76.2K.
- 📈 Rising trendline: around $70–71K
- ⚠️ Major support: $67,292
- 🔴 Resistance: EMAs near $76.5K and $78.6K, then $80K (channel top), $82,479 and $94,150
- 📉 RSI: 38, so momentum is weak but not oversold
- 📊 Volume: light during the sideways bounce, so buyers are not rushing in yet
4-Hour Chart (4H)
Price is moving sideways just above $75K, below the 4H EMAs (about $76.4K and $79.7K). RSI is near 40. This looks like a pause, not a reversal.
News to Watch
- 🏦 Fed and inflation: The Fed held in late October with no sign of easing. October CPI comes out Tuesday, Nov 10 at 8:30 AM ET. Economists expect +0.3% for the month and 3.7% year over year. A hotter number could pressure BTC, and a cooler one could help.
- 📉 ETF flows: ETFs saw roughly $290M of net outflows in October. I want to see inflows return.
- 🔐 Binance: Withdrawals reopened on Nov 1, and Binance says it has replaced about 95% of the stolen assets. Smooth completion of withdrawals matters for trust.
- 🏢 MSCI, Nov 11: The index provider decides which bitcoin treasury companies, such as Strategy, may be removed from its indices. This could affect sentiment.
Scenarios
🟢 Bullish: $75K holds, CPI is calm, and BTC breaks above $78.6K and then $80K with rising volume. Next targets are $82.4K, then the top of the range.
🔴 Bearish: $75K breaks on a hot CPI or weak flows. The next stops are the trendline at $70–71K, then $67.3K.
My Takeaway
$75K is the line this week. I'm waiting for confirmation instead of guessing, and I'll be careful around CPI day. Patience matters more than speed here.
What's your view this week: bounce or breakdown? 👇
📚 Sources
Price levels, RSI, EMAs and volume come from my own TradingView charts. The news comes from public reports:
- Charts: TradingView, BTC/USDT on Binance (1D and 4H)
- October recap, Binance hack, Fed, MSCI date: 21Shares, "Bitcoin post-Binance hack: What recovery needs in November" (Nov 3, 2026)
- This week's price move: 24/7 Wall St, "Best Crypto to Buy in November 2026" (Nov 7, 2026)
- CPI date: US Bureau of Labor Statistics release schedule
- CPI expectations: Economic Weekly (Nov 6, 2026)
Disclaimer: This is my personal analysis for education only, not financial advice. Crypto is high risk. Do your own research and manage your risk.
#BTC #Bitcoin #WeeklyOutlook #CryptoAnalysis #BinanceSquare
$BTC Weekly Outlook: Can $75K Hold Into a Heavy News Week? 08 November 2026📊
Weekly analysis | November 8, 2026 | BTC/USDT, 1D and 4H charts
Market Overview
$BTC is trading near $75,900 after a difficult month. October closed about 7.3% lower, near $77,500, as credit conditions tightened and a record $6.3B hack hit Binance in the last days of the month. This week price dipped under $76K on Nov 5, bounced from around $75,200, and is down about 2% on the week. Despite heavy headlines, price has held the $75K zone.
Daily Chart (1D)
- 🟢 Support: $75K zone, tested again this week. Analysts also point to a cluster of long-term averages around $75.8K–76.2K.
- 📈 Rising trendline: around $70–71K
- ⚠️ Major support: $67,292
- 🔴 Resistance: EMAs near $76.5K and $78.6K, then $80K (channel top), $82,479 and $94,150
- 📉 RSI: 38, so momentum is weak but not oversold
- 📊 Volume: light during the sideways bounce, so buyers are not rushing in yet
4-Hour Chart (4H)
Price is moving sideways just above $75K, below the 4H EMAs (about $76.4K and $79.7K). RSI is near 40. This looks like a pause, not a reversal.
News to Watch
- 🏦 Fed and inflation: The Fed held in late October with no sign of easing. October CPI comes out Tuesday, Nov 10 at 8:30 AM ET. Economists expect +0.3% for the month and 3.7% year over year. A hotter number could pressure BTC, and a cooler one could help.
- 📉 ETF flows: ETFs saw roughly $290M of net outflows in October. I want to see inflows return.
- 🔐 Binance: Withdrawals reopened on Nov 1, and Binance says it has replaced about 95% of the stolen assets. Smooth completion of withdrawals matters for trust.
- 🏢 MSCI, Nov 11: The index provider decides which bitcoin treasury companies, such as Strategy, may be removed from its indices. This could affect sentiment.
Scenarios
🟢 Bullish: $75K holds, CPI is calm, and BTC breaks above $78.6K and then $80K with rising volume. Next targets are $82.4K, then the top of the range.
🔴 Bearish: $75K breaks on a hot CPI or weak flows. The next stops are the trendline at $70–71K, then $67.3K.
My Takeaway
$75K is the line this week. I'm waiting for confirmation instead of guessing, and I'll be careful around CPI day. Patience matters more than speed here.
What's your view this week: bounce or breakdown? 👇
📚 Sources
Price levels, RSI, EMAs and volume come from my own TradingView charts. The news comes from public reports:
- Charts: TradingView, BTC/USDT on Binance (1D and 4H)
- October recap, Binance hack, Fed, MSCI date: 21Shares, "Bitcoin post-Binance hack: What recovery needs in November" (Nov 3, 2026)
- This week's price move: 24/7 Wall St, "Best Crypto to Buy in November 2026" (Nov 7, 2026)
- CPI date: US Bureau of Labor Statistics release schedule
- CPI expectations: Economic Weekly (Nov 6, 2026)
Disclaimer: This is my personal analysis for education only, not financial advice. Crypto is high risk. Do your own research and manage your risk.
#BTC #Bitcoin #WeeklyOutlook #CryptoAnalysis #BinanceSquare
Market Overview
$BTC is trading near $75,900 after a difficult month. October closed about 7.3% lower, near $77,500, as credit conditions tightened and a record $6.3B hack hit Binance in the last days of the month. This week price dipped under $76K on Nov 5, bounced from around $75,200, and is down about 2% on the week. Despite heavy headlines, price has held the $75K zone.
Daily Chart (1D)
- 🟢 Support: $75K zone, tested again this week. Analysts also point to a cluster of long-term averages around $75.8K–76.2K.
- 📈 Rising trendline: around $70–71K
- ⚠️ Major support: $67,292
- 🔴 Resistance: EMAs near $76.5K and $78.6K, then $80K (channel top), $82,479 and $94,150
- 📉 RSI: 38, so momentum is weak but not oversold
- 📊 Volume: light during the sideways bounce, so buyers are not rushing in yet
4-Hour Chart (4H)
Price is moving sideways just above $75K, below the 4H EMAs (about $76.4K and $79.7K). RSI is near 40. This looks like a pause, not a reversal.
News to Watch
- 🏦 Fed and inflation: The Fed held in late October with no sign of easing. October CPI comes out Tuesday, Nov 10 at 8:30 AM ET. Economists expect +0.3% for the month and 3.7% year over year. A hotter number could pressure BTC, and a cooler one could help.
- 📉 ETF flows: ETFs saw roughly $290M of net outflows in October. I want to see inflows return.
- 🔐 Binance: Withdrawals reopened on Nov 1, and Binance says it has replaced about 95% of the stolen assets. Smooth completion of withdrawals matters for trust.
- 🏢 MSCI, Nov 11: The index provider decides which bitcoin treasury companies, such as Strategy, may be removed from its indices. This could affect sentiment.
Scenarios
🟢 Bullish: $75K holds, CPI is calm, and BTC breaks above $78.6K and then $80K with rising volume. Next targets are $82.4K, then the top of the range.
🔴 Bearish: $75K breaks on a hot CPI or weak flows. The next stops are the trendline at $70–71K, then $67.3K.
My Takeaway
$75K is the line this week. I'm waiting for confirmation instead of guessing, and I'll be careful around CPI day. Patience matters more than speed here.
What's your view this week: bounce or breakdown? 👇
📚 Sources
Price levels, RSI, EMAs and volume come from my own TradingView charts. The news comes from public reports:
- Charts: TradingView, BTC/USDT on Binance (1D and 4H)
- October recap, Binance hack, Fed, MSCI date: 21Shares, "Bitcoin post-Binance hack: What recovery needs in November" (Nov 3, 2026)
- This week's price move: 24/7 Wall St, "Best Crypto to Buy in November 2026" (Nov 7, 2026)
- CPI date: US Bureau of Labor Statistics release schedule
- CPI expectations: Economic Weekly (Nov 6, 2026)
Disclaimer: This is my personal analysis for education only, not financial advice. Crypto is high risk. Do your own research and manage your risk.
#BTC #Bitcoin #WeeklyOutlook #CryptoAnalysis #BinanceSquare
266

·
--
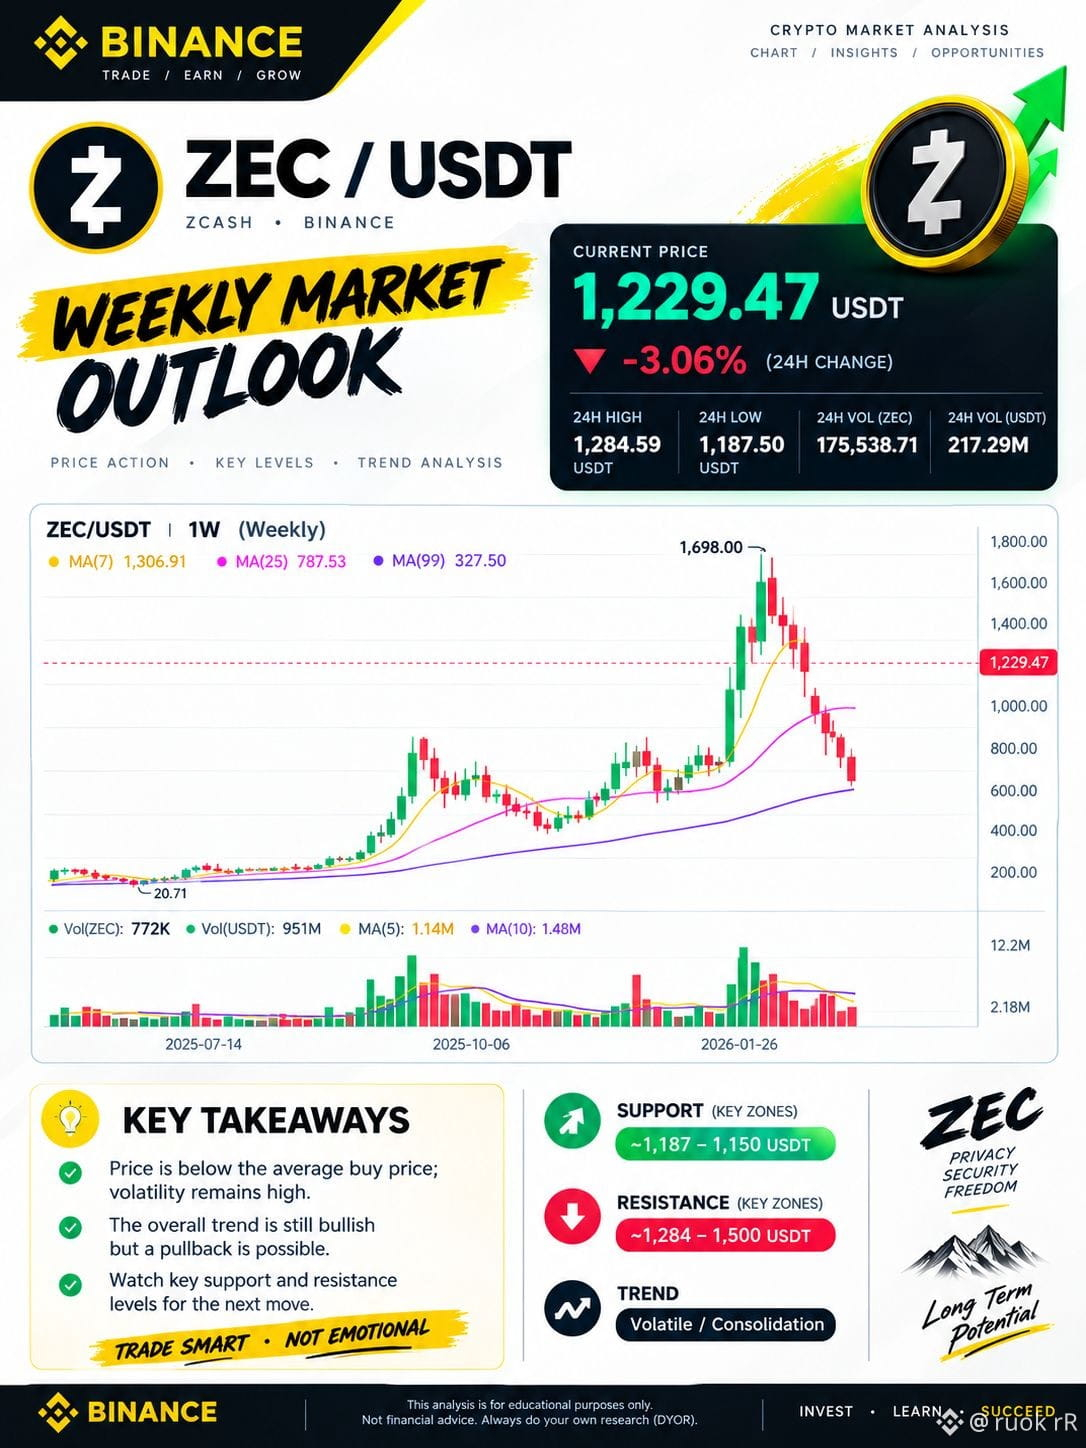
📊 ZEC/USDT Weekly Market Outlook | Binance
🚀 Explore the latest Zcash ($ZEC ) market movements with our weekly technical analysis.
📈 Market Overview
- Current Price: 1,229.47 USDT
- 24H Change: -3.06%
- 24H High: 1,284.59 USDT
- 24H Low: 1,187.50 USDT
🔍 Key Highlights
- Weekly price action and trend analysis
- Important support and resistance zones
- Moving averages (MA 7, MA 25, MA 99)
- Trading volume and market volatility
💡 Trade Smart. Stay Informed.
Monitor key price levels, manage risk, and always do your own research before making trading decisions.
⚠️ Disclaimer: This content is for educational and informational purposes only. It is not financial advice. Cryptocurrency trading involves significant risk.
#ZEC $ZEC #Zcash #ZECUSDT #binance #CryptoAnalysis #TechnicalAnalysis #CryptoTrading #WeeklyOutlook #Cryptocurrency
{spot}(ZECUSDT)
📊 ZEC/USDT Weekly Market Outlook | Binance
🚀 Explore the latest Zcash ($ZEC ) market movements with our weekly technical analysis.
📈 Market Overview
- Current Price: 1,229.47 USDT
- 24H Change: -3.06%
- 24H High: 1,284.59 USDT
- 24H Low: 1,187.50 USDT
🔍 Key Highlights
- Weekly price action and trend analysis
- Important support and resistance zones
- Moving averages (MA 7, MA 25, MA 99)
- Trading volume and market volatility
💡 Trade Smart. Stay Informed.
Monitor key price levels, manage risk, and always do your own research before making trading decisions.
⚠️ Disclaimer: This content is for educational and informational purposes only. It is not financial advice. Cryptocurrency trading involves significant risk.
#ZEC $ZEC #Zcash #ZECUSDT #binance #CryptoAnalysis #TechnicalAnalysis #CryptoTrading #WeeklyOutlook #Cryptocurrency
🚀 Explore the latest Zcash ($ZEC ) market movements with our weekly technical analysis.
📈 Market Overview
- Current Price: 1,229.47 USDT
- 24H Change: -3.06%
- 24H High: 1,284.59 USDT
- 24H Low: 1,187.50 USDT
🔍 Key Highlights
- Weekly price action and trend analysis
- Important support and resistance zones
- Moving averages (MA 7, MA 25, MA 99)
- Trading volume and market volatility
💡 Trade Smart. Stay Informed.
Monitor key price levels, manage risk, and always do your own research before making trading decisions.
⚠️ Disclaimer: This content is for educational and informational purposes only. It is not financial advice. Cryptocurrency trading involves significant risk.
#ZEC $ZEC #Zcash #ZECUSDT #binance #CryptoAnalysis #TechnicalAnalysis #CryptoTrading #WeeklyOutlook #Cryptocurrency
234

·
--
Рост
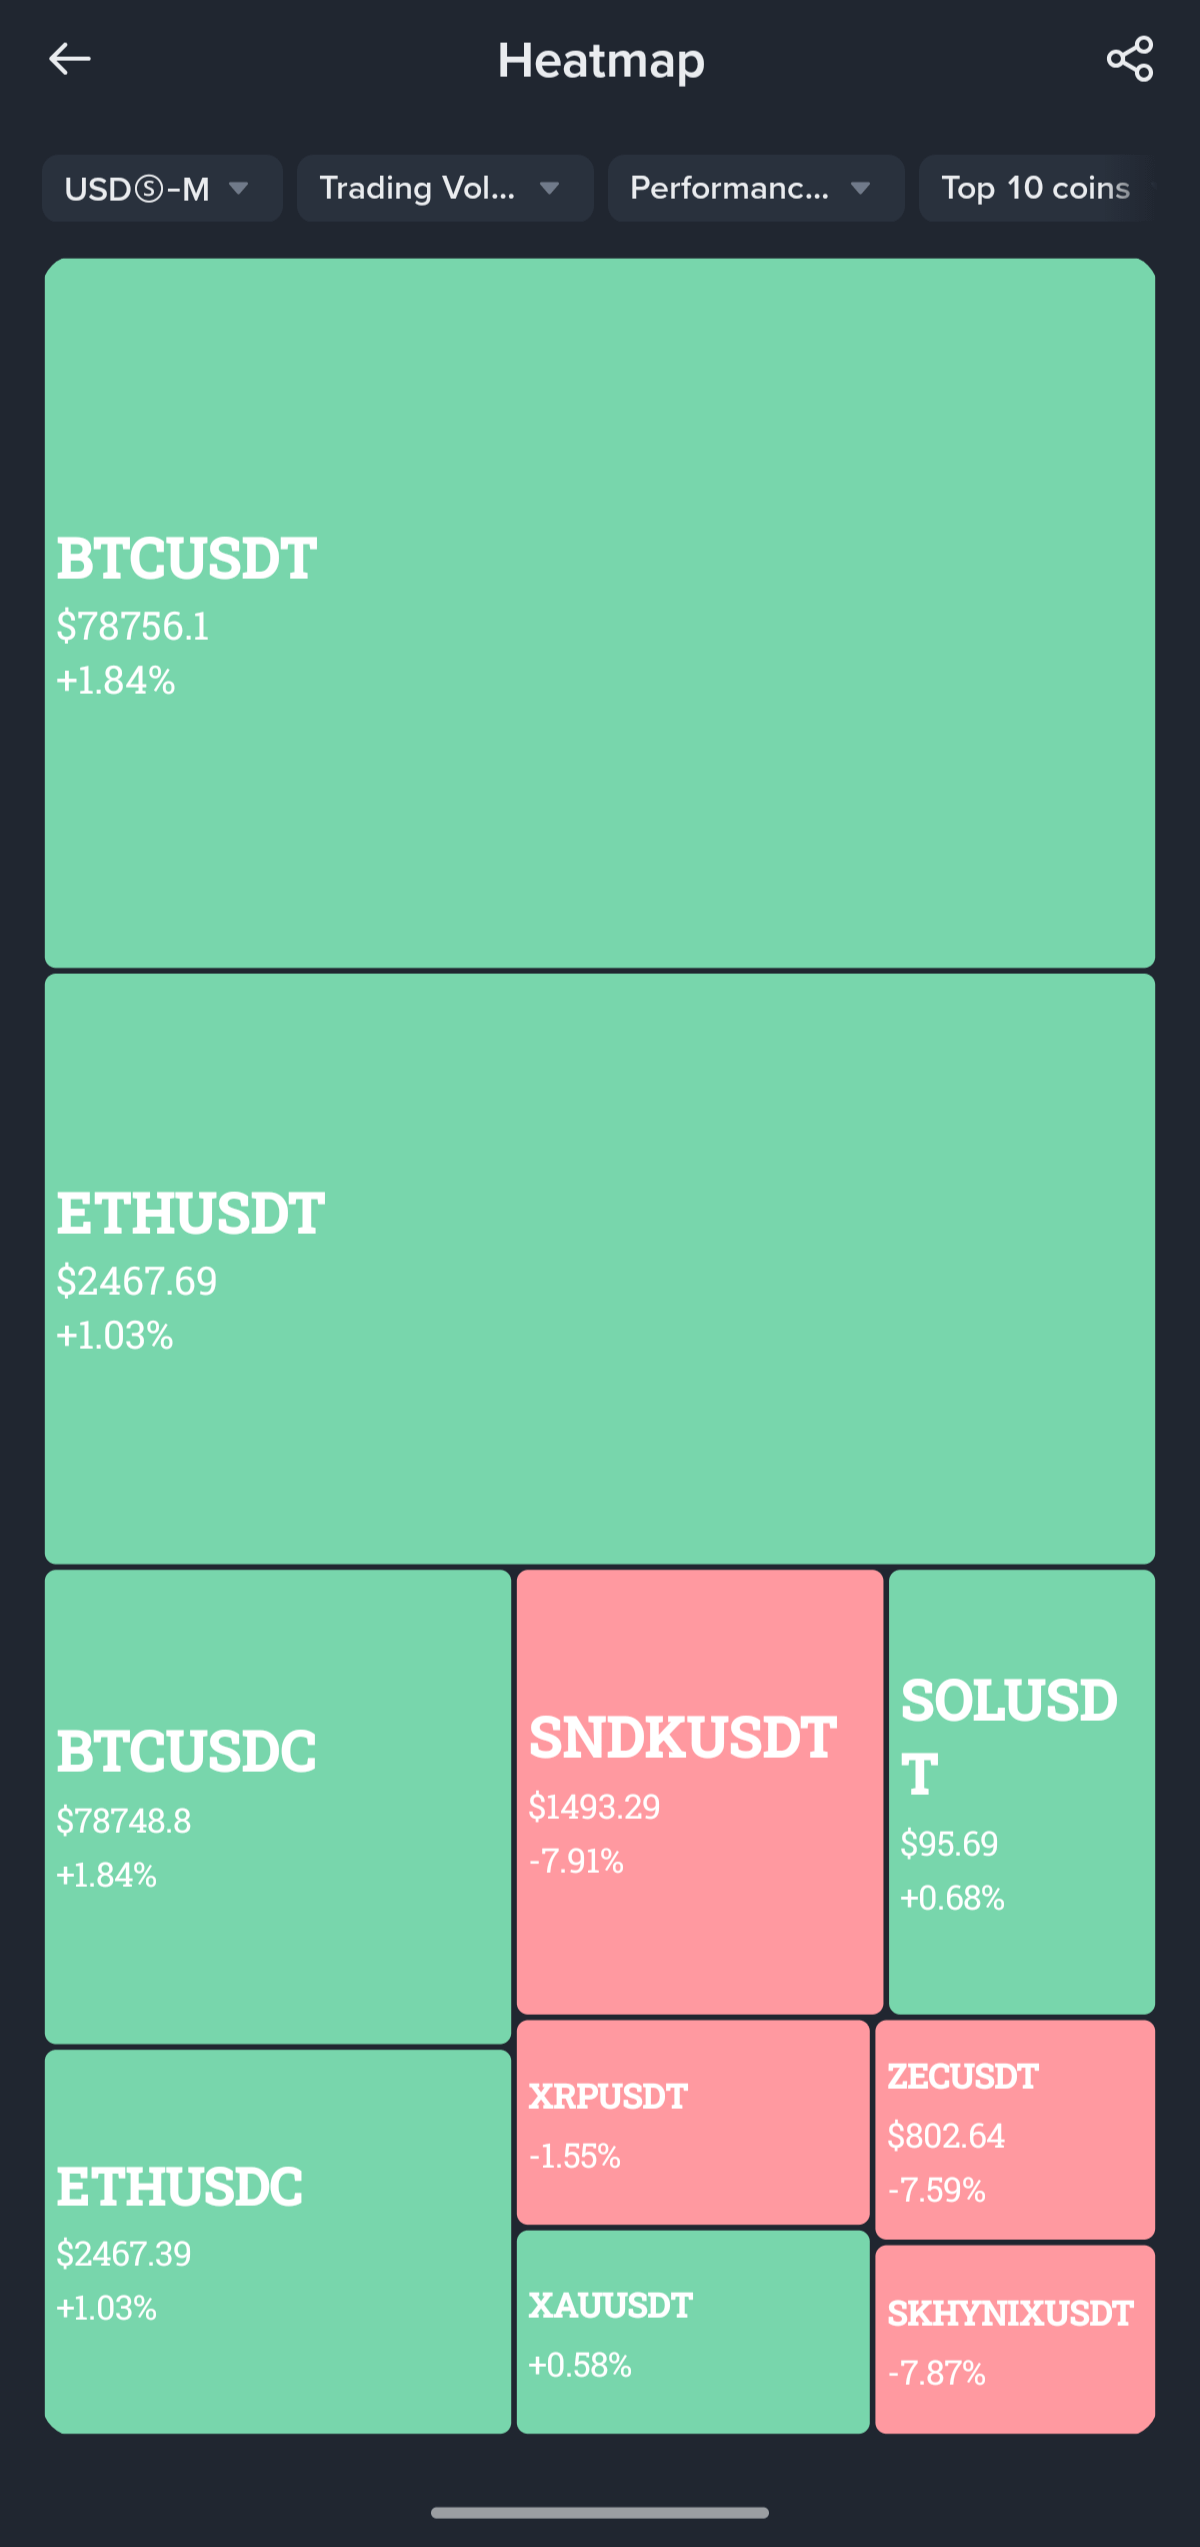
🔮 Late-Night Market Pulse: Key Levels to Watch Into Tomorrow! 🌌
As we wrap up today's trading sessions, $BTC , $ETH & $SOL are holding crucial consolidation ranges. 📊 Watch the upcoming Asian market open for potential volatility breakouts! Keep your risk tight, monitor liquidations, and stay disciplined 🔥
What is your main trade idea for tomorrow morning? Bullish or bearish? Drop it in the comments below! 🚀
#WeeklyOutlook #bitcoin #BinanceSquare #MarketAnalysis #cryptotrading
{future}(BTCUSDT)
{future}(ETHUSDT)
{future}(SOLUSDT)
🔮 Late-Night Market Pulse: Key Levels to Watch Into Tomorrow! 🌌
As we wrap up today's trading sessions, $BTC , $ETH & $SOL are holding crucial consolidation ranges. 📊 Watch the upcoming Asian market open for potential volatility breakouts! Keep your risk tight, monitor liquidations, and stay disciplined 🔥
What is your main trade idea for tomorrow morning? Bullish or bearish? Drop it in the comments below! 🚀
#WeeklyOutlook #bitcoin #BinanceSquare #MarketAnalysis #cryptotrading
As we wrap up today's trading sessions, $BTC , $ETH & $SOL are holding crucial consolidation ranges. 📊 Watch the upcoming Asian market open for potential volatility breakouts! Keep your risk tight, monitor liquidations, and stay disciplined 🔥
What is your main trade idea for tomorrow morning? Bullish or bearish? Drop it in the comments below! 🚀
#WeeklyOutlook #bitcoin #BinanceSquare #MarketAnalysis #cryptotrading
37
·
--
Рост
🚀 $ZEC
{future}(ZECUSDT)
$ZEC +18% IN 24H — PRIVACY COINS WAKING UP? 🔥
📈 ZEC is moving. +18% in 24h and still holding structure — this isn't noise, this is momentum.
🟢 Weekly Bias: BULLISH on ZEC/USDT (4H)
1️⃣ Price broke above key resistance and is holding above $1,300 — structure flipped bullish.
2️⃣ Volume confirms the move. Not a fakeout, buyers are defending levels.
3️⃣ Privacy coins are rotating back into favor as macro uncertainty grows.
🎯 Key Levels to Watch
🟢 Support: $1,280 — $1,300 zone. Lose this and bias shifts neutral fast.
🔴 Resistance: $1,399 high. Clean break above opens $1,500+.
👀 Watch BTC dominance — any drop there fuels alt momentum.
💎 Alts to Watch This Week
🔹 DASH — privacy sector correlation with ZEC, lagging but ready to catch up.
🔹 SCRT — undervalued privacy play, quietly building base structure.
🧠 This is the kind of setup seasoned traders wait for. Momentum + structure + volume alignment. Manage your risk, trail your stops, and let the trade work.
🔥 Follow FAM Trading for daily setups and real-time market reads.
#CryptoTrading #TechnicalAnalysis #BinanceSquare #AltcoinSeason #WeeklyOutlook
🚀 $ZEC
$ZEC +18% IN 24H — PRIVACY COINS WAKING UP? 🔥
📈 ZEC is moving. +18% in 24h and still holding structure — this isn't noise, this is momentum.
🟢 Weekly Bias: BULLISH on ZEC/USDT (4H)
1️⃣ Price broke above key resistance and is holding above $1,300 — structure flipped bullish.
2️⃣ Volume confirms the move. Not a fakeout, buyers are defending levels.
3️⃣ Privacy coins are rotating back into favor as macro uncertainty grows.
🎯 Key Levels to Watch
🟢 Support: $1,280 — $1,300 zone. Lose this and bias shifts neutral fast.
🔴 Resistance: $1,399 high. Clean break above opens $1,500+.
👀 Watch BTC dominance — any drop there fuels alt momentum.
💎 Alts to Watch This Week
🔹 DASH — privacy sector correlation with ZEC, lagging but ready to catch up.
🔹 SCRT — undervalued privacy play, quietly building base structure.
🧠 This is the kind of setup seasoned traders wait for. Momentum + structure + volume alignment. Manage your risk, trail your stops, and let the trade work.
🔥 Follow FAM Trading for daily setups and real-time market reads.
#CryptoTrading #TechnicalAnalysis #BinanceSquare #AltcoinSeason #WeeklyOutlook
$ZEC +18% IN 24H — PRIVACY COINS WAKING UP? 🔥
📈 ZEC is moving. +18% in 24h and still holding structure — this isn't noise, this is momentum.
🟢 Weekly Bias: BULLISH on ZEC/USDT (4H)
1️⃣ Price broke above key resistance and is holding above $1,300 — structure flipped bullish.
2️⃣ Volume confirms the move. Not a fakeout, buyers are defending levels.
3️⃣ Privacy coins are rotating back into favor as macro uncertainty grows.
🎯 Key Levels to Watch
🟢 Support: $1,280 — $1,300 zone. Lose this and bias shifts neutral fast.
🔴 Resistance: $1,399 high. Clean break above opens $1,500+.
👀 Watch BTC dominance — any drop there fuels alt momentum.
💎 Alts to Watch This Week
🔹 DASH — privacy sector correlation with ZEC, lagging but ready to catch up.
🔹 SCRT — undervalued privacy play, quietly building base structure.
🧠 This is the kind of setup seasoned traders wait for. Momentum + structure + volume alignment. Manage your risk, trail your stops, and let the trade work.
🔥 Follow FAM Trading for daily setups and real-time market reads.
#CryptoTrading #TechnicalAnalysis #BinanceSquare #AltcoinSeason #WeeklyOutlook

311
·
--
📊 Weekly Crypto Market Recap & Next Week Outlook
This week, the crypto market remained highly volatile as traders reacted to macroeconomic developments and shifting market sentiment.
🔹 Weekly Highlights • Bitcoin continued to hold key support despite sharp intraday swings. • Ethereum remained resilient, supported by steady network activity. • Several altcoins outperformed the broader market, while meme coins experienced increased volatility. • Investor sentiment improved slightly toward the end of the week.
👀 What to Watch Next Week
✅ Bitcoin's major support and resistance levels.
✅ Ethereum's momentum relative to BTC.
✅ Macroeconomic news that could impact risk assets.
✅ Trading volume and ETF-related developments.
✅ Any breakout or breakdown from the current range.
Remember: Don't chase the market. Let the market come to your setup.
💬 What are you watching next week?
#Bitcoin #Crypto #CryptoNews #MarketRecap #WeeklyOutlook
📊 Weekly Crypto Market Recap & Next Week Outlook
This week, the crypto market remained highly volatile as traders reacted to macroeconomic developments and shifting market sentiment.
🔹 Weekly Highlights • Bitcoin continued to hold key support despite sharp intraday swings. • Ethereum remained resilient, supported by steady network activity. • Several altcoins outperformed the broader market, while meme coins experienced increased volatility. • Investor sentiment improved slightly toward the end of the week.
👀 What to Watch Next Week
✅ Bitcoin's major support and resistance levels.
✅ Ethereum's momentum relative to BTC.
✅ Macroeconomic news that could impact risk assets.
✅ Trading volume and ETF-related developments.
✅ Any breakout or breakdown from the current range.
Remember: Don't chase the market. Let the market come to your setup.
💬 What are you watching next week?
#Bitcoin #Crypto #CryptoNews #MarketRecap #WeeklyOutlook
This week, the crypto market remained highly volatile as traders reacted to macroeconomic developments and shifting market sentiment.
🔹 Weekly Highlights • Bitcoin continued to hold key support despite sharp intraday swings. • Ethereum remained resilient, supported by steady network activity. • Several altcoins outperformed the broader market, while meme coins experienced increased volatility. • Investor sentiment improved slightly toward the end of the week.
👀 What to Watch Next Week
✅ Bitcoin's major support and resistance levels.
✅ Ethereum's momentum relative to BTC.
✅ Macroeconomic news that could impact risk assets.
✅ Trading volume and ETF-related developments.
✅ Any breakout or breakdown from the current range.
Remember: Don't chase the market. Let the market come to your setup.
💬 What are you watching next week?
#Bitcoin #Crypto #CryptoNews #MarketRecap #WeeklyOutlook
1
82

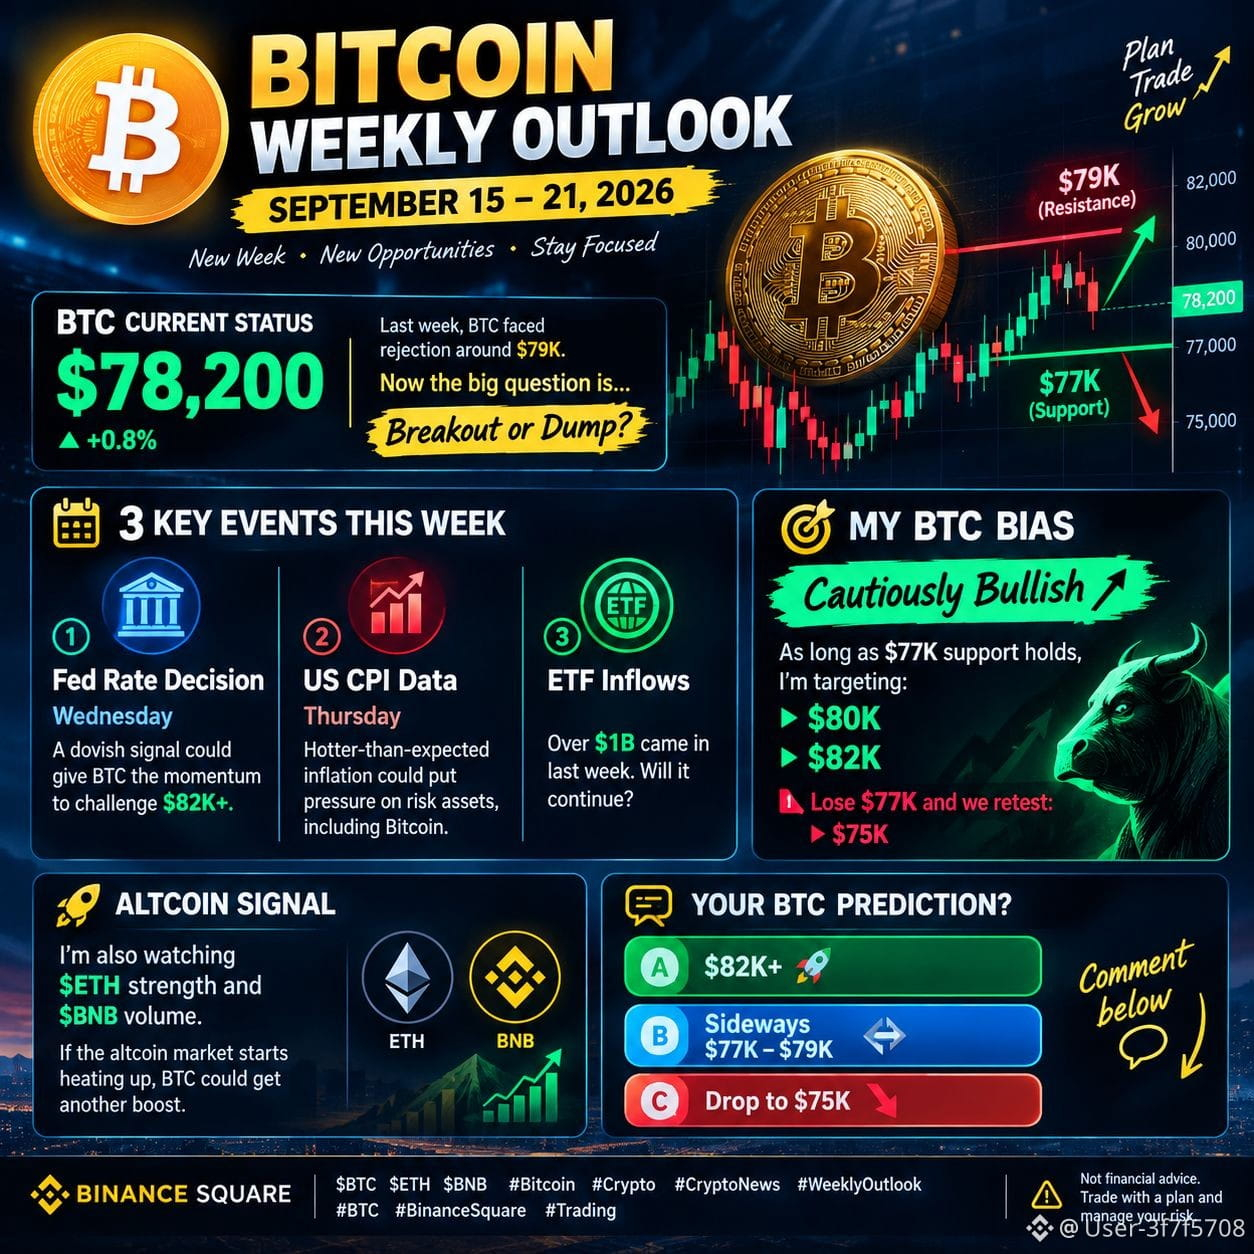
🚀 BITCOIN WEEKLY OUTLOOK — SEPTEMBER 15–21, 2026 🚀
Good morning, traders! 📈
A new week is here, and Bitcoin is sitting at a critical level.
₿ BTC: ~$78,200
Last week, BTC faced rejection around $79K. Now the big question is:
🔥 Will Bitcoin break higher — or see another pullback?
📌 3 KEY THINGS TO WATCH
1️⃣ Fed Rate Decision — Wednesday
A dovish signal could give BTC the momentum to challenge $82K+.
2️⃣ US CPI Data — Thursday
Hotter-than-expected inflation could put pressure on risk assets, including Bitcoin.
3️⃣ ETF Flows 💰
Bitcoin ETFs saw strong inflows last week. The big question is whether institutional demand continues.
🎯 MY BTC BIAS
Cautiously Bullish 🟢
As long as $77K support holds, I’m watching:
➡️ $80K
➡️ $82K
But if BTC loses $77K, a move toward $75K becomes possible.
👀 ALTCOIN SIGNAL
I’m also watching $ETH strength and $BNB volume.
If the altcoin market starts heating up, BTC could get another boost.
🗳️ YOUR BTC PREDICTION?
A) 🚀 $82K+
B) 📊 Sideways $77K–$79K
C) 🔻 Drop to $75K
Drop your prediction below 👇
Not financial advice. Trade with a plan and manage your risk.
$BTC $ETH $BNB
#Bitcoin❗ #Crypto_Jobs🎯 o #CryptoNews #WeeklyOutlook #BTC
🚀 BITCOIN WEEKLY OUTLOOK — SEPTEMBER 15–21, 2026 🚀
Good morning, traders! 📈
A new week is here, and Bitcoin is sitting at a critical level.
₿ BTC: ~$78,200
Last week, BTC faced rejection around $79K. Now the big question is:
🔥 Will Bitcoin break higher — or see another pullback?
📌 3 KEY THINGS TO WATCH
1️⃣ Fed Rate Decision — Wednesday
A dovish signal could give BTC the momentum to challenge $82K+.
2️⃣ US CPI Data — Thursday
Hotter-than-expected inflation could put pressure on risk assets, including Bitcoin.
3️⃣ ETF Flows 💰
Bitcoin ETFs saw strong inflows last week. The big question is whether institutional demand continues.
🎯 MY BTC BIAS
Cautiously Bullish 🟢
As long as $77K support holds, I’m watching:
➡️ $80K
➡️ $82K
But if BTC loses $77K, a move toward $75K becomes possible.
👀 ALTCOIN SIGNAL
I’m also watching $ETH strength and $BNB volume.
If the altcoin market starts heating up, BTC could get another boost.
🗳️ YOUR BTC PREDICTION?
A) 🚀 $82K+
B) 📊 Sideways $77K–$79K
C) 🔻 Drop to $75K
Drop your prediction below 👇
Not financial advice. Trade with a plan and manage your risk.
$BTC $ETH $BNB
#Bitcoin❗ #Crypto_Jobs🎯 o #CryptoNews #WeeklyOutlook #BTC
Good morning, traders! 📈
A new week is here, and Bitcoin is sitting at a critical level.
₿ BTC: ~$78,200
Last week, BTC faced rejection around $79K. Now the big question is:
🔥 Will Bitcoin break higher — or see another pullback?
📌 3 KEY THINGS TO WATCH
1️⃣ Fed Rate Decision — Wednesday
A dovish signal could give BTC the momentum to challenge $82K+.
2️⃣ US CPI Data — Thursday
Hotter-than-expected inflation could put pressure on risk assets, including Bitcoin.
3️⃣ ETF Flows 💰
Bitcoin ETFs saw strong inflows last week. The big question is whether institutional demand continues.
🎯 MY BTC BIAS
Cautiously Bullish 🟢
As long as $77K support holds, I’m watching:
➡️ $80K
➡️ $82K
But if BTC loses $77K, a move toward $75K becomes possible.
👀 ALTCOIN SIGNAL
I’m also watching $ETH strength and $BNB volume.
If the altcoin market starts heating up, BTC could get another boost.
🗳️ YOUR BTC PREDICTION?
A) 🚀 $82K+
B) 📊 Sideways $77K–$79K
C) 🔻 Drop to $75K
Drop your prediction below 👇
Not financial advice. Trade with a plan and manage your risk.
$BTC $ETH $BNB
#Bitcoin❗ #Crypto_Jobs🎯 o #CryptoNews #WeeklyOutlook #BTC
82
·
--
Рост
$BANK
{future}(BANKUSDT)
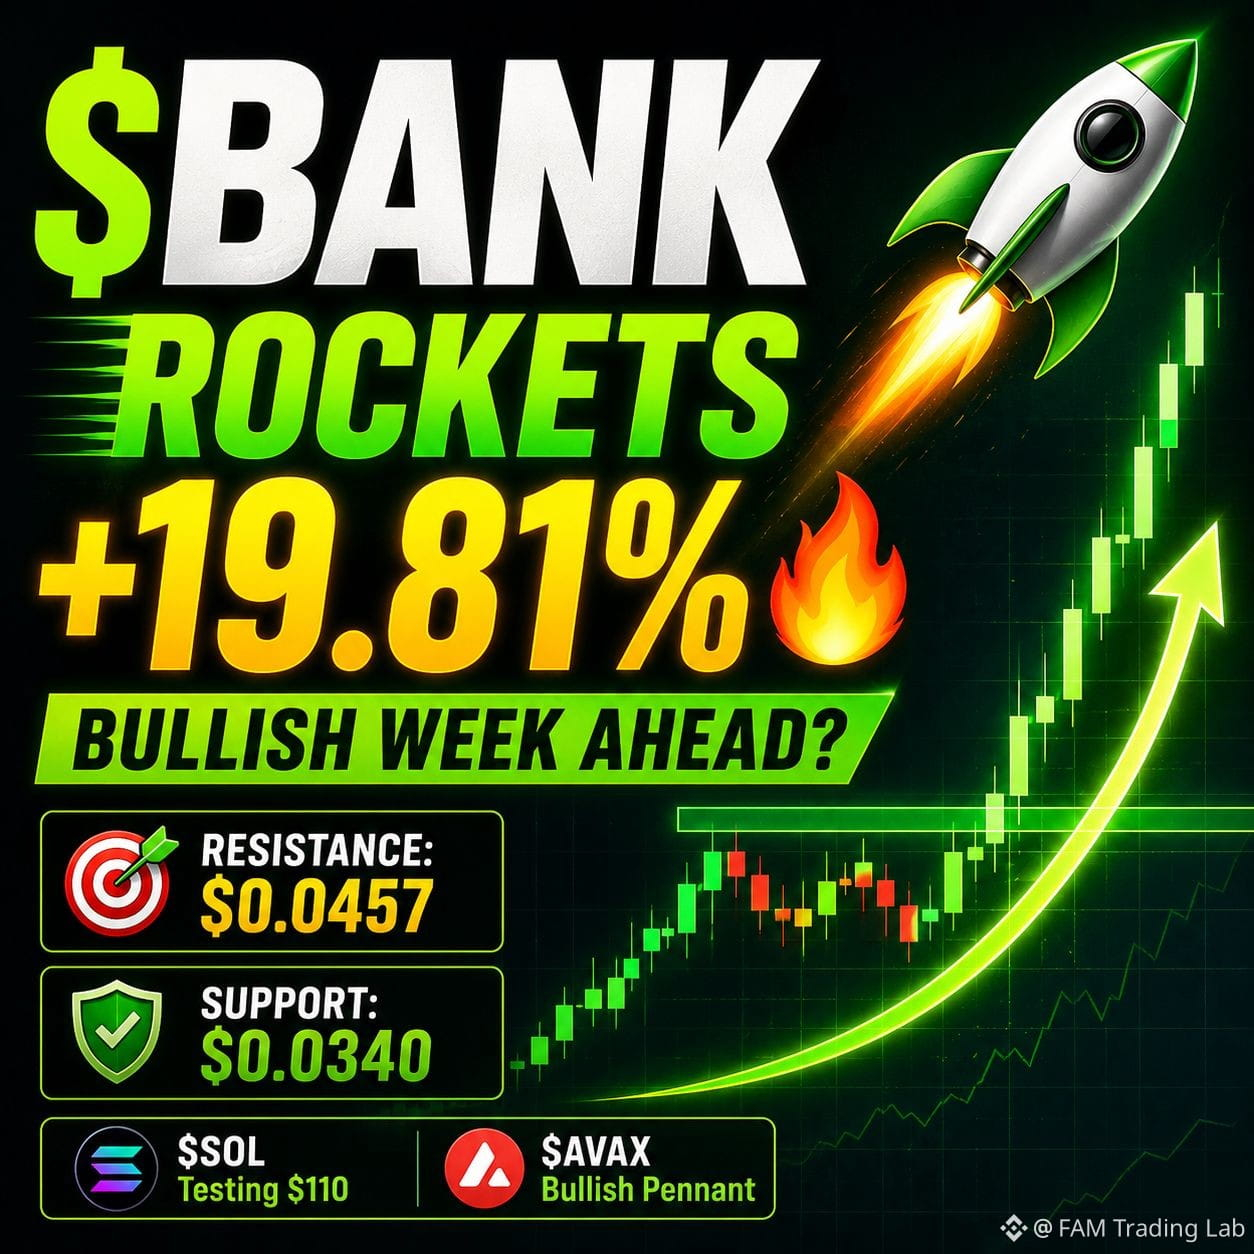
🚀 WEEKLY OUTLOOK | $BANK Rockets +19.81% 🔥
$BANK just delivered what we've been waiting for — a clean breakout with conviction. When alts start moving like this, it's usually the beginning, not the end. 🌊
📈 BULLISH BIAS FOR THE WEEK
⚡ Strong momentum break above $0.038 resistance
🔥 Volume surge confirms institutional interest
🔄 4H structure shows healthy consolidation pattern
🎯 KEY LEVELS TO WATCH
🛑 Resistance: $0.0457 (today's high)
🛡️ Support: $0.0340 zone
📅 Macro: Fed minutes Wednesday could spark volatility
👀 ALTCOINS ON MY RADAR
🥈 SOL — testing major resistance at $110
🔺 AVAX — forming bullish pennant on daily
The setup reminds me of early 2023 alt season. Position sizing is everything here — don't get greedy, but don't miss the wave either. 🏄♂️
⚖️ Risk management over everything. See you in the trenches. 🛠️
Follow for daily setups and market updates 📈
#CryptoTrading #TechnicalAnalysis #BinanceSquare #Altcoins #WeeklyOutlook
$BANK
🚀 WEEKLY OUTLOOK | $BANK Rockets +19.81% 🔥
$BANK just delivered what we've been waiting for — a clean breakout with conviction. When alts start moving like this, it's usually the beginning, not the end. 🌊
📈 BULLISH BIAS FOR THE WEEK
⚡ Strong momentum break above $0.038 resistance
🔥 Volume surge confirms institutional interest
🔄 4H structure shows healthy consolidation pattern
🎯 KEY LEVELS TO WATCH
🛑 Resistance: $0.0457 (today's high)
🛡️ Support: $0.0340 zone
📅 Macro: Fed minutes Wednesday could spark volatility
👀 ALTCOINS ON MY RADAR
🥈 SOL — testing major resistance at $110
🔺 AVAX — forming bullish pennant on daily
The setup reminds me of early 2023 alt season. Position sizing is everything here — don't get greedy, but don't miss the wave either. 🏄♂️
⚖️ Risk management over everything. See you in the trenches. 🛠️
Follow for daily setups and market updates 📈
#CryptoTrading #TechnicalAnalysis #BinanceSquare #Altcoins #WeeklyOutlook
🚀 WEEKLY OUTLOOK | $BANK Rockets +19.81% 🔥
$BANK just delivered what we've been waiting for — a clean breakout with conviction. When alts start moving like this, it's usually the beginning, not the end. 🌊
📈 BULLISH BIAS FOR THE WEEK
⚡ Strong momentum break above $0.038 resistance
🔥 Volume surge confirms institutional interest
🔄 4H structure shows healthy consolidation pattern
🎯 KEY LEVELS TO WATCH
🛑 Resistance: $0.0457 (today's high)
🛡️ Support: $0.0340 zone
📅 Macro: Fed minutes Wednesday could spark volatility
👀 ALTCOINS ON MY RADAR
🥈 SOL — testing major resistance at $110
🔺 AVAX — forming bullish pennant on daily
The setup reminds me of early 2023 alt season. Position sizing is everything here — don't get greedy, but don't miss the wave either. 🏄♂️
⚖️ Risk management over everything. See you in the trenches. 🛠️
Follow for daily setups and market updates 📈
#CryptoTrading #TechnicalAnalysis #BinanceSquare #Altcoins #WeeklyOutlook
124
Войдите, чтобы посмотреть больше материала
Присоединяйтесь к пользователям криптовалют по всему миру на Binance Square
⚡️ Получайте новейшую и полезную информацию о криптоактивах.
💬 Нам доверяет крупнейшая в мире криптобиржа.
👍 Получите достоверные аналитические данные от верифицированных создателей контента.
Эл. почта/номер телефона
В тренде
1
#NvidiaInvestigatesAfterHuang’sAffairApology
Просмотров: 28,642
394 обсуждают
2
#BitcoinFiveWeeklyLosses
Просмотров: 44,084
828 обсуждают
3
#AIChipSlumpNasdaq
Просмотров: 24,718
475 обсуждают
4
#SouthKoreaSupremeCourtClarifiesVirtualAssetSeizureRules
Просмотров: 148
10 обсуждают
5
#EthereumSpotETFsPost$365MWeeklyOutflow
Просмотров: 1,151
34 обсуждают
6
#TradFiForBeginners
Просмотров: 266,004
2,388 обсуждают
7
#GalxeToIntegrateIntoGravityGraduallyCloseQuest
Просмотров: 245
42 обсуждают
8
#KeplrAdvisesSocialLoginUsersToTransferAssets
Просмотров: 92,236
693 обсуждают
9
#TetherPlans€28.8MForJuventusCapitalIncrease
Просмотров: 61,418
505 обсуждают
10
#JobsReportRaisesHikeOdds
Просмотров: 1M
4,707 обсуждают