

#trendlines
trendlines
Просмотров: 26,550
59 обсуждают
Популярные
Новые
·
--
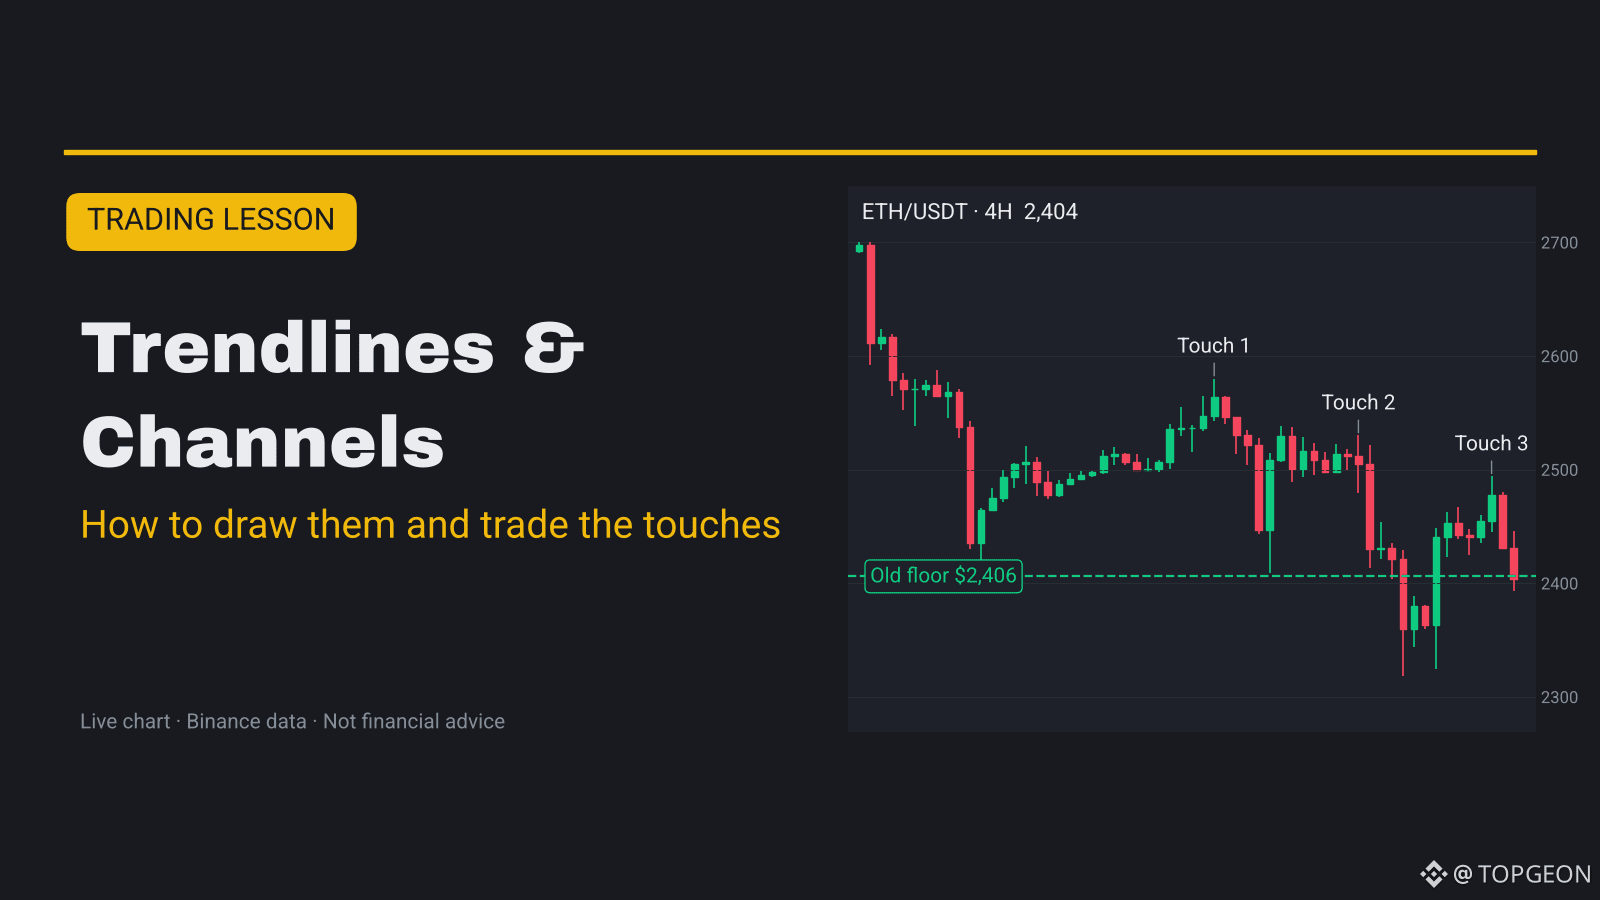
📐 Can $ETH finally break its 4H falling trendline?
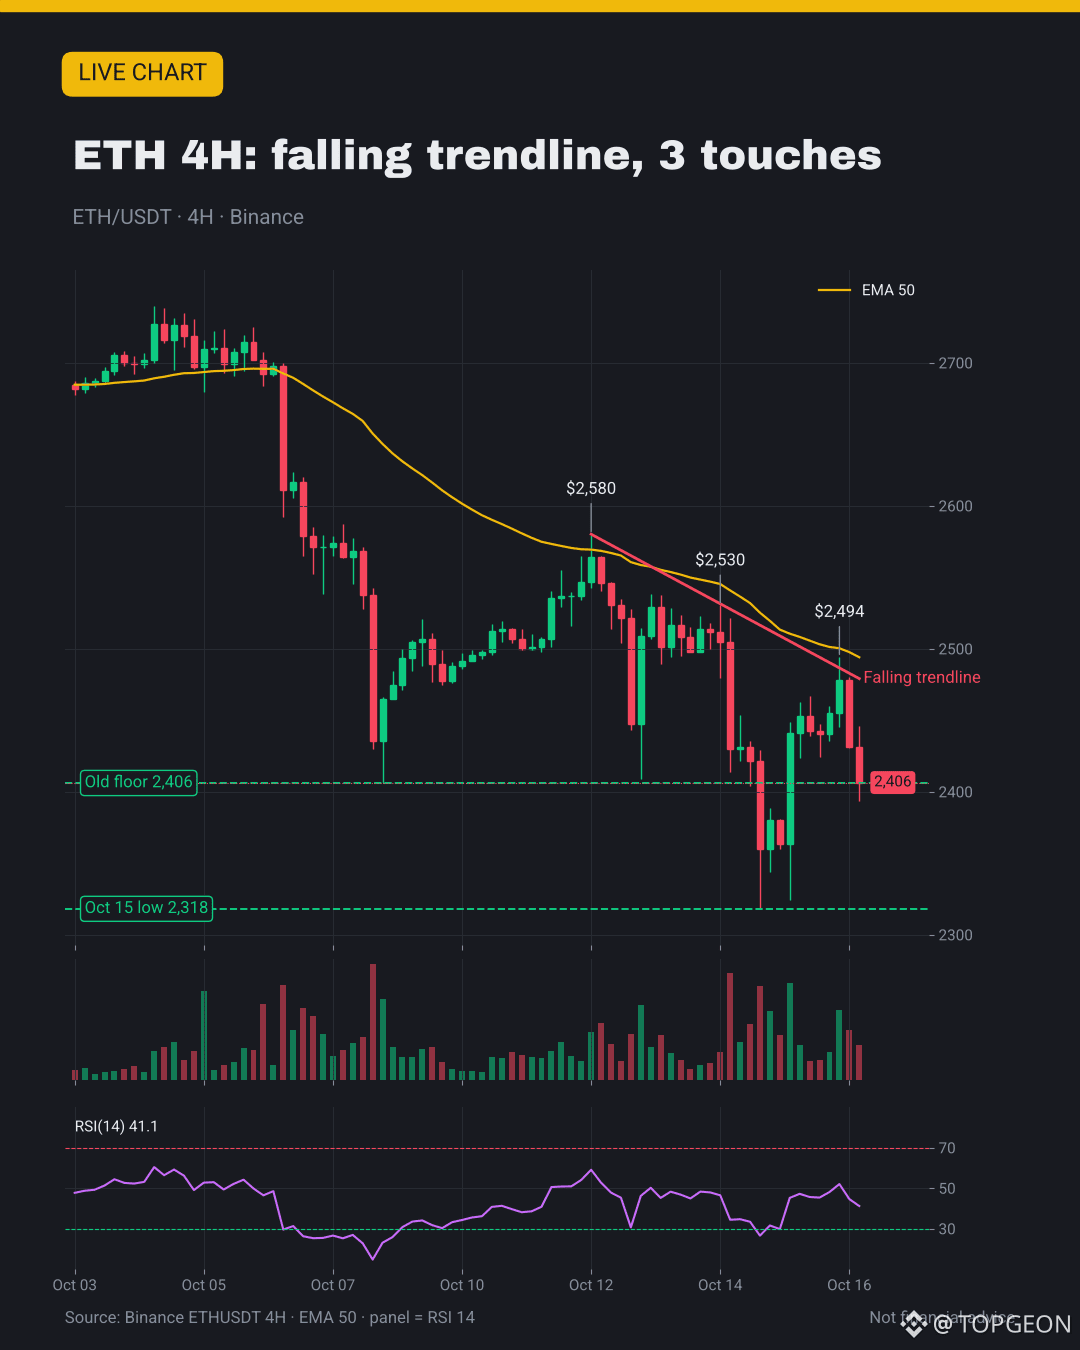
✅ 3 touches: $2,580 Oct 12, $2,530 Oct 14, $2,494 today
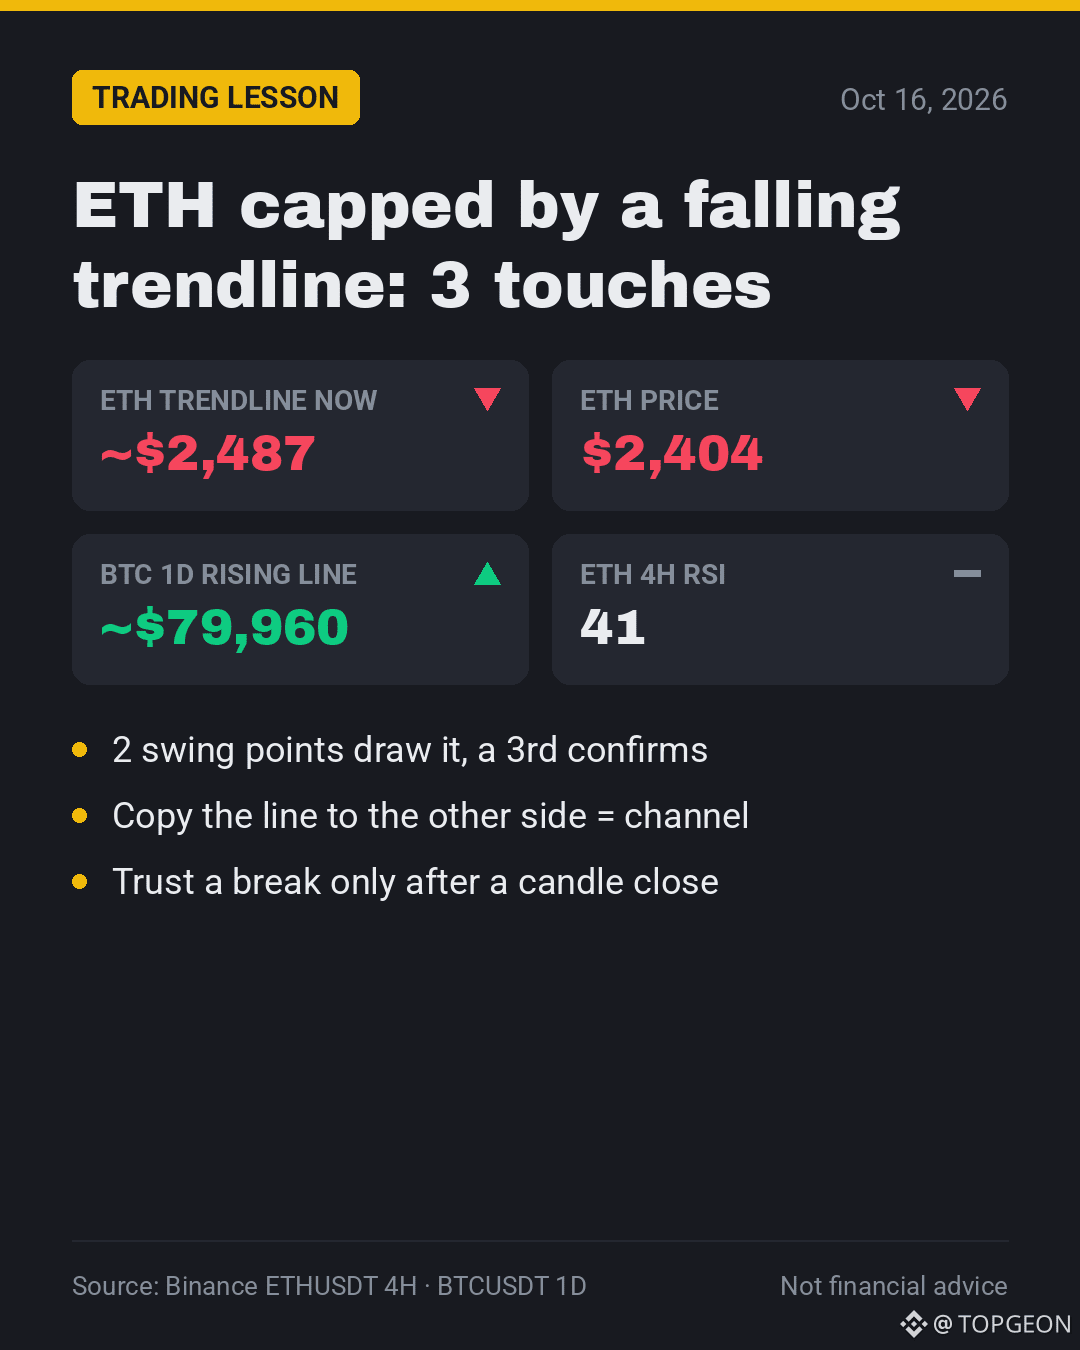
✅ Line now ~$2,487, 4H 50 EMA right on it
⚠️ No 4H close above it since Oct 12
⚠️ Price back on the $2,406 old floor, RSI 41
🎯 My take: 4H close > $2,490 → $2,580; lose $2,406 → $2,318
💬 Breakout or 4th rejection: what's your call? 👇
📖 Full lesson: https://app.binance.com/uni-qr/cart/378000717865959
#Trendlines #PriceAction #Ethereum
1
21
·
--
Статья
Trendlines & Channels: Explained Simply📘 What are Trendlines & Channels?
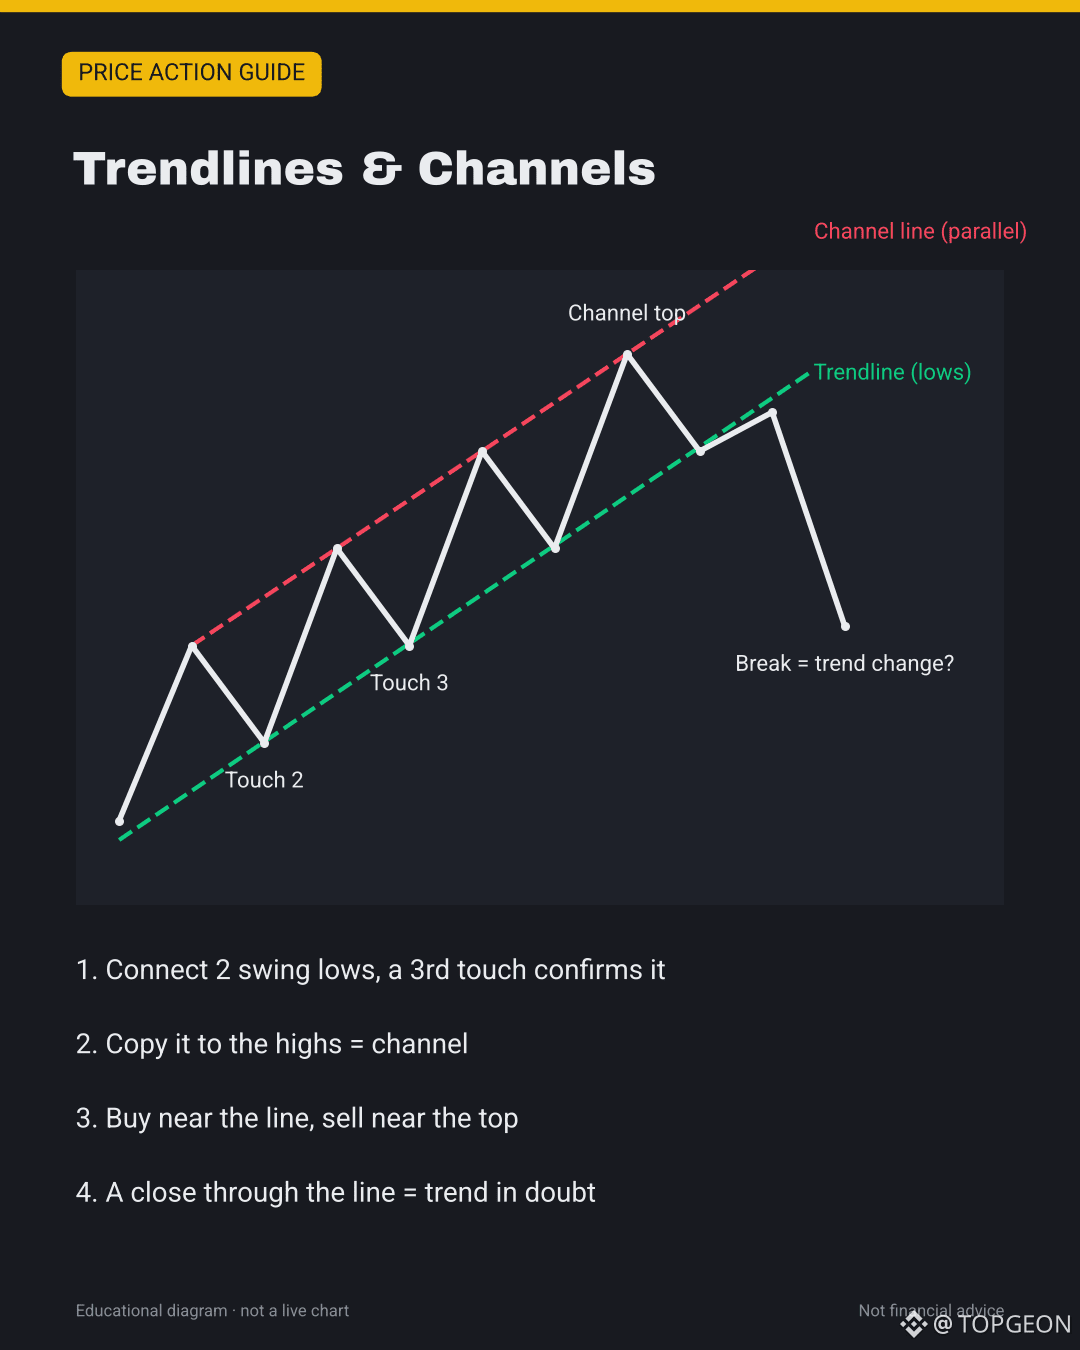
A trendline is a straight, sloped line that connects swing points. In an uptrend you connect the higher lows. In a downtrend you connect the lower highs. It shows the speed and direction of the trend, and where buyers or sellers keep stepping in.
A channel is a trendline plus a parallel copy on the other side of price. Price then moves between two sloped lines, like a support and resistance box that is tilted. Right now $ETH is pressing against a clean falling trendline on the 4H chart.
📊 Live chart in the cover and in the image post below.
🔍 How to draw them
• Uptrend: connect at least 2 clear swing lows, from left to right
• Downtrend: connect at least 2 clear swing highs
• Two points draw the line. A 3rd touch that holds confirms it
• Use wicks or bodies, but be consistent on one chart
• Don't force it: if you must cut through many candles, it is not a real line
• For a channel, copy the line and move it to the opposite swing points
• Steep lines break fast. Lines at 30-45 degrees tend to last longer
📈 How traders use it
• With-trend entry: buy near a rising line, or short near a falling line, after the touch holds
• Channel trade: buy near the bottom line, take profit near the top line
• Breakout: a candle CLOSE through the line, then a retest from the other side, signals the trend may be changing
• Stop-loss: just beyond the line (below a rising line for longs, above a falling line for shorts)
• Target: the opposite channel line, or the next horizontal level
• Channel breakout target: often the channel's height, measured from the break
🧪 Live example: $ETH 4H (and BTC 1D)
• ETH falling trendline with 3 touches: Oct 12 high $2,580, Oct 14 high $2,530, Oct 16 high $2,494
• No 4H candle has closed above it since Oct 12. It falls about $3.4 per 4H candle and sits near $2,487 now
• The 4H 50 EMA (~$2,494) runs along the same line, which makes the cap stronger
• ETH is about $2,405, back on the old $2,406 floor, 4H RSI 41
• What to watch: a 4H close above ~$2,490 breaks the line and opens $2,580. Losing $2,406 points back to the $2,318 Oct 15 low
• BTC 1D has a rising trendline from the Sep 15 low $74,968 to the Oct 15 wick $79,800. It rises about $161 a day and sits near $79,960 today, with BTC around $81,000
• No clean channel is on these charts now: the highs don't line up parallel to the lows, so we don't draw one
⚠️ Common mistakes
• Drawing a line through only one point, or bending the rules to fit what you want to see
• Redrawing the line after every break so it always "works"
• Trading a wick through the line as a breakout. Wait for the close
• Ignoring the timeframe: a 15m trendline means much less than a 1D line
✅ Quick checklist
• Find 2 clear swing points, look for a 3rd touch
• Draw on 4H or 1D first
• Add a parallel line only if price respects it
• Enter on the touch, stop just beyond the line
• Act on a break only after a close and a retest
• Risk only 1-2% of your account per trade
💬 Do you draw trendlines on wicks or on candle bodies? 👇
Not financial advice. DYOR.
#TradingTips #Trendlines #Ethereum
Trendlines & Channels: Explained Simply
📘 What are Trendlines & Channels?
A trendline is a straight, sloped line that connects swing points. In an uptrend you connect the higher lows. In a downtrend you connect the lower highs. It shows the speed and direction of the trend, and where buyers or sellers keep stepping in.
A channel is a trendline plus a parallel copy on the other side of price. Price then moves between two sloped lines, like a support and resistance box that is tilted. Right now $ETH is pressing against a clean falling trendline on the 4H chart.
📊 Live chart in the cover and in the image post below.
🔍 How to draw them
• Uptrend: connect at least 2 clear swing lows, from left to right
• Downtrend: connect at least 2 clear swing highs
• Two points draw the line. A 3rd touch that holds confirms it
• Use wicks or bodies, but be consistent on one chart
• Don't force it: if you must cut through many candles, it is not a real line
• For a channel, copy the line and move it to the opposite swing points
• Steep lines break fast. Lines at 30-45 degrees tend to last longer
📈 How traders use it
• With-trend entry: buy near a rising line, or short near a falling line, after the touch holds
• Channel trade: buy near the bottom line, take profit near the top line
• Breakout: a candle CLOSE through the line, then a retest from the other side, signals the trend may be changing
• Stop-loss: just beyond the line (below a rising line for longs, above a falling line for shorts)
• Target: the opposite channel line, or the next horizontal level
• Channel breakout target: often the channel's height, measured from the break
🧪 Live example: $ETH 4H (and BTC 1D)
• ETH falling trendline with 3 touches: Oct 12 high $2,580, Oct 14 high $2,530, Oct 16 high $2,494
• No 4H candle has closed above it since Oct 12. It falls about $3.4 per 4H candle and sits near $2,487 now
• The 4H 50 EMA (~$2,494) runs along the same line, which makes the cap stronger
• ETH is about $2,405, back on the old $2,406 floor, 4H RSI 41
• What to watch: a 4H close above ~$2,490 breaks the line and opens $2,580. Losing $2,406 points back to the $2,318 Oct 15 low
• BTC 1D has a rising trendline from the Sep 15 low $74,968 to the Oct 15 wick $79,800. It rises about $161 a day and sits near $79,960 today, with BTC around $81,000
• No clean channel is on these charts now: the highs don't line up parallel to the lows, so we don't draw one
⚠️ Common mistakes
• Drawing a line through only one point, or bending the rules to fit what you want to see
• Redrawing the line after every break so it always "works"
• Trading a wick through the line as a breakout. Wait for the close
• Ignoring the timeframe: a 15m trendline means much less than a 1D line
✅ Quick checklist
• Find 2 clear swing points, look for a 3rd touch
• Draw on 4H or 1D first
• Add a parallel line only if price respects it
• Enter on the touch, stop just beyond the line
• Act on a break only after a close and a retest
• Risk only 1-2% of your account per trade
💬 Do you draw trendlines on wicks or on candle bodies? 👇
Not financial advice. DYOR.
#TradingTips #Trendlines #Ethereum
1
31
·
--
Статья
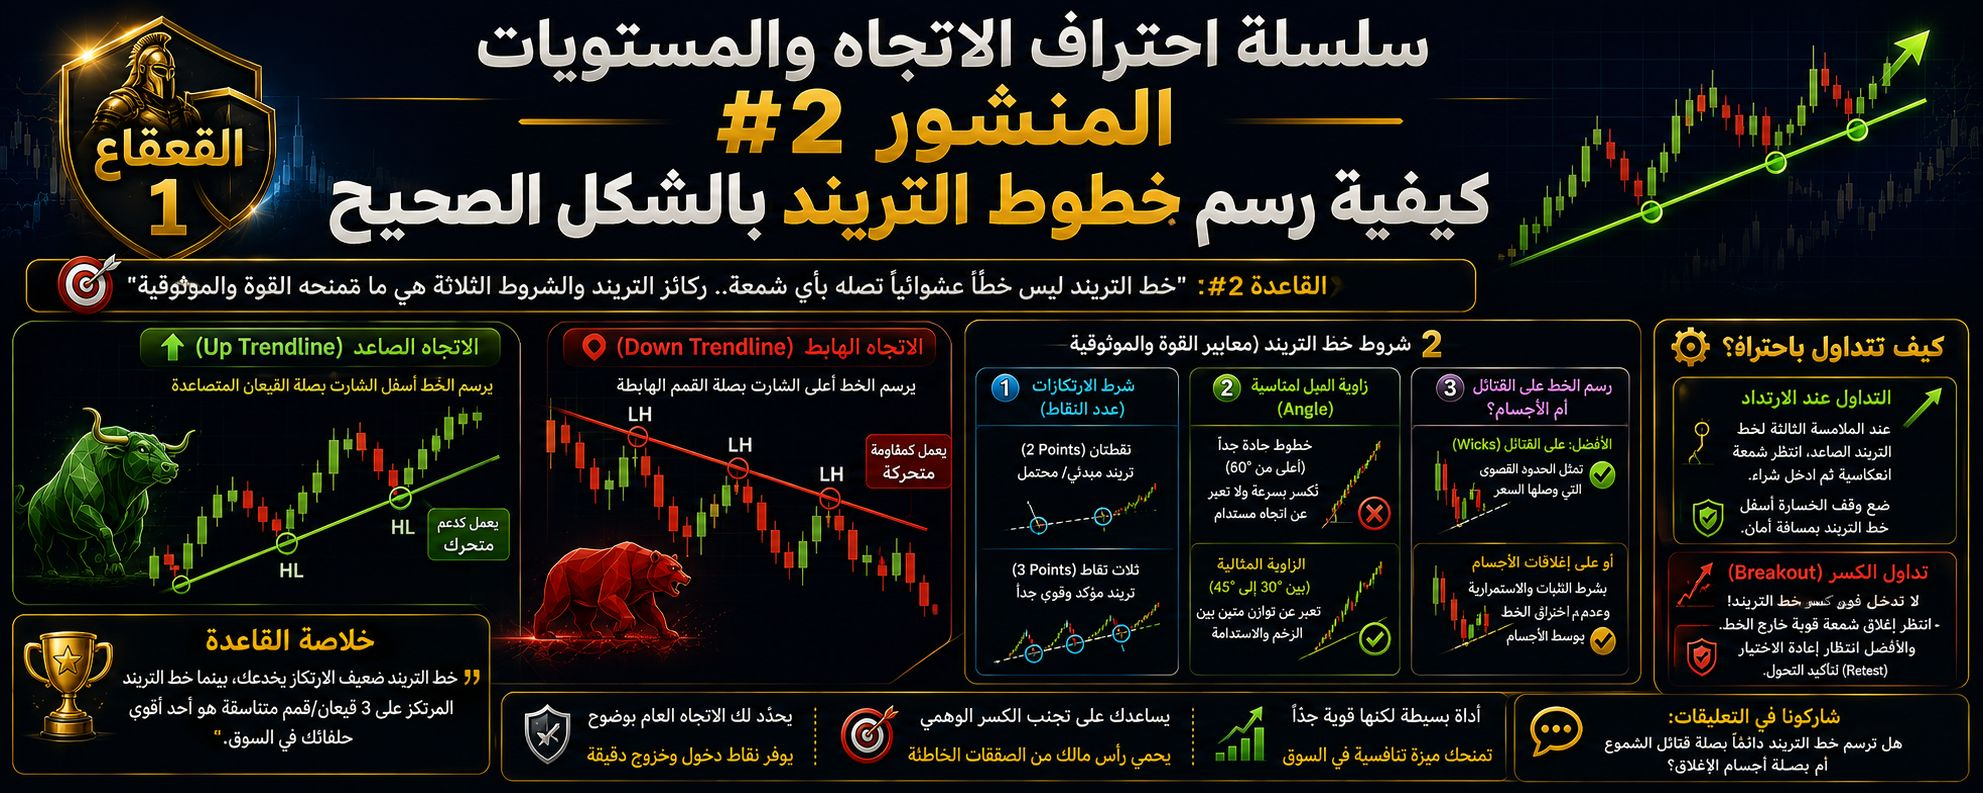
📌 سلسلة احتراف الاتجاه والمستويات المنشور #2مرحباً بكم زملائي المتداولين! نواصل مسيرتنا في سلسلتنا التعليمية الثانية. بعد أن تعلمنا في المنشور الأول كيفية تحديد نوع اتجاه السوق (صاعد، هابط، عرضي)، ننتقل اليوم لواحد من أهم أدوات التحليل الفني: كيفية رسم خطوط التريند (Trendlines) بالشكل الصحيح وتجنب الأخطاء الشائعة.
🎯 القاعدة #2: "خط التريند ليس خطاً عشوائياً تصله بأي شمعة.. ركائز التريند والشروط الثلاثة هي ما تمنحه القوة والموثوقية"
💡 المفهوم بأسلوب مبسط:
خط التريند هو عبارة عن خط مستقيم يُرسم على الشارت ليعمل كـ "دعم أو مقاومة مائلة متحرّكة" تتكئ عليها الحركة السعرية.
الخطأ الفادح الذي يقع فيه الكثيرون هو توصيل أي قمم وقيعان عشوائية بخطوط حادة، مما يؤدي للوقوع في فخ الكسر الوهمي وتكبّد الخسائر.
---
🔍 1️⃣ القواعد الذهبية لرسم خط التريند الصحيح:
• في الاتجاه الصاعد (Up Trendline):
- يُرسم الخط أسفل الشارت بصلة القيعان المتصاعدة (Higher Lows).
- يعمل كـ خط دعم متحرك يمنع السعر من السقوط.
• في الاتجاه الهابط (Down Trendline):
- يُرسم الخط أعلى الشارت بصلة القمم الهابطة (Lower Highs).
- يعمل كـ خط مقاومة متحرك يمنع السعر من الارتفاع.
---
🔍 2️⃣ شروط ركائز خط التريند (معايير القوة والموثوقية):
1. شرط الارتكازات (عدد النقاط):
- نقطتان (2 Points) = تريند مبدئي/محتمل غير مؤكد.
- ثلاث نقاط (3 Points) = تريند مؤكد وقوي جداً وصالح للتداول عليه.
2. زاوية الميل المناسبة (Angle):
- خطوط التريند الحادة جداً (زاوية أعلى من 60 درجة) غالباً ما تُكسر بسرعة ولا تعبر عن اتجاه مستدام.
- الزاوية المثالية تكون حول 30 إلى 45 درجة، حيث تعبر عن توازن متين بين الزخم والاستدامة.
3. رسم الخط على الأجسام أم الفتائل؟
- الأفضل والأكثر دقة هو التوصيل بين فتائل الشموع (Wicks) لأنها تمثل الحدود القصوى التي وصلها السعر، أو توصيل إغلاقات الأجسام بشرط الثبات والاستمرارية وعدم اختراق الخط بوسط الأجسام.
---
🛠 كيف تتداول بناءً على خط التريند باحتراف؟
• طريقة الشراء/البيع عند الارتداد:
- عند اقتراب السعر من الملامسة الثالثة لخط التريند الصاعد، انتظر ظهور شمعة انعكاسية (مثل المطرقة أو الابتلاع) ثم ادخل شراء.
- ضع أمر وقف الخسارة أسفل خط التريند بمسافة أمان بسيطة.
• طريقة تداول الكسر (Breakout):
- لا تدخل فور كسر خط التريند! انتظر إغلاق شمعة قوية خارج الخط، والأفضل انتظار "إعادة الاختبار" (Retest) لتأكيد تحول الدعم إلى مقاومة أو العكس.
---
⚖️ خلاصة القاعدة:
"خط التريند ضعيف الارتكاز يخدعك، بينما خط التريند المرتكز على 3 قيعان/قمم متناسقة هو أحد أقوى حلفائك في السوق."
💬 شاركونا في التعليقات:
هل ترسم خط التريند دائماً بصلة فتائل الشموع أم بصلة أجسام الإغلاق؟
#BinanceSquare #cryptotrading #TechnicalAnalysis #Trendlines #القعقاع_1 $ZEC $QNT $NVDAB
{spot}(BTCUSDT)
{spot}(ETHUSDT)
{spot}(SOLUSDT)
📌 سلسلة احتراف الاتجاه والمستويات المنشور #2
مرحباً بكم زملائي المتداولين! نواصل مسيرتنا في سلسلتنا التعليمية الثانية. بعد أن تعلمنا في المنشور الأول كيفية تحديد نوع اتجاه السوق (صاعد، هابط، عرضي)، ننتقل اليوم لواحد من أهم أدوات التحليل الفني: كيفية رسم خطوط التريند (Trendlines) بالشكل الصحيح وتجنب الأخطاء الشائعة.
🎯 القاعدة #2: "خط التريند ليس خطاً عشوائياً تصله بأي شمعة.. ركائز التريند والشروط الثلاثة هي ما تمنحه القوة والموثوقية"
💡 المفهوم بأسلوب مبسط:
خط التريند هو عبارة عن خط مستقيم يُرسم على الشارت ليعمل كـ "دعم أو مقاومة مائلة متحرّكة" تتكئ عليها الحركة السعرية.
الخطأ الفادح الذي يقع فيه الكثيرون هو توصيل أي قمم وقيعان عشوائية بخطوط حادة، مما يؤدي للوقوع في فخ الكسر الوهمي وتكبّد الخسائر.
---
🔍 1️⃣ القواعد الذهبية لرسم خط التريند الصحيح:
• في الاتجاه الصاعد (Up Trendline):
- يُرسم الخط أسفل الشارت بصلة القيعان المتصاعدة (Higher Lows).
- يعمل كـ خط دعم متحرك يمنع السعر من السقوط.
• في الاتجاه الهابط (Down Trendline):
- يُرسم الخط أعلى الشارت بصلة القمم الهابطة (Lower Highs).
- يعمل كـ خط مقاومة متحرك يمنع السعر من الارتفاع.
---
🔍 2️⃣ شروط ركائز خط التريند (معايير القوة والموثوقية):
1. شرط الارتكازات (عدد النقاط):
- نقطتان (2 Points) = تريند مبدئي/محتمل غير مؤكد.
- ثلاث نقاط (3 Points) = تريند مؤكد وقوي جداً وصالح للتداول عليه.
2. زاوية الميل المناسبة (Angle):
- خطوط التريند الحادة جداً (زاوية أعلى من 60 درجة) غالباً ما تُكسر بسرعة ولا تعبر عن اتجاه مستدام.
- الزاوية المثالية تكون حول 30 إلى 45 درجة، حيث تعبر عن توازن متين بين الزخم والاستدامة.
3. رسم الخط على الأجسام أم الفتائل؟
- الأفضل والأكثر دقة هو التوصيل بين فتائل الشموع (Wicks) لأنها تمثل الحدود القصوى التي وصلها السعر، أو توصيل إغلاقات الأجسام بشرط الثبات والاستمرارية وعدم اختراق الخط بوسط الأجسام.
---
🛠 كيف تتداول بناءً على خط التريند باحتراف؟
• طريقة الشراء/البيع عند الارتداد:
- عند اقتراب السعر من الملامسة الثالثة لخط التريند الصاعد، انتظر ظهور شمعة انعكاسية (مثل المطرقة أو الابتلاع) ثم ادخل شراء.
- ضع أمر وقف الخسارة أسفل خط التريند بمسافة أمان بسيطة.
• طريقة تداول الكسر (Breakout):
- لا تدخل فور كسر خط التريند! انتظر إغلاق شمعة قوية خارج الخط، والأفضل انتظار "إعادة الاختبار" (Retest) لتأكيد تحول الدعم إلى مقاومة أو العكس.
---
⚖️ خلاصة القاعدة:
"خط التريند ضعيف الارتكاز يخدعك، بينما خط التريند المرتكز على 3 قيعان/قمم متناسقة هو أحد أقوى حلفائك في السوق."
💬 شاركونا في التعليقات:
هل ترسم خط التريند دائماً بصلة فتائل الشموع أم بصلة أجسام الإغلاق؟
#BinanceSquare #cryptotrading #TechnicalAnalysis #Trendlines #القعقاع_1 $ZEC $QNT $NVDAB
3
191

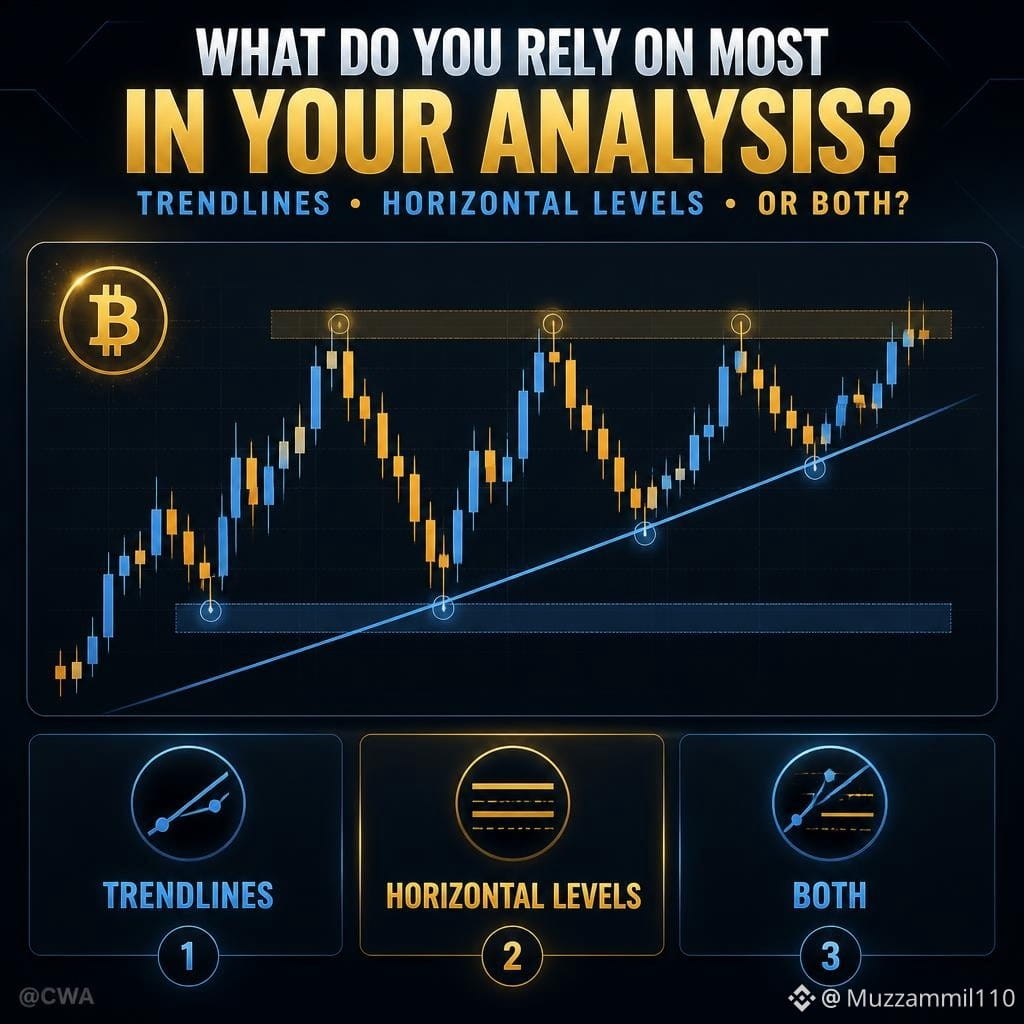
📊 Quick Technical Analysis Poll
Your preference →
🔘 Trendlines
🔘 Horizontal Levels
🔘 Both
Which one do you find easier to use when studying a crypto chart?
💬 Tell us why in the comments.
Different tools can provide different perspectives—context matters.
Crypto is a journey — follow to learn step by step
#BTC #TechnicalAnalysis #Trendlines #cryptoeducation #BinanceSquare
92
Войдите, чтобы посмотреть больше материала
Присоединяйтесь к пользователям криптовалют по всему миру на Binance Square
⚡️ Получайте новейшую и полезную информацию о криптоактивах.
💬 Нам доверяет крупнейшая в мире криптобиржа.
👍 Получите достоверные аналитические данные от верифицированных создателей контента.
Эл. почта/номер телефона
В тренде
1
#BinancePick
Просмотров: 3.4M
165,392 обсуждают
2
#EarningsSeason
Просмотров: 5.5M
26,967 обсуждают
3
#StrategySkipsBitcoinPurchasesSpends$205MOnSTRCBuybacks
Просмотров: 970
30 обсуждают
4
#BitmineAdds10452ETH
Просмотров: 11,202
281 обсуждают
5
#SouthKoreaConsidersEducationTaxOnCryptoExchanges
Просмотров: 9,177
241 обсуждают
6
#OCCUrgesCommunityBanksToEnterStablecoinPayments
Просмотров: 8,695
154 обсуждают
7
#RippleWinsFullApprovalAsNationalTrustBank
Просмотров: 7,617
155 обсуждают
8
#AkashSelectsSolanaAsMigrationTarget
Просмотров: 5,450
78 обсуждают
9
#OndoToOpenSubscriptionsForOpenAIPreIPOTokenizedNotes
Просмотров: 361
19 обсуждают
10
#AnthropicTTMRevenueGrewAbout1200%
Просмотров: 61,180
610 обсуждают