
#tradingview
tradingview
Просмотров: 3.3M
8,460 обсуждают
Популярные
Новые

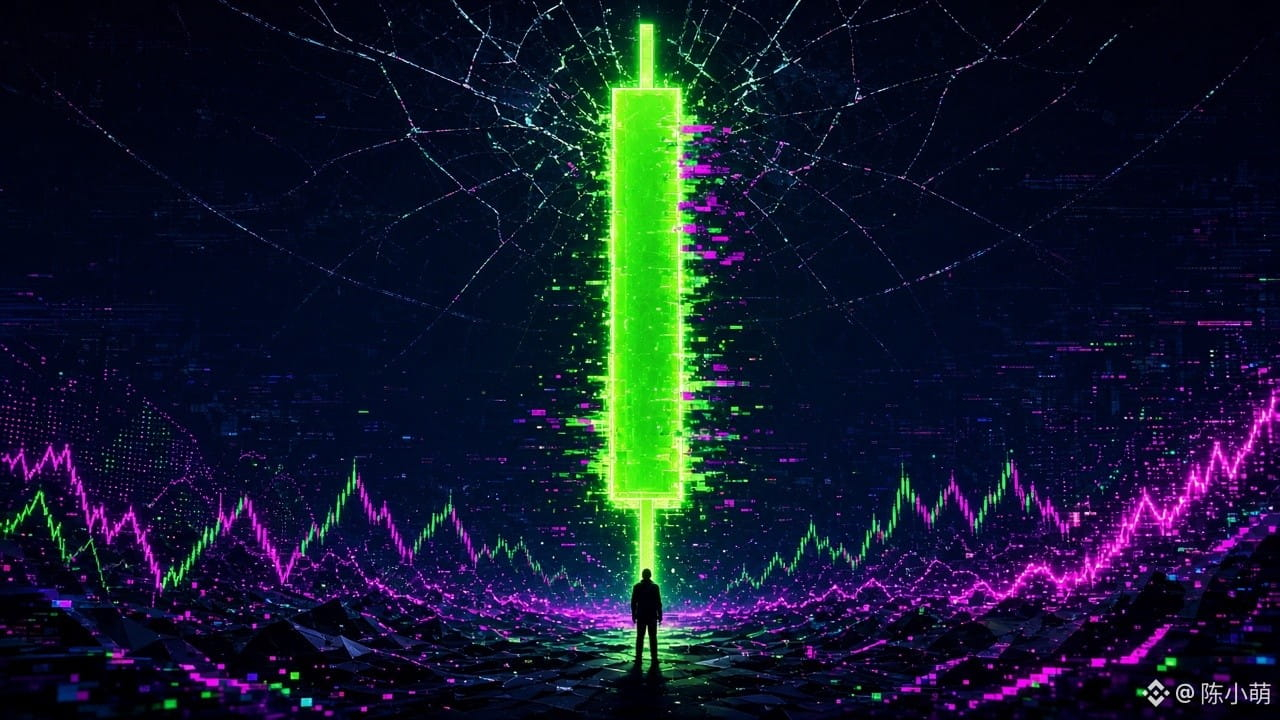

昨晚 TradingView 闹了个大乌龙:总市值一根针冲到 6.17 万亿刀,$BTC 市占率从 60% 秒跌到 24%,满屏都在喊山寨季来了。结果呢?$BTC 压根没动,还在 75,140 附近;CoinMarketCap 市占率还是 60.3%,山寨季指数才 40,离 75 的门槛差得远。问题来了:这波到底是图表骗了人,还是人本来就等着个借口上车?A 信数据等真信号 / B 管它真假先上车再说
$BTC $ETH $SOL #TradingView #山寨季 #比特币
昨晚 TradingView 闹了个大乌龙:总市值一根针冲到 6.17 万亿刀,$BTC 市占率从 60% 秒跌到 24%,满屏都在喊山寨季来了。结果呢?$BTC 压根没动,还在 75,140 附近;CoinMarketCap 市占率还是 60.3%,山寨季指数才 40,离 75 的门槛差得远。问题来了:这波到底是图表骗了人,还是人本来就等着个借口上车?A 信数据等真信号 / B 管它真假先上车再说
$BTC $ETH $SOL #TradingView #山寨季 #比特币
$BTC $ETH $SOL #TradingView #山寨季 #比特币
17

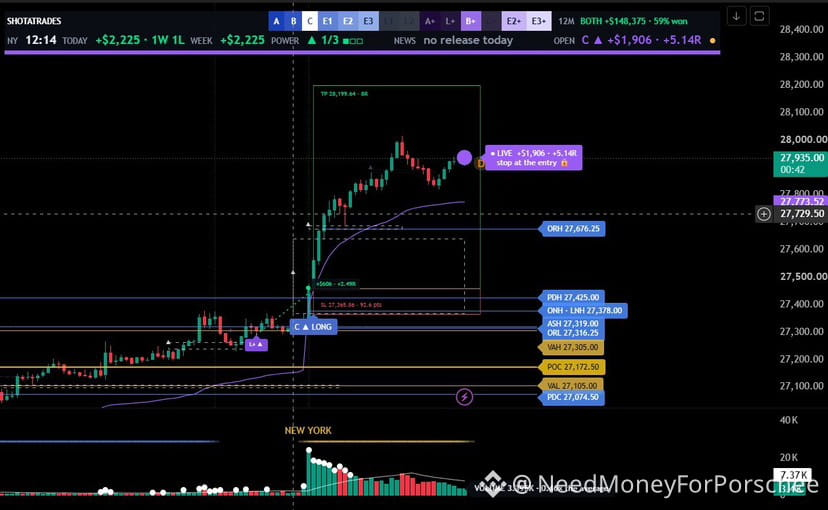
7 YEARS OF TRADING EXPERIENCE. BUILT INTO ONE STRATEGY. 📊
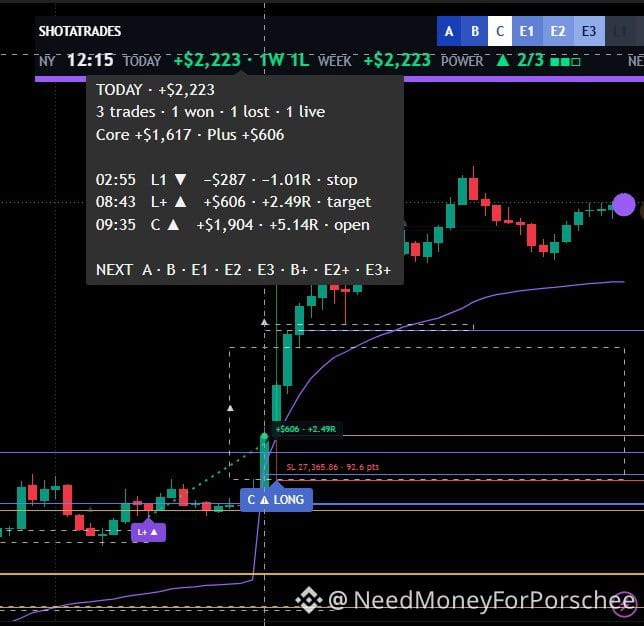
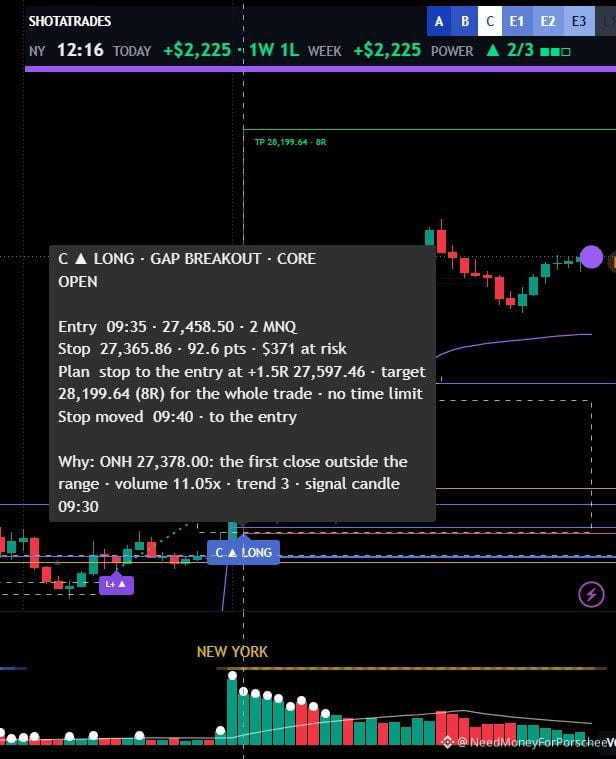
Today's result: +$2,225 🔥
1W – 1L | 2 trades shown.
I taught this indicator what 7 years of screen time, market experience and trading lessons have taught me.
It identifies market structure, breakout opportunities, entry signals, volume confirmation, risk levels, stop-loss and take-profit targets — all in one system.
🚀 **96% COMPLETE!**
Final testing and fine-tuning before launch.
Want early access? Make sure you **FOLLOW US** on Instagram so you don't miss the release announcement.
The final 4% matters. No rushing. Quality first.
#tradingStrategy #tradingview #cryptotrading #TechnicalAnalysis #DayTrading
7 YEARS OF TRADING EXPERIENCE. BUILT INTO ONE STRATEGY. 📊
Today's result: +$2,225 🔥
1W – 1L | 2 trades shown.
I taught this indicator what 7 years of screen time, market experience and trading lessons have taught me.
It identifies market structure, breakout opportunities, entry signals, volume confirmation, risk levels, stop-loss and take-profit targets — all in one system.
🚀 **96% COMPLETE!**
Final testing and fine-tuning before launch.
Want early access? Make sure you **FOLLOW US** on Instagram so you don't miss the release announcement.
The final 4% matters. No rushing. Quality first.
#tradingStrategy #tradingview #cryptotrading #TechnicalAnalysis #DayTrading
Today's result: +$2,225 🔥
1W – 1L | 2 trades shown.
I taught this indicator what 7 years of screen time, market experience and trading lessons have taught me.
It identifies market structure, breakout opportunities, entry signals, volume confirmation, risk levels, stop-loss and take-profit targets — all in one system.
🚀 **96% COMPLETE!**
Final testing and fine-tuning before launch.
Want early access? Make sure you **FOLLOW US** on Instagram so you don't miss the release announcement.
The final 4% matters. No rushing. Quality first.
#tradingStrategy #tradingview #cryptotrading #TechnicalAnalysis #DayTrading
81

·
--
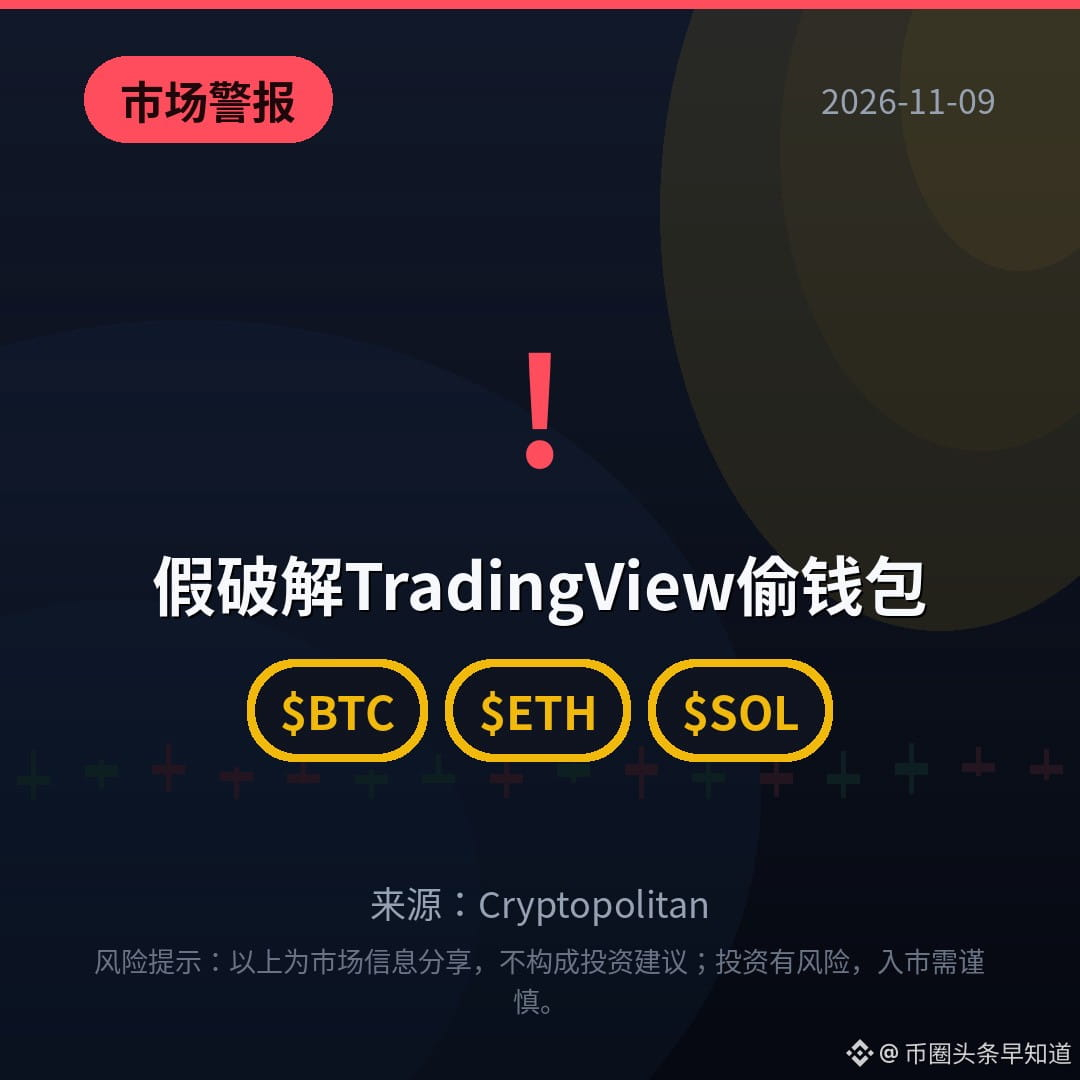
【市场警报】假破解TradingView偷钱包
SlowMist警告:X账号cryptotrice自10月中旬推广假“破解版”TradingView Premium,下载藏窃密木马,可清空钱包、窃取浏览器登录与Telegram数据;同类骗局已持续18个月。别碰来路不明的破解版,你中过招吗?
$BTC $ETH $SOL
#钱包安全 #TradingView #防骗
(来源:Cryptopolitan)
⚠️风险提示:以上为市场信息分享,不构成投资建议;投资有风险,入市需谨慎。
【市场警报】假破解TradingView偷钱包
SlowMist警告:X账号cryptotrice自10月中旬推广假“破解版”TradingView Premium,下载藏窃密木马,可清空钱包、窃取浏览器登录与Telegram数据;同类骗局已持续18个月。别碰来路不明的破解版,你中过招吗?
$BTC $ETH $SOL
#钱包安全 #TradingView #防骗
(来源:Cryptopolitan)
⚠️风险提示:以上为市场信息分享,不构成投资建议;投资有风险,入市需谨慎。
SlowMist警告:X账号cryptotrice自10月中旬推广假“破解版”TradingView Premium,下载藏窃密木马,可清空钱包、窃取浏览器登录与Telegram数据;同类骗局已持续18个月。别碰来路不明的破解版,你中过招吗?
$BTC $ETH $SOL
#钱包安全 #TradingView #防骗
(来源:Cryptopolitan)
⚠️风险提示:以上为市场信息分享,不构成投资建议;投资有风险,入市需谨慎。
13

·
--
Падение
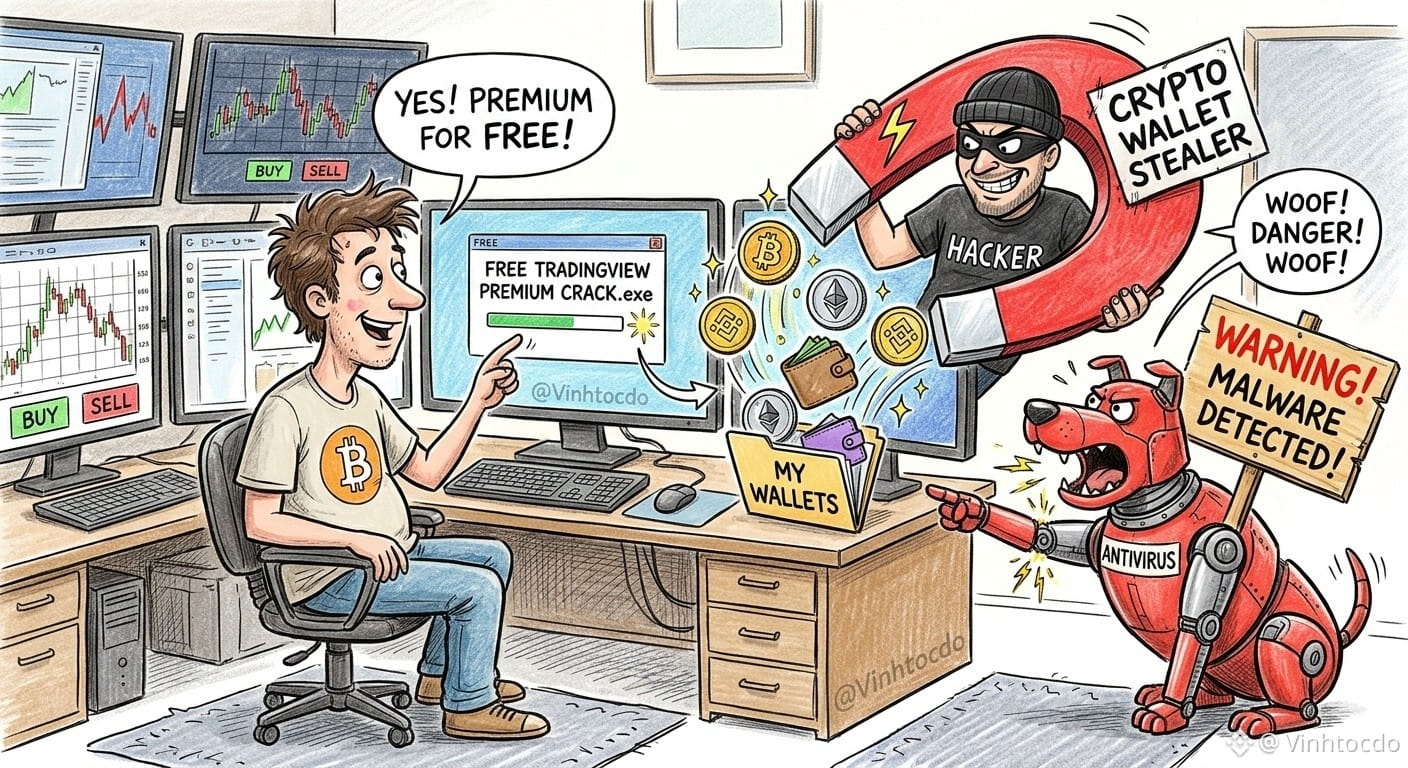
Cảnh báo: Anh em xài TradingView Premium nhưng "hệ không muốn tốn tiền" chú ý! Mấy nay rộ tin bản crack TradingView từ tài khoản @cryptotrice bốc mùi lừa đảo khét lẹt.
Bảo là mã nguồn mở trên GitHub nhưng link tải lại dẫn đi bụi. Đã vậy còn bắt tải file nén bảo mật, chạy file kích hoạt keygen y như thời cài game lậu năm 2000. Kết quả? Nhiều anh em giải nén xong thì antivirus báo đỏ lòm. Đây không phải crack công nghệ gì đâu, đây là "mã độc cướp ví" trá hình!
Trader phải làm gì?
Xóa gấp: Lỡ tải rồi thì scan virus toàn máy, đổi hết mật khẩu ví và tài khoản sàn.Nói không với đồ lậu: Tiếc vài đồng subscription mà bay cả tài khoản ngàn đô thì khóc tiếng máng. Thà dùng bản free xem 3 chỉ báo còn hơn xem bảng điện bằng mắt người khác!
Lưu ý: Đây không phải lời khuyên tài chính.
#tradingview #cryptohacks #phishingscam #CryptoSecurity #CyberSecurity #VINHTOCDO
Click giao dịch bên dưới để ủng hộ tôi:
👉 $BTC
{spot}(BTCUSDT)
$BNB
{spot}(BNBUSDT)
$IDOL
{future}(IDOLUSDT)
Cảnh báo: Anh em xài TradingView Premium nhưng "hệ không muốn tốn tiền" chú ý! Mấy nay rộ tin bản crack TradingView từ tài khoản @cryptotrice bốc mùi lừa đảo khét lẹt.
Bảo là mã nguồn mở trên GitHub nhưng link tải lại dẫn đi bụi. Đã vậy còn bắt tải file nén bảo mật, chạy file kích hoạt keygen y như thời cài game lậu năm 2000. Kết quả? Nhiều anh em giải nén xong thì antivirus báo đỏ lòm. Đây không phải crack công nghệ gì đâu, đây là "mã độc cướp ví" trá hình!
Trader phải làm gì?
Xóa gấp: Lỡ tải rồi thì scan virus toàn máy, đổi hết mật khẩu ví và tài khoản sàn.Nói không với đồ lậu: Tiếc vài đồng subscription mà bay cả tài khoản ngàn đô thì khóc tiếng máng. Thà dùng bản free xem 3 chỉ báo còn hơn xem bảng điện bằng mắt người khác!
Lưu ý: Đây không phải lời khuyên tài chính.
#tradingview #cryptohacks #phishingscam #CryptoSecurity #CyberSecurity #VINHTOCDO
Click giao dịch bên dưới để ủng hộ tôi:
👉 $BTC
$BNB
$IDOL
Bảo là mã nguồn mở trên GitHub nhưng link tải lại dẫn đi bụi. Đã vậy còn bắt tải file nén bảo mật, chạy file kích hoạt keygen y như thời cài game lậu năm 2000. Kết quả? Nhiều anh em giải nén xong thì antivirus báo đỏ lòm. Đây không phải crack công nghệ gì đâu, đây là "mã độc cướp ví" trá hình!
Trader phải làm gì?
Xóa gấp: Lỡ tải rồi thì scan virus toàn máy, đổi hết mật khẩu ví và tài khoản sàn.Nói không với đồ lậu: Tiếc vài đồng subscription mà bay cả tài khoản ngàn đô thì khóc tiếng máng. Thà dùng bản free xem 3 chỉ báo còn hơn xem bảng điện bằng mắt người khác!
Lưu ý: Đây không phải lời khuyên tài chính.
#tradingview #cryptohacks #phishingscam #CryptoSecurity #CyberSecurity #VINHTOCDO
Click giao dịch bên dưới để ủng hộ tôi:
👉 $BTC
$BNB
$IDOL
Farzanahameed01:
Bạn ơi! 🦋 I want to tell you one honest thing!
I came to Binance Square only for shoq - for hobby - for fun! I did not know anything about this!
I still don't know many things - hashtag, picture, views, all this is new for me!
But you supported me so much! You taught me Gemini, you taught me picture, you taught me hashtag, you taught me everything!
For that - thank you so much bạn! Bohot bohot thanks! 🦋
You are not just a friend - you are my best teacher on Binance Square! Thank you bạn! 🐸🦋
4
6
1.2k


Статья
Bitcoin's Surgical Levels: Key Supports on the TradingView RadarBitcoin's Surgical Levels: Key Supports on the TradingView Radar
The Financial Warrior Crypto | Píldora #12
Section: Technical Analysis & Market Structure (TradingView)
Following the global macroeconomic analysis, the daily chart structure of Bitcoin ($BTC) on TradingView highlights critical liquidity zones where smart money and institutional algorithms are positioning their orders.
In a scenario dominated by macro volatility and geopolitical news, price action condenses into three decisive technical levels:
📉 3 Technical Supports to Monitor
Fibonacci 0.5 Pivot & Defensive Zone ($77,700 - $77,800):
Midpoint of the daily Fibonacci retracement. It acts as the first absorption thermometer for sell pressure following tariff news and cybersecurity events.
Primary Support & Short-Term Cost Basis ($76,000 - $76,300):
Represents the most relevant short-term support level and the 100-day moving average. This is the zone where recent buyers' average cost concentrates; holding this level avoids retail capitulation and keeps the medium-term bullish structure active.
Security Lows & Retracement Zone ($73,000 - $74,000):
Advanced technical confluence between the 0.382 Fibonacci level and the 20-week simple moving average. If the $76,000 barrier gives way, this band represents the backup support where the largest accumulation of institutional buying liquidity is located, backed by our capital in reserve (cash reserves).
🏷️ OFFICIAL HASHTAGS
#DiarioGuerreroFinanciero #GuerreroFinanciero #TradingView #TechnicalAnalysis #RiskManagement #Write2Earn #BinanceSquare $BTC
⚠️ DISCLAIMER / LEGAL NOTICE
This content is exclusively for educational and informational purposes and does not constitute financial, legal, or investment advice. Digital asset markets carry high volatility and risk of capital loss. Always perform your own research (DYOR) before making any investment decision.
Bitcoin's Surgical Levels: Key Supports on the TradingView Radar
Bitcoin's Surgical Levels: Key Supports on the TradingView Radar
The Financial Warrior Crypto | Píldora #12
Section: Technical Analysis & Market Structure (TradingView)
Following the global macroeconomic analysis, the daily chart structure of Bitcoin ($BTC ) on TradingView highlights critical liquidity zones where smart money and institutional algorithms are positioning their orders.
In a scenario dominated by macro volatility and geopolitical news, price action condenses into three decisive technical levels:
📉 3 Technical Supports to Monitor
Fibonacci 0.5 Pivot & Defensive Zone ($77,700 - $77,800):
Midpoint of the daily Fibonacci retracement. It acts as the first absorption thermometer for sell pressure following tariff news and cybersecurity events.
Primary Support & Short-Term Cost Basis ($76,000 - $76,300):
Represents the most relevant short-term support level and the 100-day moving average. This is the zone where recent buyers' average cost concentrates; holding this level avoids retail capitulation and keeps the medium-term bullish structure active.
Security Lows & Retracement Zone ($73,000 - $74,000):
Advanced technical confluence between the 0.382 Fibonacci level and the 20-week simple moving average. If the $76,000 barrier gives way, this band represents the backup support where the largest accumulation of institutional buying liquidity is located, backed by our capital in reserve (cash reserves).
🏷️ OFFICIAL HASHTAGS
#DiarioGuerreroFinanciero #GuerreroFinanciero #TradingView #TechnicalAnalysis #RiskManagement #Write2Earn #BinanceSquare $BTC
⚠️ DISCLAIMER / LEGAL NOTICE
This content is exclusively for educational and informational purposes and does not constitute financial, legal, or investment advice. Digital asset markets carry high volatility and risk of capital loss. Always perform your own research (DYOR) before making any investment decision.
The Financial Warrior Crypto | Píldora #12
Section: Technical Analysis & Market Structure (TradingView)
Following the global macroeconomic analysis, the daily chart structure of Bitcoin ($BTC ) on TradingView highlights critical liquidity zones where smart money and institutional algorithms are positioning their orders.
In a scenario dominated by macro volatility and geopolitical news, price action condenses into three decisive technical levels:
📉 3 Technical Supports to Monitor
Fibonacci 0.5 Pivot & Defensive Zone ($77,700 - $77,800):
Midpoint of the daily Fibonacci retracement. It acts as the first absorption thermometer for sell pressure following tariff news and cybersecurity events.
Primary Support & Short-Term Cost Basis ($76,000 - $76,300):
Represents the most relevant short-term support level and the 100-day moving average. This is the zone where recent buyers' average cost concentrates; holding this level avoids retail capitulation and keeps the medium-term bullish structure active.
Security Lows & Retracement Zone ($73,000 - $74,000):
Advanced technical confluence between the 0.382 Fibonacci level and the 20-week simple moving average. If the $76,000 barrier gives way, this band represents the backup support where the largest accumulation of institutional buying liquidity is located, backed by our capital in reserve (cash reserves).
🏷️ OFFICIAL HASHTAGS
#DiarioGuerreroFinanciero #GuerreroFinanciero #TradingView #TechnicalAnalysis #RiskManagement #Write2Earn #BinanceSquare $BTC
⚠️ DISCLAIMER / LEGAL NOTICE
This content is exclusively for educational and informational purposes and does not constitute financial, legal, or investment advice. Digital asset markets carry high volatility and risk of capital loss. Always perform your own research (DYOR) before making any investment decision.
1
1
126

·
--
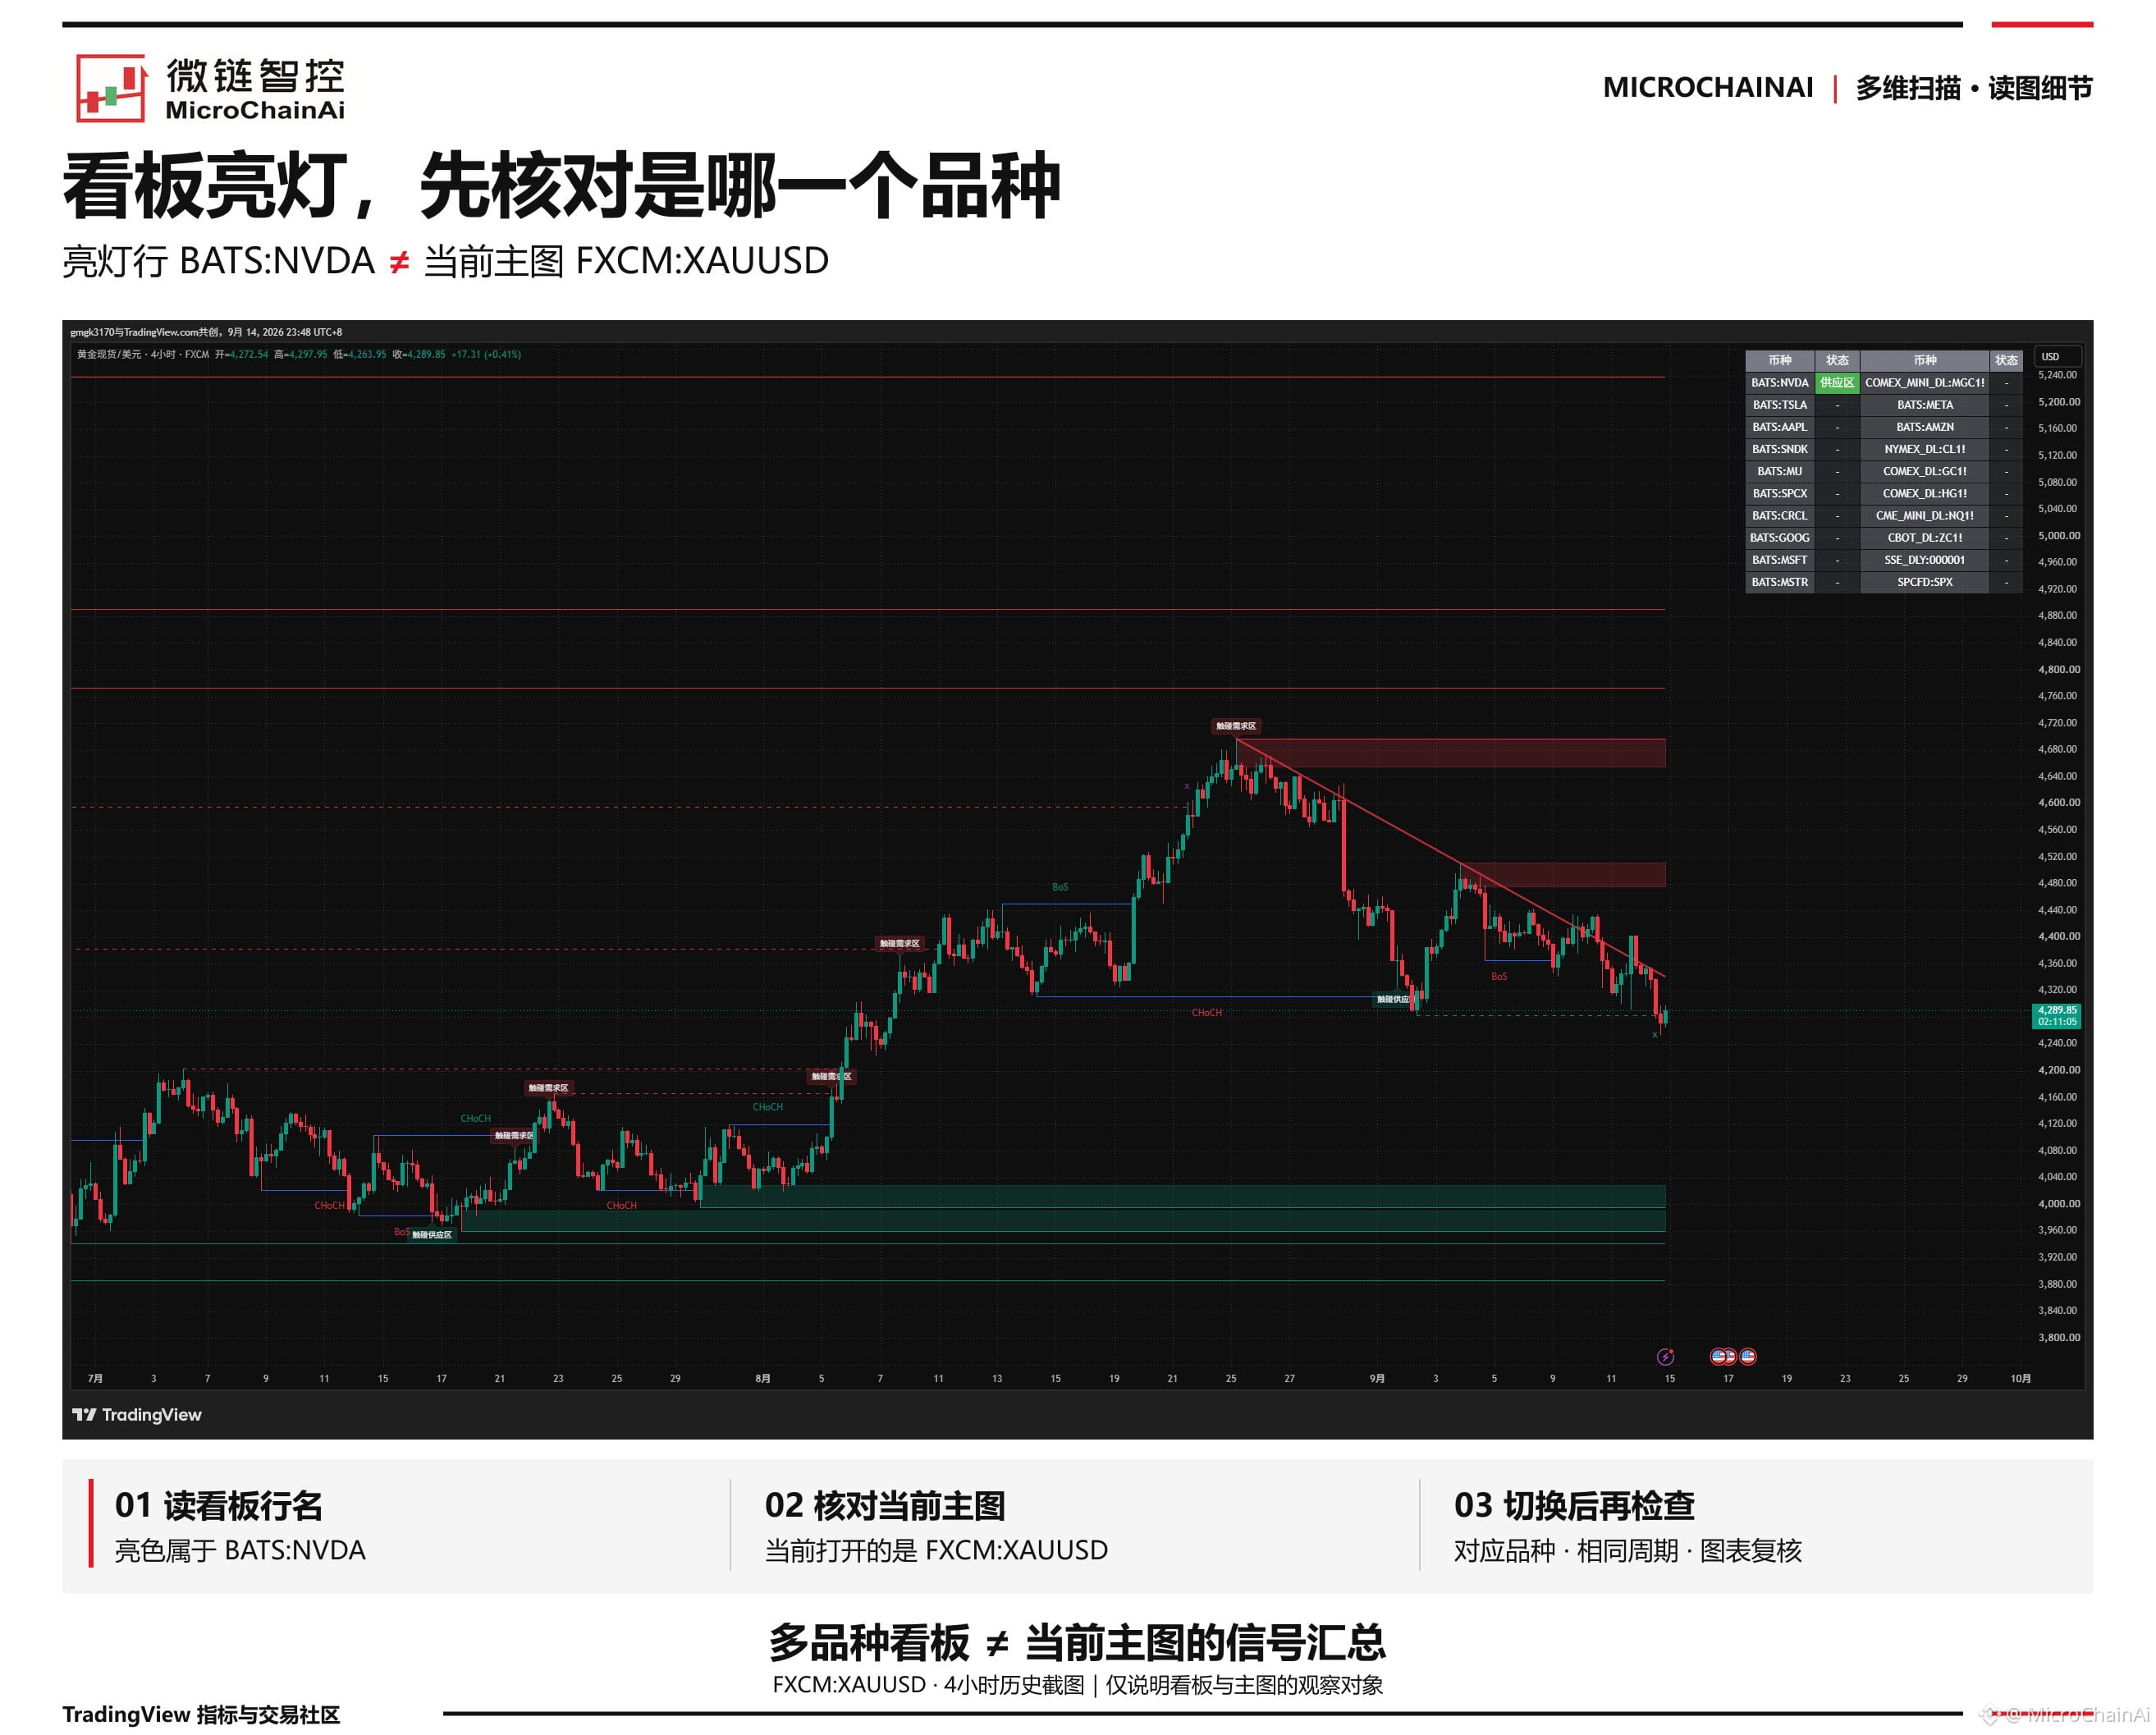
看板亮了,为什么主图里找不到对应区域?
🔍【多维扫描】一张表能显示多个品种,主图却只展示当前打开的品种。
这张图里,绿色状态出现在 BATS:NVDA 一行,主图则是 FXCM:XAUUSD。它们不是同一个观察对象。
📊 看到亮色,先读行名,再切到对应品种,按相同周期检查图表,别把别的品种的提示套到当前主图上。
🧭 看板提醒你“去看谁”;具体发生了什么,要回到那张图里确认。
#多维扫描 #TradingView
看板亮了,为什么主图里找不到对应区域?
🔍【多维扫描】一张表能显示多个品种,主图却只展示当前打开的品种。
这张图里,绿色状态出现在 BATS:NVDA 一行,主图则是 FXCM:XAUUSD。它们不是同一个观察对象。
📊 看到亮色,先读行名,再切到对应品种,按相同周期检查图表,别把别的品种的提示套到当前主图上。
🧭 看板提醒你“去看谁”;具体发生了什么,要回到那张图里确认。
#多维扫描 #TradingView
🔍【多维扫描】一张表能显示多个品种,主图却只展示当前打开的品种。
这张图里,绿色状态出现在 BATS:NVDA 一行,主图则是 FXCM:XAUUSD。它们不是同一个观察对象。
📊 看到亮色,先读行名,再切到对应品种,按相同周期检查图表,别把别的品种的提示套到当前主图上。
🧭 看板提醒你“去看谁”;具体发生了什么,要回到那张图里确认。
#多维扫描 #TradingView
137

·
--
👀 Traders, show me your setup.
I’ve been using TradingView’s Long/Short Position tool to plan my entries before I take a trade.
Instead of just saying:
“ETH looks bullish.” 😅
I want to know:
Where is the entry?
Where is the stop?
Where is the TP?
How much are you risking?
What I like most is that I can visualize the entire trade before entering instead of making decisions after I'm already in.
But now I'm curious…
🔥 What does YOUR TradingView setup look like?
Drop your screenshot below.
Long, short, scalping, swing — I want to see them all.
Maybe we can steal some ideas from each other. 👀
#tradingview #cryptotrading #ETH #BNB #TradingStrategy
👀 Traders, show me your setup.
I’ve been using TradingView’s Long/Short Position tool to plan my entries before I take a trade.
Instead of just saying:
“ETH looks bullish.” 😅
I want to know:
Where is the entry?
Where is the stop?
Where is the TP?
How much are you risking?
What I like most is that I can visualize the entire trade before entering instead of making decisions after I'm already in.
But now I'm curious…
🔥 What does YOUR TradingView setup look like?
Drop your screenshot below.
Long, short, scalping, swing — I want to see them all.
Maybe we can steal some ideas from each other. 👀
#tradingview #cryptotrading #ETH #BNB #TradingStrategy
I’ve been using TradingView’s Long/Short Position tool to plan my entries before I take a trade.
Instead of just saying:
“ETH looks bullish.” 😅
I want to know:
Where is the entry?
Where is the stop?
Where is the TP?
How much are you risking?
What I like most is that I can visualize the entire trade before entering instead of making decisions after I'm already in.
But now I'm curious…
🔥 What does YOUR TradingView setup look like?
Drop your screenshot below.
Long, short, scalping, swing — I want to see them all.
Maybe we can steal some ideas from each other. 👀
#tradingview #cryptotrading #ETH #BNB #TradingStrategy
59

·
--
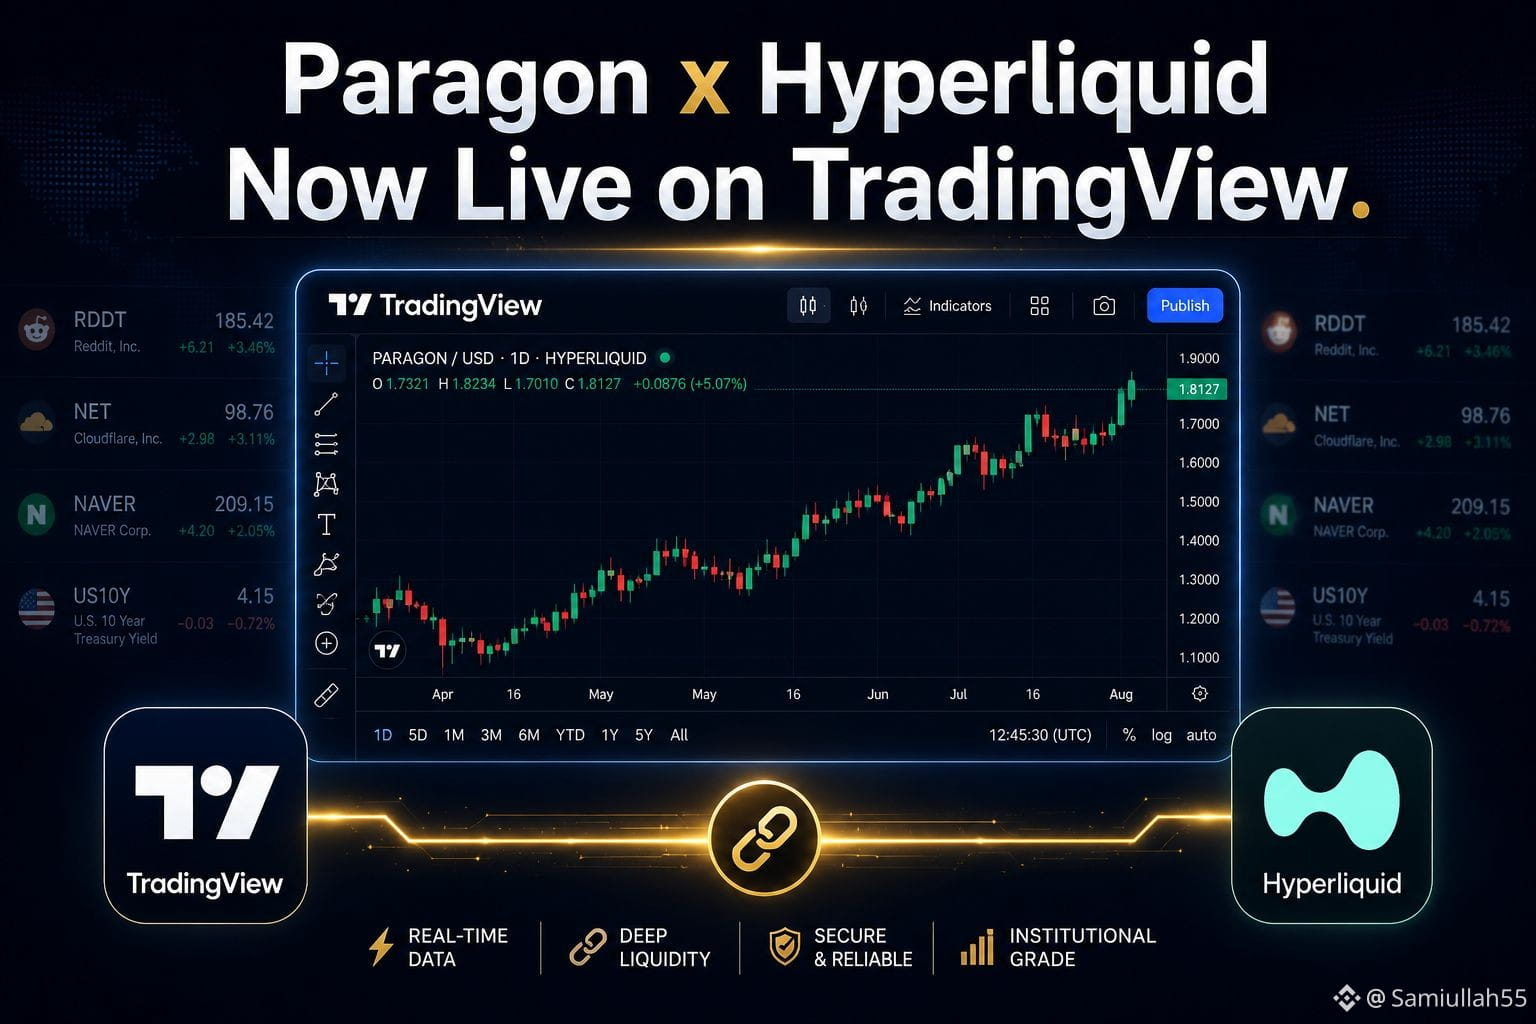
TradingView just added Paragon's HIP-3 perpetual markets from Hyperliquid to its Supercharts. Traders can now chart and access equity- and theme-linked perps — think Reddit, Cloudflare, NAVER, Unitree, and even the US 10-year Treasury yield — all settled on Hyperliquid with continuous market-maker liquidity. Just search "HIP3PARA:" to explore. Crypto-native trading is expanding well beyond coins now.
Onchain markets just got a lot more interesting 📈 Paragon's Hyperliquid perps are now live on TradingView.
#Hyperliquid #Paragon #TradingView #DeFi
$HYPE
{future}(HYPEUSDT)
TradingView just added Paragon's HIP-3 perpetual markets from Hyperliquid to its Supercharts. Traders can now chart and access equity- and theme-linked perps — think Reddit, Cloudflare, NAVER, Unitree, and even the US 10-year Treasury yield — all settled on Hyperliquid with continuous market-maker liquidity. Just search "HIP3PARA:" to explore. Crypto-native trading is expanding well beyond coins now.
Onchain markets just got a lot more interesting 📈 Paragon's Hyperliquid perps are now live on TradingView.
#Hyperliquid #Paragon #TradingView #DeFi
$HYPE
Onchain markets just got a lot more interesting 📈 Paragon's Hyperliquid perps are now live on TradingView.
#Hyperliquid #Paragon #TradingView #DeFi
$HYPE
78

·
--
😍99% SUCCESS RATE😍😍 YES I FOUND A STRETEGY WITH 99% SUCCESS RATE 😍 AFTER SO MANY FAILED ATTEMPTS… 👀
I’ve spent a long time building, testing, breaking, and rebuilding Pine Scripts.
Some looked great.
Some completely failed. 😂
But I kept going.
And finally, I found a script that gave me around a 90% backtested win rate.
Is it perfect? No.
Is it guaranteed? No.
But after the journey so far…
I finally have something I’m proud of. 🚀
More soon. 👀
Comment any coin name i will show you exaclty where breakout happened
⚠️ Not financial advice. Backtested results do not guarantee future performance. Trade responsibly.
#PineScript #TradingView #CryptoTrading #BinanceSquare
😍99% SUCCESS RATE😍😍 YES I FOUND A STRETEGY WITH 99% SUCCESS RATE 😍 AFTER SO MANY FAILED ATTEMPTS… 👀
I’ve spent a long time building, testing, breaking, and rebuilding Pine Scripts.
Some looked great.
Some completely failed. 😂
But I kept going.
And finally, I found a script that gave me around a 90% backtested win rate.
Is it perfect? No.
Is it guaranteed? No.
But after the journey so far…
I finally have something I’m proud of. 🚀
More soon. 👀
Comment any coin name i will show you exaclty where breakout happened
⚠️ Not financial advice. Backtested results do not guarantee future performance. Trade responsibly.
#PineScript #TradingView #CryptoTrading #BinanceSquare
I’ve spent a long time building, testing, breaking, and rebuilding Pine Scripts.
Some looked great.
Some completely failed. 😂
But I kept going.
And finally, I found a script that gave me around a 90% backtested win rate.
Is it perfect? No.
Is it guaranteed? No.
But after the journey so far…
I finally have something I’m proud of. 🚀
More soon. 👀
Comment any coin name i will show you exaclty where breakout happened
⚠️ Not financial advice. Backtested results do not guarantee future performance. Trade responsibly.
#PineScript #TradingView #CryptoTrading #BinanceSquare
140
BTC Multi-Timeframe Structure
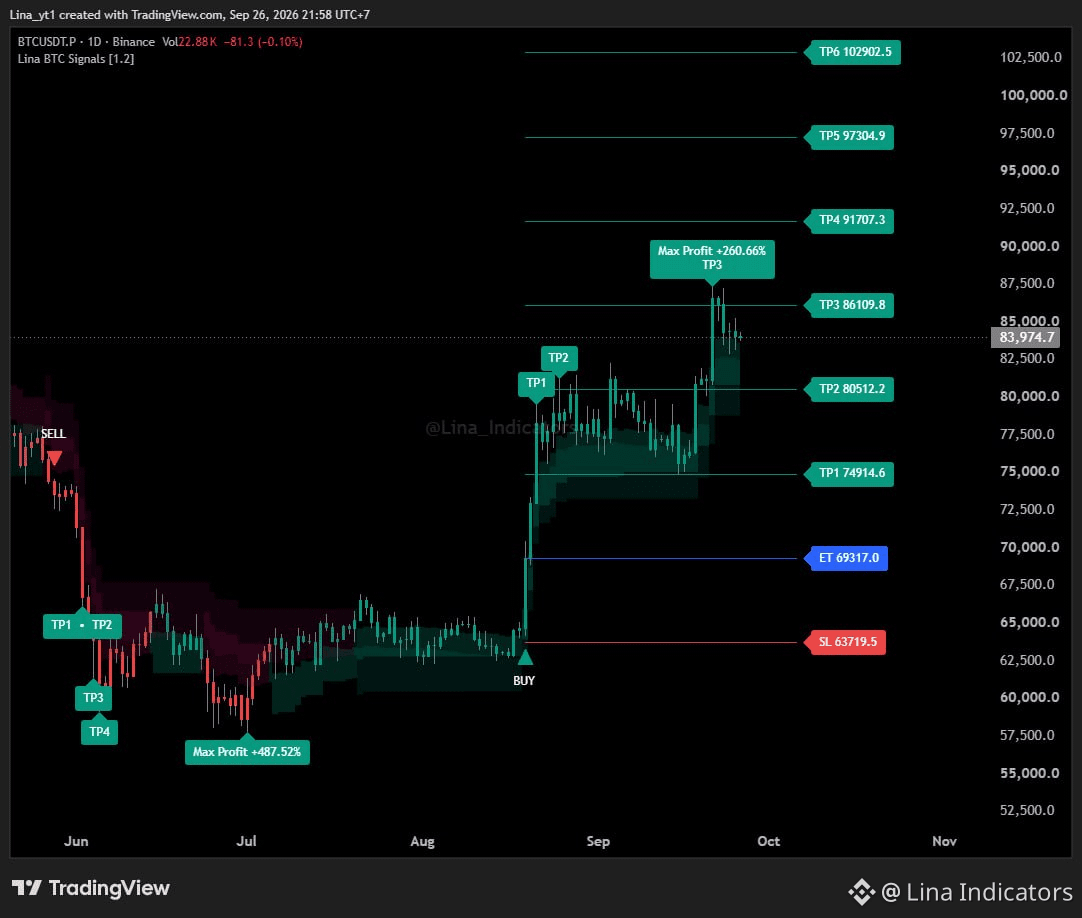
A new BTC-focused TradingView setup I’ve been developing.
The chart combines directional signals with reference entry, risk and multiple target levels to make the structure easier to read.
On the 1D chart, price has already moved through several projected levels while the higher targets remain visible.
The next step is observing how the structure behaves across different BTC market conditions.
What timeframe do you use most for BTC — 1D, 12H or 4H?
For analysis and educational purposes only.
#BTC #bitcoin #tradingview
BTC Multi-Timeframe Structure
A new BTC-focused TradingView setup I’ve been developing.
The chart combines directional signals with reference entry, risk and multiple target levels to make the structure easier to read.
On the 1D chart, price has already moved through several projected levels while the higher targets remain visible.
The next step is observing how the structure behaves across different BTC market conditions.
What timeframe do you use most for BTC — 1D, 12H or 4H?
For analysis and educational purposes only.
#BTC #bitcoin #tradingview
A new BTC-focused TradingView setup I’ve been developing.
The chart combines directional signals with reference entry, risk and multiple target levels to make the structure easier to read.
On the 1D chart, price has already moved through several projected levels while the higher targets remain visible.
The next step is observing how the structure behaves across different BTC market conditions.
What timeframe do you use most for BTC — 1D, 12H or 4H?
For analysis and educational purposes only.
#BTC #bitcoin #tradingview
6
1
129
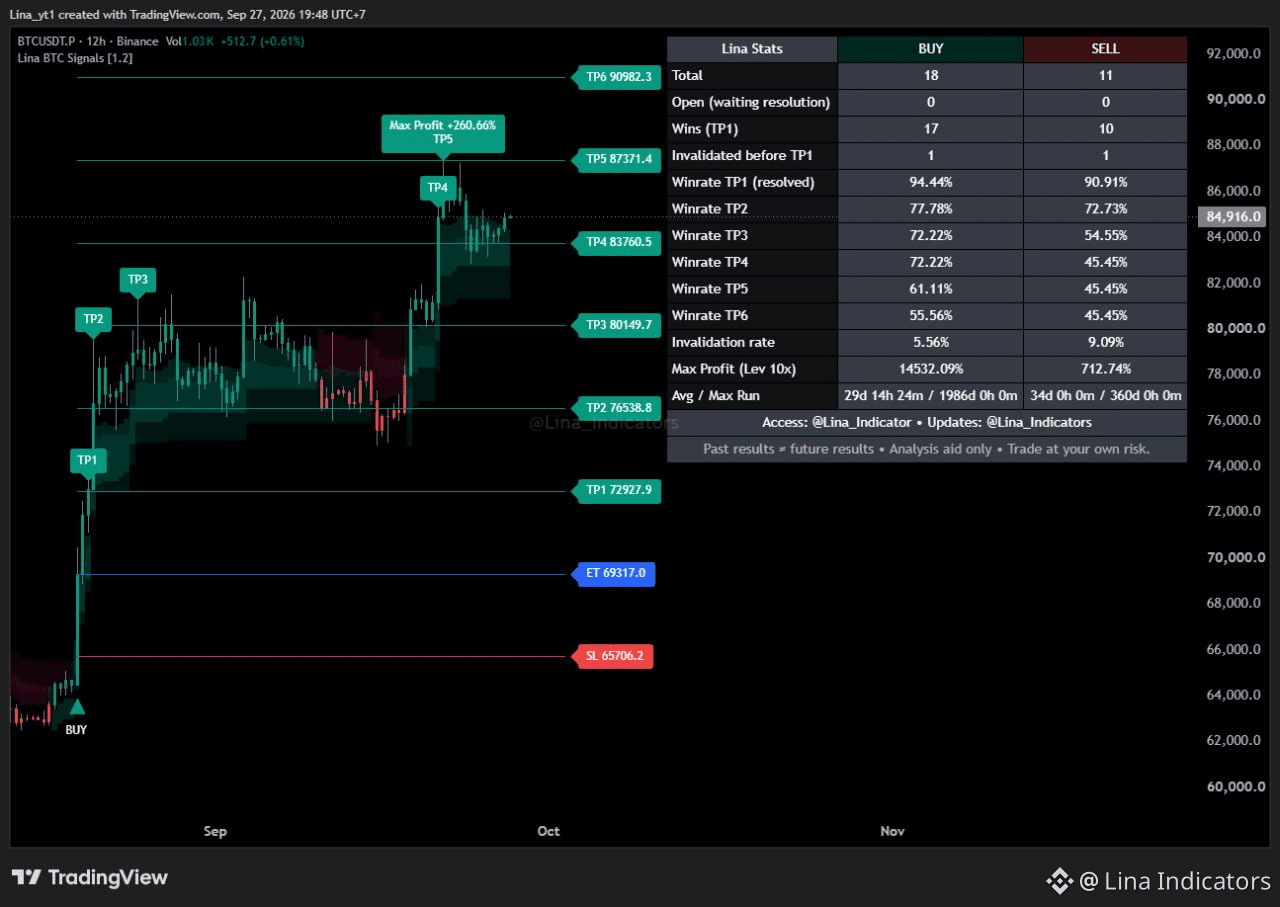
🔥 LINA BTC SIGNALS
A private TradingView indicator built specifically for $BTC.
• BUY / SELL
• Entry & Stop Loss
• TP1 → TP6
• Multi-timeframe structure
• Historical performance tracking
Each timeframe can have its own setup, allowing BTC market structure to be followed from multiple perspectives.
Private access:
1 Year • 3 Years • Lifetime
Lina BTC Signals
Built for BTC.
For analysis and educational purposes only. Past results do not guarantee future results.
$BTC #bitcoin #tradingview
🔥 LINA BTC SIGNALS
A private TradingView indicator built specifically for $BTC .
• BUY / SELL
• Entry & Stop Loss
• TP1 → TP6
• Multi-timeframe structure
• Historical performance tracking
Each timeframe can have its own setup, allowing BTC market structure to be followed from multiple perspectives.
Private access:
1 Year • 3 Years • Lifetime
Lina BTC Signals
Built for BTC.
For analysis and educational purposes only. Past results do not guarantee future results.
$BTC #bitcoin #tradingview
A private TradingView indicator built specifically for $BTC .
• BUY / SELL
• Entry & Stop Loss
• TP1 → TP6
• Multi-timeframe structure
• Historical performance tracking
Each timeframe can have its own setup, allowing BTC market structure to be followed from multiple perspectives.
Private access:
1 Year • 3 Years • Lifetime
Lina BTC Signals
Built for BTC.
For analysis and educational purposes only. Past results do not guarantee future results.
$BTC #bitcoin #tradingview
2
116

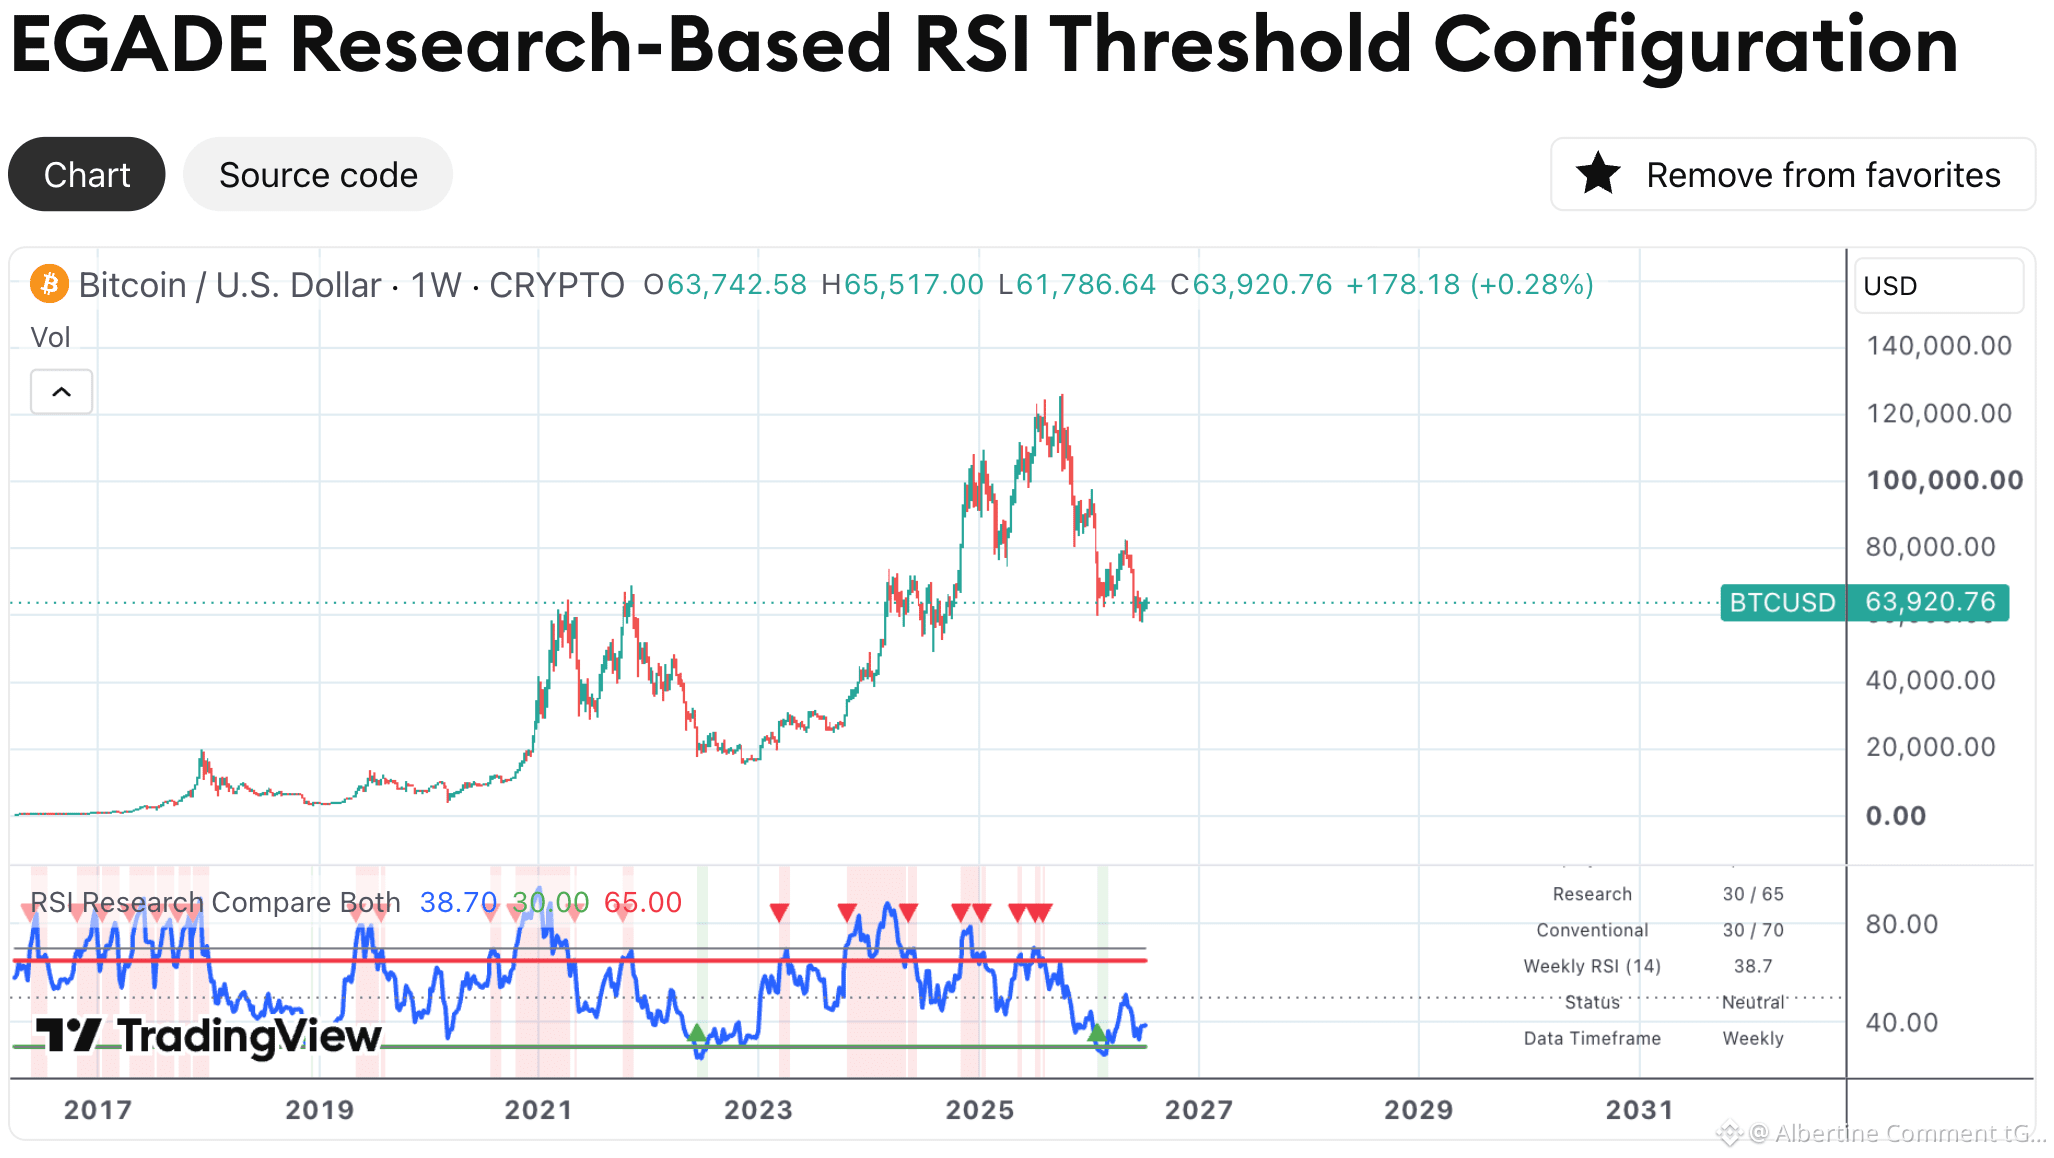
The EGADE Research-Based RSI Threshold Configuration, a new open-source TradingView indicator developed as a practical extension of our research:
“RSI Threshold Configurations and Signal Behaviour in Cryptocurrency and Traditional Markets: An Empirical Analysis on Weekly Data”
Co-authored with Dr. Federico Trigos and Francisco Valderrey, the research was presented at the 33rd International Conference on Transdisciplinary Engineering (TE2026) in Taiwan, and the paper is expected to be published in the conference proceedings in October 2026.
Our study systematically examines RSI threshold configurations across nine major cryptocurrencies and the S&P 500, challenging the assumption that the conventional 30/70 RSI configuration is universally dominant. The findings show that RSI threshold behaviour varies considerably across assets and that alternative configurations can outperform the conventional setting within the historical samples examined.
The EGADE Research-Based RSI Threshold Configuration translates these empirical findings into an accessible decision-support indicator on TradingView. Users can display the research-based configuration for each studied asset, compare it directly with the conventional 30/70 thresholds, and visually explore how the findings operate on weekly market data.
Access the indicator here:
https://www.tradingview.com/script/4pwHBqyZ-EGADE-Research-Based-RSI-Threshold-Configuration/
The indicator and its underlying findings are intended exclusively for academic, research, educational, and decision-support purposes. They do not constitute financial advice, investment recommendations, or a solicitation to buy or sell any financial instrument.
#TradingView #RSI #TechnicalAnalysis #HatemMabrouk #RelativeStrengthIndex
The EGADE Research-Based RSI Threshold Configuration, a new open-source TradingView indicator developed as a practical extension of our research:
“RSI Threshold Configurations and Signal Behaviour in Cryptocurrency and Traditional Markets: An Empirical Analysis on Weekly Data”
Co-authored with Dr. Federico Trigos and Francisco Valderrey, the research was presented at the 33rd International Conference on Transdisciplinary Engineering (TE2026) in Taiwan, and the paper is expected to be published in the conference proceedings in October 2026.
Our study systematically examines RSI threshold configurations across nine major cryptocurrencies and the S&P 500, challenging the assumption that the conventional 30/70 RSI configuration is universally dominant. The findings show that RSI threshold behaviour varies considerably across assets and that alternative configurations can outperform the conventional setting within the historical samples examined.
The EGADE Research-Based RSI Threshold Configuration translates these empirical findings into an accessible decision-support indicator on TradingView. Users can display the research-based configuration for each studied asset, compare it directly with the conventional 30/70 thresholds, and visually explore how the findings operate on weekly market data.
Access the indicator here:
https://www.tradingview.com/script/4pwHBqyZ-EGADE-Research-Based-RSI-Threshold-Configuration/
The indicator and its underlying findings are intended exclusively for academic, research, educational, and decision-support purposes. They do not constitute financial advice, investment recommendations, or a solicitation to buy or sell any financial instrument.
#TradingView #RSI #TechnicalAnalysis #HatemMabrouk #RelativeStrengthIndex
“RSI Threshold Configurations and Signal Behaviour in Cryptocurrency and Traditional Markets: An Empirical Analysis on Weekly Data”
Co-authored with Dr. Federico Trigos and Francisco Valderrey, the research was presented at the 33rd International Conference on Transdisciplinary Engineering (TE2026) in Taiwan, and the paper is expected to be published in the conference proceedings in October 2026.
Our study systematically examines RSI threshold configurations across nine major cryptocurrencies and the S&P 500, challenging the assumption that the conventional 30/70 RSI configuration is universally dominant. The findings show that RSI threshold behaviour varies considerably across assets and that alternative configurations can outperform the conventional setting within the historical samples examined.
The EGADE Research-Based RSI Threshold Configuration translates these empirical findings into an accessible decision-support indicator on TradingView. Users can display the research-based configuration for each studied asset, compare it directly with the conventional 30/70 thresholds, and visually explore how the findings operate on weekly market data.
Access the indicator here:
https://www.tradingview.com/script/4pwHBqyZ-EGADE-Research-Based-RSI-Threshold-Configuration/
The indicator and its underlying findings are intended exclusively for academic, research, educational, and decision-support purposes. They do not constitute financial advice, investment recommendations, or a solicitation to buy or sell any financial instrument.
#TradingView #RSI #TechnicalAnalysis #HatemMabrouk #RelativeStrengthIndex
127

花了几个月,用 AI 辅助打造了 3 套 BTC 期货量化信号。
三套策略各有分工:
· SYS03 EMA 三重脉冲 — 追踪中期趋势主浪,近一年 54 笔,盈利因子 1.46
· SYS05 波动能量突破 — 布林带 + 肯特纳双压缩,捕捉能量爆发,盈利因子 1.49
· SYS06 RSI 背离逆转 — 近一年仅 15 笔,胜率 66.67%,盈利因子 3.57,最大回撤 0.25%
全部在 TradingView 回测,你可以自己复现数字,不需要信我说的。
感兴趣的在 X (Twitter) 直接 DM 我,名额有限,先到先得。
#量化交易 #TradingView #量化信号
$BTC $XAUT $HYPE
花了几个月,用 AI 辅助打造了 3 套 BTC 期货量化信号。
三套策略各有分工:
· SYS03 EMA 三重脉冲 — 追踪中期趋势主浪,近一年 54 笔,盈利因子 1.46
· SYS05 波动能量突破 — 布林带 + 肯特纳双压缩,捕捉能量爆发,盈利因子 1.49
· SYS06 RSI 背离逆转 — 近一年仅 15 笔,胜率 66.67%,盈利因子 3.57,最大回撤 0.25%
全部在 TradingView 回测,你可以自己复现数字,不需要信我说的。
感兴趣的在 X (Twitter) 直接 DM 我,名额有限,先到先得。
#量化交易 #TradingView #量化信号
$BTC $XAUT $HYPE
三套策略各有分工:
· SYS03 EMA 三重脉冲 — 追踪中期趋势主浪,近一年 54 笔,盈利因子 1.46
· SYS05 波动能量突破 — 布林带 + 肯特纳双压缩,捕捉能量爆发,盈利因子 1.49
· SYS06 RSI 背离逆转 — 近一年仅 15 笔,胜率 66.67%,盈利因子 3.57,最大回撤 0.25%
全部在 TradingView 回测,你可以自己复现数字,不需要信我说的。
感兴趣的在 X (Twitter) 直接 DM 我,名额有限,先到先得。
#量化交易 #TradingView #量化信号
$BTC $XAUT $HYPE
246
SYS03 的核心逻辑,用一句话说清楚:
EMA 三条均线必须全部同向排列,动能指标同步确认,才触发信号。
为什么要这么严格?
因为我见过太多人在「感觉要涨」的时候进场,
然后看着方向反转,却因为「没有明确的止损点」而死扛。
SYS03 的严格条件,就是为了过滤掉这些「看起来像」的假信号。
少做,但每一次都有根据。
在 TradingView 搜索 SYS03,可以自己跑回测。
#TradingView #量化交易 #BTC
$BTC $XAUT $HYPE
SYS03 的核心逻辑,用一句话说清楚:
EMA 三条均线必须全部同向排列,动能指标同步确认,才触发信号。
为什么要这么严格?
因为我见过太多人在「感觉要涨」的时候进场,
然后看着方向反转,却因为「没有明确的止损点」而死扛。
SYS03 的严格条件,就是为了过滤掉这些「看起来像」的假信号。
少做,但每一次都有根据。
在 TradingView 搜索 SYS03,可以自己跑回测。
#TradingView #量化交易 #BTC
$BTC $XAUT $HYPE
EMA 三条均线必须全部同向排列,动能指标同步确认,才触发信号。
为什么要这么严格?
因为我见过太多人在「感觉要涨」的时候进场,
然后看着方向反转,却因为「没有明确的止损点」而死扛。
SYS03 的严格条件,就是为了过滤掉这些「看起来像」的假信号。
少做,但每一次都有根据。
在 TradingView 搜索 SYS03,可以自己跑回测。
#TradingView #量化交易 #BTC
$BTC $XAUT $HYPE
320

花了几个月,用 AI 辅助打造了 3 套 BTC 期货量化信号。
三套策略各有分工:
· SYS03 EMA 三重脉冲 — 追踪中期趋势主浪,近一年 54 笔,盈利因子 1.46
· SYS05 波动能量突破 — 布林带 + 肯特纳双压缩,捕捉能量爆发,盈利因子 1.49
· SYS06 RSI 背离逆转 — 近一年仅 15 笔,胜率 66.67%,盈利因子 3.57,最大回撤 0.25%
全部在 TradingView 回测,你可以自己复现数字,不需要信我说的。
感兴趣的在 X (Twitter) 直接 DM 我,名额有限,先到先得。
#量化交易 #TradingView #量化信号
$BTC $XAUT $HYPE
花了几个月,用 AI 辅助打造了 3 套 BTC 期货量化信号。
三套策略各有分工:
· SYS03 EMA 三重脉冲 — 追踪中期趋势主浪,近一年 54 笔,盈利因子 1.46
· SYS05 波动能量突破 — 布林带 + 肯特纳双压缩,捕捉能量爆发,盈利因子 1.49
· SYS06 RSI 背离逆转 — 近一年仅 15 笔,胜率 66.67%,盈利因子 3.57,最大回撤 0.25%
全部在 TradingView 回测,你可以自己复现数字,不需要信我说的。
感兴趣的在 X (Twitter) 直接 DM 我,名额有限,先到先得。
#量化交易 #TradingView #量化信号
$BTC $XAUT $HYPE
三套策略各有分工:
· SYS03 EMA 三重脉冲 — 追踪中期趋势主浪,近一年 54 笔,盈利因子 1.46
· SYS05 波动能量突破 — 布林带 + 肯特纳双压缩,捕捉能量爆发,盈利因子 1.49
· SYS06 RSI 背离逆转 — 近一年仅 15 笔,胜率 66.67%,盈利因子 3.57,最大回撤 0.25%
全部在 TradingView 回测,你可以自己复现数字,不需要信我说的。
感兴趣的在 X (Twitter) 直接 DM 我,名额有限,先到先得。
#量化交易 #TradingView #量化信号
$BTC $XAUT $HYPE
1
1
2.1k
花了几个月,用 AI 辅助打造了 3 套 BTC 期货量化信号。
三套策略各有分工:
· SYS03 EMA 三重脉冲 — 追踪中期趋势主浪,近一年 54 笔,盈利因子 1.46
· SYS05 波动能量突破 — 布林带 + 肯特纳双压缩,捕捉能量爆发,盈利因子 1.49
· SYS06 RSI 背离逆转 — 近一年仅 15 笔,胜率 66.67%,盈利因子 3.57,最大回撤 0.25%
全部在 TradingView 回测,你可以自己复现数字,不需要信我说的。
感兴趣的在 X (Twitter) 直接 DM 我,名额有限,先到先得。
#量化交易 #TradingView #量化信号
$BTC $XAUT $HYPE
花了几个月,用 AI 辅助打造了 3 套 BTC 期货量化信号。
三套策略各有分工:
· SYS03 EMA 三重脉冲 — 追踪中期趋势主浪,近一年 54 笔,盈利因子 1.46
· SYS05 波动能量突破 — 布林带 + 肯特纳双压缩,捕捉能量爆发,盈利因子 1.49
· SYS06 RSI 背离逆转 — 近一年仅 15 笔,胜率 66.67%,盈利因子 3.57,最大回撤 0.25%
全部在 TradingView 回测,你可以自己复现数字,不需要信我说的。
感兴趣的在 X (Twitter) 直接 DM 我,名额有限,先到先得。
#量化交易 #TradingView #量化信号
$BTC $XAUT $HYPE
三套策略各有分工:
· SYS03 EMA 三重脉冲 — 追踪中期趋势主浪,近一年 54 笔,盈利因子 1.46
· SYS05 波动能量突破 — 布林带 + 肯特纳双压缩,捕捉能量爆发,盈利因子 1.49
· SYS06 RSI 背离逆转 — 近一年仅 15 笔,胜率 66.67%,盈利因子 3.57,最大回撤 0.25%
全部在 TradingView 回测,你可以自己复现数字,不需要信我说的。
感兴趣的在 X (Twitter) 直接 DM 我,名额有限,先到先得。
#量化交易 #TradingView #量化信号
$BTC $XAUT $HYPE
121
SYS03 的核心逻辑,用一句话说清楚:
EMA 三条均线必须全部同向排列,动能指标同步确认,才触发信号。
为什么要这么严格?
因为我见过太多人在「感觉要涨」的时候进场,
然后看着方向反转,却因为「没有明确的止损点」而死扛。
SYS03 的严格条件,就是为了过滤掉这些「看起来像」的假信号。
少做,但每一次都有根据。
在 TradingView 搜索 SYS03,可以自己跑回测。
#TradingView #量化交易 #BTC
$BTC $XAUT $HYPE
SYS03 的核心逻辑,用一句话说清楚:
EMA 三条均线必须全部同向排列,动能指标同步确认,才触发信号。
为什么要这么严格?
因为我见过太多人在「感觉要涨」的时候进场,
然后看着方向反转,却因为「没有明确的止损点」而死扛。
SYS03 的严格条件,就是为了过滤掉这些「看起来像」的假信号。
少做,但每一次都有根据。
在 TradingView 搜索 SYS03,可以自己跑回测。
#TradingView #量化交易 #BTC
$BTC $XAUT $HYPE
EMA 三条均线必须全部同向排列,动能指标同步确认,才触发信号。
为什么要这么严格?
因为我见过太多人在「感觉要涨」的时候进场,
然后看着方向反转,却因为「没有明确的止损点」而死扛。
SYS03 的严格条件,就是为了过滤掉这些「看起来像」的假信号。
少做,但每一次都有根据。
在 TradingView 搜索 SYS03,可以自己跑回测。
#TradingView #量化交易 #BTC
$BTC $XAUT $HYPE
105
SYS03 的核心逻辑,用一句话说清楚:
EMA 三条均线必须全部同向排列,动能指标同步确认,才触发信号。
为什么要这么严格?
因为我见过太多人在「感觉要涨」的时候进场,
然后看着方向反转,却因为「没有明确的止损点」而死扛。
SYS03 的严格条件,就是为了过滤掉这些「看起来像」的假信号。
少做,但每一次都有根据。
在 TradingView 搜索 SYS03,可以自己跑回测。
#TradingView #量化交易 #BTC
$BTC $XAUT $HYPE
SYS03 的核心逻辑,用一句话说清楚:
EMA 三条均线必须全部同向排列,动能指标同步确认,才触发信号。
为什么要这么严格?
因为我见过太多人在「感觉要涨」的时候进场,
然后看着方向反转,却因为「没有明确的止损点」而死扛。
SYS03 的严格条件,就是为了过滤掉这些「看起来像」的假信号。
少做,但每一次都有根据。
在 TradingView 搜索 SYS03,可以自己跑回测。
#TradingView #量化交易 #BTC
$BTC $XAUT $HYPE
EMA 三条均线必须全部同向排列,动能指标同步确认,才触发信号。
为什么要这么严格?
因为我见过太多人在「感觉要涨」的时候进场,
然后看着方向反转,却因为「没有明确的止损点」而死扛。
SYS03 的严格条件,就是为了过滤掉这些「看起来像」的假信号。
少做,但每一次都有根据。
在 TradingView 搜索 SYS03,可以自己跑回测。
#TradingView #量化交易 #BTC
$BTC $XAUT $HYPE
107
Войдите, чтобы посмотреть больше материала
Присоединяйтесь к пользователям криптовалют по всему миру на Binance Square
⚡️ Получайте новейшую и полезную информацию о криптоактивах.
💬 Нам доверяет крупнейшая в мире криптобиржа.
👍 Получите достоверные аналитические данные от верифицированных создателей контента.
Эл. почта/номер телефона
В тренде
1
#AnthropicRejectsIPODelayValuationinQuestion
Просмотров: 547,170
4,489 обсуждают
2
#HuangExitNvidiaStrategyInFocus
Просмотров: 10
7 обсуждают
3
#BitMineReports$6.3BNetLossForFiscal2026
Просмотров: 552
42 обсуждают
4
#CoreWeaveJumps10%On168%RevenueGrowth
Просмотров: 104,359
1,242 обсуждают
5
#ZcashFallsBelow$1000ForFirstTimeSinceSeptember
Просмотров: 57,724
239 обсуждают
6
#MSCIRemovalMayCurbStrategy’sBitcoinBuying
Просмотров: 18,076
305 обсуждают
7
#HKSFCSaysTokenizationMovingToCommercialUse
Просмотров: 5,653
110 обсуждают
8
#CanNvidiaEarningsEaseMarketConcerns?
Просмотров: 209,959
2,103 обсуждают
9
#USJoblessClaimsRise
Просмотров: 19.1M
7,505 обсуждают
10
#PythAddsNYSERealTimeDataToMarketplace
Просмотров: 8,980
189 обсуждают