

#btcfallsbelow$83000
btcfallsbelow$83000
Популярные
Новые


·
--
Падение
ARE YOU READY FOR A DEEPER CORRECTION IN $BTC ?
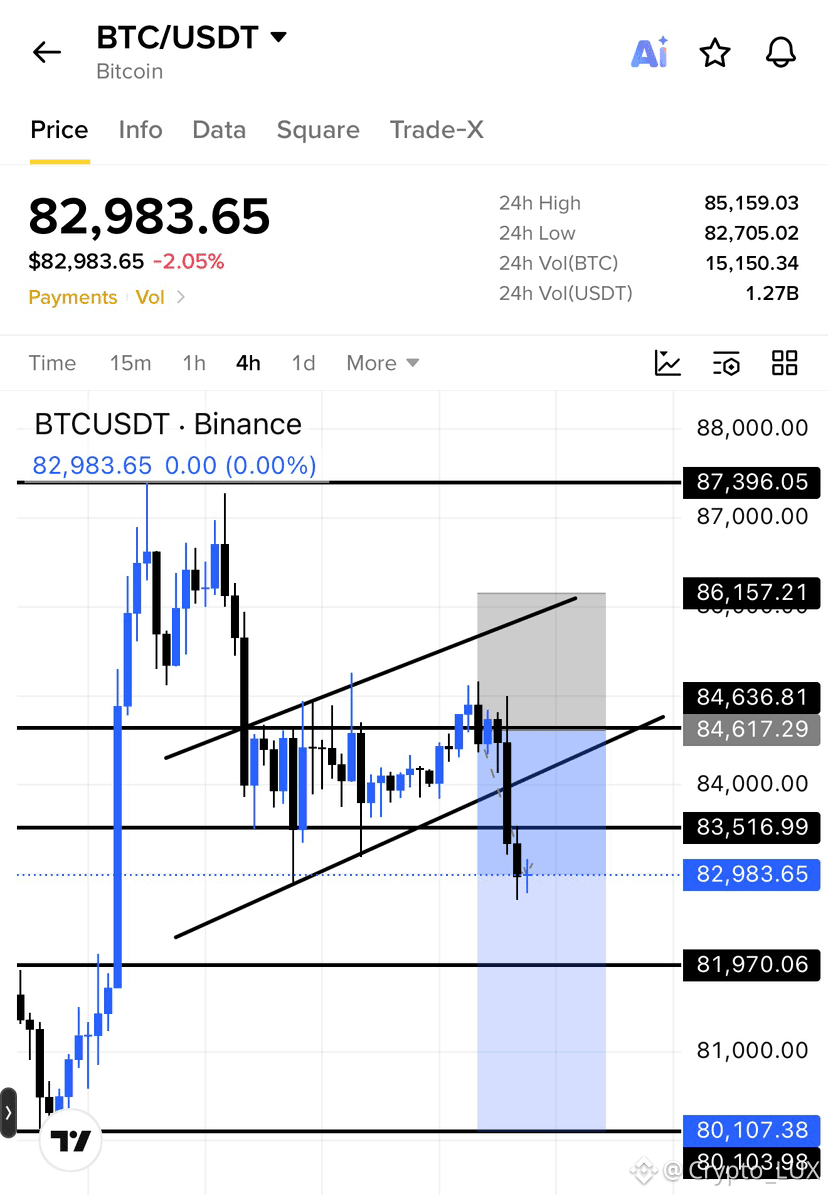
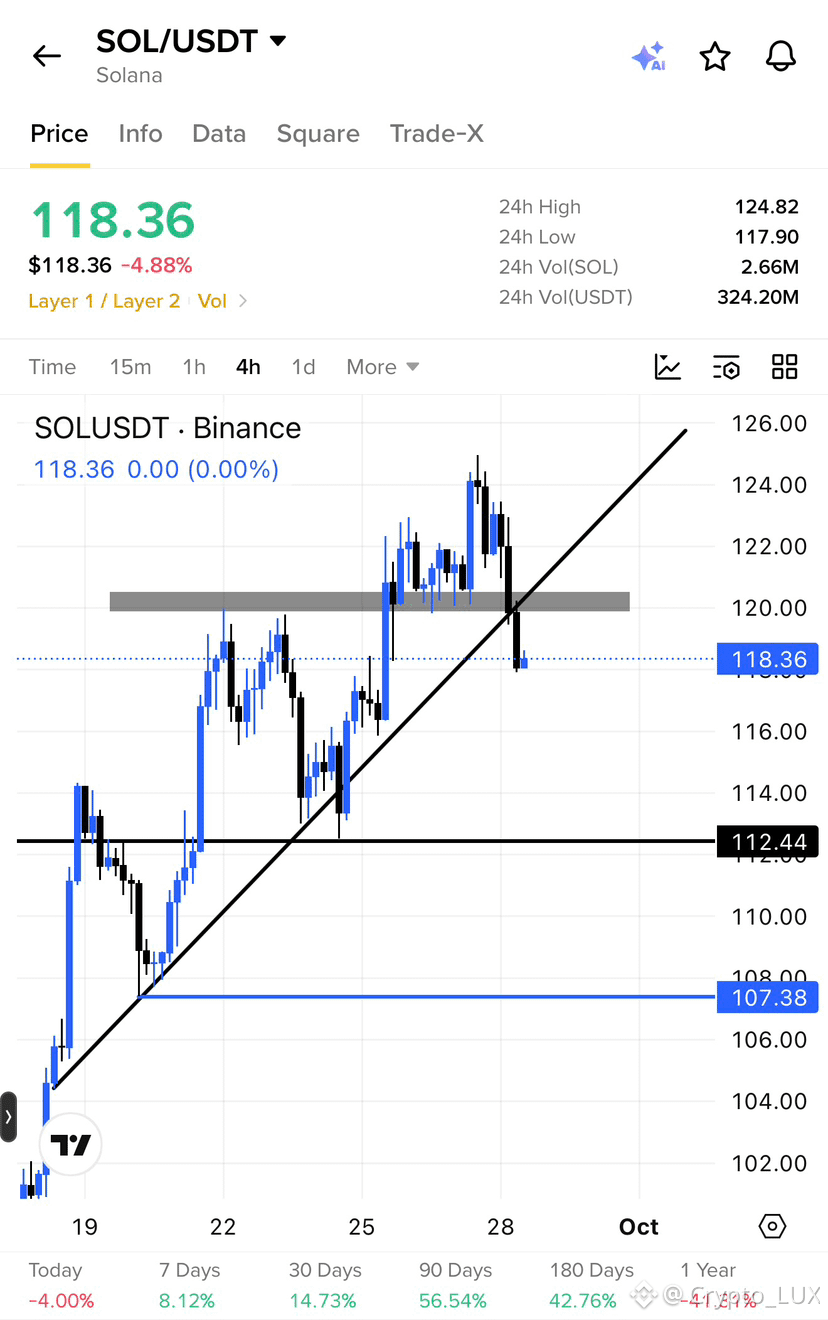
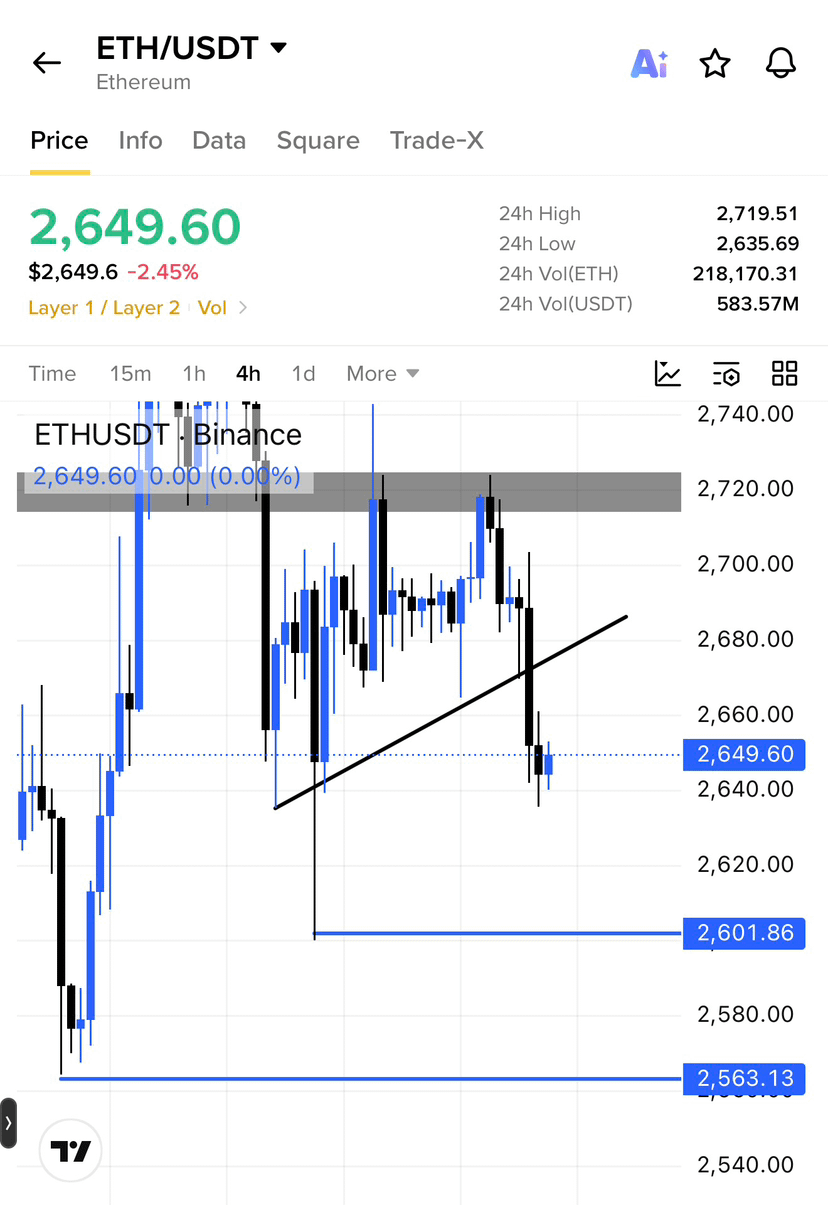
Under $80,000? Yes, it will. I don’t think $82,750 will hold for long. I’m looking at liquidations around $80,100, with a quick wick below that level during the equity session. Same for the $SOL ETH sharing the charts and marking the liquidity zones what you can target! I have the actives trades thats why i am not going with the SOL and ETH . $HYPE short running the way i was looking!
And what could be the reason?
Technically, this bear flag still has to play out. Secondly, as I was talking about this yesterday, I was expecting the low of this week to form within the first two days of the week. USD dominance has now got a bullish breakout from the 1H LTF weekend range, along with some bad fundamentals: oil is pushing higher, while 10Y and 30Y bond yields are sitting at levels not seen in the past three decades despite rate hikes.
So yes, a deeper correction is still pending, and we are riding the short. Let’s go.
First target is already done at $82,750. The second target I’m looking at is $81,790, followed by the $80,000 liquidity zone.
I expect a major correction under these levels. Once the market gets below $82,750, a 4H close there would confirm further weakness.
Stop-loss trailed to $83,800
Enjoy the rest of the move and take partials at the following levels, but keep at least 30% of the position open for a potential move under $80,000. If we need to book, I’ll make the call.
Make it as it is just rearrange and fix grammer!
{future}(BTCUSDT)
{future}(HYPEUSDT)
{future}(SOLUSDT)
#BTCFallsBelow$83000 #BitcoinSpotETFs$2.39BWeeklyNetInflow #FedProposesPaymentStablecoinRules #ChinaMayLetAlibabaByteDanceBuyNvidiaChips
ARE YOU READY FOR A DEEPER CORRECTION IN $BTC ?
Under $80,000? Yes, it will. I don’t think $82,750 will hold for long. I’m looking at liquidations around $80,100, with a quick wick below that level during the equity session. Same for the $SOL ETH sharing the charts and marking the liquidity zones what you can target! I have the actives trades thats why i am not going with the SOL and ETH . $HYPE short running the way i was looking!
And what could be the reason?
Technically, this bear flag still has to play out. Secondly, as I was talking about this yesterday, I was expecting the low of this week to form within the first two days of the week. USD dominance has now got a bullish breakout from the 1H LTF weekend range, along with some bad fundamentals: oil is pushing higher, while 10Y and 30Y bond yields are sitting at levels not seen in the past three decades despite rate hikes.
So yes, a deeper correction is still pending, and we are riding the short. Let’s go.
First target is already done at $82,750. The second target I’m looking at is $81,790, followed by the $80,000 liquidity zone.
I expect a major correction under these levels. Once the market gets below $82,750, a 4H close there would confirm further weakness.
Stop-loss trailed to $83,800
Enjoy the rest of the move and take partials at the following levels, but keep at least 30% of the position open for a potential move under $80,000. If we need to book, I’ll make the call.
Make it as it is just rearrange and fix grammer!
#BTCFallsBelow$83000 #BitcoinSpotETFs$2.39BWeeklyNetInflow #FedProposesPaymentStablecoinRules #ChinaMayLetAlibabaByteDanceBuyNvidiaChips
Under $80,000? Yes, it will. I don’t think $82,750 will hold for long. I’m looking at liquidations around $80,100, with a quick wick below that level during the equity session. Same for the $SOL ETH sharing the charts and marking the liquidity zones what you can target! I have the actives trades thats why i am not going with the SOL and ETH . $HYPE short running the way i was looking!
And what could be the reason?
Technically, this bear flag still has to play out. Secondly, as I was talking about this yesterday, I was expecting the low of this week to form within the first two days of the week. USD dominance has now got a bullish breakout from the 1H LTF weekend range, along with some bad fundamentals: oil is pushing higher, while 10Y and 30Y bond yields are sitting at levels not seen in the past three decades despite rate hikes.
So yes, a deeper correction is still pending, and we are riding the short. Let’s go.
First target is already done at $82,750. The second target I’m looking at is $81,790, followed by the $80,000 liquidity zone.
I expect a major correction under these levels. Once the market gets below $82,750, a 4H close there would confirm further weakness.
Stop-loss trailed to $83,800
Enjoy the rest of the move and take partials at the following levels, but keep at least 30% of the position open for a potential move under $80,000. If we need to book, I’ll make the call.
Make it as it is just rearrange and fix grammer!
#BTCFallsBelow$83000 #BitcoinSpotETFs$2.39BWeeklyNetInflow #FedProposesPaymentStablecoinRules #ChinaMayLetAlibabaByteDanceBuyNvidiaChips
AngelOfCrypto_-:
nice
9
20
13.7k

·
--
$BTC
这次只说跟着牛哥在86000附近开的空单,止盈在83000。
今天说的是破位83000位置以后的策略,破位后止盈在82300,82000区间。
如果破位82000位置,进入8200,到81500区间。最低止盈位置是80800到80500区间。止撑80000。
{future}(BTCUSDT)
$BTC
这次只说跟着牛哥在86000附近开的空单,止盈在83000。
今天说的是破位83000位置以后的策略,破位后止盈在82300,82000区间。
如果破位82000位置,进入8200,到81500区间。最低止盈位置是80800到80500区间。止撑80000。
这次只说跟着牛哥在86000附近开的空单,止盈在83000。
今天说的是破位83000位置以后的策略,破位后止盈在82300,82000区间。
如果破位82000位置,进入8200,到81500区间。最低止盈位置是80800到80500区间。止撑80000。
5
7.4k

·
--
🚀 *BTC/USDT — LONG*
💎 75X Cross
📍 *Entry:* 83000 – 82400
🎯 *TP:* 83600 • 84200 • 84800 • 85400
🛑 *SL:* 81388
⚠️ *Risk:* Max 3–5% per trade.
$BTC
{spot}(BTCUSDT)
🚀 *BTC/USDT — LONG*
💎 75X Cross
📍 *Entry:* 83000 – 82400
🎯 *TP:* 83600 • 84200 • 84800 • 85400
🛑 *SL:* 81388
⚠️ *Risk:* Max 3–5% per trade.
$BTC
💎 75X Cross
📍 *Entry:* 83000 – 82400
🎯 *TP:* 83600 • 84200 • 84800 • 85400
🛑 *SL:* 81388
⚠️ *Risk:* Max 3–5% per trade.
$BTC
7
5.8k

·
--
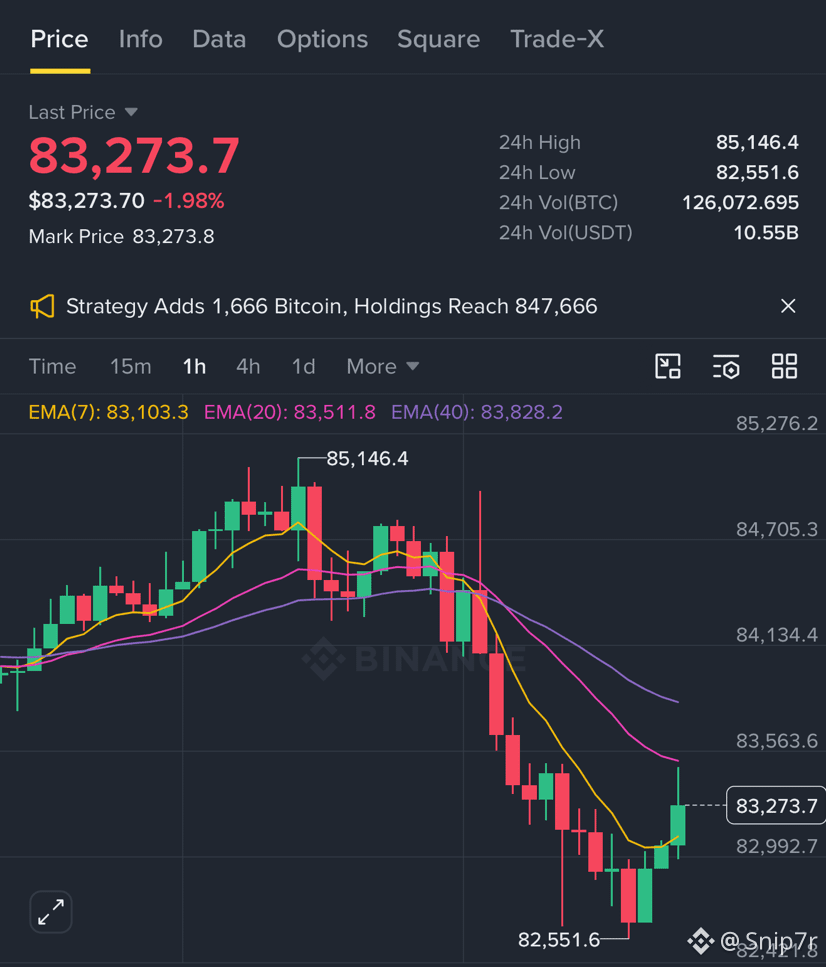
BTC pulls back while Michael Saylor’s Strategy keeps buying. Its latest update lists 847,666 BTC in total holdings.
BTC bounced from $82,552, keeping $82K support in focus. But the 1H RSI near 42 shows buyers still need stronger momentum.
A recovery above $84,100 would strengthen the case for $85,150. Lose $82,550, and $82K faces another test.
Big purchases support confidence. Price confirmation matters. Keep your position small until resistance turns into support.
#BTCFallsBelow$83000
BTC pulls back while Michael Saylor’s Strategy keeps buying. Its latest update lists 847,666 BTC in total holdings.
BTC bounced from $82,552, keeping $82K support in focus. But the 1H RSI near 42 shows buyers still need stronger momentum.
A recovery above $84,100 would strengthen the case for $85,150. Lose $82,550, and $82K faces another test.
Big purchases support confidence. Price confirmation matters. Keep your position small until resistance turns into support.
#BTCFallsBelow$83000
BTC bounced from $82,552, keeping $82K support in focus. But the 1H RSI near 42 shows buyers still need stronger momentum.
A recovery above $84,100 would strengthen the case for $85,150. Lose $82,550, and $82K faces another test.
Big purchases support confidence. Price confirmation matters. Keep your position small until resistance turns into support.
#BTCFallsBelow$83000
81

Статья
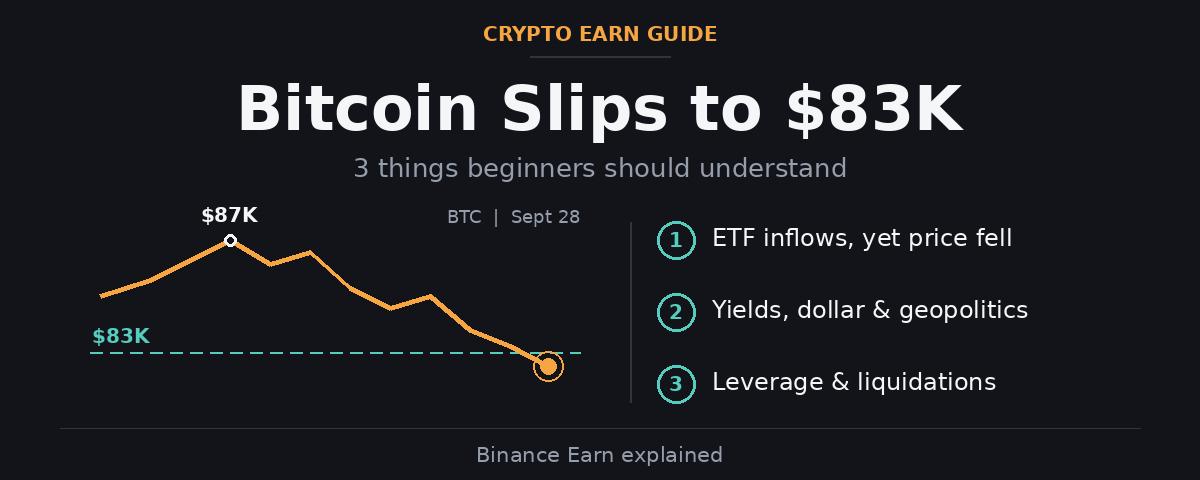
#BTCFallsBelow$83000: what's really behind the dip?$BTC slid into the $83K zone on Sept 28 (briefly dipping under it intraday) after failing to hold above $87K earlier this month. Here's what beginners should understand 👇
🏦 1. Big ETF inflows didn't stop the drop
US spot Bitcoin ETFs took in billions last week, yet price still fell. Demand is only one side of the equation, and selling pressure can outweigh it.
🌍 2. Macro is pulling the strings
Rising Treasury yields, a stronger dollar and renewed US-Iran tensions are pressuring risk assets broadly, not just crypto. When yields rise, riskier assets often feel it.
💥 3. Leverage amplifies moves
Leveraged long positions were liquidated as price slipped toward $83K. Forced liquidations can speed up a drop, which is why leverage cuts both ways.
📊 Zoom out
BTC is still roughly a third below its Oct 2025 all-time high (~$126K). Volatility is part of this asset class. Nobody can time short-term moves, so the useful question is whether your position size and time horizon fit your own risk tolerance.
What do you think is driving this dip: macro, leverage, or something else? Drop your take 👇
Educational content only, not investment advice. Prices as of Sept 28 and they change fast. Crypto is highly volatile and you can lose money. Always DYOR.
#BTCFallsBelow$83000 #Bitcoin #CryptoEducation #Write2Earn $BTC
{spot}(BTCUSDT)
#BTCFallsBelow$83000: what's really behind the dip?
$BTC slid into the $83K zone on Sept 28 (briefly dipping under it intraday) after failing to hold above $87K earlier this month. Here's what beginners should understand 👇
🏦 1. Big ETF inflows didn't stop the drop
US spot Bitcoin ETFs took in billions last week, yet price still fell. Demand is only one side of the equation, and selling pressure can outweigh it.
🌍 2. Macro is pulling the strings
Rising Treasury yields, a stronger dollar and renewed US-Iran tensions are pressuring risk assets broadly, not just crypto. When yields rise, riskier assets often feel it.
💥 3. Leverage amplifies moves
Leveraged long positions were liquidated as price slipped toward $83K. Forced liquidations can speed up a drop, which is why leverage cuts both ways.
📊 Zoom out
BTC is still roughly a third below its Oct 2025 all-time high (~$126K). Volatility is part of this asset class. Nobody can time short-term moves, so the useful question is whether your position size and time horizon fit your own risk tolerance.
What do you think is driving this dip: macro, leverage, or something else? Drop your take 👇
Educational content only, not investment advice. Prices as of Sept 28 and they change fast. Crypto is highly volatile and you can lose money. Always DYOR.
#BTCFallsBelow$83000 #Bitcoin #CryptoEducation #Write2Earn $BTC
🏦 1. Big ETF inflows didn't stop the drop
US spot Bitcoin ETFs took in billions last week, yet price still fell. Demand is only one side of the equation, and selling pressure can outweigh it.
🌍 2. Macro is pulling the strings
Rising Treasury yields, a stronger dollar and renewed US-Iran tensions are pressuring risk assets broadly, not just crypto. When yields rise, riskier assets often feel it.
💥 3. Leverage amplifies moves
Leveraged long positions were liquidated as price slipped toward $83K. Forced liquidations can speed up a drop, which is why leverage cuts both ways.
📊 Zoom out
BTC is still roughly a third below its Oct 2025 all-time high (~$126K). Volatility is part of this asset class. Nobody can time short-term moves, so the useful question is whether your position size and time horizon fit your own risk tolerance.
What do you think is driving this dip: macro, leverage, or something else? Drop your take 👇
Educational content only, not investment advice. Prices as of Sept 28 and they change fast. Crypto is highly volatile and you can lose money. Always DYOR.
#BTCFallsBelow$83000 #Bitcoin #CryptoEducation #Write2Earn $BTC
1
140

·
--

Статья
بيتكوين في سبتمبر: ارتداد تحت اختبار ضغطالخلاصة في سطر واحد: بيتكوين ارتفع من 75 ألف دولار لأعلى نقطة عند 87,397 دولار خلال سبتمبر، مدفوعاً بتدفقات صناديق ETF وضغط على البائعين، لكن ضغوط نهاية الشهر من الجيوسياسة وعوائد السندات أثبتت إن أساس هذا الارتداد لسه هش.
مسار سبتمبر: نزول، ثم صعود قوي، ثم تراجع
بيتينكوين في سبتمبر كان أشبه بـ"قطار ملاهي"، لكن الخط العام واضح:
بداية الشهر: ضغط. دخل بيتكوين سبتمبر وهو لسه بيمتص صدمة رفع الفائدة من الفيدرالي ورفض مجلس الشيوخ لقانون CLARITY. في 16 سبتمبر، الفيدرالي صوّت بالإجماع على رفع الفائدة إلى 3.75%-4%، وبيتكوين نزل لمستوى 75,000 دولار.
منتصف الشهر: ارتداد عنيف. من 18 سبتمبر، بدأت السيولة تدخل. في 21 سبتمبر، صناديق بيتكوين现货 الأمريكية سجلت تدفقاً صافياً يقترب من مليار دولار في يوم واحد — أكبر دخول يومي من أكتوبر 2025. بيتكوين طلع 7% في يومين، وفي 22 سبتمبر لامس 87,397 دولار، أعلى مستوى من نهاية يناير.
نهاية الشهر: ضربة جديدة. بعدها تصاعدت التوترات الأمريكية-الإيرانية، وبيانات PMI الأمريكية القوية رفعت عوائد السندات، وبيتكوين نزل من 87,000 دولار لمنطقة 83,000-84,000. بحلول 28 سبتمبر، وصل 82,858 دولار.
ورغم التراجع في نهاية الشهر، بيتكوين أنهى سبتمبر بارتفاع شهري حوالي 7.4%، وده الشهر الثالث على التوالي من المكاسب — أول مرة يحصل ده من 2012.
إيه اللي دفع السعر لفوق؟
أولاً: تدفقات ETF هي الدعامة الأساسية. في الأسبوع من 21 لـ 25 سبتمبر، صناديق بيتكوين现货 الأمريكية سجلت تدفقاً صافياً حوالي 23.9 مليار دولار — أقوى تدفق أسبوعي من أكتوبر 2025. صندوق IBIT من بلاك روك لحده حوالي 11.6 مليار دولار. وإجمالاً خلال سبتمبر، التدفقات وصلت حوالي 25.6 مليار دولار، مقابل 35.2 مليار في أغسطس — يعني الطلب المؤسسي بيتحسن في النصف الثاني من السنة.
ثانياً: ضغط البائعين ضخّم الارتفاع. لما بيتكوين اخترق نطاق 82,000-84,000 دولار، كتير من المراكز البيعية اتقفلت بالإجبار. في 21 سبتمبر بس، السوق صفّى حوالي 928 مليون دولار، منها 840 مليون من البائعين. و130,000 متداول اتصفّوا في 24 ساعة. ده بيفسر ليه الارتفاع كان سريع وعنيف بالشكل ده.
ثالثاً: بيانات البلوكتشين بتشير لتراكم. في آخر أسبوع من سبتمبر، حوالي 31,800 بيتكوين خرجت من المنصات، منها أكتر من 13,800 بيتكوين من بينانس في يوم واحد — أكبر خروج يومي من 2023. رصيد المنصات نزل من حوالي 705,000 لـ 685,000 بيتكوين. وده بيتفسر عادة إن المستثمرين بيتجهوا للاحتفاظ طويل الأجل، وده بيقلل ضغط البيع الفوري.
إيه اللي كان بيضغط على بيتكوين؟
عوائد السندات هي "الخصم الأكبر". في 23 سبتمبر، بيانات PMI الأمريكية طلعت أقوى بكتير من المتوقع — المؤشر المركب وصل 58.4، أسرع نمو من يوليو 2021. ده رفع توقعات رفع الفائدة، وعائد سند الخزانة لأجل 10 سنين اخترق 5%، أعلى مستوى من 2007.
وبالنسبة لبيتكوين، اللي مش بيدر عائد، عائد 5% بدون مخاطرة معناه إن تكلفة الفرصة البديلة لحيازته بقت عالية جداً. المؤسسات لما تختار بين سند أمريكي بـ4.95%-5% وبيتكوين عالي التقلب، الميزان بيميل.
الجيوسياسة كانت "البجعة السوداء" في نهاية الشهر. ترامب رفض مقترح إيران بوقف إطلاق النار سبعة أيام، والتوترات الأمريكية-الإيرانية اشتعلت تاني. النفط رجع فوق 93 دولار، وقلق التضخم زاد، والأصول الخطرة اتضغطت بشكل عام.
الأرقام المهمة في نظرة واحدة
المؤشرأداء سبتمبرالارتفاع الشهريحوالي +7.4% (الشهر الثالث على التوالي)أعلى نقطة في الشهر87,397 دولار (أعلى من نهاية يناير)أقل نقطة في الشهرحوالي 75,000 دولارتدفق ETF الأسبوعي (21-25 سبتمبر)حوالي 23.9 مليار دولار (الأقوى من أكتوبر 2025)تصفية البائعين (21 سبتمبر)حوالي 840 مليون دولارعائد سند الخزانة 10 سنيناخترق 5.1% (أعلى من 2007)
إيه اللي نراقبه بعد كده؟
أولاً: هل 84,800 دولار يتحول من مقاومة لدعم؟ المحللين شايفين إن لو بيتكوين ثبت فوق 84,800 دولار، ومع تصعيد جيوسياسي أقل، السوق ممكن يبدأ يجهز لاختبار 90,000 دولار.
ثانياً: استمرارية تدفقات ETF. في آخر أسبوع من سبتمبر، التدفقات نزلت من حوالي مليار دولار يوم الاثنين لـ 191 مليون دولار يوم الخميس — انخفاض 81%. استمرار التباطؤ ده من عدمه هو اللي هيحدد إذا كان الشراء المؤسسي قادر يكمل امتصاص ضغط البيع.
ثالثاً: اتجاه عوائد السندات. طول ما عائد 10 سنين قاعد عند 5%، بيتكوين هيفضل تحت ضغط "تكلفة الفرصة البديلة". اجتماع الفيدرالي في 28 أكتوبر هو المحطة الجاية، والسوق حالياً بيسعّر احتمال 75% لرفع فائدة تاني.
خلاصة في سطر واحد
بيتكوين قدّم في سبتمبر ورقة "مقبولة لكن مش ممتازة": ارتفاع شهري، ثلاثة أشهر متتالية من المكاسب، وعودة تدفقات ETF — دي كلها إشارات إيجابية. لكن صدمة نهاية الشهر من الجيوسياسة وعوائد السندات كشفت حقيقة: الارتداد ده اعتمد بشكل كبير على شراء البائعين المجبر عليه و"قصور" التخصيص المؤسسي، مش على طلب جديد واسع. صمود منطقة 82,000-84,000 دولار هو أول اختبار لتحديد إذا كان ارتداد سبتمبر "انعكاس اتجاه" ولا "ارتداد في سوق دببة".
تنبيه: المقال ده تجميع معلومات سوقية، ومش نصيحة استثمارية. العملات الرقمية عالية التقلب، وقرارك لازم يكون مبني على قدرتك على تحمل المخاطرة.
#GoldFallsTo$4144
#QNTFallsOver40%FromMorningHigh
#BTCFallsBelow$83000
$BTC
{spot}(BTCUSDT)
بيتكوين في سبتمبر: ارتداد تحت اختبار ضغط
الخلاصة في سطر واحد: بيتكوين ارتفع من 75 ألف دولار لأعلى نقطة عند 87,397 دولار خلال سبتمبر، مدفوعاً بتدفقات صناديق ETF وضغط على البائعين، لكن ضغوط نهاية الشهر من الجيوسياسة وعوائد السندات أثبتت إن أساس هذا الارتداد لسه هش.
مسار سبتمبر: نزول، ثم صعود قوي، ثم تراجع
بيتينكوين في سبتمبر كان أشبه بـ"قطار ملاهي"، لكن الخط العام واضح:
بداية الشهر: ضغط. دخل بيتكوين سبتمبر وهو لسه بيمتص صدمة رفع الفائدة من الفيدرالي ورفض مجلس الشيوخ لقانون CLARITY. في 16 سبتمبر، الفيدرالي صوّت بالإجماع على رفع الفائدة إلى 3.75%-4%، وبيتكوين نزل لمستوى 75,000 دولار.
منتصف الشهر: ارتداد عنيف. من 18 سبتمبر، بدأت السيولة تدخل. في 21 سبتمبر، صناديق بيتكوين现货 الأمريكية سجلت تدفقاً صافياً يقترب من مليار دولار في يوم واحد — أكبر دخول يومي من أكتوبر 2025. بيتكوين طلع 7% في يومين، وفي 22 سبتمبر لامس 87,397 دولار، أعلى مستوى من نهاية يناير.
نهاية الشهر: ضربة جديدة. بعدها تصاعدت التوترات الأمريكية-الإيرانية، وبيانات PMI الأمريكية القوية رفعت عوائد السندات، وبيتكوين نزل من 87,000 دولار لمنطقة 83,000-84,000. بحلول 28 سبتمبر، وصل 82,858 دولار.
ورغم التراجع في نهاية الشهر، بيتكوين أنهى سبتمبر بارتفاع شهري حوالي 7.4%، وده الشهر الثالث على التوالي من المكاسب — أول مرة يحصل ده من 2012.
إيه اللي دفع السعر لفوق؟
أولاً: تدفقات ETF هي الدعامة الأساسية. في الأسبوع من 21 لـ 25 سبتمبر، صناديق بيتكوين现货 الأمريكية سجلت تدفقاً صافياً حوالي 23.9 مليار دولار — أقوى تدفق أسبوعي من أكتوبر 2025. صندوق IBIT من بلاك روك لحده حوالي 11.6 مليار دولار. وإجمالاً خلال سبتمبر، التدفقات وصلت حوالي 25.6 مليار دولار، مقابل 35.2 مليار في أغسطس — يعني الطلب المؤسسي بيتحسن في النصف الثاني من السنة.
ثانياً: ضغط البائعين ضخّم الارتفاع. لما بيتكوين اخترق نطاق 82,000-84,000 دولار، كتير من المراكز البيعية اتقفلت بالإجبار. في 21 سبتمبر بس، السوق صفّى حوالي 928 مليون دولار، منها 840 مليون من البائعين. و130,000 متداول اتصفّوا في 24 ساعة. ده بيفسر ليه الارتفاع كان سريع وعنيف بالشكل ده.
ثالثاً: بيانات البلوكتشين بتشير لتراكم. في آخر أسبوع من سبتمبر، حوالي 31,800 بيتكوين خرجت من المنصات، منها أكتر من 13,800 بيتكوين من بينانس في يوم واحد — أكبر خروج يومي من 2023. رصيد المنصات نزل من حوالي 705,000 لـ 685,000 بيتكوين. وده بيتفسر عادة إن المستثمرين بيتجهوا للاحتفاظ طويل الأجل، وده بيقلل ضغط البيع الفوري.
إيه اللي كان بيضغط على بيتكوين؟
عوائد السندات هي "الخصم الأكبر". في 23 سبتمبر، بيانات PMI الأمريكية طلعت أقوى بكتير من المتوقع — المؤشر المركب وصل 58.4، أسرع نمو من يوليو 2021. ده رفع توقعات رفع الفائدة، وعائد سند الخزانة لأجل 10 سنين اخترق 5%، أعلى مستوى من 2007.
وبالنسبة لبيتكوين، اللي مش بيدر عائد، عائد 5% بدون مخاطرة معناه إن تكلفة الفرصة البديلة لحيازته بقت عالية جداً. المؤسسات لما تختار بين سند أمريكي بـ4.95%-5% وبيتكوين عالي التقلب، الميزان بيميل.
الجيوسياسة كانت "البجعة السوداء" في نهاية الشهر. ترامب رفض مقترح إيران بوقف إطلاق النار سبعة أيام، والتوترات الأمريكية-الإيرانية اشتعلت تاني. النفط رجع فوق 93 دولار، وقلق التضخم زاد، والأصول الخطرة اتضغطت بشكل عام.
الأرقام المهمة في نظرة واحدة
المؤشرأداء سبتمبرالارتفاع الشهريحوالي +7.4% (الشهر الثالث على التوالي)أعلى نقطة في الشهر87,397 دولار (أعلى من نهاية يناير)أقل نقطة في الشهرحوالي 75,000 دولارتدفق ETF الأسبوعي (21-25 سبتمبر)حوالي 23.9 مليار دولار (الأقوى من أكتوبر 2025)تصفية البائعين (21 سبتمبر)حوالي 840 مليون دولارعائد سند الخزانة 10 سنيناخترق 5.1% (أعلى من 2007)
إيه اللي نراقبه بعد كده؟
أولاً: هل 84,800 دولار يتحول من مقاومة لدعم؟ المحللين شايفين إن لو بيتكوين ثبت فوق 84,800 دولار، ومع تصعيد جيوسياسي أقل، السوق ممكن يبدأ يجهز لاختبار 90,000 دولار.
ثانياً: استمرارية تدفقات ETF. في آخر أسبوع من سبتمبر، التدفقات نزلت من حوالي مليار دولار يوم الاثنين لـ 191 مليون دولار يوم الخميس — انخفاض 81%. استمرار التباطؤ ده من عدمه هو اللي هيحدد إذا كان الشراء المؤسسي قادر يكمل امتصاص ضغط البيع.
ثالثاً: اتجاه عوائد السندات. طول ما عائد 10 سنين قاعد عند 5%، بيتكوين هيفضل تحت ضغط "تكلفة الفرصة البديلة". اجتماع الفيدرالي في 28 أكتوبر هو المحطة الجاية، والسوق حالياً بيسعّر احتمال 75% لرفع فائدة تاني.
خلاصة في سطر واحد
بيتكوين قدّم في سبتمبر ورقة "مقبولة لكن مش ممتازة": ارتفاع شهري، ثلاثة أشهر متتالية من المكاسب، وعودة تدفقات ETF — دي كلها إشارات إيجابية. لكن صدمة نهاية الشهر من الجيوسياسة وعوائد السندات كشفت حقيقة: الارتداد ده اعتمد بشكل كبير على شراء البائعين المجبر عليه و"قصور" التخصيص المؤسسي، مش على طلب جديد واسع. صمود منطقة 82,000-84,000 دولار هو أول اختبار لتحديد إذا كان ارتداد سبتمبر "انعكاس اتجاه" ولا "ارتداد في سوق دببة".
تنبيه: المقال ده تجميع معلومات سوقية، ومش نصيحة استثمارية. العملات الرقمية عالية التقلب، وقرارك لازم يكون مبني على قدرتك على تحمل المخاطرة.
#GoldFallsTo$4144
#QNTFallsOver40%FromMorningHigh
#BTCFallsBelow$83000
$BTC
مسار سبتمبر: نزول، ثم صعود قوي، ثم تراجع
بيتينكوين في سبتمبر كان أشبه بـ"قطار ملاهي"، لكن الخط العام واضح:
بداية الشهر: ضغط. دخل بيتكوين سبتمبر وهو لسه بيمتص صدمة رفع الفائدة من الفيدرالي ورفض مجلس الشيوخ لقانون CLARITY. في 16 سبتمبر، الفيدرالي صوّت بالإجماع على رفع الفائدة إلى 3.75%-4%، وبيتكوين نزل لمستوى 75,000 دولار.
منتصف الشهر: ارتداد عنيف. من 18 سبتمبر، بدأت السيولة تدخل. في 21 سبتمبر، صناديق بيتكوين现货 الأمريكية سجلت تدفقاً صافياً يقترب من مليار دولار في يوم واحد — أكبر دخول يومي من أكتوبر 2025. بيتكوين طلع 7% في يومين، وفي 22 سبتمبر لامس 87,397 دولار، أعلى مستوى من نهاية يناير.
نهاية الشهر: ضربة جديدة. بعدها تصاعدت التوترات الأمريكية-الإيرانية، وبيانات PMI الأمريكية القوية رفعت عوائد السندات، وبيتكوين نزل من 87,000 دولار لمنطقة 83,000-84,000. بحلول 28 سبتمبر، وصل 82,858 دولار.
ورغم التراجع في نهاية الشهر، بيتكوين أنهى سبتمبر بارتفاع شهري حوالي 7.4%، وده الشهر الثالث على التوالي من المكاسب — أول مرة يحصل ده من 2012.
إيه اللي دفع السعر لفوق؟
أولاً: تدفقات ETF هي الدعامة الأساسية. في الأسبوع من 21 لـ 25 سبتمبر، صناديق بيتكوين现货 الأمريكية سجلت تدفقاً صافياً حوالي 23.9 مليار دولار — أقوى تدفق أسبوعي من أكتوبر 2025. صندوق IBIT من بلاك روك لحده حوالي 11.6 مليار دولار. وإجمالاً خلال سبتمبر، التدفقات وصلت حوالي 25.6 مليار دولار، مقابل 35.2 مليار في أغسطس — يعني الطلب المؤسسي بيتحسن في النصف الثاني من السنة.
ثانياً: ضغط البائعين ضخّم الارتفاع. لما بيتكوين اخترق نطاق 82,000-84,000 دولار، كتير من المراكز البيعية اتقفلت بالإجبار. في 21 سبتمبر بس، السوق صفّى حوالي 928 مليون دولار، منها 840 مليون من البائعين. و130,000 متداول اتصفّوا في 24 ساعة. ده بيفسر ليه الارتفاع كان سريع وعنيف بالشكل ده.
ثالثاً: بيانات البلوكتشين بتشير لتراكم. في آخر أسبوع من سبتمبر، حوالي 31,800 بيتكوين خرجت من المنصات، منها أكتر من 13,800 بيتكوين من بينانس في يوم واحد — أكبر خروج يومي من 2023. رصيد المنصات نزل من حوالي 705,000 لـ 685,000 بيتكوين. وده بيتفسر عادة إن المستثمرين بيتجهوا للاحتفاظ طويل الأجل، وده بيقلل ضغط البيع الفوري.
إيه اللي كان بيضغط على بيتكوين؟
عوائد السندات هي "الخصم الأكبر". في 23 سبتمبر، بيانات PMI الأمريكية طلعت أقوى بكتير من المتوقع — المؤشر المركب وصل 58.4، أسرع نمو من يوليو 2021. ده رفع توقعات رفع الفائدة، وعائد سند الخزانة لأجل 10 سنين اخترق 5%، أعلى مستوى من 2007.
وبالنسبة لبيتكوين، اللي مش بيدر عائد، عائد 5% بدون مخاطرة معناه إن تكلفة الفرصة البديلة لحيازته بقت عالية جداً. المؤسسات لما تختار بين سند أمريكي بـ4.95%-5% وبيتكوين عالي التقلب، الميزان بيميل.
الجيوسياسة كانت "البجعة السوداء" في نهاية الشهر. ترامب رفض مقترح إيران بوقف إطلاق النار سبعة أيام، والتوترات الأمريكية-الإيرانية اشتعلت تاني. النفط رجع فوق 93 دولار، وقلق التضخم زاد، والأصول الخطرة اتضغطت بشكل عام.
الأرقام المهمة في نظرة واحدة
المؤشرأداء سبتمبرالارتفاع الشهريحوالي +7.4% (الشهر الثالث على التوالي)أعلى نقطة في الشهر87,397 دولار (أعلى من نهاية يناير)أقل نقطة في الشهرحوالي 75,000 دولارتدفق ETF الأسبوعي (21-25 سبتمبر)حوالي 23.9 مليار دولار (الأقوى من أكتوبر 2025)تصفية البائعين (21 سبتمبر)حوالي 840 مليون دولارعائد سند الخزانة 10 سنيناخترق 5.1% (أعلى من 2007)
إيه اللي نراقبه بعد كده؟
أولاً: هل 84,800 دولار يتحول من مقاومة لدعم؟ المحللين شايفين إن لو بيتكوين ثبت فوق 84,800 دولار، ومع تصعيد جيوسياسي أقل، السوق ممكن يبدأ يجهز لاختبار 90,000 دولار.
ثانياً: استمرارية تدفقات ETF. في آخر أسبوع من سبتمبر، التدفقات نزلت من حوالي مليار دولار يوم الاثنين لـ 191 مليون دولار يوم الخميس — انخفاض 81%. استمرار التباطؤ ده من عدمه هو اللي هيحدد إذا كان الشراء المؤسسي قادر يكمل امتصاص ضغط البيع.
ثالثاً: اتجاه عوائد السندات. طول ما عائد 10 سنين قاعد عند 5%، بيتكوين هيفضل تحت ضغط "تكلفة الفرصة البديلة". اجتماع الفيدرالي في 28 أكتوبر هو المحطة الجاية، والسوق حالياً بيسعّر احتمال 75% لرفع فائدة تاني.
خلاصة في سطر واحد
بيتكوين قدّم في سبتمبر ورقة "مقبولة لكن مش ممتازة": ارتفاع شهري، ثلاثة أشهر متتالية من المكاسب، وعودة تدفقات ETF — دي كلها إشارات إيجابية. لكن صدمة نهاية الشهر من الجيوسياسة وعوائد السندات كشفت حقيقة: الارتداد ده اعتمد بشكل كبير على شراء البائعين المجبر عليه و"قصور" التخصيص المؤسسي، مش على طلب جديد واسع. صمود منطقة 82,000-84,000 دولار هو أول اختبار لتحديد إذا كان ارتداد سبتمبر "انعكاس اتجاه" ولا "ارتداد في سوق دببة".
تنبيه: المقال ده تجميع معلومات سوقية، ومش نصيحة استثمارية. العملات الرقمية عالية التقلب، وقرارك لازم يكون مبني على قدرتك على تحمل المخاطرة.
#GoldFallsTo$4144
#QNTFallsOver40%FromMorningHigh
#BTCFallsBelow$83000
$BTC
1
109

·
--
Статья
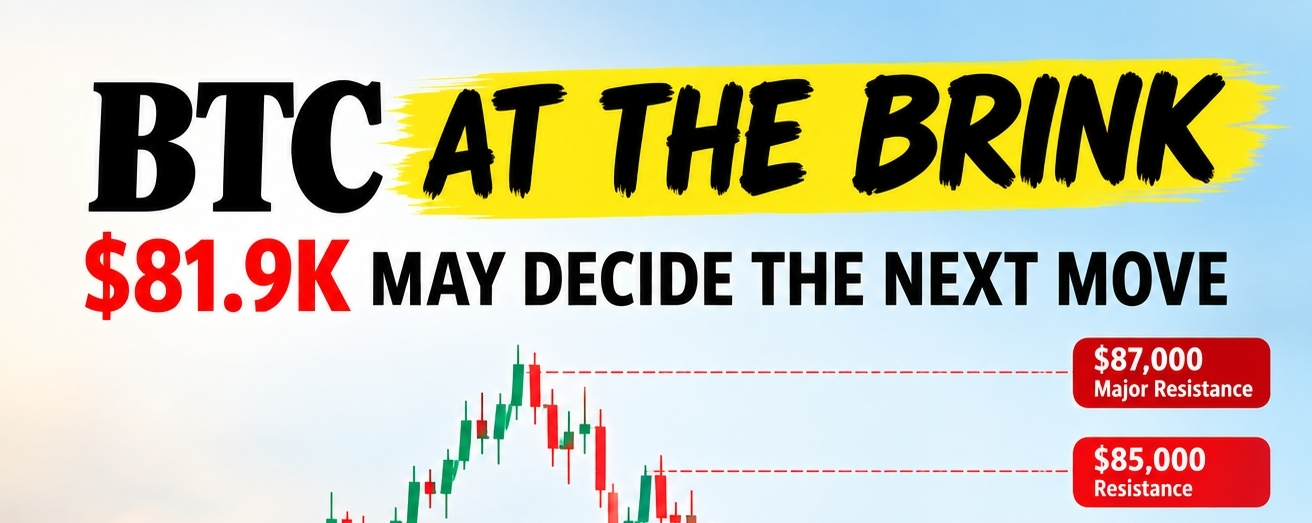
🔥 𝐁𝐓𝐂 𝐀𝐓 𝐓𝐇𝐄 𝐁𝐑𝐈𝐍𝐊 — $𝟖𝟏.𝟗𝐊 𝐌𝐀𝐘 𝐃𝐄𝐂𝐈𝐃𝐄 𝐓𝐇𝐄 𝐍𝐄𝐗𝐓 𝐌𝐎𝐕𝐄🔶 𝐁𝐓𝐂 𝐀𝐏𝐏𝐑𝐎𝐀𝐂𝐇𝐈𝐍𝐆 𝐀 𝐂𝐑𝐈𝐓𝐈𝐂𝐀𝐋 𝐒𝐔𝐏𝐏𝐎𝐑𝐓 𝐙𝐎𝐍𝐄
Bitcoin is now approaching an important technical area where the next reaction could determine the short-term direction of the market.
𝐊𝐄𝐘 𝐁𝐎𝐔𝐍𝐂𝐈𝐍𝐆 𝐙𝐎𝐍𝐄: $81,900
From my current technical structure, the $81,900 region is becoming increasingly important as a potential demand and reaction zone. BTC has already experienced rejection from the $85K–$87K area and is now moving closer to the underlying support structure.
🔶 𝐖𝐇𝐘 $81,900 𝐌𝐀𝐓𝐓𝐄𝐑𝐒
The $81.9K area sits close to the previous breakout/support structure around $81.5K–$82K. Current market analysis also identifies the $81.5K–$82K region as an important level that BTC needs to defend to maintain its broader bullish structure.
If BTC receives a strong reaction from this zone, the first confirmation would be a reclaim of $83K–$84K, followed by another attempt toward $85K and potentially the $87K resistance area.
🔶 𝐌𝐀𝐗𝐈𝐌𝐔𝐌 𝐃𝐎𝐖𝐍𝐒𝐈𝐃𝐄 𝐙𝐎𝐍𝐄: $79,000
For my bullish thesis, $79K is the maximum downside area I am watching.
A move toward $79K would represent a deeper correction, but it would not automatically invalidate the larger bullish scenario. What matters is how BTC behaves around this region and whether buyers aggressively defend the level.
However, a sustained breakdown below the $79K area would significantly weaken this bullish setup and require the entire structure to be reassessed.
🔶 𝐁𝐔𝐋𝐋𝐈𝐒𝐇 𝐒𝐂𝐄𝐍𝐀𝐑𝐈𝐎
$81,900 holds → BTC produces a strong reaction → $83K–$84K reclaimed → $85K retested → $87K becomes the next major resistance.
A clean breakout above $87K with strong volume could shift attention toward higher levels, while failure to reclaim resistance could keep BTC consolidating.
🔶 𝐁𝐄𝐀𝐑𝐈𝐒𝐇 𝐒𝐂𝐄𝐍𝐀𝐑𝐈𝐎
If $81,900 fails decisively and BTC cannot reclaim the breakdown level, downside pressure could increase toward $80K and potentially $79K.
The key distinction is between a temporary liquidity sweep and a confirmed structural breakdown.
𝐌𝐘 𝐊𝐄𝐘 𝐋𝐄𝐕𝐄𝐋𝐒
🔶 $81,900 — Primary bounce zone
🔶 $80,000 — Psychological support
🔶 $79,000 — Maximum downside zone for current bullish thesis
🔶 $83K–$84K — Short-term recovery/reclaim area
🔶 $85K — Major resistance
🔶 $87K — Breakout confirmation area
BTC is currently at a decision point. I would focus less on predicting the exact bottom and more on watching the reaction around $81,900.
𝐍𝐎 𝐅𝐎𝐌𝐎. 𝐖𝐀𝐈𝐓 𝐅𝐎𝐑 𝐂𝐎𝐍𝐅𝐈𝐑𝐌𝐀𝐓𝐈𝐎𝐍.
#BTCFallsBelow$83000 $BTC
{future}(BTCUSDT)
🔥 𝐁𝐓𝐂 𝐀𝐓 𝐓𝐇𝐄 𝐁𝐑𝐈𝐍𝐊 — $𝟖𝟏.𝟗𝐊 𝐌𝐀𝐘 𝐃𝐄𝐂𝐈𝐃𝐄 𝐓𝐇𝐄 𝐍𝐄𝐗𝐓 𝐌𝐎𝐕𝐄
🔶 𝐁𝐓𝐂 𝐀𝐏𝐏𝐑𝐎𝐀𝐂𝐇𝐈𝐍𝐆 𝐀 𝐂𝐑𝐈𝐓𝐈𝐂𝐀𝐋 𝐒𝐔𝐏𝐏𝐎𝐑𝐓 𝐙𝐎𝐍𝐄
Bitcoin is now approaching an important technical area where the next reaction could determine the short-term direction of the market.
𝐊𝐄𝐘 𝐁𝐎𝐔𝐍𝐂𝐈𝐍𝐆 𝐙𝐎𝐍𝐄: $81,900
From my current technical structure, the $81,900 region is becoming increasingly important as a potential demand and reaction zone. BTC has already experienced rejection from the $85K–$87K area and is now moving closer to the underlying support structure.
🔶 𝐖𝐇𝐘 $81,900 𝐌𝐀𝐓𝐓𝐄𝐑𝐒
The $81.9K area sits close to the previous breakout/support structure around $81.5K–$82K. Current market analysis also identifies the $81.5K–$82K region as an important level that BTC needs to defend to maintain its broader bullish structure.
If BTC receives a strong reaction from this zone, the first confirmation would be a reclaim of $83K–$84K, followed by another attempt toward $85K and potentially the $87K resistance area.
🔶 𝐌𝐀𝐗𝐈𝐌𝐔𝐌 𝐃𝐎𝐖𝐍𝐒𝐈𝐃𝐄 𝐙𝐎𝐍𝐄: $79,000
For my bullish thesis, $79K is the maximum downside area I am watching.
A move toward $79K would represent a deeper correction, but it would not automatically invalidate the larger bullish scenario. What matters is how BTC behaves around this region and whether buyers aggressively defend the level.
However, a sustained breakdown below the $79K area would significantly weaken this bullish setup and require the entire structure to be reassessed.
🔶 𝐁𝐔𝐋𝐋𝐈𝐒𝐇 𝐒𝐂𝐄𝐍𝐀𝐑𝐈𝐎
$81,900 holds → BTC produces a strong reaction → $83K–$84K reclaimed → $85K retested → $87K becomes the next major resistance.
A clean breakout above $87K with strong volume could shift attention toward higher levels, while failure to reclaim resistance could keep BTC consolidating.
🔶 𝐁𝐄𝐀𝐑𝐈𝐒𝐇 𝐒𝐂𝐄𝐍𝐀𝐑𝐈𝐎
If $81,900 fails decisively and BTC cannot reclaim the breakdown level, downside pressure could increase toward $80K and potentially $79K.
The key distinction is between a temporary liquidity sweep and a confirmed structural breakdown.
𝐌𝐘 𝐊𝐄𝐘 𝐋𝐄𝐕𝐄𝐋𝐒
🔶 $81,900 — Primary bounce zone
🔶 $80,000 — Psychological support
🔶 $79,000 — Maximum downside zone for current bullish thesis
🔶 $83K–$84K — Short-term recovery/reclaim area
🔶 $85K — Major resistance
🔶 $87K — Breakout confirmation area
BTC is currently at a decision point. I would focus less on predicting the exact bottom and more on watching the reaction around $81,900.
𝐍𝐎 𝐅𝐎𝐌𝐎. 𝐖𝐀𝐈𝐓 𝐅𝐎𝐑 𝐂𝐎𝐍𝐅𝐈𝐑𝐌𝐀𝐓𝐈𝐎𝐍.
#BTCFallsBelow$83000 $BTC
Bitcoin is now approaching an important technical area where the next reaction could determine the short-term direction of the market.
𝐊𝐄𝐘 𝐁𝐎𝐔𝐍𝐂𝐈𝐍𝐆 𝐙𝐎𝐍𝐄: $81,900
From my current technical structure, the $81,900 region is becoming increasingly important as a potential demand and reaction zone. BTC has already experienced rejection from the $85K–$87K area and is now moving closer to the underlying support structure.
🔶 𝐖𝐇𝐘 $81,900 𝐌𝐀𝐓𝐓𝐄𝐑𝐒
The $81.9K area sits close to the previous breakout/support structure around $81.5K–$82K. Current market analysis also identifies the $81.5K–$82K region as an important level that BTC needs to defend to maintain its broader bullish structure.
If BTC receives a strong reaction from this zone, the first confirmation would be a reclaim of $83K–$84K, followed by another attempt toward $85K and potentially the $87K resistance area.
🔶 𝐌𝐀𝐗𝐈𝐌𝐔𝐌 𝐃𝐎𝐖𝐍𝐒𝐈𝐃𝐄 𝐙𝐎𝐍𝐄: $79,000
For my bullish thesis, $79K is the maximum downside area I am watching.
A move toward $79K would represent a deeper correction, but it would not automatically invalidate the larger bullish scenario. What matters is how BTC behaves around this region and whether buyers aggressively defend the level.
However, a sustained breakdown below the $79K area would significantly weaken this bullish setup and require the entire structure to be reassessed.
🔶 𝐁𝐔𝐋𝐋𝐈𝐒𝐇 𝐒𝐂𝐄𝐍𝐀𝐑𝐈𝐎
$81,900 holds → BTC produces a strong reaction → $83K–$84K reclaimed → $85K retested → $87K becomes the next major resistance.
A clean breakout above $87K with strong volume could shift attention toward higher levels, while failure to reclaim resistance could keep BTC consolidating.
🔶 𝐁𝐄𝐀𝐑𝐈𝐒𝐇 𝐒𝐂𝐄𝐍𝐀𝐑𝐈𝐎
If $81,900 fails decisively and BTC cannot reclaim the breakdown level, downside pressure could increase toward $80K and potentially $79K.
The key distinction is between a temporary liquidity sweep and a confirmed structural breakdown.
𝐌𝐘 𝐊𝐄𝐘 𝐋𝐄𝐕𝐄𝐋𝐒
🔶 $81,900 — Primary bounce zone
🔶 $80,000 — Psychological support
🔶 $79,000 — Maximum downside zone for current bullish thesis
🔶 $83K–$84K — Short-term recovery/reclaim area
🔶 $85K — Major resistance
🔶 $87K — Breakout confirmation area
BTC is currently at a decision point. I would focus less on predicting the exact bottom and more on watching the reaction around $81,900.
𝐍𝐎 𝐅𝐎𝐌𝐎. 𝐖𝐀𝐈𝐓 𝐅𝐎𝐑 𝐂𝐎𝐍𝐅𝐈𝐑𝐌𝐀𝐓𝐈𝐎𝐍.
#BTCFallsBelow$83000 $BTC
176

·
--
$BTC just slipped under $83k.
Currently sitting around $83.0k–$83.2k after dipping as low as the high $82.7ks earlier. Down about 1.5–1.9% on the day so far.
We had that strong push toward $87k last week, then a slow grind lower. Today it finally lost the $83k level a lot of people were watching. Volume picked up a bit on the sell side, but it doesn’t feel like full panic yet.
This is a key area now. How it reacts from here will probably decide the short-term direction.
Anyone buying this dip or waiting for a clearer bounce first? #BTCFallsBelow$83000
{future}(BTCUSDT)
$BTC just slipped under $83k.
Currently sitting around $83.0k–$83.2k after dipping as low as the high $82.7ks earlier. Down about 1.5–1.9% on the day so far.
We had that strong push toward $87k last week, then a slow grind lower. Today it finally lost the $83k level a lot of people were watching. Volume picked up a bit on the sell side, but it doesn’t feel like full panic yet.
This is a key area now. How it reacts from here will probably decide the short-term direction.
Anyone buying this dip or waiting for a clearer bounce first? #BTCFallsBelow$83000
Currently sitting around $83.0k–$83.2k after dipping as low as the high $82.7ks earlier. Down about 1.5–1.9% on the day so far.
We had that strong push toward $87k last week, then a slow grind lower. Today it finally lost the $83k level a lot of people were watching. Volume picked up a bit on the sell side, but it doesn’t feel like full panic yet.
This is a key area now. How it reacts from here will probably decide the short-term direction.
Anyone buying this dip or waiting for a clearer bounce first? #BTCFallsBelow$83000
1
113

·
--

Статья
Bitcoin Trims Losses as Oil Prices EaseBitcoin came under pressure today, with the price falling below the $84,000 level before making a small recovery. The market remains cautious as investors watch developments between the U.S. and Iran.
One positive factor is the drop in oil prices. Lower oil prices can reduce concerns about higher inflation and may support riskier assets like cryptocurrencies.
$BTC is currently trading around $83,378, while $ETH is around $2,685. Both are also showing declines.
For now, traders are closely watching oil prices, geopolitical news and Bitcoin’s ability to stay above key support levels.
Do you think Bitcoin can recover soon, or could we see another drop? Let me know in the comments.#GoldFallsTo$4144 #QNTFallsOver40%FromMorningHigh #KospiFalls2.7%SamsungSKHynixDropOver5% #BitgetCEOConfirms$388MStolenInHack #BTCFallsBelow$83000
{spot}(BTCUSDT)
{spot}(ETHUSDT)
Bitcoin Trims Losses as Oil Prices Ease
Bitcoin came under pressure today, with the price falling below the $84,000 level before making a small recovery. The market remains cautious as investors watch developments between the U.S. and Iran.
One positive factor is the drop in oil prices. Lower oil prices can reduce concerns about higher inflation and may support riskier assets like cryptocurrencies.
$BTC is currently trading around $83,378, while $ETH is around $2,685. Both are also showing declines.
For now, traders are closely watching oil prices, geopolitical news and Bitcoin’s ability to stay above key support levels.
Do you think Bitcoin can recover soon, or could we see another drop? Let me know in the comments.#GoldFallsTo$4144 #QNTFallsOver40%FromMorningHigh #KospiFalls2.7%SamsungSKHynixDropOver5% #BitgetCEOConfirms$388MStolenInHack #BTCFallsBelow$83000
One positive factor is the drop in oil prices. Lower oil prices can reduce concerns about higher inflation and may support riskier assets like cryptocurrencies.
$BTC is currently trading around $83,378, while $ETH is around $2,685. Both are also showing declines.
For now, traders are closely watching oil prices, geopolitical news and Bitcoin’s ability to stay above key support levels.
Do you think Bitcoin can recover soon, or could we see another drop? Let me know in the comments.#GoldFallsTo$4144 #QNTFallsOver40%FromMorningHigh #KospiFalls2.7%SamsungSKHynixDropOver5% #BitgetCEOConfirms$388MStolenInHack #BTCFallsBelow$83000
57

·
--
Рост
#BTCFallsBelow$83000
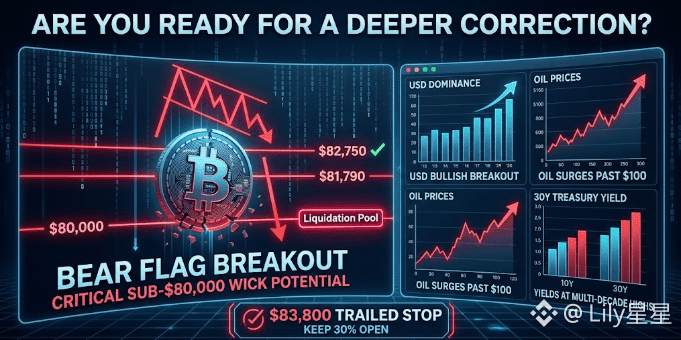
🚨 ARE YOU READY FOR A DEEPER CORRECTION IN $BTC? 📉
Will Bitcoin drop below $80,000? Yes, it will.
I don’t expect the $82,750 level to hold much longer. My primary focus is on the massive liquidation pool around $80,100, with a high probability of a quick liquidity sweep/wick below $80,000 during the upcoming TradFi equity session.
While I’ve previously shared liquidity target maps for $SOL and $ETH, my focus remains strictly on active positions—which is why$HYPE short is running exactly as planned! 🎯
🤔 What is Driving This Downward Move?
Technical Setup: The daily/4H bear flag structure still needs to complete its measured move.
Weekly Low Formation: As anticipated, the low of the week is setting up within the first 48 hours.
Macro Fundamentals & USD Strength:
USDT/USD Dominance achieved a bullish breakout from its 1-hour lower-timeframe weekend consolidation range.
Macro Drag: Crude oil continues to rally higher, while 10-Year and 30-Year U.S. Treasury yields remain elevated at multi-decade highs, severely dampening risk-asset appetite.
📊 Trade Execution & Key Targets
We are riding this short setup down to the remaining targets:
$BTC
{future}(BTCUSDT)
✅ Target 1: $82,750 (Hit)
🎯 Target 2: $81,790
🎯 Target 3: $80,000 (Primary Liquidity Zone)
💡 Trade Management Strategy
Confirmation: A 4-hour candle close below $82,750 will confirm accelerated weakness toward sub-$80k levels.
Stop-Loss: Trailed safely down to $83,800 to lock in profits.
Take-Profit Plan: Take partial profits at Target 2 and Target 3, but keep at least 30% of your position open to capture any extended flush below $80,000.
I will issue a live update if we need to close or adjust the position. Ride the trend and manage your risk! 📉🔥
#BitcoinSpotETFs$2.39BWeeklyNetInflow #bitcoin #CryptoAnalysis #TradingSignals
#BTCFallsBelow$83000
🚨 ARE YOU READY FOR A DEEPER CORRECTION IN $BTC ? 📉
Will Bitcoin drop below $80,000? Yes, it will.
I don’t expect the $82,750 level to hold much longer. My primary focus is on the massive liquidation pool around $80,100, with a high probability of a quick liquidity sweep/wick below $80,000 during the upcoming TradFi equity session.
While I’ve previously shared liquidity target maps for $SOL and $ETH, my focus remains strictly on active positions—which is why$HYPE short is running exactly as planned! 🎯
🤔 What is Driving This Downward Move?
Technical Setup: The daily/4H bear flag structure still needs to complete its measured move.
Weekly Low Formation: As anticipated, the low of the week is setting up within the first 48 hours.
Macro Fundamentals & USD Strength:
USDT/USD Dominance achieved a bullish breakout from its 1-hour lower-timeframe weekend consolidation range.
Macro Drag: Crude oil continues to rally higher, while 10-Year and 30-Year U.S. Treasury yields remain elevated at multi-decade highs, severely dampening risk-asset appetite.
📊 Trade Execution & Key Targets
We are riding this short setup down to the remaining targets:
$BTC
✅ Target 1: $82,750 (Hit)
🎯 Target 2: $81,790
🎯 Target 3: $80,000 (Primary Liquidity Zone)
💡 Trade Management Strategy
Confirmation: A 4-hour candle close below $82,750 will confirm accelerated weakness toward sub-$80k levels.
Stop-Loss: Trailed safely down to $83,800 to lock in profits.
Take-Profit Plan: Take partial profits at Target 2 and Target 3, but keep at least 30% of your position open to capture any extended flush below $80,000.
I will issue a live update if we need to close or adjust the position. Ride the trend and manage your risk! 📉🔥
#BitcoinSpotETFs$2.39BWeeklyNetInflow #bitcoin #CryptoAnalysis #TradingSignals
🚨 ARE YOU READY FOR A DEEPER CORRECTION IN $BTC ? 📉
Will Bitcoin drop below $80,000? Yes, it will.
I don’t expect the $82,750 level to hold much longer. My primary focus is on the massive liquidation pool around $80,100, with a high probability of a quick liquidity sweep/wick below $80,000 during the upcoming TradFi equity session.
While I’ve previously shared liquidity target maps for $SOL and $ETH, my focus remains strictly on active positions—which is why$HYPE short is running exactly as planned! 🎯
🤔 What is Driving This Downward Move?
Technical Setup: The daily/4H bear flag structure still needs to complete its measured move.
Weekly Low Formation: As anticipated, the low of the week is setting up within the first 48 hours.
Macro Fundamentals & USD Strength:
USDT/USD Dominance achieved a bullish breakout from its 1-hour lower-timeframe weekend consolidation range.
Macro Drag: Crude oil continues to rally higher, while 10-Year and 30-Year U.S. Treasury yields remain elevated at multi-decade highs, severely dampening risk-asset appetite.
📊 Trade Execution & Key Targets
We are riding this short setup down to the remaining targets:
$BTC
✅ Target 1: $82,750 (Hit)
🎯 Target 2: $81,790
🎯 Target 3: $80,000 (Primary Liquidity Zone)
💡 Trade Management Strategy
Confirmation: A 4-hour candle close below $82,750 will confirm accelerated weakness toward sub-$80k levels.
Stop-Loss: Trailed safely down to $83,800 to lock in profits.
Take-Profit Plan: Take partial profits at Target 2 and Target 3, but keep at least 30% of your position open to capture any extended flush below $80,000.
I will issue a live update if we need to close or adjust the position. Ride the trend and manage your risk! 📉🔥
#BitcoinSpotETFs$2.39BWeeklyNetInflow #bitcoin #CryptoAnalysis #TradingSignals
1
45

·
--
$BTC just flipped under $83K… and the same week institutions dropped $2.39 BILLION into
Bitcoin Spot ETFs 🔥
While the timeline is full of #BTCFallsBelow$83000 panic, smart money is stacking harder than ever.
This exact combo (fear + massive ETF inflows) has printed the best entries of the year every single time.
Gold is also bleeding hard (#GoldFallsThirdDayAfterUSIranStrikes ) while BTC is still holding the bigger structure.
Are we about to see the classic “retail sells the dip, institutions buy the dip” move again?
I’m watching $82.5K–$83K like a hawk.
What’s your move right now?
$BTC $ETH
#BTCFallsBelow200WeekMA #BitcoinSpotETFs$2.39BWeeklyNetInflow #GoldFallsTo$4144
{future}(BTCUSDT)
{future}(ETHUSDT)
$BTC just flipped under $83K… and the same week institutions dropped $2.39 BILLION into
Bitcoin Spot ETFs 🔥
While the timeline is full of #BTCFallsBelow$83000 panic, smart money is stacking harder than ever.
This exact combo (fear + massive ETF inflows) has printed the best entries of the year every single time.
Gold is also bleeding hard (#GoldFallsThirdDayAfterUSIranStrikes ) while BTC is still holding the bigger structure.
Are we about to see the classic “retail sells the dip, institutions buy the dip” move again?
I’m watching $82.5K–$83K like a hawk.
What’s your move right now?
$BTC $ETH
#BTCFallsBelow200WeekMA #BitcoinSpotETFs$2.39BWeeklyNetInflow #GoldFallsTo$4144
Bitcoin Spot ETFs 🔥
While the timeline is full of #BTCFallsBelow$83000 panic, smart money is stacking harder than ever.
This exact combo (fear + massive ETF inflows) has printed the best entries of the year every single time.
Gold is also bleeding hard (#GoldFallsThirdDayAfterUSIranStrikes ) while BTC is still holding the bigger structure.
Are we about to see the classic “retail sells the dip, institutions buy the dip” move again?
I’m watching $82.5K–$83K like a hawk.
What’s your move right now?
$BTC $ETH
#BTCFallsBelow200WeekMA #BitcoinSpotETFs$2.39BWeeklyNetInflow #GoldFallsTo$4144
A) Buying this dip
B) Waiting for lower
C) Already loaded
1 дн. осталось
196

·
--
Падение
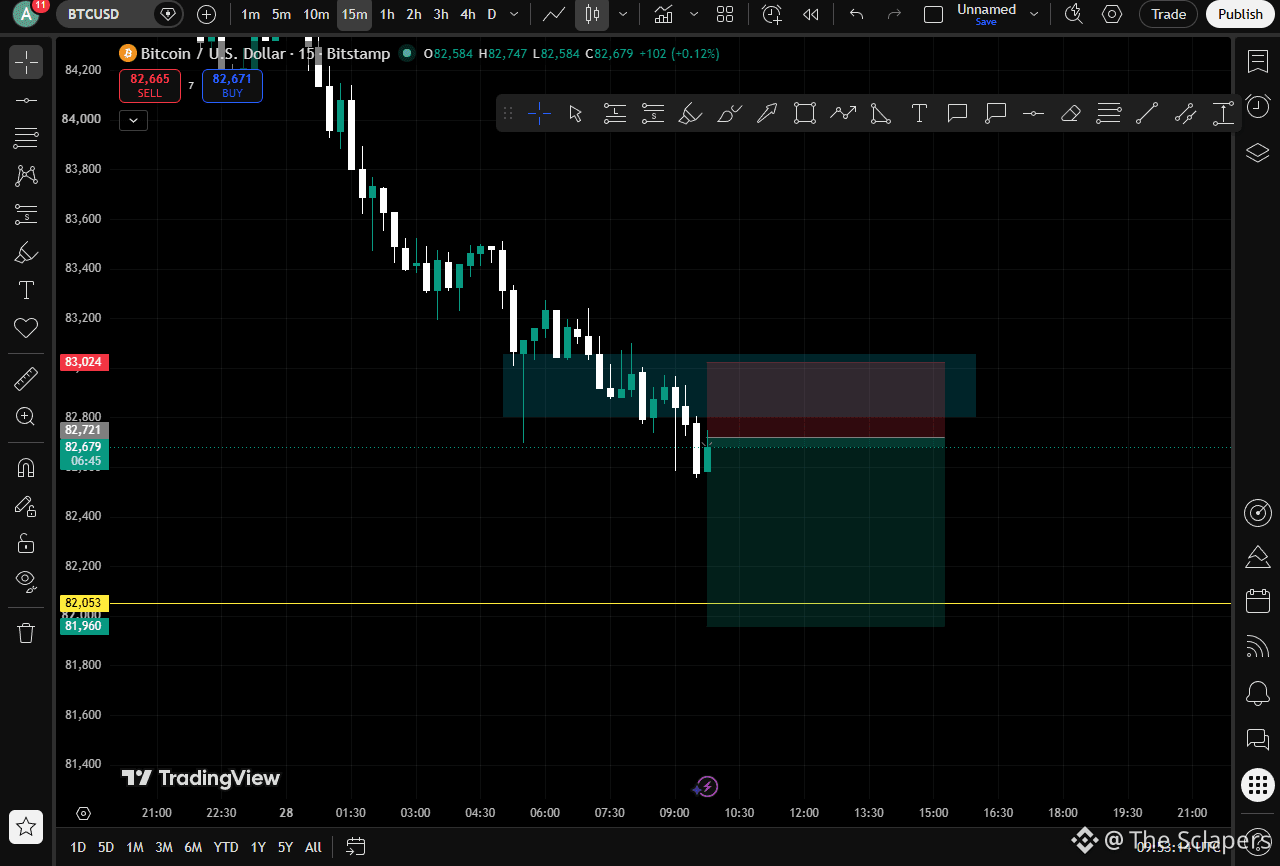
🔴 BTC/USD — SHORT SIGNAL
Timeframe: 15M
Entry: 82,679
Stop Loss (SL): 83,024
Take Profit (TP): 81,963
Risk/Reward: ~1:1.8
📉 Setup: BTC is showing a continued bearish structure with lower highs and lower lows. The setup looks for a continuation toward the 82,053 support zone.
⚠️ Wait for proper 15M candle confirmation before entering.
Trade at your own risk.
Not financial advice — DYOR.
$BTC
#BTCFallsBelow$83000
{spot}(BTCUSDT)
🔴 BTC/USD — SHORT SIGNAL
Timeframe: 15M
Entry: 82,679
Stop Loss (SL): 83,024
Take Profit (TP): 81,963
Risk/Reward: ~1:1.8
📉 Setup: BTC is showing a continued bearish structure with lower highs and lower lows. The setup looks for a continuation toward the 82,053 support zone.
⚠️ Wait for proper 15M candle confirmation before entering.
Trade at your own risk.
Not financial advice — DYOR.
$BTC
#BTCFallsBelow$83000
Timeframe: 15M
Entry: 82,679
Stop Loss (SL): 83,024
Take Profit (TP): 81,963
Risk/Reward: ~1:1.8
📉 Setup: BTC is showing a continued bearish structure with lower highs and lower lows. The setup looks for a continuation toward the 82,053 support zone.
⚠️ Wait for proper 15M candle confirmation before entering.
Trade at your own risk.
Not financial advice — DYOR.
$BTC
#BTCFallsBelow$83000
1
118

$BTC #BTCFallsBelow$83000
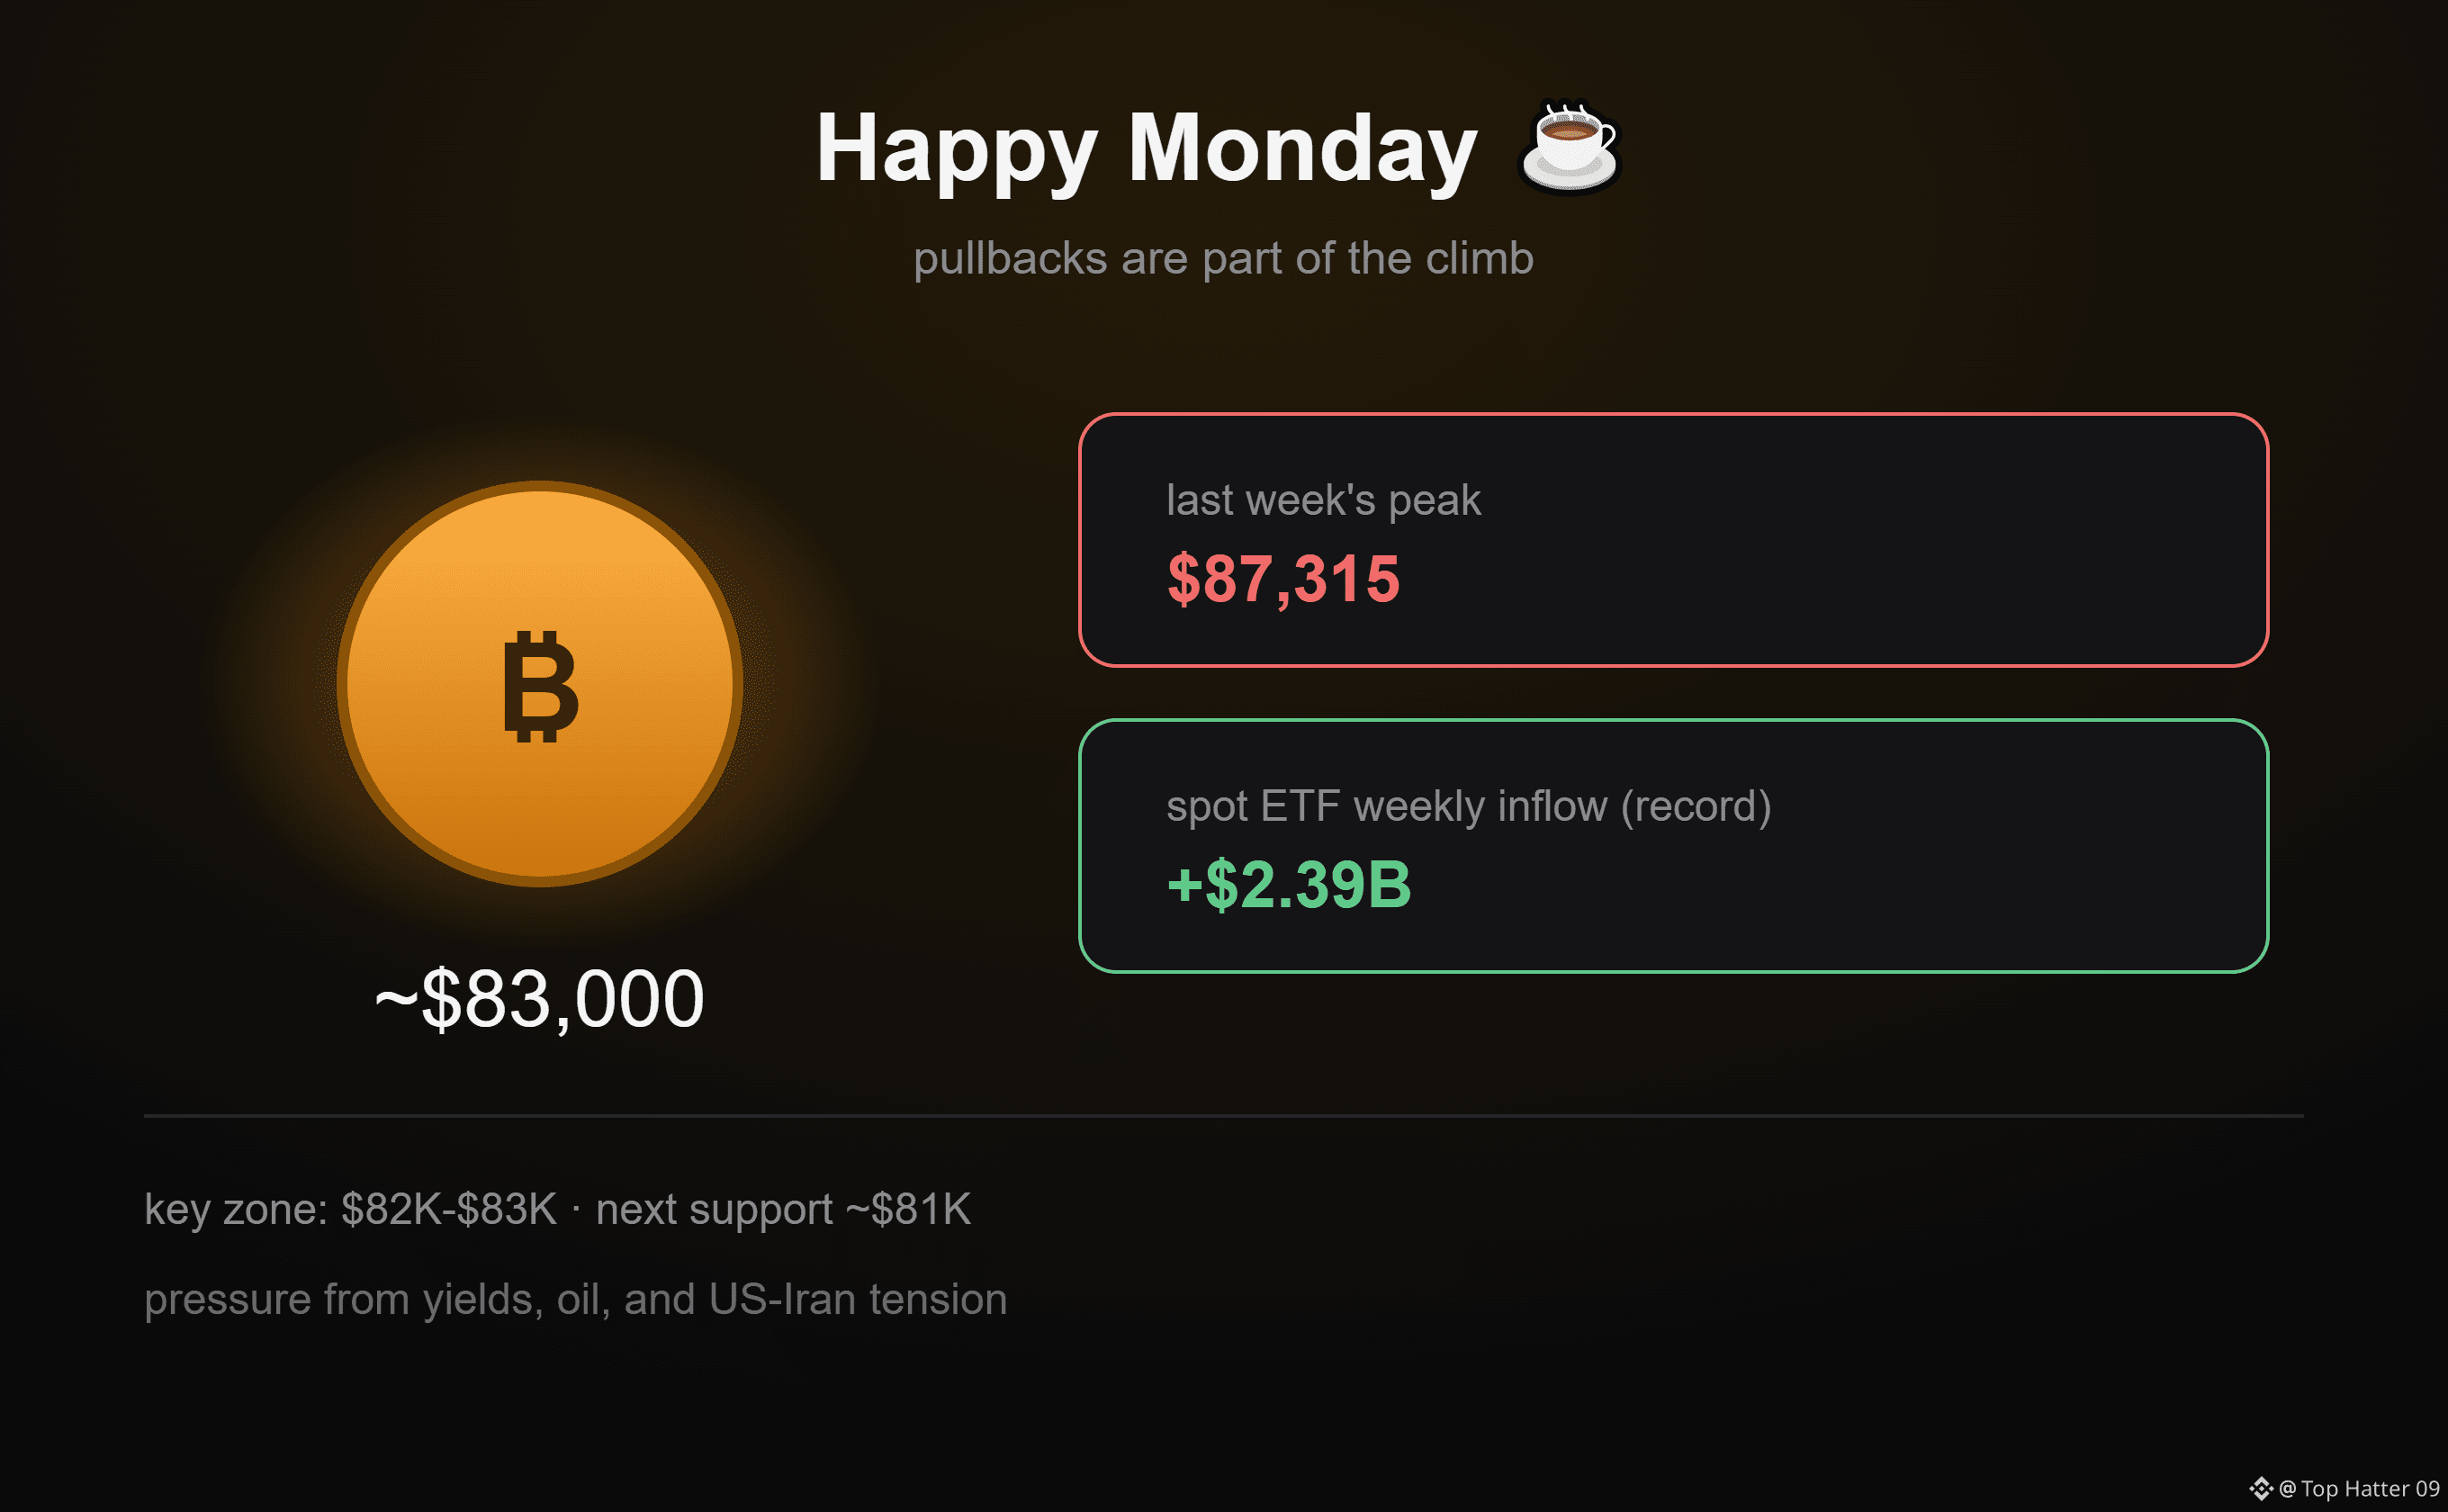
Bitcoin is starting the week a bit soft. It's sitting around $83,000, down from last week's peak of $87,315. What makes it interesting is that US spot Bitcoin ETFs just had a record week with $2.39 billion in inflows. So big money kept buying and the price still slipped. Looks like higher Treasury yields, pricey oil, and the US-Iran situation are weighing on risk assets more than the ETF demand can offset right now.
On the chart, the $82,000 to $83,000 zone is what matters today. A close below it points toward $81,000 next. If buyers step in, getting back above $84,000 would be the first sign of strength.
Here's the Monday thought: a pullback isn't the end of the story. BTC went from $80,000 to $87,000 in September and it's just catching its breath. The ones who stay patient are usually the ones still standing.
Have a good week.
$BTC #Bitcoin #HappyMonday
{future}(BTCUSDT)
$BTC #BTCFallsBelow$83000
Bitcoin is starting the week a bit soft. It's sitting around $83,000, down from last week's peak of $87,315. What makes it interesting is that US spot Bitcoin ETFs just had a record week with $2.39 billion in inflows. So big money kept buying and the price still slipped. Looks like higher Treasury yields, pricey oil, and the US-Iran situation are weighing on risk assets more than the ETF demand can offset right now.
On the chart, the $82,000 to $83,000 zone is what matters today. A close below it points toward $81,000 next. If buyers step in, getting back above $84,000 would be the first sign of strength.
Here's the Monday thought: a pullback isn't the end of the story. BTC went from $80,000 to $87,000 in September and it's just catching its breath. The ones who stay patient are usually the ones still standing.
Have a good week.
$BTC #Bitcoin #HappyMonday
Bitcoin is starting the week a bit soft. It's sitting around $83,000, down from last week's peak of $87,315. What makes it interesting is that US spot Bitcoin ETFs just had a record week with $2.39 billion in inflows. So big money kept buying and the price still slipped. Looks like higher Treasury yields, pricey oil, and the US-Iran situation are weighing on risk assets more than the ETF demand can offset right now.
On the chart, the $82,000 to $83,000 zone is what matters today. A close below it points toward $81,000 next. If buyers step in, getting back above $84,000 would be the first sign of strength.
Here's the Monday thought: a pullback isn't the end of the story. BTC went from $80,000 to $87,000 in September and it's just catching its breath. The ones who stay patient are usually the ones still standing.
Have a good week.
$BTC #Bitcoin #HappyMonday
84

#BTCFallsBelow$83000 #BitcoinSpotETFs$2.39BWeeklyNetInflow #fomcвідстеження #bitcoin
#BTC Торгувати тут👇
$BTC Бычий сценарий: Если цене удастся закрепиться выше уровня поддержки $83 000, высока вероятность восходящего движения к отметкам $85 000 – $86 000 с последующей проверкой психологического барьера в $90 000 – $95 000. Медвежий сценарий: Пробой зоны поддержки вниз может спровоцировать техническую коррекцию к уровням $78 000 – $80 000, а при усилении давления продавцов — вплоть до $75 000 Долгосрочный прогноз и потенциал роста
Консенсус-прогнозы крупнейших криптовалютных платформ и аналитических агентств на долгосрочный период сильно различаются в зависимости от закладываемых математических моделей: 2029–2035 гг. Глобальный пик от $BTC $600 000 до $3 000 000 – $5 000 000 Зависит от темпов инфляции и принятия BTC институционалами Торгувати тут👇$BTC
{future}(BTCUSDT)
{spot}(BTCUSDT)
#BTCFallsBelow$83000 #BitcoinSpotETFs$2.39BWeeklyNetInflow #fomcвідстеження #bitcoin
#BTC Торгувати тут👇
$BTC Бычий сценарий: Если цене удастся закрепиться выше уровня поддержки $83 000, высока вероятность восходящего движения к отметкам $85 000 – $86 000 с последующей проверкой психологического барьера в $90 000 – $95 000. Медвежий сценарий: Пробой зоны поддержки вниз может спровоцировать техническую коррекцию к уровням $78 000 – $80 000, а при усилении давления продавцов — вплоть до $75 000 Долгосрочный прогноз и потенциал роста
Консенсус-прогнозы крупнейших криптовалютных платформ и аналитических агентств на долгосрочный период сильно различаются в зависимости от закладываемых математических моделей: 2029–2035 гг. Глобальный пик от $BTC $600 000 до $3 000 000 – $5 000 000 Зависит от темпов инфляции и принятия BTC институционалами Торгувати тут👇$BTC
#BTC Торгувати тут👇
$BTC Бычий сценарий: Если цене удастся закрепиться выше уровня поддержки $83 000, высока вероятность восходящего движения к отметкам $85 000 – $86 000 с последующей проверкой психологического барьера в $90 000 – $95 000. Медвежий сценарий: Пробой зоны поддержки вниз может спровоцировать техническую коррекцию к уровням $78 000 – $80 000, а при усилении давления продавцов — вплоть до $75 000 Долгосрочный прогноз и потенциал роста
Консенсус-прогнозы крупнейших криптовалютных платформ и аналитических агентств на долгосрочный период сильно различаются в зависимости от закладываемых математических моделей: 2029–2035 гг. Глобальный пик от $BTC $600 000 до $3 000 000 – $5 000 000 Зависит от темпов инфляции и принятия BTC институционалами Торгувати тут👇$BTC


1
110

·
--
Bitcoin Falls Below $83,000 as Selling Pressure Builds
Bitcoin has slipped below the $83,000 level, putting short-term market sentiment under pressure. Traders are watching whether $BTC can reclaim the key level or see further downside.
Can Bitcoin recover above $83K, or is more downside ahead? Share your outlook below!
Explore - www.coingabbar.com
#BTCFallsBelow$83000 #BTC #Bitcoin #Crypto #BTCPrice @bitcoin
Bitcoin Falls Below $83,000 as Selling Pressure Builds
Bitcoin has slipped below the $83,000 level, putting short-term market sentiment under pressure. Traders are watching whether $BTC can reclaim the key level or see further downside.
Can Bitcoin recover above $83K, or is more downside ahead? Share your outlook below!
Explore - www.coingabbar.com
#BTCFallsBelow$83000 #BTC #Bitcoin #Crypto #BTCPrice @Bitcoin
Bitcoin has slipped below the $83,000 level, putting short-term market sentiment under pressure. Traders are watching whether $BTC can reclaim the key level or see further downside.
Can Bitcoin recover above $83K, or is more downside ahead? Share your outlook below!
Explore - www.coingabbar.com
#BTCFallsBelow$83000 #BTC #Bitcoin #Crypto #BTCPrice @Bitcoin

106

·
--
#BTCFallsBelow$83000 🚨 BTC DROPS BELOW $83K. WATCH THESE KEY LEVELS
Bitcoin has fallen below $83,000 hitting $82,705 as selling pressure spreads across both crypto and traditional markets.
Now the most important levels to watch are:
• $80K to $81.5K: This is a support zone. If Bitcoin holds here it might stabilize.
• Below $80K: The next big drop could lead to $75K, which may act as a bottom if the selloff continues.
• $84.8K: This is a resistance level. Reclaiming it would be a sign of recovery.
• $86K: If buying interest returns this could be the upside target.
Leverage is playing a role in the move. A total of $6.54 million, in BTC positions were liquidated near $83,095 adding more downward pressure.
For traders keep an eye on support, trading volume, funding rates and liquidation data before making moves. These factors often show where the market is heading next.
Can Bitcoin hold above $80K?. Will another wave of liquidations push it lower? Share your thoughts and the levels you’re watching.#Bitcoin #BTC #crypto #Khan62 #altcoins $BTC $ETH $BNB
{future}(ETHUSDT)
{future}(BTCUSDT)
{future}(BNBUSDT)
#BTCFallsBelow$83000 🚨 BTC DROPS BELOW $83K. WATCH THESE KEY LEVELS
Bitcoin has fallen below $83,000 hitting $82,705 as selling pressure spreads across both crypto and traditional markets.
Now the most important levels to watch are:
• $80K to $81.5K: This is a support zone. If Bitcoin holds here it might stabilize.
• Below $80K: The next big drop could lead to $75K, which may act as a bottom if the selloff continues.
• $84.8K: This is a resistance level. Reclaiming it would be a sign of recovery.
• $86K: If buying interest returns this could be the upside target.
Leverage is playing a role in the move. A total of $6.54 million, in BTC positions were liquidated near $83,095 adding more downward pressure.
For traders keep an eye on support, trading volume, funding rates and liquidation data before making moves. These factors often show where the market is heading next.
Can Bitcoin hold above $80K?. Will another wave of liquidations push it lower? Share your thoughts and the levels you’re watching.#Bitcoin #BTC #crypto #Khan62 #altcoins $BTC $ETH $BNB
Bitcoin has fallen below $83,000 hitting $82,705 as selling pressure spreads across both crypto and traditional markets.
Now the most important levels to watch are:
• $80K to $81.5K: This is a support zone. If Bitcoin holds here it might stabilize.
• Below $80K: The next big drop could lead to $75K, which may act as a bottom if the selloff continues.
• $84.8K: This is a resistance level. Reclaiming it would be a sign of recovery.
• $86K: If buying interest returns this could be the upside target.
Leverage is playing a role in the move. A total of $6.54 million, in BTC positions were liquidated near $83,095 adding more downward pressure.
For traders keep an eye on support, trading volume, funding rates and liquidation data before making moves. These factors often show where the market is heading next.
Can Bitcoin hold above $80K?. Will another wave of liquidations push it lower? Share your thoughts and the levels you’re watching.#Bitcoin #BTC #crypto #Khan62 #altcoins $BTC $ETH $BNB
25

·
--
Статья
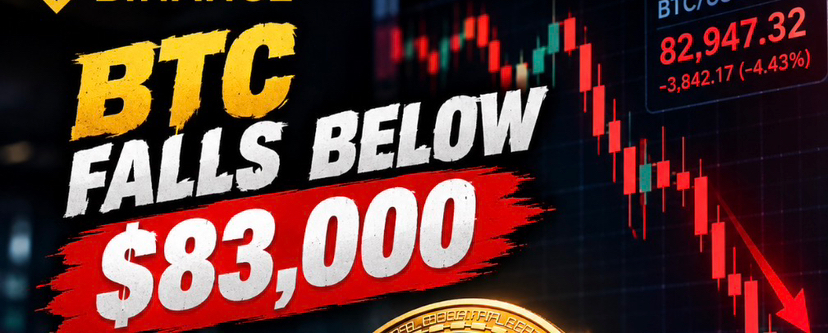
🚨 BTC DROPS BELOW 📉✅Bitcoin is facing fresh selling pressure as $BTC falls below the level. The market is watching closely to see whether buyers step in and defend this zone or if more downside follows.
Volatility is rising, and the next few moves could be important for the broader crypto market. 👀
Stay focused, manage risk, and watch the key support levels before making any move. ⚡
{future}(BTCUSDT)
#BTC #bitcoin #BTCFallsBelow$83000
🚨 BTC DROPS BELOW 📉✅
Bitcoin is facing fresh selling pressure as $BTC falls below the level. The market is watching closely to see whether buyers step in and defend this zone or if more downside follows.
Volatility is rising, and the next few moves could be important for the broader crypto market. 👀
Stay focused, manage risk, and watch the key support levels before making any move. ⚡
#BTC #bitcoin #BTCFallsBelow$83000
Volatility is rising, and the next few moves could be important for the broader crypto market. 👀
Stay focused, manage risk, and watch the key support levels before making any move. ⚡
#BTC #bitcoin #BTCFallsBelow$83000
102
·
--
Падение
$BTC just lost $83k.
Currently around $83.0k–$83.2k after dipping to the high $82.7ks. Down 1.6% today.
Last week we pumped to $87k, now the structure is starting to look weak. Looks like sellers are taking control.
Anyone shorting this? #BTCFallsBelow$83000
{future}(BTCUSDT)
$BTC just lost $83k.
Currently around $83.0k–$83.2k after dipping to the high $82.7ks. Down 1.6% today.
Last week we pumped to $87k, now the structure is starting to look weak. Looks like sellers are taking control.
Anyone shorting this? #BTCFallsBelow$83000
Currently around $83.0k–$83.2k after dipping to the high $82.7ks. Down 1.6% today.
Last week we pumped to $87k, now the structure is starting to look weak. Looks like sellers are taking control.
Anyone shorting this? #BTCFallsBelow$83000
1
48

·
--
🚨 **BITCOIN JUST LOST $83,000! 📉**
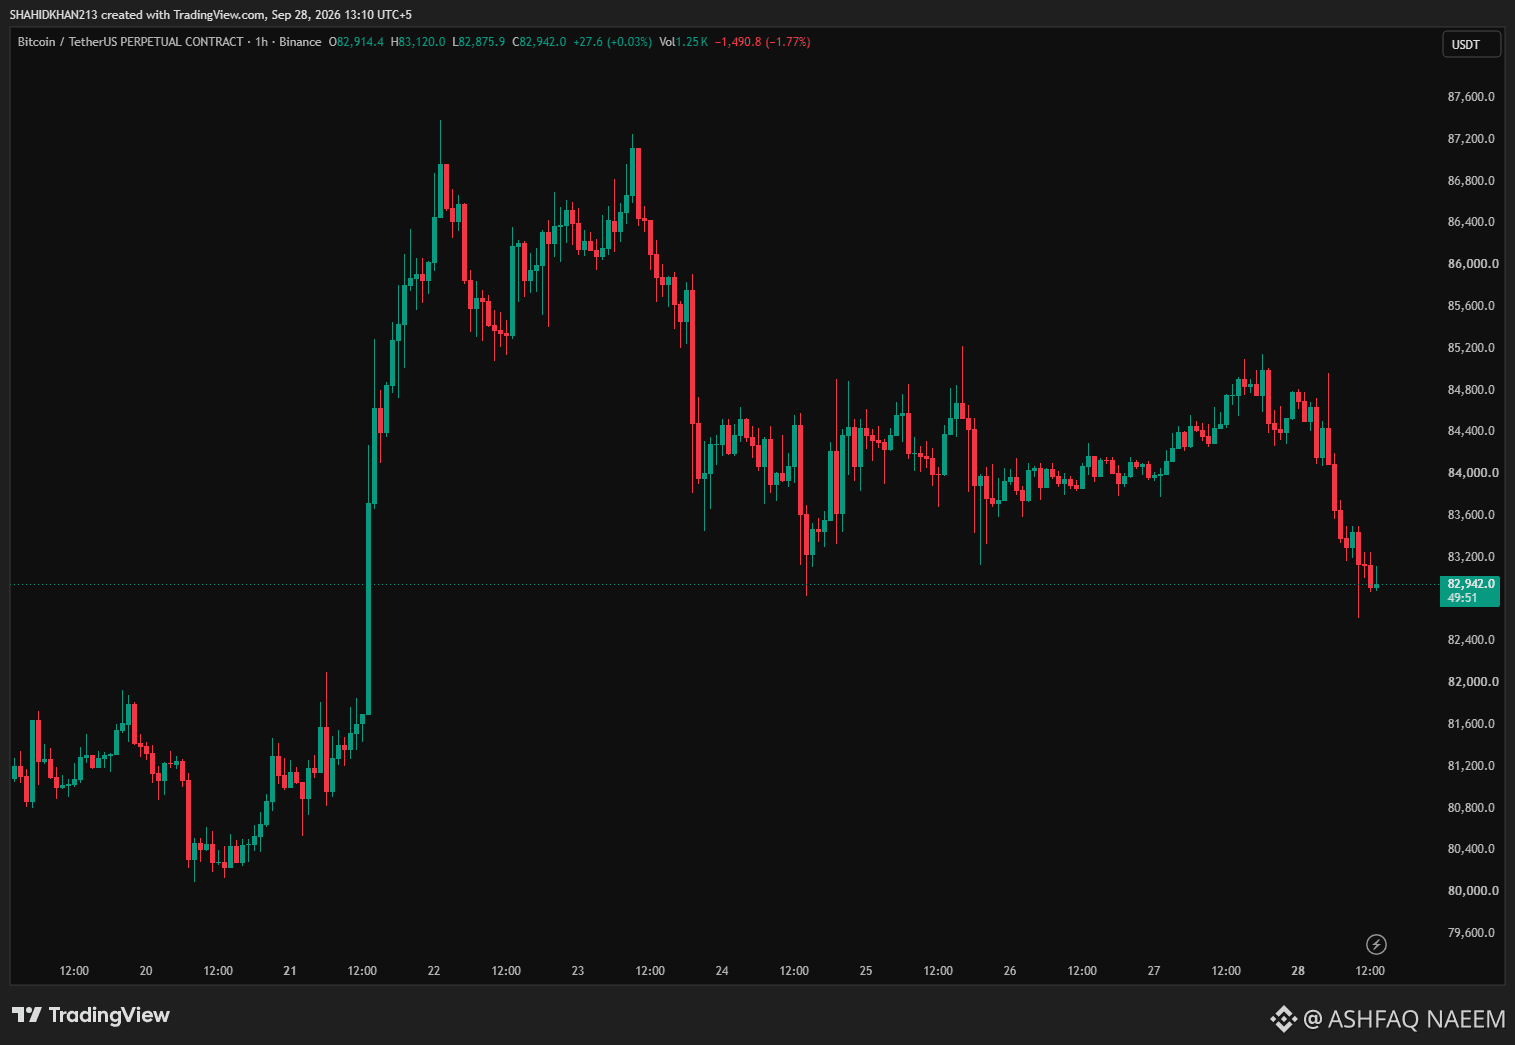
$BTC has slipped below the **$83K level**, putting short-term support under pressure. Binance data had BTC around $83,982 earlier today, while later market data showed it briefly trading below $83K.
⚠️ **Key levels to watch:**
🔴 Resistance: **$84K–$85K**
🟢 Support: **$82K**
🚨 Next major support: **$80K**
The move comes after BTC recently traded above $87K, with profit-taking, elevated yields and a stronger dollar adding pressure.
**$82K holds — or deeper correction? 👀**
NFA. DYOR.
#BTCFallsBelow$83000
#BTC $BTC
{future}(BTCUSDT)
🚨 **BITCOIN JUST LOST $83,000! 📉**
$BTC has slipped below the **$83K level**, putting short-term support under pressure. Binance data had BTC around $83,982 earlier today, while later market data showed it briefly trading below $83K.
⚠️ **Key levels to watch:**
🔴 Resistance: **$84K–$85K**
🟢 Support: **$82K**
🚨 Next major support: **$80K**
The move comes after BTC recently traded above $87K, with profit-taking, elevated yields and a stronger dollar adding pressure.
**$82K holds — or deeper correction? 👀**
NFA. DYOR.
#BTCFallsBelow$83000
#BTC $BTC
$BTC has slipped below the **$83K level**, putting short-term support under pressure. Binance data had BTC around $83,982 earlier today, while later market data showed it briefly trading below $83K.
⚠️ **Key levels to watch:**
🔴 Resistance: **$84K–$85K**
🟢 Support: **$82K**
🚨 Next major support: **$80K**
The move comes after BTC recently traded above $87K, with profit-taking, elevated yields and a stronger dollar adding pressure.
**$82K holds — or deeper correction? 👀**
NFA. DYOR.
#BTCFallsBelow$83000
#BTC $BTC
95

·
--
Рост
#BTCFallsBelow$83000 📊 Bitcoin Price Update BTC Tests Support Levels Below $83,000
The leading cryptocurrency has seen a notable price adjustment, dipping under the $83,000 mark. Here is a clear, objective breakdown of what this move means for the broader digital asset ecosystem.
📰 Core News
Bitcoin (BTC) has recently experienced a downward price movement, falling below the $83,000 threshold. Such price actions are a natural part of market cycles, often driven by a combination of short-term profit-taking, shifting macroeconomic data, or routine liquidity fluctuations across major exchanges.
📈 Market Impact
• Bitcoin (BTC) The asset is currently testing immediate support zones. Market participants are closely monitoring trading volume and order book depth to assess whether this level will hold or if further consolidation is required.
• Altcoin Market Historically, when BTC experiences heightened volatility, major altcoins may see amplified price swings. Traders often adjust risk parameters during these periods of market-wide re-evaluation.
• Overall Sentiment Periodic corrections are a healthy mechanism in any financial market. They can help reset overbought technical indicators, potentially paving the way for more sustainable, long-term price discovery.
💬 Join the Discussion
How do you view this current price adjustment: as a healthy market correction or a signal of broader macroeconomic headwinds? Share your objective analysis in the comments below! 👇
#Bitcoin #BTC #CryptoMarket #MarketAnalysis #BinanceSquare
This is for educational purposes only. Not Financial Advice (NFA). Always Do Your Own Research (DYOR).
$QNT $AUDIO $ONE
{future}(ONEUSDT)
{spot}(AUDIOUSDT)
{future}(QNTUSDT)
#BTCFallsBelow$83000 📊 Bitcoin Price Update BTC Tests Support Levels Below $83,000
The leading cryptocurrency has seen a notable price adjustment, dipping under the $83,000 mark. Here is a clear, objective breakdown of what this move means for the broader digital asset ecosystem.
📰 Core News
Bitcoin (BTC) has recently experienced a downward price movement, falling below the $83,000 threshold. Such price actions are a natural part of market cycles, often driven by a combination of short-term profit-taking, shifting macroeconomic data, or routine liquidity fluctuations across major exchanges.
📈 Market Impact
• Bitcoin (BTC) The asset is currently testing immediate support zones. Market participants are closely monitoring trading volume and order book depth to assess whether this level will hold or if further consolidation is required.
• Altcoin Market Historically, when BTC experiences heightened volatility, major altcoins may see amplified price swings. Traders often adjust risk parameters during these periods of market-wide re-evaluation.
• Overall Sentiment Periodic corrections are a healthy mechanism in any financial market. They can help reset overbought technical indicators, potentially paving the way for more sustainable, long-term price discovery.
💬 Join the Discussion
How do you view this current price adjustment: as a healthy market correction or a signal of broader macroeconomic headwinds? Share your objective analysis in the comments below! 👇
#Bitcoin #BTC #CryptoMarket #MarketAnalysis #BinanceSquare
This is for educational purposes only. Not Financial Advice (NFA). Always Do Your Own Research (DYOR).
$QNT $AUDIO $ONE
The leading cryptocurrency has seen a notable price adjustment, dipping under the $83,000 mark. Here is a clear, objective breakdown of what this move means for the broader digital asset ecosystem.
📰 Core News
Bitcoin (BTC) has recently experienced a downward price movement, falling below the $83,000 threshold. Such price actions are a natural part of market cycles, often driven by a combination of short-term profit-taking, shifting macroeconomic data, or routine liquidity fluctuations across major exchanges.
📈 Market Impact
• Bitcoin (BTC) The asset is currently testing immediate support zones. Market participants are closely monitoring trading volume and order book depth to assess whether this level will hold or if further consolidation is required.
• Altcoin Market Historically, when BTC experiences heightened volatility, major altcoins may see amplified price swings. Traders often adjust risk parameters during these periods of market-wide re-evaluation.
• Overall Sentiment Periodic corrections are a healthy mechanism in any financial market. They can help reset overbought technical indicators, potentially paving the way for more sustainable, long-term price discovery.
💬 Join the Discussion
How do you view this current price adjustment: as a healthy market correction or a signal of broader macroeconomic headwinds? Share your objective analysis in the comments below! 👇
#Bitcoin #BTC #CryptoMarket #MarketAnalysis #BinanceSquare
This is for educational purposes only. Not Financial Advice (NFA). Always Do Your Own Research (DYOR).
$QNT $AUDIO $ONE

245
Войдите, чтобы посмотреть больше материала
Присоединяйтесь к пользователям криптовалют по всему миру на Binance Square
⚡️ Получайте новейшую и полезную информацию о криптоактивах.
💬 Нам доверяет крупнейшая в мире криптобиржа.
👍 Получите достоверные аналитические данные от верифицированных создателей контента.
Эл. почта/номер телефона
В тренде
1
#BinanceKZ
Просмотров: 8,820
50 обсуждают
2
#ChainlinkLaunchesCCIP2WithEnterpriseVerification
Просмотров: 705
126 обсуждают
3
#GoldFallsTo$4144
Просмотров: 2,003
67 обсуждают
4
#QNTFallsOver40%FromMorningHigh
Просмотров: 19,714
579 обсуждают
5
#KospiFalls2.7%SamsungSKHynixDropOver5%
Просмотров: 3,449
244 обсуждают
6
#BitgetCEOConfirms$388MStolenInHack
Просмотров: 1,211
28 обсуждают
7
#BTCFallsBelow$83000
Просмотров: 13,521
115 обсуждают
8
#BitgetDetailsSecurityIncidentTimeline
Просмотров: 12,689
398 обсуждают
9
#BitcoinSpotETFs$2.39BWeeklyNetInflow
Просмотров: 5,498
26 обсуждают
10
#FedProposesPaymentStablecoinRules
Просмотров: 41,828
759 обсуждают